

Abstract
Background.
Epigenetic clocks estimate chronologic age using methylation levels at specific loci. We tested the hypothesis that accelerated epigenetic aging is associated with abnormal values in a range of clinical, imaging, and laboratory characteristics.
Methods.
The Project Baseline Health Study recruited 2,502 participants, including 1,661 with epigenetic age estimates from the Horvath pan-tissue clock. We classified individuals with extreme values as having epigenetic age acceleration (EAA) or epigenetic age deceleration (EAD). A subset of participants with longitudinal methylation profiling was categorized as accelerated vs. non-accelerated. Using principal components analysis, we created phenoclusters using 122 phenotypic variables and compared individuals with EAA vs. EAD, and at one year of follow-up, using logistic regression models adjusted for sex (false discovery rate [q] <0.10); in secondary exploratory analyses, we tested individual clinical variables.
Results.
The EAA (n=188) and EAD (n=195) groups were identified as having epigenetic age acceleration estimates ≥5 years or ≤−5 years, respectively. In primary analyses, individuals with EAA had higher values for phenoclusters summarizing lung function and lipids, and lower values for a phenocluster representing physical function. In secondary analyses of individual variables, neutrophils, body mass index, and waist circumference were significantly higher in individuals with EAA (q<0.10). No phenoclusters were significantly different between participants with accelerated (n=148) vs. non-accelerated (n=112) longitudinal aging.
Conclusions.
We report multiple cardiometabolic, hematologic, and physical function features characterizing individuals with EAA. These highlight factors that may mediate the adverse effects of aging and identify potential targets for study of mitigation of these effects.
Clinical Trial Registration.
https://clinicaltrials.gov/, identifier: NCT03154346
Keywords: aging, epigenetic age, genetic epigenesis, cardiovascular disease, health outcomes
Introduction
DNA methylation (or DNAm) is an epigenetic mechanism used by mammalian cells to regulate gene expression through silencing of gene sequences1, 2. DNAm is an important regulatory mechanism for processes such as X-inactivation in females and cell differentiation. Over the last decade, studies have shown an association between DNAm and the aging process3–7. Specifically, DNAm clocks, or epigenetic clocks, are mathematical models that use DNAm levels at particular cytosine-phosphate-guanine (CpG) dinucleotides to estimate age; a variety of such clocks, including the Horvath clock8, have been well-validated9. Epigenetic age acceleration (EAA) describes the phenomenon in which an individual’s epigenetic age, calculated by epigenetic clocks, is greater than expected based on his or her chronologic age. Interestingly, while this epigenetic age (or “biologic age”) is highly correlated with chronologic age, epigenetic age can vary widely across individuals with the same chronologic age. Identifying the underlying differences between chronologic age and epigenetic age is critical to understanding pathology associated with adverse aging.
The discordance between chronologic and epigenetic age has morbidity and mortality implications. Within the realm of modifiable risk factors, EAA has been associated with environmental exposures10, smoking and education11, and BMI12. At a disease level, EAA has been associated with lung cancer13, cardiovascular heart disease risk factors14, and neuronal white matter intensity15. Importantly, EAA has been associated with mortality, including cardiovascular mortality16 and all-cause mortality16, 17.
While many studies have demonstrated physiologic and pathologic relationships between clinical data and EAA, few have integrated these data across multiple biologic systems in the context of a contemporary “big data” approach to provide a more holistic analysis of adverse aging. We leveraged the Project Baseline Health Study (PBHS), which used a deep clinical phenotyping approach to map human health and disease in a contemporary context, to understand the relationships between a wide variety of established and novel clinical factors and EAA.
Methods
The deidentified PBHS data corresponding to this study are available upon request for the purpose of examining its reproducibility. Requests are subject to approval by PBHS governance. This study was approved by the Duke University Institutional Review Board, and all participants were appropriately consented for use of biospecimens and data. The full methods are available in the Supplemental Material.
Results
Baseline Characteristics of the Study Population
Among the 1,719 PBHS participants with data available for the methylation assays, 58 who were <20 or >80 years of age were excluded to restrict the analysis to ages expected to have a linear relationship between epigenetic and chronologic age. Of the remaining 1,661 participants, 47.7% were male; 61.7% were self-reported White; 16.9% were self-reported Black; and the mean age (SD) was 48.2 years (16.1) (Table 1). A high prevalence of disease risk factors was observed, reflecting 60% of the overall PBHS cohort who were recruited based on a high risk for cardiovascular disease or cancer. This subset was similar to the overall PBHS cohort (N=2,502) across demographics and risk factors (Supplemental Table 2).
Table 1.
Enrollment (baseline) characteristics of the study population
| n=1661 | |
|---|---|
|
| |
| Enrollment site (n, %) | |
| CHLI | 387 (23.3) |
| Durham | 351 (21.1) |
| Kannapolis | 361 (21.7) |
| Stanford | 562 (33.8) |
| Age* (mean (SD)) | 48.2 (16.1) |
| Age* (n, %) | |
| ≤45 | 739 (44.5) |
| 46–55 | 316 (19.0) |
| 56–65 | 302 (18.2) |
| >65 | 304 (18.3) |
| Female (n, %) | 869 (52.3) |
| Self-reported race (n, %) | |
| Asian | 189 (11.4) |
| Black | 281 (16.9) |
| Other | 166 (10.0) |
| White | 1025 (61.7) |
| Current smoker (n, %) | 193 (11.6) |
| BMI (mean (SD)) | 28.6 (7.0) |
| History of hypertension (n, %) | 423 (25.5) |
| History of hyperlipidemia (n, %) | 307 (18.5) |
| Diabetes (n, %) | |
| Diabetes | 242 (14.6) |
| Prediabetes | 325 (19.6) |
| No diabetes | 1094 (65.9) |
| History of cancer (n %) | 194 (11.7) |
| High-risk CVD cohort (n, %) | 306 (18.4) |
| High-risk lung cancer cohort (n, %) | 128 (7.7) |
| High-risk breast/ovarian cancer cohort (n, %) | 213 (24.5) |
Chronologic age based on date of birth
BMI, body mass index; CVD, cardiovascular disease.
Epigenetic Age and EAA
Of the 1,661 PBHS individuals with methylation data at enrollment, 195 (11.7%) showed epigenetic age deceleration (EAD, i.e., residuals from −14.9 to −5.0 years) while 188 (11.3%) had epigenetic age acceleration (EAA, i.e., 5.0 to 17.3 years). Biologic age and chronologic age were strongly correlated (r=0.95, p<10−16) (Figure 1A). Because our measure of difference between biologic and chronologic age was based on regression residuals, its mean was zero by definition; in this sample, it was normally distributed with a median of 0.05 and an SD of 4.2 (Figure 1B). EAA was highly associated with sex: 61% of individuals with EAA were male compared with 39% of individuals with EAD (p=4×10⁻⁵).
Figure 1A.
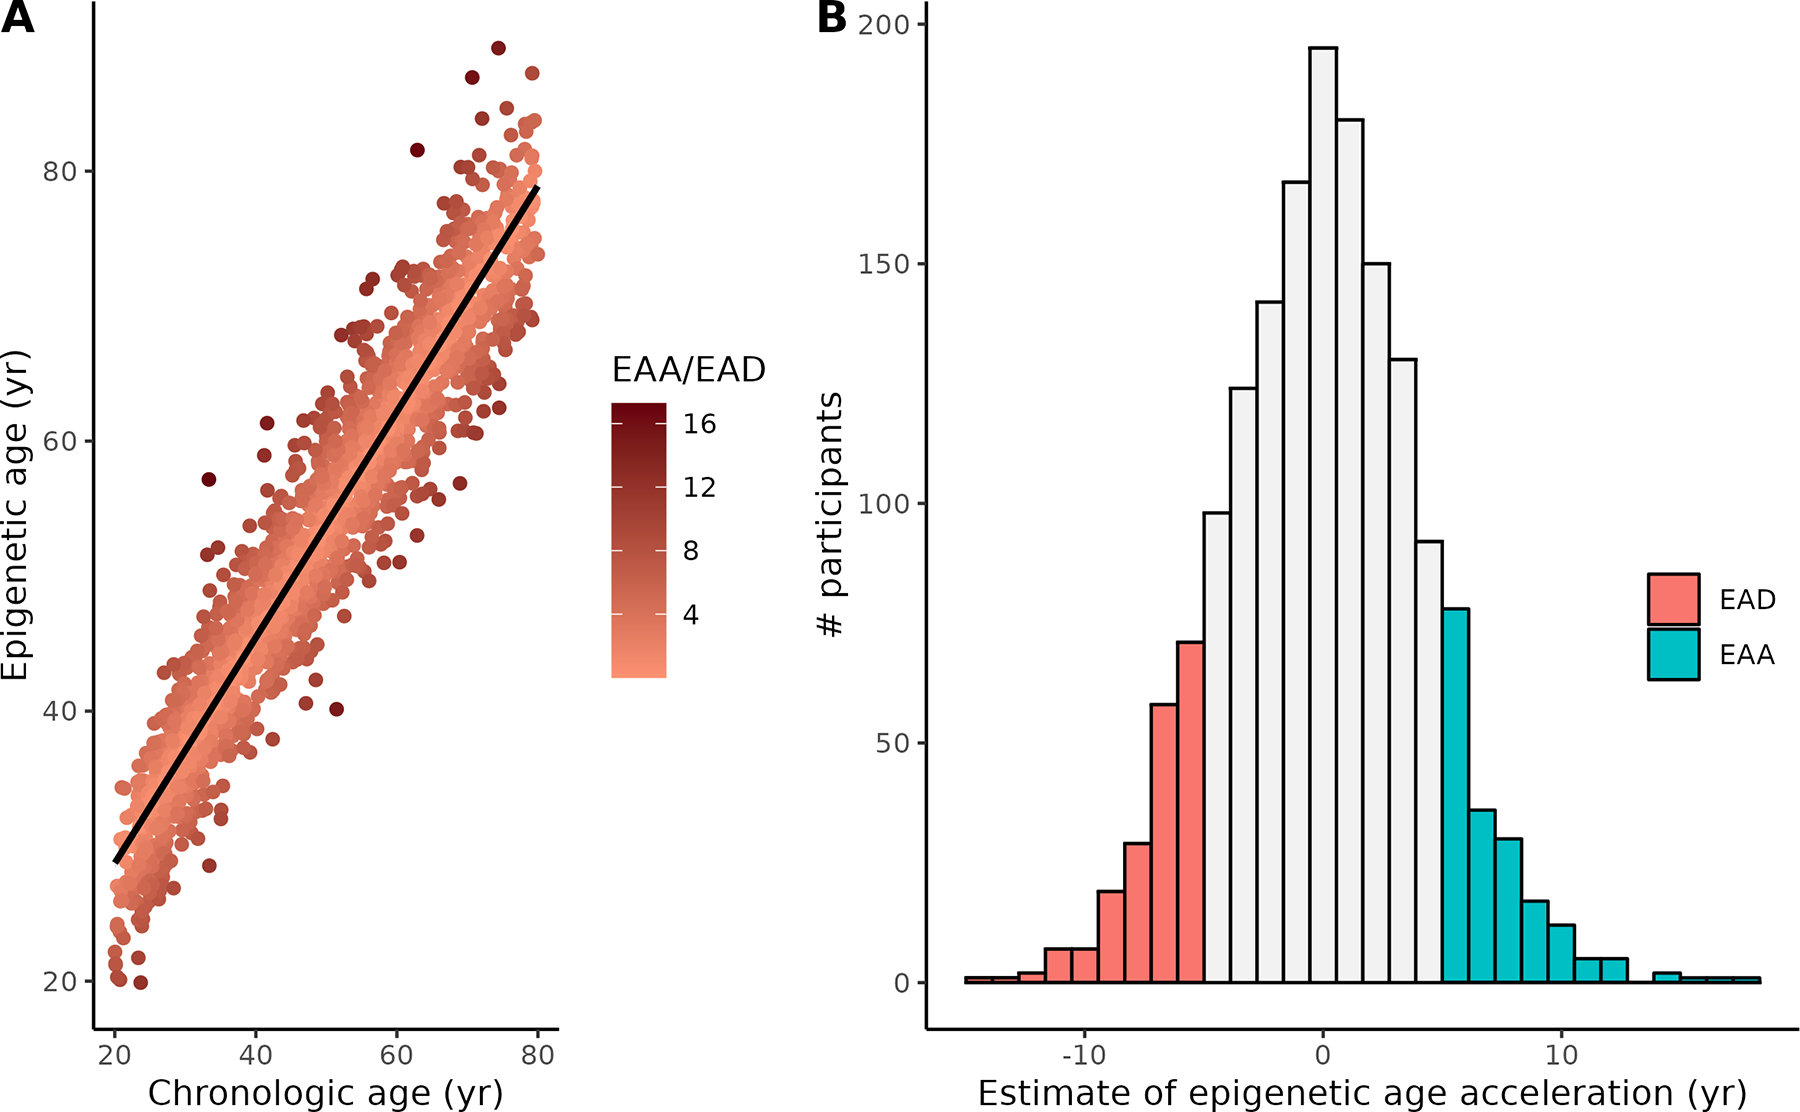
Calculated Horvath epigenetic age vs. chronologic age at enrollment in PBHS participants. Darker colors reflect larger absolute estimates of epigenetic age acceleration (EAA, above the regression line) or epigenetic age deceleration (EAD, below the regression line). B. Distribution of epigenetic age acceleration estimates (years) in all participants. Colored sections represent participants defined as EAA or EAD and included in the analysis.
Principal Components Analysis (PCA) Phenocluster Factors and EAA
Unsupervised PCA identified 33 orthogonal factors with an eigenvalue >1, each of which represents a set of correlated clinical variables. Each PCA factor, or phenocluster, is a weighted sum of each of the 109 clinical variables with sufficient data for inclusion in PCA; Supplemental Table 3 presents a summary of these phenoclusters, the clinical variables with an absolute value loading >0.4 in each, and the percentage of the variance explained by each phenocluster. The full set of loadings of all variables on all phenoclusters, not restricted to those with high loadings, are given in Supplemental Table 4. Bivariate plots of the relationship between each PCA factor and EAA/EAD estimates are included in Supplemental Figure 1.
In logistic regression analyses, three factors were significantly associated with EAA vs. EAD after controlling the FDR at q<0.10 (Table 2). Factor 1 (OR=0.73 for EAA, 95% CI=[0.59, 0.89], p=0.0025, q=0.048) was composed of variables related to physical function (sit/rise score, leg balance, 6-minute walk distance [6MWD]) with negative loads for measures of obesity (BMI, waist circumference). These results suggest that individuals with EAA have adverse functional measures and relatedly, higher BMI and waist circumference. Factor 2 (OR for EAA=1.60, 95% CI=[1.18, 2.20], p=0.0029, q=0.048) was composed of variables related to exercise and pulmonary function, with positive loadings for pulmonary function tests (PFTs) (forced vital capacity [FVC], carbon monoxide diffusing capacity [DLCO], and forced expiratory volume [FEV1]), grip strength, hemoglobin, hematocrit, absolute red blood cells, 6MWD, and sex. Finally, Factor 12 (OR for EAA=1.32, 95% CI=[1.07, 1.62], p=0.0091, q=0.0997) contains total cholesterol and low-density lipoprotein (LDL), suggesting that individuals with EAA are more likely to have worse lipids. For each of these factors, we included an interaction term in the model to test for differential associations in males and females; none of the factors had significant interactions with sex. We also examined sex-stratified models, which showed consistent directions of effect for males and females for all three factors (Supplemental Table 5).
Table 2.
Principal components analysis phenotype clusters significantly associated with EAA (FDR q-value <0.1)
| Factor | Description | Odds ratio (95% CI) | p | q |
|---|---|---|---|---|
|
| ||||
| 1 | Sit/rise score, mean leg balance, 6-minute walk distance, body mass index (−), waist circumference (−) | 0.73 (0.59, 0.89) | 0.0025 | 0.048 |
| 2 | Pulmonary function tests (forced vital capacity, carbon monoxide diffusing capacity [DLCO], forced expiratory volume), grip strength, hemoglobin, hematocrit, red blood cells (absolute), 6-minute walk distance, sex | 1.60 (1.18, 2.20) | 0.0029 | 0.048 |
| 12 | Total cholesterol, low-density lipoprotein | 1.32 (1.07, 1.62) | 0.0091 | 0.0997 |
Odds ratios (ORs) from a logistic regression model adjusted for sex; ORs >1 indicate an increase in EAA with an increase in the factor; ORs <1 indicate a decrease in EAA with an increase in the factor. Components of each factor with absolute loadings <0.4 are shown; variables designated “(−)” are negatively loaded on the factors while all others are positively loaded.
CI, confidence interval; EAA, epigenetic age acceleration; FDR, false discovery rate
Although Factor 7 does not meet significance after adjustment for multiple tests, we note that it was nominally associated with EAA (OR=0.82, 95% CI=[0.67, 0.99], p=0.04, q=0.3) and is composed of variables related to ocular health, including retinal thickness measurements and total macular volume, suggesting that individuals with high EAA may have lower ocular function measures. No other PCA factors were nominally associated with EAA.
Association Between Individual Clinical Variables and EAA
In exploratory secondary comparisons of individual clinical variables, we found that a wide range of clinical parameters were associated with EAA: BMI, waist circumference, and total neutrophils displayed the most significant association with EAA vs. EAD (q<0.1), but a range of other individual variables were nominally associated (p<0.05) (Table 3). Given the wide array of results in this exploratory analysis, the subsequent results are presented by overall organ system category, including cardiometabolic, hematologic, and renal traits in addition to digital health measures and physical function markers.
Table 3.
Individual laboratory, clinical, and imaging results nominally associated with EAA (p<0.05)
| EAD† | EAA† | Odds ratio (95% CI) | p | |
|---|---|---|---|---|
|
| ||||
| Laboratory | ||||
|
| ||||
| Triglycerides (mg/dl) | 128.3 (83.8) | 158.3 (122.8) | 1.07 (1.01, 1.13) ‡ | 0.02 |
| High-density lipoprotein (mg/dl) | 59.7 (18.6) | 53.4 (17.0) | 0.88 (0.77, 0.99) § | 0.04 |
| Total neutrophils (k/mcl) | 3.7 (1.3) | 4.1 (1.6) | 1.26 (1.09, 1.47) | 0.002* |
| Total neutrophils (% WBC) | 58.8 (9.3) | 60.6 (10.1) | 1.02 (1, 1.04) | 0.05 |
| Neutrophil:lymphocyte ratio (k/mcL) | 2.1 (1.0) | 2.4 (1.2) | 1.21 (1, 1.48) | 0.05 |
| White blood cell count | 6.1 (1.7) | 6.6 (2.0) | 1.18 (1.05, 1.33) | 0.005 |
| Albumin (g/dL) | 4.43 (0.30) | 4.39 (0.30) | 0.42 (0.20, 0.87) | 0.02 |
| Glomerular filtration rate (mL/min/1.73 m2) based on MDRD equation | 90.3 (23.0) | 85.3 (19.6) | 0.989 (0.979, 0.999) | 0.03 |
| Uric acid | 5.0 (1.2) | 5.5 (1.4) | 1.29 (1.08, 1.54) | 0.005 |
|
| ||||
| Clinical | ||||
|
| ||||
| History of hypertension, n (%) | 52 (26.7) | 70 (37.2) | 1.7 (1.09, 2.67) | 0.02 |
| Body mass index | 27.8 (6.3) | 30.7 (8.1) | 1.06 (1.03, 1.1) | 0.0001* |
| Waist circumference (cm) | 91.3 (15.3) | 99.2 (18.7) | 1.02 (1.01, 1.04) | 0.0002* |
| Avg daily number of steps in first 30 days | 8558 (3674) | 7786 (3599) | 0.91 (0.85, 0.98) ‖ | 0.009 |
| Hand-grip strength | 72.5 (23.0) | 84.5 (25.9) | 1.014 (1.001, 1.026) | 0.03 |
| Selection for high-risk lung cancer cohort, n (%) | 13 (6.7) | 28 (14.9) | 2.58 (1.3, 5.4) | 0.009 |
| Selection for high-risk CVD cohort, n (%) | 34 (17.4) | 51 (27.1) | 2.02 (1.22, 3.39) | 0.007 |
|
| ||||
| Imaging | ||||
|
| ||||
| Average RNFL thickness (μm) | 93.1 (11.8) | 89.8 (12.6) | 0.979 (0.961, 0.996) | 0.02 |
| RNFL superior quad thickness (μm) | 115.3 (18.3) | 111.3 (19.4) | 0.988 (0.976, 0.999) | 0.04 |
Except where indicated, the results are expressed as the mean (SD). Odds ratios (ORs) from a logistic regression model adjusted for sex; ORs >1 indicate an increase in epigenetic age acceleration with an increase in the variable; ORs <1 indicate a decrease in epigenetic age acceleration with an increase in the variable.
Variables with false discovery rate (FDR) q-value< 0.1
Age acceleration categories are determined using ± 5-year cutoffs.
OR and confidence interval (CI) are for an increase of 25 mg/dl.
OR and CI are for an increase of 10 mg/dl.
OR and CI are for an increase of 1000 steps/day.
CVD, cardiovascular disease; MDRD, Modification of Diet in Renal Disease; RNFL, retinal nerve fiber layer, WBC, white blood cell.
In the cardiometabolic trait category, in addition to the significant association with BMI (OR=1.06, 95% CI=[1.03,1.1], p=8×10⁻⁵, q=0.01) and waist circumference (OR=1.02, 95% CI=[1.01,1.04], p=2×10⁻⁴, q=0.02), triglycerides, high-density lipoprotein (HDL), and history of hypertension were nominally associated with EAA vs. EAD (OR=1.07, 95% CI=[1.01,1.13], p=0.02 for a 25 mg/dl increase in triglycerides, OR=0.88 [0.77,0.99], p=0.04 for a 10 mg/dl increase in HDL, and OR= 1.7, 95% CI=[1.09, 2.67], p=0.02, respectively). Specifically, individuals with EAA had higher BMI (difference of 2.9 kg/cm2, standard error SE=0.8), waist circumference (difference of 7.9 cm, SE=1.8) and triglycerides (difference of 30.0 mg/dl, SE=10.8) and lower HDL (difference of 6.4 mg/dl, SE=1.8). These individual variable results support results from the primary analyses of PCA Factor 1 (physical function) and Factor 12 (lipids).
In the hematologic trait category, neutrophils displayed a significant association with EAA vs. EAD (OR=1.26, 95% CI=[1.09,1.47], p=0.002, q=0.09) after FDR adjustment. Other individual variables in this category that were nominally associated included white blood cell (WBC) count and neutrophil-to-lymphocyte ratio (NLR) (OR=1.18, 95% CI=[1.05, 1.33], p=0.005 and OR=1.21, 95% CI=[1.00, 1.48], p=0.05, respectively).
In the renal trait category, uric acid displayed the most significant association with EAA (OR=1.29, 95% CI=[1.08,1.54], p=0.005), as individuals with high EAA had nominally higher mean uric acid levels compared with individuals with EAD. Albumin and estimated glomerular filtration rate (eGFR) showed suggestive associations with EAA (OR=0.42, 95% CI=[0.20, 0.87], p=0.02 and OR=0.989, 95% CI=[0.979,0.999], p=0.03, respectively).
With regards to digital health parameters and physical function, the average daily step count in the first 30 days was associated with EAA (OR=0.91, 95% CI=[0.85,0.98], p=0.009 for a 1,000 step/day increase), with lower mean step counts in individuals with EAA (average step count 772 steps fewer [SE=421] than that of participants with EAD). In addition, grip strength was nominally associated with EAA (OR=1.014, 95% CI=[1.001, 1.026], p=0.03). Participants with EAA had a mean grip strength 12 lbs higher (SE=2.6) than that of individuals with EAD.
The PBHS study was enriched for individuals considered to be high-risk for lung cancer, breast cancer, and cardiovascular disease. Belonging to the high-risk lung cancer category or the high-risk cardiovascular disease cohort was associated with high vs. EAD (OR=2.58, 95% CI=[1.30, 5.40], p=0.009, and OR=2.02, 95% CI=[1.22, 3.39], p=0.007, respectively). Both the average retinal nerve fiber layer (RNFL) thickness and superior quadrant RNFL thickness (measures of retinal ganglion cell axonal loss), which decrease in diseased states (i.e., glaucoma 18), were lower by an average of 3.29 μm (SE=1.3) and 4.02 μm (SE=2.0) in participants with EAA (OR=0.979, 95% CI=[0.961, 0.996], p=0.02; OR=0.988, 95% CI=[0.976, 0.999], p=0.04, respectively).
Longitudinal Epigenetic Age Changes
A subset of 260 individuals had both enrollment methylation data and a repeat methylation array at year 1 of follow-up. In this subset, the range of difference between change in epigenetic age and one year (chronologic difference in age) was −6.4 to 12.7 years: 148 individuals had a difference of >1 year (accelerated aging), whereas 112 individuals had a difference of <1 year (non-accelerated aging). No PCA factors were significantly associated with accelerated aging. In the secondary individual variable analysis, few clinical variables from enrollment were nominally associated with accelerated aging (Table 4): diastolic blood pressure (OR=1.03, 95% CI=[1, 1.05], p=0.04), blood glucose (OR=1.01, 95% CI=[1, 1.01], p=0.04), mean corpuscular hemoglobin concentration (MCHC) (OR=0.61, 95% CI=[0.44, 0.84], p=0.003), and center subfield thickness (CST) (OR=0.987, 95% CI=[0.977, 0.997], p=0.01). Specifically, individuals with accelerated aging had higher mean diastolic blood pressure and blood glucose readings, and lower values for MCHC and CST, compared with individuals with non-accelerated aging.
Table 4.
Individual clinical variables nominally associated with accelerated aging (p<0.05)
| Clinical measure | Non-accelerated aging | Accelerated aging | Odds ratio (95% CI) | p |
|---|---|---|---|---|
|
| ||||
| Diastolic blood pressure (mmHg) | 78.0 (9.7) | 80.6 (10.7) | 1.03 (1.0, 1.05) | 0.04 |
| Blood glucose (mg/dl) | 107 (44) | 123 (67) | 1.01 (1.0, 1.01) | 0.04 |
| Mean corpuscular hemoglobin concentration (% RBC) | 33.0 (0.8) | 32.7 (0.9) | 0.61 (0.44, 0.84) | 0.003 |
| Center subfield thickness (center 1mm) | 263 (32) | 254 (25) | 0.99 (0.98, 1.0) | 0.01 |
Results are presented as mean (SD) for each measure. Odds ratios (ORs) from a logistic regression model adjusted for sex. ORs >1 indicate an increase in accelerated aging with an increase in the clinical measure; ORs <1 indicate a decrease in accelerated aging with an increase in the clinical measure.
No results have false discovery rate (FDR) q-value< 0.1.
CI, confidence interval; RBC, red blood cell.
Discussion
In one of the most comprehensive studies of clinical, imaging, and laboratory variables associated with epigenetic aging, we found that a wide array of cardiometabolic, physical function, and laboratory characteristics are associated with EAA. These results have implications for better understanding the risk factors and effects of accelerated biologic aging.
These findings support a growing body of literature that suggests that age acceleration is associated with a variety of cardiometabolic, hematologic, and renal pathologies19–24. Within the cardiometabolic context, several studies have shown a relationship between EAA and higher BMI12, 25, worse lipid function26, and a higher prevalence of hypertension27. Yet, few studies have integrated these associations to provide a multidimensional characterization of individuals with EAA.
In our primary analysis of factors created using unsupervised PCA, we found that EAA was most significantly associated with phenoclusters related to poor cardiometabolic risk factor health. Specifically, EAA was associated with phenoclusters characterized by BMI, waist circumference, total cholesterol and LDL (all higher in individuals with EAA than in individuals with EAD) along with physical function parameters (lower in individuals with EAA). This finding was bolstered by our exploratory analysis of individual clinical variables, in which many cardiometabolic traits were nominally associated with EAA. Specifically, we found that individuals with high EAA had higher BMI, higher triglycerides, lower HDL, a higher prevalence of hypertension, and a greater likelihood of being in the high-risk cardiovascular group than individuals with EAD. These relationships are consistent with the existing literature that suggests epigenetic involvement in metabolic diseases, such as hyperlipidemia18, 28, 29. More recently, del C. Gomez-Alonso et al. demonstrated through an epigenome-wide association study analysis that DNAm is intricately involved in lipid composition and concentrations along the lipid synthesis pathway30.
Our PCA phenocluster analysis also identified a significant association between Factor 2 (composed of hematologic markers, PFTs, and physical function parameters) and EAA. This phenocluster represents a clinically coherent relationship, with a cluster of hematologic markers of oxygen delivery (i.e., hemoglobin and hematocrit), pulmonary function parameters and markers of physical function (grip strength and 6MWD). However, the direction of individual variables represents a counterintuitive relationship between exercise-related markers and EAA, with hemoglobin, hematocrit, PFT parameters, and physical function parameters all higher in individuals with EAA, corroborated by analyses of individual variables. This is in contradistinction to prior studies that demonstrated that exercise can slow epigenetic aging25, 31. Our somewhat counterintuitive results from this phenocluster may be due to a complex relationship with sex (which had a high factor loading in the factor), although our results were all adjusted for sex, and post-hoc analyses showed no interaction between sex and this factor.
Exploratory secondary analyses of individual variables primarily corroborated results for PCA factors significantly associated with EAA after adjustment for multiple comparisons; however, these exploratory analyses also highlighted other complementary associations in hematologic, renal and ocular traits. For example, neutrophil count, neutrophil percentage, NLR, and WBC count were higher in individuals with EAA. Given that hematologic markers can approximate inflammation or stress in one’s body, the higher levels of hematologic markers in individuals with EAA could suggest that such individuals suffer from more chronic stress and inflammation than individuals with EAD. In addition, renal markers also displayed a potential relationship with epigenetic aging, consistent with and corroborating existing studies, which have linked kidney disease to biologic aging32, 33. While exploratory, our imaging analysis of ocular health measurements establishes, for the first time, a putative association between RNFL thickness and EAA. A decrease in ocular health measures has been associated with pathologies, including glaucoma18, 34, neuronal loss in multiple sclerosis35, and cognitive impairments in schizophrenia36.
Finally, the nominally significant results of our longitudinal analysis recapitulate some of the overarching results of this study and contribute to our understanding of epigenetic trends over time. This analysis extends the results of our initial methylation assay to include diastolic blood pressure and MCHC, specifically, as relevant cardiometabolic and hematologic parameters, respectively. These results also highlight the importance of CST as a potentially important signal of ocular function and are supported by the known association of CST with retinopathy severity37. Lastly, we showed that blood glucose may be an important factor in the longitudinal assessments of participants. Our data suggest a relationship between higher glucose and accelerated epigenetic aging and corroborates with our finding that BMI and lipids are related to epigenetic aging.
Epigenetic age in our analyses was calculated using the validated Horvath pan-tissue method8, which utilizes methylation levels at 353 CpGs across the genome, although other epigenetic biologic clocks have been developed. The underlying biology of genes nearest these CpG sites has been previously evaluated using Ingenuity Pathway Analysis8 and revealed significant networks that included the following functions: hematological system development, cell death and survival, cellular growth and proliferation, hematopoiesis, hepatocellular peroxisome proliferation, cellular development, and cardiovascular disease. These networks are consistent with the phenoclusters observed in our study, broadly reporting on key cellular functions. Some of the genes with the greatest contribution in this clock include CHST3, involved in extracellular matrix; TEX264, involved in reticulophagy and protein-DNA covalent cross-linking repair; and CCL7, involved in immunoregulatory and inflammatory processes, all processes relevant to the traits we have identified. In reviewing the GWAS catalogue (https://www.ebi.ac.uk/gwas/), eight of the top 20 most influential clock-related genes have variants associated with relevant traits (i.e., TEX264 is associated with BMI-adjusted waist circumference), suggesting that both genetic and epigenetic variation in these genes are concordantly relevant to biologic aging and disease processes.
The strengths of this study include the large number of clinical, laboratory, and imaging parameters analyzed and the study cohort with good racial, sex, and age distribution. Our primary analysis uses a dimension reduction approach to assess the association of weighted clusters of variables, which allows us to explore relationships between disparate variables in an unbiased fashion while maintaining FDR control at 10%. However, study limitations should be noted. Enrollment analyses were cross-sectional and as such, cause and effect relationships could not be assessed. Further, we were limited by a smaller sample size for the longitudinal cohort with only one year of follow-up; the lack of significant results may be due to the fact that the entire sample was divided into accelerated and non-accelerated aging groups, instead of selecting true extremes for comparison, as we did for the EAA vs EAD analysis. Finally, we did not adjust for multiple comparisons in the secondary analysis of individual variables, given the exploratory nature of this analysis vis-à-vis the analysis of the PCA factors and the desire to look at a broad array of clinical abnormalities in a relatively small sample. Although BMI, neutrophil count, and waist circumference do meet an FDR adjustment for multiple comparisons at the 10% threshold, the other individual variables discussed here should be considered as preliminary results for further study.
Conclusions
In the PBHS study, we found that individuals with EAA were more likely to have metabolic syndrome (a higher lipid profile, hypertension, obesity, a higher waist circumference), in addition to higher inflammatory markers, more abnormal renal markers, lower step counts, a higher risk of lung cancer and cardiovascular disease, and lower ocular markers compared with individuals who had EAD. Further work is needed to better understand the relationship between individuals with EAA vs EAD and, more importantly, how this variability changes over time. Such analysis may provide a framework for targeted interventional therapy to reverse pathological biologic aging.
Supplementary Material
Acknowledgments:
We would like to thank the participants of the PBHS study and acknowledge the dedication and commitment of researchers and study staff.
Sources of Funding:
The Baseline Health Study and this analysis were funded by Verily Life Sciences, San Francisco, CA.
Nonstandard Abbreviations and Acronyms
- 6MWD
6-minute walk distance
- ABI
ankle-brachial index
- BMI
body mass index
- CST
center subfield thickness
- DNAm
DNA methylation
- EAA
epigenetic age acceleration
- HDL
high-density lipoprotein
- LDL
low-density lipoprotein
- MCHC
mean corpuscular hemoglobin concentration
- NLR
neutrophil-to-lymphocyte ratio
- OCT
optical coherence tomography
- PBHS
Project Baseline Health Study
- PCA
principal component analysis
- PFT
pulmonary function test
- RNFL
retinal nerve fiber layer
- U.S
United States
- WBC
white blood cell
Footnotes
Disclosures: All authors acknowledge institutional research grants from Verily Life Sciences. FH received an institutional research grant from Actelion Ltd. within the last 2 years and an institutional research grant from Precordior Ltd. KM reports grants from Verily, Afferent, the American Heart Association (AHA), Cardiva Medical Inc, Gilead, Luitpold, Medtronic, Merck, Eidos, Ferring, Apple Inc, Sanifit, and St. Jude; grants and personal fees from Amgen, AstraZeneca, Bayer, CSL Behring, Johnson & Johnson, Novartis, and Sanofi; and personal fees from Anthos, Applied Therapeutics, Elsevier, Inova, Intermountain Health, Medscape, Mount Sinai, Mundi Pharma, Myokardia, Novo Nordisk, Otsuka, Portola, SmartMedics, and Theravance outside the submitted work. AH reports grants from Verily; grants and personal fees from AstraZeneca, Amgen, Bayer, Merck, and Novartis; and personal fees from Boston Scientific outside the submitted work. The other authors have no conflicts of interest to disclose.
Supplemental Material
References:
- 1.Beck S, Rakyan VK. The methylome: approaches for global DNA methylation profiling. Trends Genet. 2008;24(5):231–237. [DOI] [PubMed] [Google Scholar]
- 2.Holliday R, Pugh JE. DNA modification mechanisms and gene activity during development. Science. 1975;187(4173):226–232. [PubMed] [Google Scholar]
- 3.Horvath S, Zhang Y, Langfelder P, Kahn RS, Boks MP, van Eijk K, van den Berg LH, Ophoff RA. Aging effects on DNA methylation modules in human brain and blood tissue. Genome Biol. 2012;13(10):R97. [DOI] [PMC free article] [PubMed] [Google Scholar]
- 4.Garagnani P, Bacalini MG, Pirazzini C, Gori D, Giuliani C, Mari D, Di Blasio AM, Gentilini D, Vitale G, Collino S, et al. Methylation of ELOVL2 gene as a new epigenetic marker of age. Aging Cell. 2012;11(6):1132–1134. [DOI] [PubMed] [Google Scholar]
- 5.Johnson AA, Akman K, Calimport SR, Wuttke D, Stolzing A, de Magalhães JP. The role of DNA methylation in aging, rejuvenation, and age-related disease. Rejuvenation Res. 2012;15(5):483–494. [DOI] [PMC free article] [PubMed] [Google Scholar]
- 6.Teschendorff AE, Menon U, Gentry-Maharaj A, Ramus SJ, Weisenberger DJ, Shen H, Campan M, Noushmehr H, Bell CG, Maxwell AP, et al. Age-dependent DNA methylation of genes that are suppressed in stem cells is a hallmark of cancer. Genome Res. 2010;20(4):440–446. [DOI] [PMC free article] [PubMed] [Google Scholar]
- 7.Richardson B. Impact of aging on DNA methylation. Ageing Res Rev. 2003;2(3):245–261. [DOI] [PubMed] [Google Scholar]
- 8.Horvath S. DNA methylation age of human tissues and cell types. Genome Biol. 2013;14(10):R115. [DOI] [PMC free article] [PubMed] [Google Scholar]
- 9.Horvath S, Raj K. DNA methylation-based biomarkers and the epigenetic clock theory of ageing. Nat Rev Genet. 2018;19(6):371–384. [DOI] [PubMed] [Google Scholar]
- 10.Ward-Caviness CK, Nwanaji-Enwerem JC, Wolf K, Wahl S, Colicino E, Trevisi L, Kloog I, Just AC, Vokonas P, Cyrys J, et al. Long-term exposure to air pollution is associated with biological aging. Oncotarget. 2016;7(46):74510–74525. [DOI] [PMC free article] [PubMed] [Google Scholar]
- 11.Dugué PA, Bassett JK, Joo JE, Baglietto L, Jung CH, Wong EM, Fiorito G, Schmidt D, Makalic E, Li S, et al. Association of DNA Methylation-Based Biological Age With Health Risk Factors and Overall and Cause-Specific Mortality. Am J Epidemiol. 2018;187(3):529–538. [DOI] [PubMed] [Google Scholar]
- 12.Horvath S, Erhart W, Brosch M, Ammerpohl O, von Schönfels W, Ahrens M, Heits N, Bell JT, Tsai PC, Spector TD, et al. Obesity accelerates epigenetic aging of human liver. Proc Natl Acad Sci U S A. 2014;111(43):15538–15543. [DOI] [PMC free article] [PubMed] [Google Scholar]
- 13.Levine ME, Hosgood HD, Chen B, Absher D, Assimes T, Horvath S. DNA methylation age of blood predicts future onset of lung cancer in the women’s health initiative. Aging (Albany NY). 2015;7(9):690–700. [DOI] [PMC free article] [PubMed] [Google Scholar]
- 14.Horvath S, Gurven M, Levine ME, Trumble BC, Kaplan H, Allayee H, Ritz BR, Chen B, Lu AT, Rickabaugh TM, et al. An epigenetic clock analysis of race/ethnicity, sex, and coronary heart disease. Genome Biol. 2016;17(1):171. [DOI] [PMC free article] [PubMed] [Google Scholar]
- 15.Raina A, Zhao X, Grove ML, Bressler J, Gottesman RF, Guan W, Pankow JS, Boerwinkle E, Mosley TH, Fornage M. Cerebral white matter hyperintensities on MRI and acceleration of epigenetic aging: the atherosclerosis risk in communities study. Clin Epigenetics. 2017;9:21. [DOI] [PMC free article] [PubMed] [Google Scholar]
- 16.Perna L, Zhang Y, Mons U, Holleczek B, Saum KU, Brenner H. Epigenetic age acceleration predicts cancer, cardiovascular, and all-cause mortality in a German case cohort. Clin Epigenetics. 2016;8:64. [DOI] [PMC free article] [PubMed] [Google Scholar]
- 17.Weidner CI, Lin Q, Koch CM, Eisele L, Beier F, Ziegler P, Bauerschlag DO, Jöckel KH, Erbel R, Mühleisen TW, et al. Aging of blood can be tracked by DNA methylation changes at just three CpG sites. Genome Biol. 2014;15(2):R24. [DOI] [PMC free article] [PubMed] [Google Scholar]
- 18.Patel NB, Sullivan-Mee M, Harwerth RS. The relationship between retinal nerve fiber layer thickness and optic nerve head neuroretinal rim tissue in glaucoma. Invest Ophthalmol Vis Sci. 2014;55(10):6802–6816. [DOI] [PMC free article] [PubMed] [Google Scholar]
- 19.Ammous F, Zhao W, Ratliff SM, Mosley TH, Bielak LF, Zhou X, Peyser PA, Kardia SLR, Smith JA. Epigenetic age acceleration is associated with cardiometabolic risk factors and clinical cardiovascular disease risk scores in African Americans. Clin Epigenetics. 2021;13(1):55. [DOI] [PMC free article] [PubMed] [Google Scholar]
- 20.Chu AY, Tin A, Schlosser P, Ko YA, Qiu C, Yao C, Joehanes R, Grams ME, Liang L, Gluck CA, et al. Epigenome-wide association studies identify DNA methylation associated with kidney function. Nat Commun. 2017;8(1):1286. [DOI] [PMC free article] [PubMed] [Google Scholar]
- 21.Gao X, Colicino E, Shen J, Just AC, Nwanaji-Enwerem JC, Wang C, Coull B, Lin X, Vokonas P, Zheng Y, et al. Accelerated DNA methylation age and the use of antihypertensive medication among older adults. Aging (Albany NY). 2018;10(11):3210–3228. [DOI] [PMC free article] [PubMed] [Google Scholar]
- 22.Childebayeva A, Harman T, Weinstein J, Goodrich JM, Dolinoy DC, Day TA, Bigham AW, Brutsaert TD. DNA Methylation Changes Are Associated With an Incremental Ascent to High Altitude. Front Genet. 2019;10:1062. [DOI] [PMC free article] [PubMed] [Google Scholar]
- 23.Levine ME, Lu AT, Quach A, Chen BH, Assimes TL, Bandinelli S, Hou L, Baccarelli AA, Stewart JD, Li Y, et al. An epigenetic biomarker of aging for lifespan and healthspan. Aging (Albany NY). 2018;10(4):573–591. [DOI] [PMC free article] [PubMed] [Google Scholar]
- 24.Rönn T, Volkov P, Gillberg L, Kokosar M, Perfilyev A, Jacobsen AL, Jørgensen SW, Brøns C, Jansson PA, Eriksson KF, et al. Impact of age, BMI and HbA1c levels on the genome-wide DNA methylation and mRNA expression patterns in human adipose tissue and identification of epigenetic biomarkers in blood. Hum Mol Genet. 2015;24(13):3792–3813. [DOI] [PubMed] [Google Scholar]
- 25.Quach A, Levine ME, Tanaka T, Lu AT, Chen BH, Ferrucci L, Ritz B, Bandinelli S, Neuhouser ML, Beasley JM, et al. Epigenetic clock analysis of diet, exercise, education, and lifestyle factors. Aging (Albany NY). 2017;9(2):419–446. [DOI] [PMC free article] [PubMed] [Google Scholar]
- 26.Irvin MR, Aslibekyan S, Do A, Zhi D, Hidalgo B, Claas SA, Srinivasasainagendra V, Horvath S, Tiwari HK, Absher DM, et al. Metabolic and inflammatory biomarkers are associated with epigenetic aging acceleration estimates in the GOLDN study. Clin Epigenetics. 2018;10:56. [DOI] [PMC free article] [PubMed] [Google Scholar]
- 27.Kazmi N, Elliott HR, Burrows K, Tillin T, Hughes AD, Chaturvedi N, Gaunt TR, Relton CL. Associations between high blood pressure and DNA methylation. PLoS One. 2020;15(1):e0227728. [DOI] [PMC free article] [PubMed] [Google Scholar]
- 28.Pearce MS, McConnell JC, Potter C, Barrett LM, Parker L, Mathers JC, Relton CL. Global LINE-1 DNA methylation is associated with blood glycaemic and lipid profiles. Int J Epidemiol. 2012;41(1):210–217. [DOI] [PMC free article] [PubMed] [Google Scholar]
- 29.Turcot V, Tchernof A, Deshaies Y, Pérusse L, Bélisle A, Marceau S, Biron S, Lescelleur O, Biertho L, Vohl MC. LINE-1 methylation in visceral adipose tissue of severely obese individuals is associated with metabolic syndrome status and related phenotypes. Clin Epigenetics. 2012;4(1):10. [DOI] [PMC free article] [PubMed] [Google Scholar]
- 30.Gomez-Alonso MDC, Kretschmer A, Wilson R, Pfeiffer L, Karhunen V, Seppälä I, Zhang W, Mittelstraß K, Wahl S, Matias-Garcia PR, et al. DNA methylation and lipid metabolism: an EWAS of 226 metabolic measures. Clin Epigenetics. 2021;13(1):7. [DOI] [PMC free article] [PubMed] [Google Scholar]
- 31.Ferioli M, Zauli G, Maiorano P, Milani D, Mirandola P, Neri LM. Role of physical exercise in the regulation of epigenetic mechanisms in inflammation, cancer, neurodegenerative diseases, and aging process. J Cell Physiol. 2019;234(9):14852–14864. [DOI] [PubMed] [Google Scholar]
- 32.Matías-García PR, Ward-Caviness CK, Raffield LM, Gao X, Zhang Y, Wilson R, Gào X, Nano J, Bostom A, Colicino E, et al. DNAm-based signatures of accelerated aging and mortality in blood are associated with low renal function. Clin Epigenetics. 2021;13(1):121. [DOI] [PMC free article] [PubMed] [Google Scholar]
- 33.Stenvinkel P, Larsson TE. Chronic kidney disease: a clinical model of premature aging. Am J Kidney Dis. 2013;62(2):339–351. [DOI] [PubMed] [Google Scholar]
- 34.Leung CK. Diagnosing glaucoma progression with optical coherence tomography. Curr Opin Ophthalmol. 2014;25(2):104–111. [DOI] [PubMed] [Google Scholar]
- 35.Burkholder BM, Osborne B, Loguidice MJ, Bisker E, Frohman TC, Conger A, Ratchford JN, Warner C, Markowitz CE, Jacobs DA, et al. Macular volume determined by optical coherence tomography as a measure of neuronal loss in multiple sclerosis. Arch Neurol. 2009;66(11):1366–1372. [DOI] [PubMed] [Google Scholar]
- 36.Liu Y, Huang L, Tong Y, Chen J, Gao D, Yang F. Association of retinal nerve fiber abnormalities with serum CNTF and cognitive functions in schizophrenia patients. PeerJ. 2020;8:e9279. [DOI] [PMC free article] [PubMed] [Google Scholar]
- 37.Hannouche RZ, Avila MP, Isaac DL, Silva RS, Rassi AR. Correlation between central subfield thickness, visual acuity and structural changes in diabetic macular edema. Arq Bras Oftalmol. 2012;75(3):183–187. [DOI] [PubMed] [Google Scholar]
- 38.Arges K, Assimes T, Bajaj V, Balu S, Bashir MR, Beskow L, Blanco R, Califf R, Campbell P, Carin L, et al. The Project Baseline Health Study: a step towards a broader mission to map human health. NPJ Digit Med. 2020;3:84. [DOI] [PMC free article] [PubMed] [Google Scholar]
- 39.Fortin JP, Triche TJ Jr., Hansen KD. Preprocessing, normalization and integration of the Illumina HumanMethylationEPIC array with minfi. Bioinformatics. 2017;33(4):558–560. [DOI] [PMC free article] [PubMed] [Google Scholar]
- 40.Bell CG, Lowe R, Adams PD, Baccarelli AA, Beck S, Bell JT, Christensen BC, Gladyshev VN, Heijmans BT, Horvath S, et al. DNA methylation aging clocks: challenges and recommendations. Genome Biol. 2019;20(1):249. [DOI] [PMC free article] [PubMed] [Google Scholar]
- 41.Shah SH, Bain JR, Muehlbauer MJ, Stevens RD, Crosslin DR, Haynes C, Dungan J, Newby LK, Hauser ER, Ginsburg GS, et al. Association of a peripheral blood metabolic profile with coronary artery disease and risk of subsequent cardiovascular events. Circ Cardiovasc Genet. 2010;3(2):207–214. [DOI] [PubMed] [Google Scholar]
Associated Data
This section collects any data citations, data availability statements, or supplementary materials included in this article.