

Abstract
Purpose:
Monoclonal antibodies targeting the PD-1/PD-L1 immune checkpoint are powerful tools to improve the survival of cancer patients. Understanding the molecular basis of clinical response to these treatments is critical to identify patients who can benefit from this immunotherapy. In this study, we investigated long non-coding RNA (lncRNA) expression in cancer patients treated with anti-PD-1/PD-L1 immunotherapy.
Experimental design:
LncRNA expression profile was analyzed in one cohort of melanoma patients and two independent cohorts of patients with glioblastoma (GBM) undergoing anti-PD-1/PD-L1 immunotherapy. Single-cell RNA-sequencing analyses were performed to evaluate lncRNA expression in tumor cells and tumor-infiltrating immune cells.
Results:
We identified the lncRNA NEAT1 as commonly upregulated between melanoma patients with complete therapeutic response and GBM patients with longer survival following anti-PD-1/PD-L1 treatment. Gene set enrichment analyses revealed that NEAT1 expression was strongly associated with the interferon-gamma pathways, along with downregulation of cell-cycle-related genes. Single-cell RNA-sequencing analyses revealed NEAT1 expression across multiple cell types within the GBM microenvironment, including tumor cells, macrophages, and T cells. High NEAT1 expression levels in tumor cells correlated with increased infiltrating macrophages and microglia. In these tumor-infiltrating myeloid cells, we found that NEAT1 expression was linked to enrichment in TNF alpha/NFKB signaling pathway genes. Silencing NEAT1 suppressed M1 macrophage polarization and reduced the expression of TNF alpha and other inflammatory cytokines.
Conclusions:
These findings suggest an association between NEAT1 expression and patient response to anti-PD-1/PD-L1 therapy in melanoma and GBM and have important implications for the role of lncRNAs in the tumor microenvironment.
Keywords: long non-coding RNAs, NEAT1, immunotherapy, PD-1, PD-L1
INTRODUCTION
Clinical efforts to utilize and enhance the immune system to treat cancer have been an area of intense focus over the past several decades and have led to therapeutic breakthroughs in a number of malignancies, as exemplified by advanced melanoma (1). Cancer can avoid immune surveillance by exploiting several immunological processes (2). Immune checkpoint molecules, such as PD-1 and PD-L1, can be expressed within the tumor microenvironment to mediate negative regulatory signals that suppress T cell function and enable tumor immune evasion (3). Therefore, immune checkpoint inhibitors targeting PD-1 or PD-L1 can re-activate T cells to produce a durable anti-tumor response (4). It has been estimated that about 36% of cancer patients in the US are eligible for immune checkpoint blockade (ICB) therapy (5). However, most patients do not respond to this treatment, and some responders eventually relapse (6). In melanoma, acquired resistance to ICB has been associated with mutation of the JAK1/JAK2 and B2M genes, which results in interferon-signaling and antigen presentation defects (7). Additionally, ICB has shown limited success in tumors with a highly immunosuppressive microenvironment, such as glioblastoma (GBM) (8). Several clinical studies evaluating the efficacy of PD-1 antibodies in GBM have yielded disappointing results (9,10). However, an analysis of the data from these studies, considering clinical factors such as MGMT promoter methylation and the use of steroids, indicated that ICB therapy may provide benefits for a subset of GBM patients (11). Moreover, additional clinical studies in GBM have demonstrated the importance of the timing of ICB treatment, although the markers associated with response remain unclear (12). There is thus a great need to understand the molecular basis underlying clinical response to ICB to identify and potentially expand the number of patients that may benefit from this therapy.
With recent advances in RNA sequencing and computational techniques, our understanding of the landscape of non-coding genes is continually expanding (13). Among the different non-coding RNA transcripts identified, long non-coding RNAs (lncRNAs) are defined as transcripts measuring over 200 nucleotides in length (14). Although the function of many lncRNAs remains unknown, it is now emerging that lncRNAs can play a pivotal role in gene expression regulation both under physiologic conditions and cancer (15). The tumor-expressed lncRNA INCR1, for example, was shown to regulate interferon signaling and inhibit T cell-mediated tumor cell killing (16). Immune cells also express lncRNAs that control several different pathways, including innate and adaptive immune responses (17). In the current study, we assessed lncRNA expression in both bulk and single-cell RNA-seq datasets from melanoma and GBM tumors, to identify lncRNAs that are concurrently related to ICB response across multiple cancers.
MATERIALS AND METHODS
Data collection and patient selection.
The datasets used in this study are summarized in supplementary Figure S1. RNA sequencing datasets were obtained from the Gene Expression Omnibus (GEO, RRID:SCR_005012) using the following criteria: (i) the cancer patients received an anti-PD-1/PD-L1 monoclonal antibody therapy; (ii) RNA was prepared from fresh or fresh-frozen tissue; (iii) clinical data, such as mutational status and overall survival from treatment, were available. As a result, one melanoma dataset (GSE78220; n = 28) and one glioblastoma dataset (GSE121810; n = 29) were chosen. Study metadata were obtained from GEO and the study investigators. GSE78220 dataset included patients with metastatic melanoma who received either pembrolizumab or nivolumab as the anti-PD-1 therapy. Patient 27 had two pre-treatment melanoma biopsy samples taken from distinct sites. Because the two tumor specimens may not share the same lncRNA profile, we included both tumors from patient 27 for the transcriptomic and pathway analyses. GSE121810 dataset included glioblastoma patients randomized into the neoadjuvant pembrolizumab group (n = 14) and the adjuvant-only group (n = 15). Patient 28 (neoadjuvant group) had available RNA sequencing data but no available metadata and was excluded from the analysis. Known IDH-mutant astrocytoma samples from the neoadjuvant group (patients 8 and 26) and the adjuvant group (patients 14 and 34) were excluded from the analyses because, based on the latest WHO classification of tumors of the central nervous system, they are now considered to be a distinct biological entity from IDH-wildtype glioblastoma. An additional patient from the adjuvant group (patient 17) with “unknown” IDH status was excluded from the Cox Proportional-Hazards multivariate analysis. For the cohort of glioblastoma patients receiving standard therapy, RSEM RNA sequencing counts and clinical metadata were downloaded directly from cBioPortal (TCGA, Cell 2013; http://www.cbioportal.org/study/summary?id=gbm_tcga_pub2013), and only known IDH-wildtype patients were included in our analyses (thereby excluding TCGA-02–2483, TCGA-06–0129, TCGA-06–2570, TCGA-06–5416, TCGA-06–5417, TCGA-15–1444, TCGA-19–1787, TCGA-19–2629, TCGA-26–1442, TCGA-27–2521, TCGA-32–2616).
Bulk RNA-sequencing of GBM tumor samples
For the confirmation cohort of glioblastoma tumor samples, RNA was isolated using the Qiagen RNA kit. Libraries were prepared using either the Illumina TruSeq kit or the Transcriptome Capture method, for fresh frozen and FFPE samples, respectively. The Transcriptome Capture method involves constructing a stranded cDNA library from isolated RNA followed by hybridization of the library to a set of DNA oligonucleotide probes to enrich the library for mRNA transcript fragments (capturing 21,415 genes). Normalized, pooled libraries were submitted for sequencing on HiSeq 2500 machines for a target of 50 million 2×76bp paired reads per sample. Institutional Review Board approval was obtained from Dana-Farber Cancer Institute, the Broad Institute, and Brigham and Women’s Hospital.
Sequence alignment
Raw data were trimmed and mapped using CLC genomics workbench version 22.0.2. Quality trimming was set at quality limit = 0.05, maximum number of ambiguities = 2. Trimmed reads were aligned to the human genome from the Ensembl release GRCh38. The mapping options were set as mismatch cost = 2, insertion cost = 3, deletion cost = 3, length fraction = 0.8, similarity fraction = 0.8, auto-detect paired distances, maximum number of hits for a read = 10. Expression setting was set as strand setting = both, library type setting = bulk, expression level = ignore broken pairs.
Expression analysis
The bulk count data were then analyzed in RStudio; the RSEM counts (TCGA) were rounded to the nearest integer using the round function. DESeq2 (RRID:SCR_000154) (18) was used to normalize expression counts and to obtain differentially expressed genes between cohorts. Heatmaps were produced with the CLC genomics workbench version 22.0.2.
Pathway enrichment analysis
Pathway enrichment analysis was conducted using Gene Set Enrichment Analysis (GSEA) software version 4.1.0. Analyses in GSEA were performed on the counts per million generated in CLC genomics workbench. The analysis used the gene set database h.all.v2022.2.Hs.symbols.gmt (Hallmarks) with number of permutations set at 1000, collapse/remap to gene symbol = collapse, permutation type = gene_set, enrichment statistic = weighted, metric for ranking genes = Signal2Noise, gene list sorting mode = real, gene list ordering mode = descending, max size: exclude larger sets = 500, min size: exclude smaller sets = 15.
Analysis of single-cell RNA sequencing data
For the first GBM single-cell sequencing dataset, processed and normalized transcripts per million (TPM) counts from 28 GBM tumors (GEO: GSE131928) were downloaded from GEO, log-transformed, and passed into a Seurat (19) object in R. Relevant clinical and cluster ID metadata were also downloaded from GEO. For the second GBM single-cell sequencing dataset including GBM tumor and immune cells from 40 samples from 16 patients (GSE182109), processed barcodes, features, and matrix files were downloaded from GEO and read into R using the ReadMtx function before being passed into Seurat objects and merged together. Relevant clinical and cluster ID metadata were also downloaded from GEO or obtained from the authors. The count data were aligned with the available metadata in GSE182109, leaving 182,237 cells for further analyses. The count data were then normalized using the NormalizeData function with default parameters. Based on the cluster ID metadata from GSE182109, the median normalized expression of NEAT1 among malignant cells, in addition to the fraction of immune cell subtypes, was computed for each tumor sample (38 out of the 40 samples contained malignant cells; number of newly diagnosed tumor cells = 39,951; number of recurrent tumor cells = 30,652). Subsequent linear regression analyses were performed using the ggscatter function, with add = “reg.line” and cor.coef = TRUE. Cells from GSE182109 were then stratified by identity and tumor status (recurrent or newly diagnosed). Based on the cluster ID data and figures from Abdelfattah et al. (20), macrophages were defined as cells belonging to the “s-mac1”, “s-mac2”, and “Proliferating” clusters, while microglia were defined as cells belonging to the “a-microglia”, “AP-microglia”,” h-microglia”, and “i-microglia” clusters. The FindVariableFeatures, using selection.method = “vst” with 2000 features, and ScaleData functions from the Seurat package were then applied to the Seurat objects with default parameters. Downstream clustering analyses were performed using the Seurat FindNeighbors, FindClusters, and RunUMAP functions with 10 principal component dimensions. T cell, macrophage, and oligodendrocyte clusters from GSE131928 were defined using authors’ described gene signatures. Signature scores were computed using UCell. The remaining UMAP cell clusters from GSE131928 were classified as tumor cells, which were subsequently isolated. Variable features from these tumor cells were again detected using FindVariableFeatures. Cell cycle states were inferred using the CellCycleScoring function with the default S-phase and G2M gene sets from Seurat. Cell cycle effects were then regressed out using the ScaleData function, with vars.to.regress = c(“S.Score”, “G2M.Score”). Tumor cells were then re-clustered as previously described. NEAT1-high cells were defined as cells with NEAT1 expression greater than the median NEAT1 expression among cells belonging to each respective cohort. Differential expression analysis between NEAT1-high and NEAT1-low cells was performed using the Seurat FindMarkers function with default parameters. Gene set enrichment analyses between NEAT1-high and NEAT1-low cells were also conducted using the Seurat DEenrichRPlot function and Hallmark 2020 gene set database (21), with max.genes = 100.
Cell Lines
Patient-derived primary GBM cells (G44, BT139: RRID:CVCL_WW39, BT333: RRID:CVCL_WW61) were generated as previously described (16) and cultured as neurospheres in stem cell conditions using Neurobasal (Thermo Fisher Scientific) supplemented with Glutamine (Thermo Fisher Scientific), B27 (Thermo Fisher Scientific), 20 ng/ml epidermal growth factor (EGF) and fibroblast growth factor (FGF)-2 (PrepoTech). IFNγ (PeproTech) stimulation was performed at 100 U/ml IFNγ for a period of 24 h. THP-1 cells (monocytes: RRID:CVCL_0006) were purchased from the American Type Culture Collection (ATCC) and cultured in RPMI (Thermo Fisher Scientific) supplemented with 10% FBS. THP-1 cells were differentiated into M0 macrophages by 24 h incubation with 50 ng/ml phorbol 12-myristate 13-acetate (PMA, Millipore Sigma). Macrophages were then polarized in M1 macrophages by incubation with 20 ng/ml of IFN-γ (PrepoTech) and 10 pg/ml of LPS (Millipore Sigma). M2 polarization was obtained by incubation with 20 ng/ml of interleukin 4 (PrepoTech). Antisense oligonucleotides (ASOs, Qiagen) knockdown experiments were performed transfecting cells with 50 nM of ASO NEAT1_1 (TGTGGCATCAACGTTA) and ASO NEAT1_2 (ATCGACCAAACACAGA) using Lipofectamine 2000 (Thermo Fisher Scientific).
BT139 and BT333 cells were obtained from Keith Ligon (Dana-Farber Cancer Institute) after having been extensively genetically characterized in his laboratory. G44 cells underwent commercial STR profiling on 06/17/2021. All cell lines have been PCR tested for mycoplasma every 3 months except for THP-1 cells that were used at low passage directly after purchase. The latest negative mycoplasma test was obtained on 12/19/2022 (BT139) and on 02/20/2023 (BT333 and G44). G44, BT139, and BT333 cells were used for experiments between passage 3 and 10. THP-1 cells were used for experiments between passage 3 and 6.
Quantitative Real-Time PCR analysis
Total RNA was extracted using TRIzol (Thermo Fisher Scientific), reverse transcribed using iScript cDNA Synthesis Kit (BioRad) and quantitative real-time PCR was performed using SYBR Green Master Mix (Applied Biosystem). 18S expression levels were used as control. The primers used throughout the study are listed in Table S1.
Statistical analysis
For differential enrichment analyses of the bulk RNA sequencing melanoma dataset, significant genes were detected using DESeq-generated Benjamini-Hochberg (BH)-adjusted p-values (FDR) that were less than 0.05. For validation in glioblastoma datasets, significant lncRNAs were detected using DESeq-generated p values that were less than 0.05. Overall survival analysis was performed using GraphPad Prism version 9.4.1 (RRID:SCR_002798). Statistical comparison of the survival distribution of two groups was performed using the log-rank test. Multivariate Cox Proportional-Hazards analyses were performed using the R survival package, with P<0.05 considered statistically significant. In the GSEA analysis, enriched gene sets with a false discovery rate (FDR) less than 0.1 were considered significant. Statistical comparison of gene expression between cell types in the single-cell RNA sequencing studies was performed using the Wilcoxon test and the stat_compare_means function from the ggpubr R package.
Study approval
Patient samples were analyzed under Dana-Farber Cancer Institute/Harvard Cancer Center Institutional Review Board approval and informed written consent was obtained from each subject, based on the Declaration of Helsinki principles.
Data availability
The data generated in this study are available upon request from the corresponding author. Melanoma and Glioblastoma datasets are publicly available in Gene Expression Omnibus (GEO) at GSE78220, GSE121810, GSE131928, and GSE182109.
RESULTS
NEAT1 expression levels are associated with patient response to immune checkpoint blockade in melanoma.
To identify lncRNAs associated with response to ICB, we first analyzed the bulk RNA-seq data of 28 pre-treatment fresh-frozen tumor samples obtained from patients with metastatic melanoma treated with pembrolizumab (GEO: GSE78220) (22). Patient characteristics are summarized in Supplementary Table S2. Based on iRECIST tumor response criteria, patients were categorized into 3 groups: complete response (n = 5), partial response (n = 10), and progressive disease (n = 13). We found 104 lncRNAs differentially expressed between patients with complete response and patients with progressive disease (cutoff: Benjamini-Hochberg-adjusted p-values < 0.05) (Fig. 1A and Supplementary Table S3). Among these lncRNAs, NEAT1 was the most highly expressed lncRNA (Fig. 1B) and was upregulated in tumors that demonstrated a complete response (Fig. 1C). We also observed significant upregulation of NEAT1 in all responding tumors, which included patients who had complete or partial responses, relative to non-responding tumors (Supplementary Fig. S2A). The median expression of NEAT1 in tumors with partial response was higher than the median expression in tumors with progressive disease, but lower compared to complete responders (Fig. 1C), suggesting an association between NEAT1 expression levels and tumor response to ICB.
Figure 1.
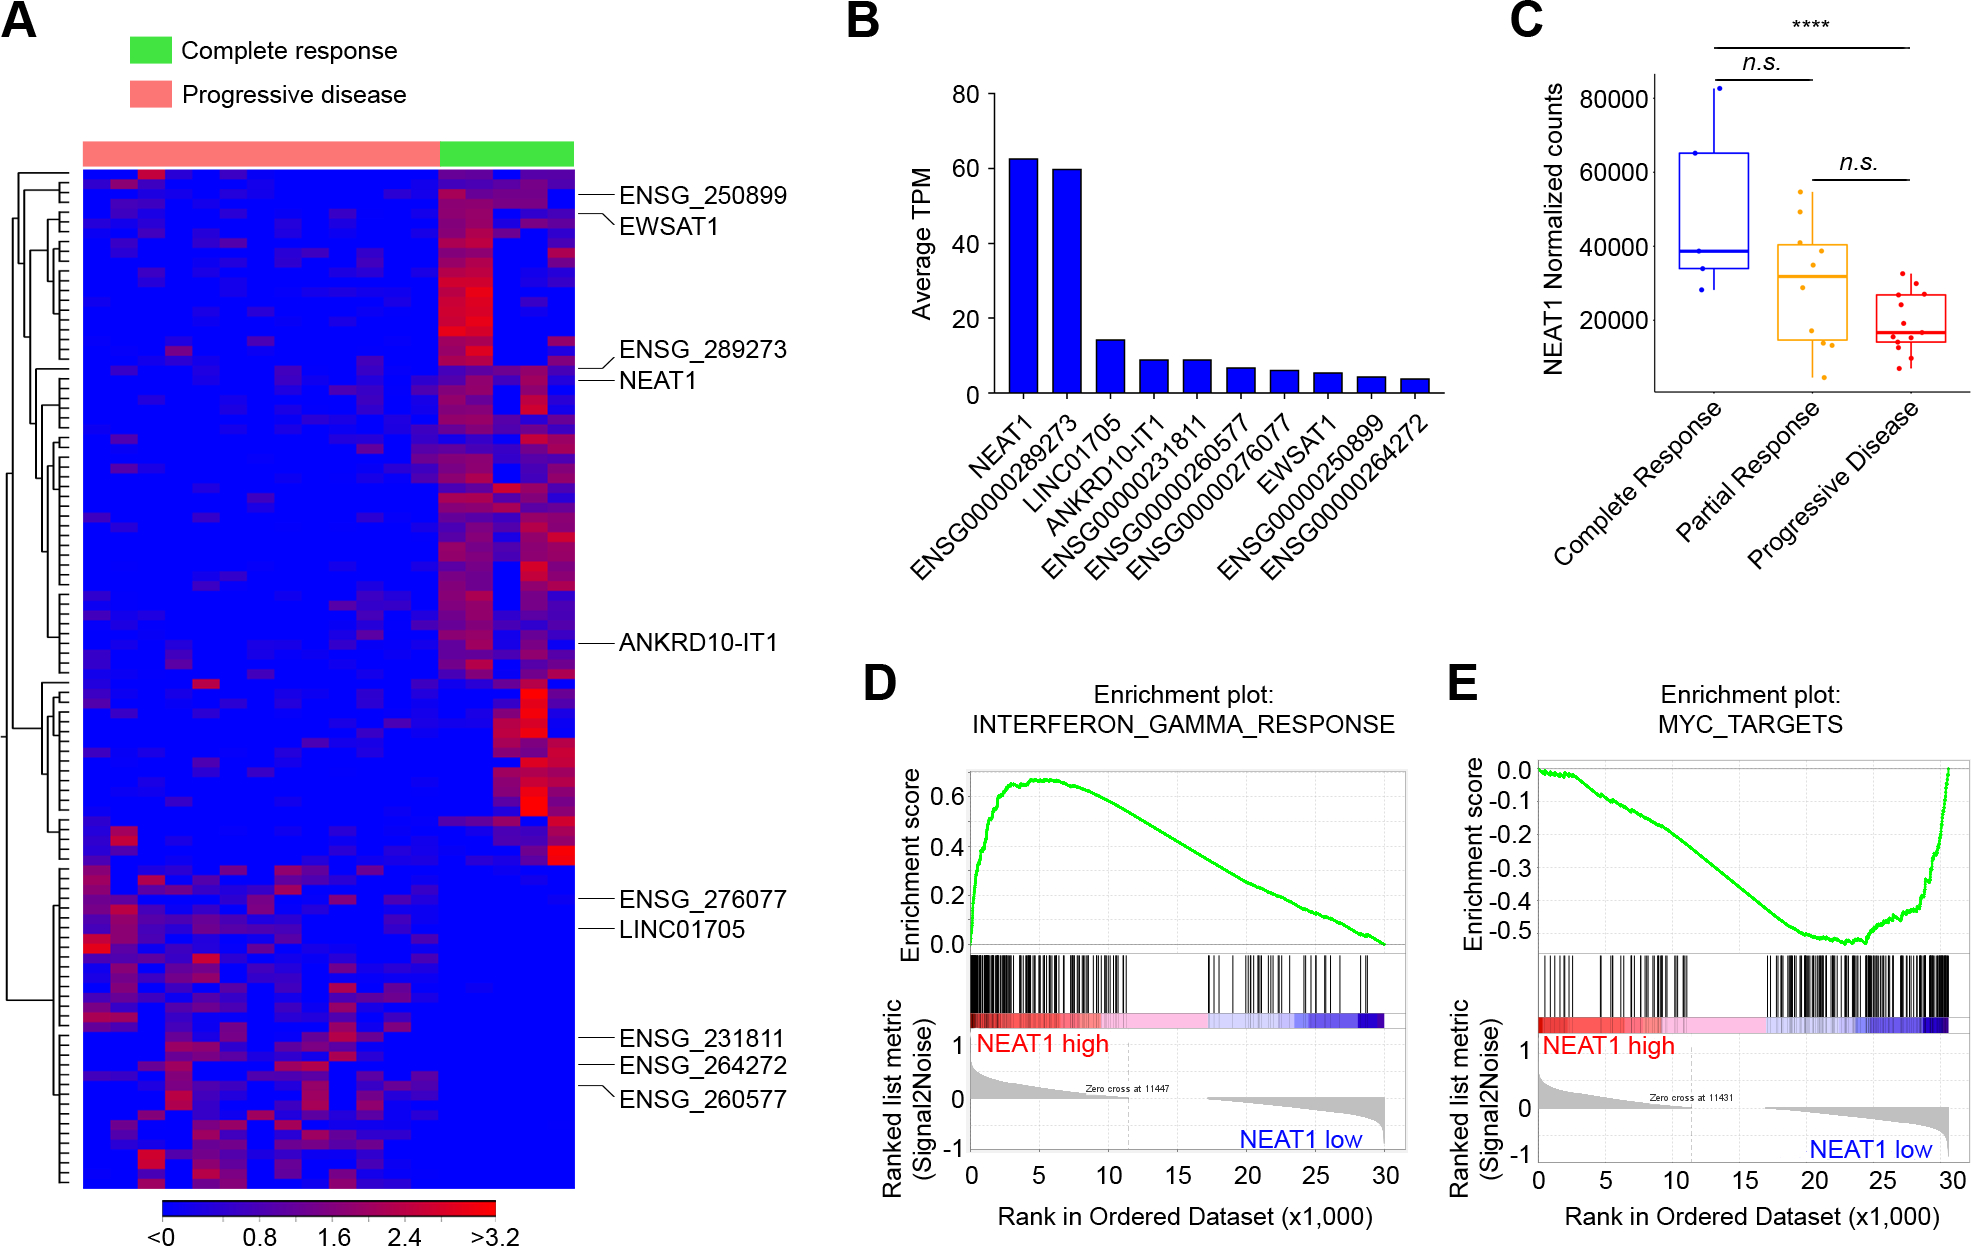
NEAT1 expression levels are associated with patient response to immune checkpoint blockade in melanoma. A, Heat map of the supervised hierarchical clustering analysis of the 104 lncRNAs differentially expressed (RNA-seq) between metastatic melanoma patients with complete response to pembrolizumab compared to patients with progressive disease (FDR < 0.05). B, Expression levels in average transcripts per million (TPM) across patients of the top ten most expressed lncRNAs in melanoma. C, Pre-treatment levels of NEAT1 (normalized counts) in melanoma patients with complete response (n = 5), partial response (n = 10), or progressive disease (n = 13). Data were analyzed by Wilcoxon test: ****p < 0.0001. D and E, Enrichment plots for the most enriched gene set in the NEAT1-high tumors (n = 14) (D) and most enriched gene set in the NEAT1-low tumors (n = 14) (E) from the GSEA Hallmark analysis.
High NEAT1-expressing melanomas exhibit upregulation of the interferon gamma pathway.
NEAT1 expression has been recently associated with the regulation of several inflammasomes (23). To evaluate the potential mechanisms underlying the relationship between NEAT1 expression and tumor response to ICB, we divided the melanoma tumors into two groups relative to median NEAT1 expression level. Next, we performed gene set enrichment analysis (GSEA) of normalized counts of the genes expressed in high NEAT1 tumors (n = 14) compared to those expressed in low NEAT1 tumors (n = 14). We found 11 gene sets significantly enriched in tumors with high NEAT1 expression and 21 gene sets significantly enriched in tumors with low NEAT1 expression (FDR < 0.1) (Supplementary Fig. S2B). Interferon-gamma (IFNγ) response was the most enriched gene set in tumors with high NEAT1 (Fig. 1D). The other enriched gene sets included “allograft rejection”, “Interferon-alpha response”, “IL6 JAK STAT3 signaling”, and “inflammatory response” (Supplementary Fig. S2B). These gene sets encompassed genes related to antigen presentation (CIITA, HLA-DMA, CD74, TAPBP, HLA-DOA, TAP2, and HLA-DMB), cytokines/chemokines and their receptors (IL15, IL2, CXCL11, IL2RB, and IL10RA), and other immune-related molecules (Supplementary Fig. S2C). Gene sets that showed a negative correlation with NEAT1 expression included “E2F targets”, “G2M checkpoint”, and “MYC targets”, which comprise genes important for cell growth and cell cycle regulation (Fig. 1E and Supplementary Fig. S2C). Together, these data indicate that NEAT1 expression is associated with IFNγ signaling, cytokine and chemokine production, and antigen presentation, which are crucial components of the ICB-mediated antitumor immune response.
NEAT1 expression is associated with longer survival in glioblastoma patients treated with immune checkpoint blockade.
To test if the differentially expressed lncRNAs identified in melanoma are associated with ICB therapy response in cancer types with well-characterized intrinsic immune resistance, we analyzed RNA-seq data in fresh-frozen tumors from recurrent GBM patients (n = 24) treated with anti-PD-1 ICB (pembrolizumab; GEO: GSE121810) (24). Patient characteristics are summarized in Supplementary Table S4. In this clinical trial, patients were randomized into the neoadjuvant ICB group or the adjuvant group. To assess if the expression of these lncRNAs in the tumor was associated with ICB therapy response, we first analyzed IDH-wildtype (WT) GBM patients from the adjuvant group (n = 13) by dividing patients into long-term survivors (n = 7) and short-term survivors (n = 6) relative to median overall survival (OS) (6.3 months). Of the 104 differentially expressed lncRNAs identified in the melanoma dataset, we found seven lncRNAs commonly upregulated in GBM long-term survivors (cutoff: p < 0.01) and melanoma responders (NEAT1, IGFL2-AS1, ENSG00000288598, LINC00891, ENSG00000286416, ENSG00000268460, LINC00200) (Fig. 2A and Supplementary Table S5). No commonly downregulated lncRNAs were identified. Among the commonly deregulated lncRNAs, only NEAT1 was abundantly expressed in GBM, while the other lncRNAs exhibited very low expression (Fig. 2A). A similar trend was observed in the neoadjuvant group (median OS = 13.3 months), although the difference in NEAT1 levels between long-term survivors (n = 5) and short-term survivors (n = 6) did not reach statistical significance (p = 0.09; Supplementary Fig. S3A). However, when dividing all patients by NEAT1 median expression, independently of the treatment group, we found that GBMs with high NEAT1 expression (n = 12) were associated with improved patient overall survival compared to those with low NEAT1 expression (n = 12) (hazard ratio 0.31; 95% confidence interval = 0.11–0.82; p = 0.006). Patients with high NEAT1 expressing GBMs had a median overall survival of 13.3 months, whereas those with low NEAT1 levels had a median overall survival of 5.9 months (Fig. 2B). Multivariate Cox Proportional-Hazards analysis found that treatment group and NEAT1 were factors independently affecting OS with p = 0.011 and p = 0.045, respectively (Fig. 2C). No significant difference in NEAT1 expression was observed between the neoadjuvant and adjuvant groups (Supplementary Fig. S3B). To determine if NEAT1 expression’s overall survival benefit was independent of ICB, we also examined RNA-seq data of 141 IDH-WT glioblastoma patients treated with standard therapy from TCGA database (25). We found that patients with higher NEAT1 expression tended to have worse overall survival, although no statistically significant difference was observed between long-term and short-term survivor GBM patients who did not receive ICB therapy (p = 0.069; Supplementary Fig. S3C). Finally, GSEA of NEAT1-high ICB-treated GBM tumors compared to NEAT1-low ICB-treated GBM tumors revealed that IFNγ and inflammatory signaling were among the most enriched gene sets in NEAT1-high GBM tumors (Fig. 2D), recapitulating findings from the melanoma cohort. Several genes were commonly upregulated in melanoma and GBM tumors, including genes highly associated with NEAT1 expression, such as IL15 and CTIIA (Supplementary Fig. S3D). At the other extreme, “MYC Targets V1” was the most downregulated gene set, together with other genes involved in cell-cycle regulation (Fig. 2D and Supplementary Fig. S3E). These findings confirmed the initial observation that NEAT1 expression is associated with immune-related signaling in melanoma and indicate a connection between NEAT1 expression and improved response to ICB therapy in multiple cancers.
Figure 2.
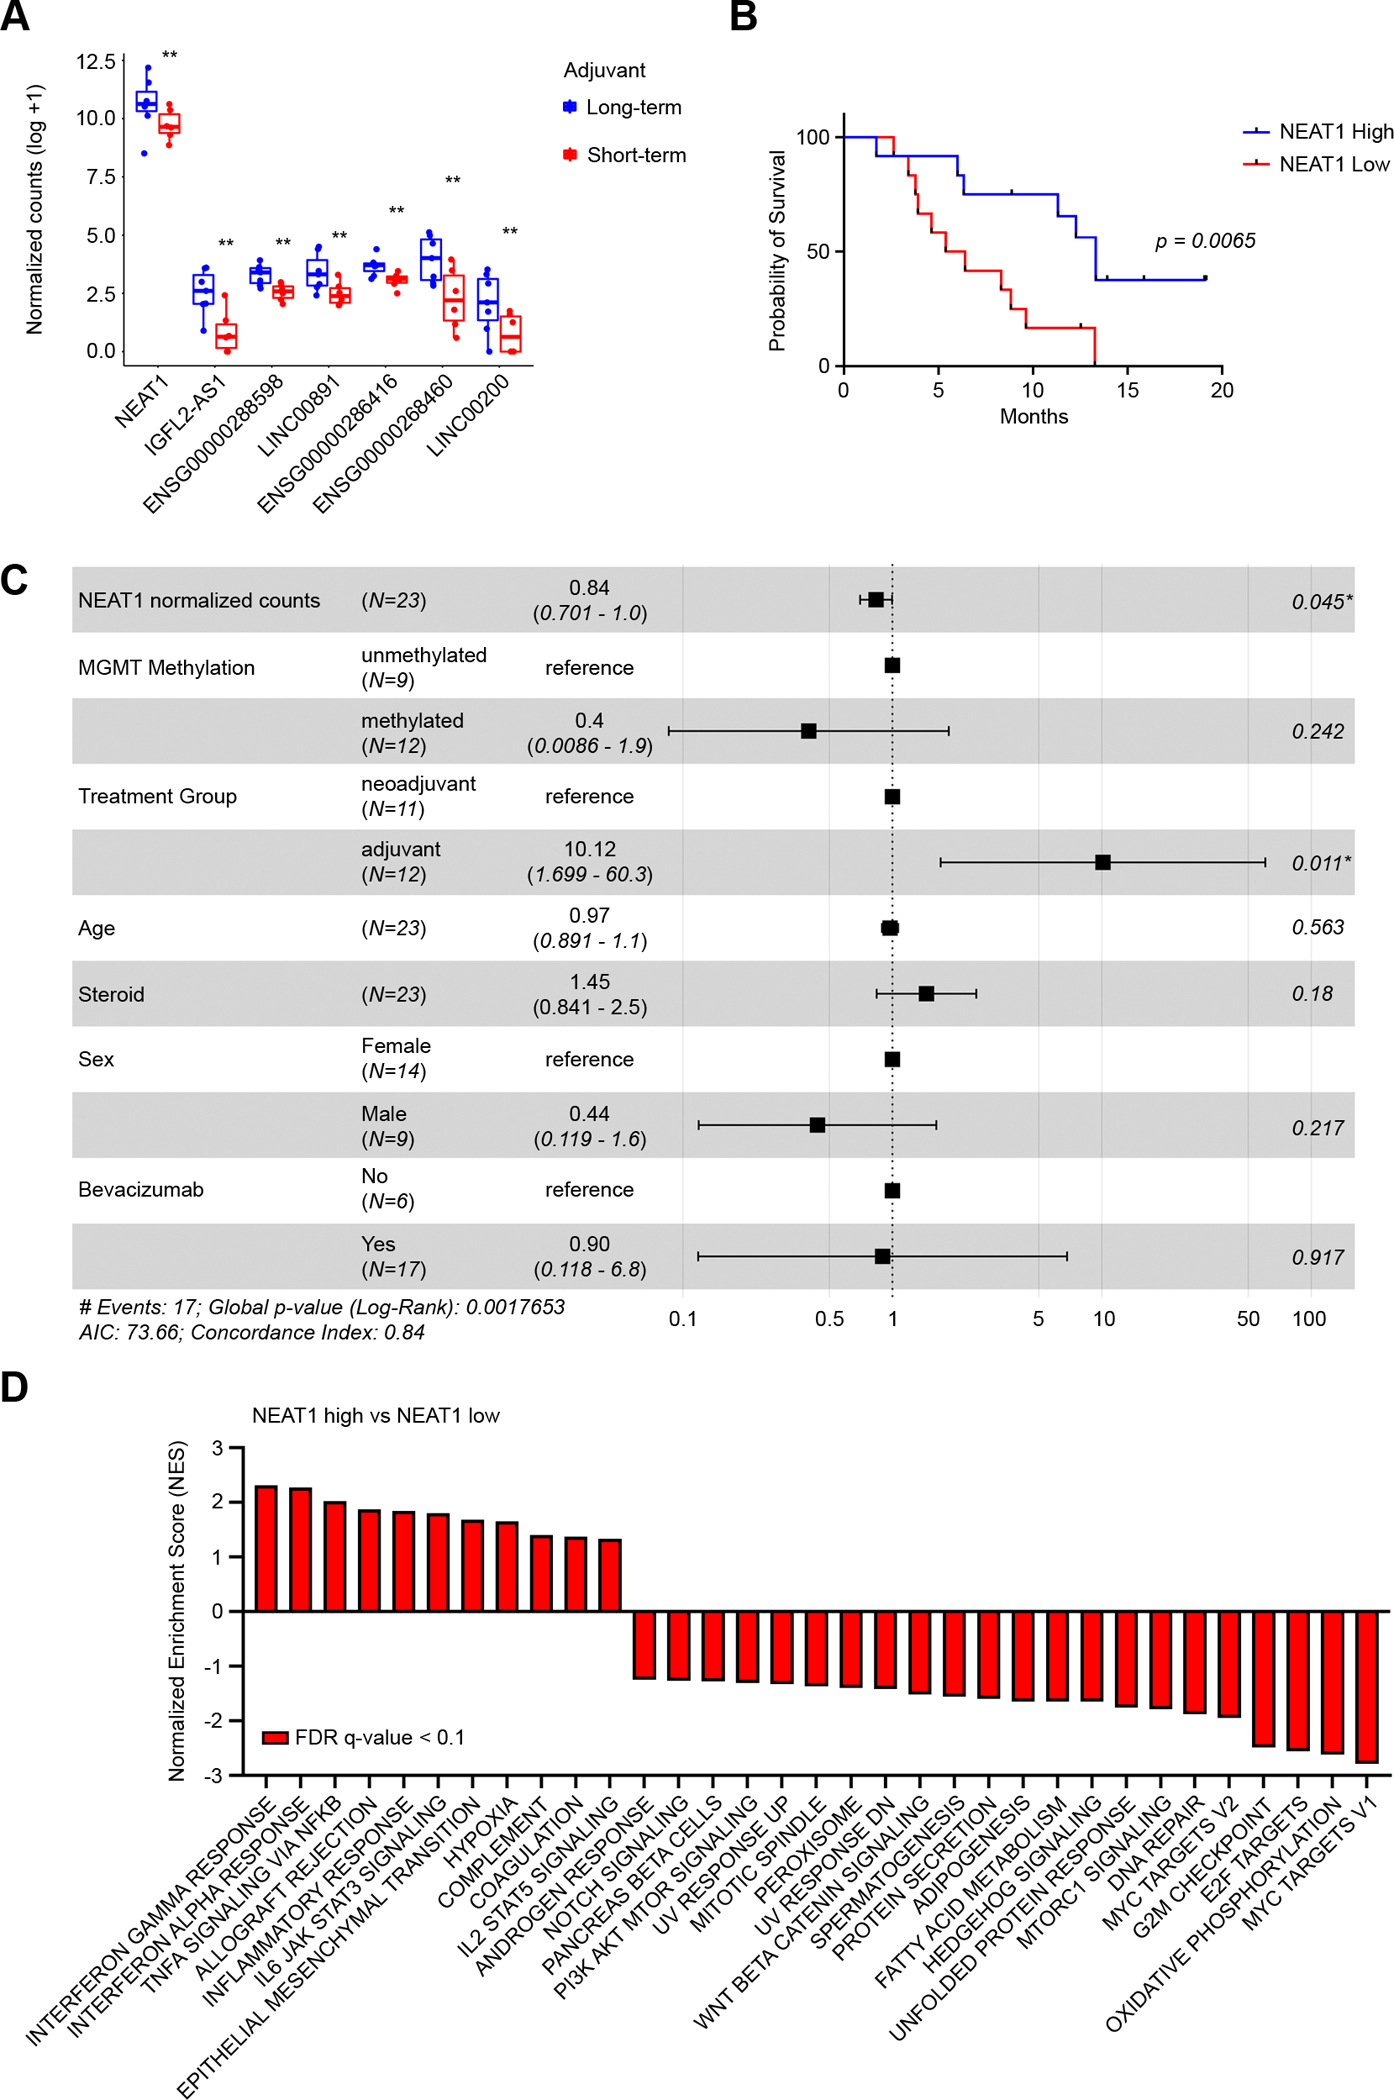
NEAT1 expression is associated with prolonged survival in glioblastoma patients treated with immune checkpoint blockade. A, Glioblastoma patients of the adjuvant pembrolizumab group were divided based on median OS (6.3 months) in long-term survivors (blue, n = 7) and short-term survivors (red, n = 6). Of the 104 lncRNAs identified in the melanoma dataset, 7 lncRNAs were found deregulated in GBM long-term survivors compared to short-term survivors. Data were analyzed by Wald test: ** p < 0.01. B, Kaplan-Meier survival analysis for overall survival in NEAT1-high (blue, n =12) and NEAT1-low (red, n = 12) GBM patients from the adjuvant and neoadjuvant pembrolizumab. Median overall survival for patients with high NEAT1 levels was 13.3 months, whereas median overall survival for patients with low NEAT1 levels was 5.9 months (hazard ratio 0.3094; p = 0.0065). C, Forest plot of multivariable Cox Proportional-Hazard regression analysis. NEAT1 and multiple clinical features were used to analyze whether NEAT1 was an independent prognostic factor for GBM. D, GSEA Hallmark analysis of enriched gene sets in NEAT1-high GBM tumors compared to NEAT1-low GBM tumors (FDR q-value < 0.1). GBM patients from the adjuvant and neoadjuvant pembrolizumab were analyzed together. A positive Normalized Enrichment Score (NES) value indicates enrichment in the NEAT1-high tumors, a negative NES indicates enrichment in the NEAT1-low tumors.
Confirming the association of NEAT1 expression with response to immune checkpoint blockade in glioblastoma patients.
To confirm the association of NEAT1 expression with IFNγ signaling and glioblastoma patient survival on ICB therapy, we analyzed bulk RNA-seq data from an additional cohort of 28 IDH WT GBM patients treated with PD-1/PD-L1 ICB at the Dana-Farber Cancer Institute between 2014 and 2019. Patient characteristics are summarized in Supplementary Table S6. All patients reached the overall survival endpoint. Because we found that the normalized number of NEAT1 reads were highly affected by tissue fixation (Supplementary Fig. S4), we excluded from the analysis tumor tissue samples that were formalin-fixed and paraffin-embedded (FFPE) (n = 10). By dividing patients in two groups based on median OS from ICB treatment (median = 14.8 months), we found that long-term survivors (n = 9) had higher NEAT1 expression compared to short-term survivors (n = 9) (Fig. 3A). Accounting for other variables, multivariate Cox Proportional-Hazards analysis identified NEAT1 expression as the only independent prognostic factor for this cohort (p = 0.044, Fig. 3B). To evaluate the relationship between GBM NEAT1 expression and IFNγ signaling, we analyzed the differential gene expression between the high and low NEAT1-expressing tumors. There was significantly increased expression of IFNγ-related genes in GBMs with high NEAT1 expression (Fig. 3C). The upregulated genes included transcripts we found to be highly correlated with NEAT1 levels in both the melanoma and the GBM patient pilot data, including IL15, CIITA, ITGB7, VAMP8, CASP4, ISG20 and NFKBIA. These results emphasize the importance of IFNγ signaling in GBM responses to ICB therapy and further support NEAT1 expression levels as a feature that may predict patient response to ICB.
Figure 3.
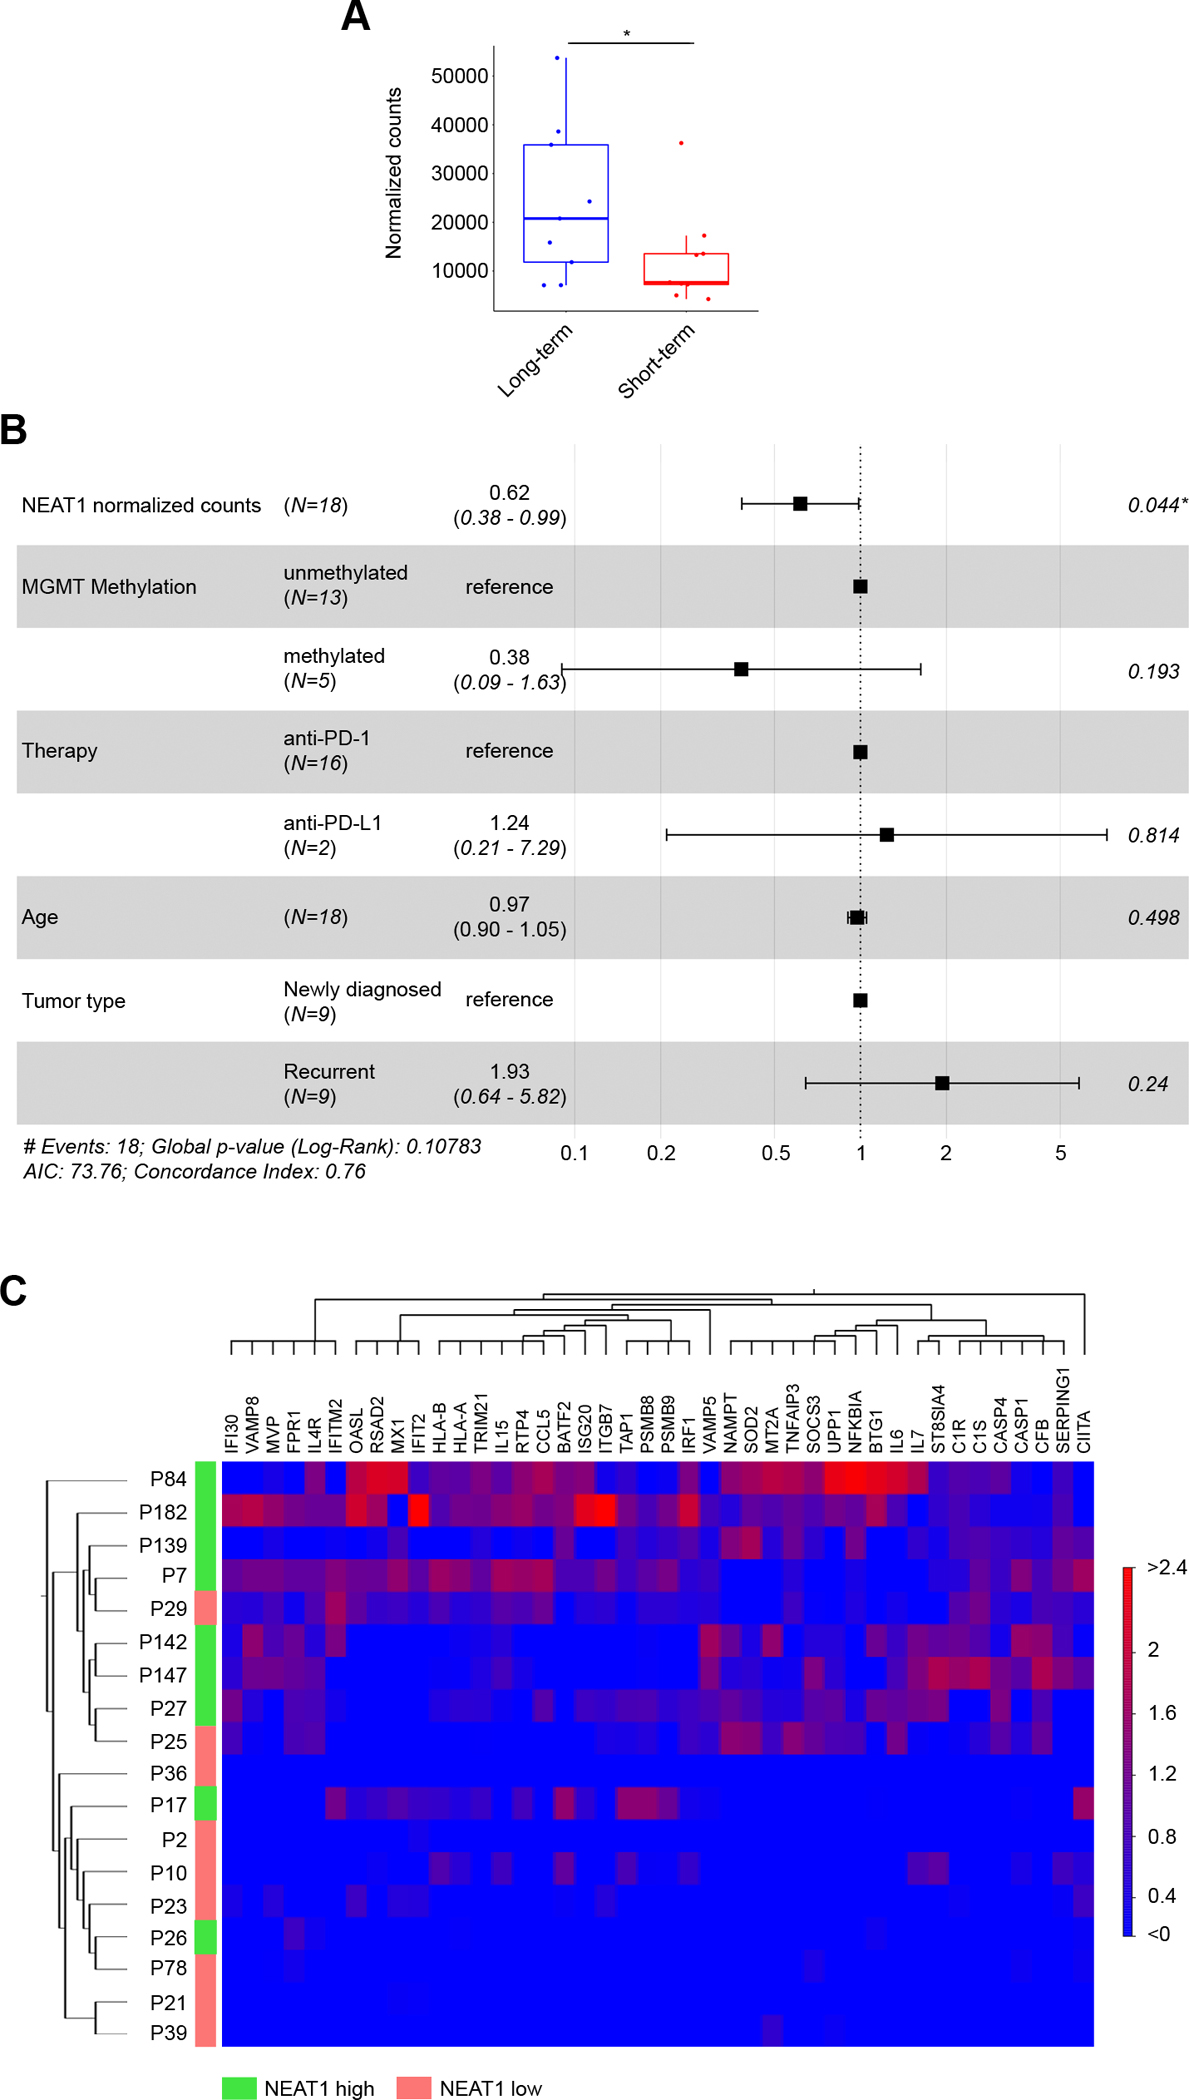
High NEAT1 levels in glioblastoma patients are associated with longer survival on immune checkpoint blockade and IFNγ signaling. A, NEAT1 expression (normalized counts) in long-term (blue, n = 9) and short-term (red, n = 9) survivors among GBM patients treated with adjuvant ICB therapy. Patients were divided in two groups based on median OS (14.8 months). Data were analyzed by Wald test: * p < 0.05. B, Forest plot of multivariable Cox proportional hazard regression analysis. NEAT1 and multiple GBM features were used to analyze whether NEAT1 was an independent prognostic factor for GBM. C, Heat map of the supervised hierarchical clustering analysis of IFNγ-related genes significantly deregulated (p < 0.05) between NEAT1 high GBM tumors (green) and NEAT1 low GBM tumors (red). Patients were divided by median NEAT1 expression.
NEAT1 expression in GBM tumor cells is associated with upregulation of the IFNγ signaling.
We next sought to investigate the contribution of tumor cells to NEAT1 expression within the GBM tumor microenvironment through examination of an external dataset of single-cell transcriptomes generated from 7,930 cells across 28 GBM tumor samples (Fig. 4A), which included 25 newly diagnosed and 3 recurrent GBMs not treated with ICB (Fig. 4B). In these samples, cells were sorted to isolate mostly tumor cells, and to a lesser extent immune cells and oligodendrocytes (GEO: GSE131928) (26). As expected, the cell groups formed distinct clusters by uniform manifold approximation and projection (UMAP) analysis (Fig. 4C). We used the originally reported gene signatures to confirm the identities of the macrophage, T cell, and oligodendrocyte clusters. Analysis of TMEM119 gene expression showed that the macrophage cluster included both macrophages and microglia (Fig. 4D). We classified the remaining UMAP clusters as malignant cells, which tended to express the neural stem cell marker SOX2 (Supplementary Fig. S5A–D). While NEAT1 was ubiquitously expressed in macrophages/microglia and oligodendrocytes, there was substantial heterogeneity in NEAT1 expression among T cells and especially tumor cells (Fig. 4E). This resulted in a significantly higher NEAT1 median expression in macrophages/microglia compared to the other cell types (Fig. 4F). We also observed that NEAT1-expressing tumor cells tended to cluster together by UMAP (Fig. 4E). To further investigate this finding, we isolated and re-clustered the tumor cells, and then performed correction for cell cycle effects (Supplementary Fig. S5E and S5F) before characterizing them for NEAT1 expression. We divided tumor cells into two groups based on median NEAT1 expression (Fig. 4G), and we performed a pathway enrichment analysis on NEAT1-high compared to NEAT1-low tumor cells. As per the bulk sequencing data, NEAT1-high tumor cells were enriched for genes of the IFNγ pathway, which included genes involved in innate and adaptive immunity (Fig. 4H and Supplementary Table S7). Therefore, to investigate whether elevated NEAT1 expression is the result of tumor response to increased IFNγ within the tumor microenvironment, we performed qPCR analysis of a select number of patient-derived GBM cell lines stimulated with IFNγ (n = 3). In all cell lines, NEAT1 was significantly upregulated in response to IFNγ stimulation (Fig. 4I). Higher levels of NEAT1 within the tumor microenvironment may therefore indicate the presence of active IFNγ signaling.
Figure 4.
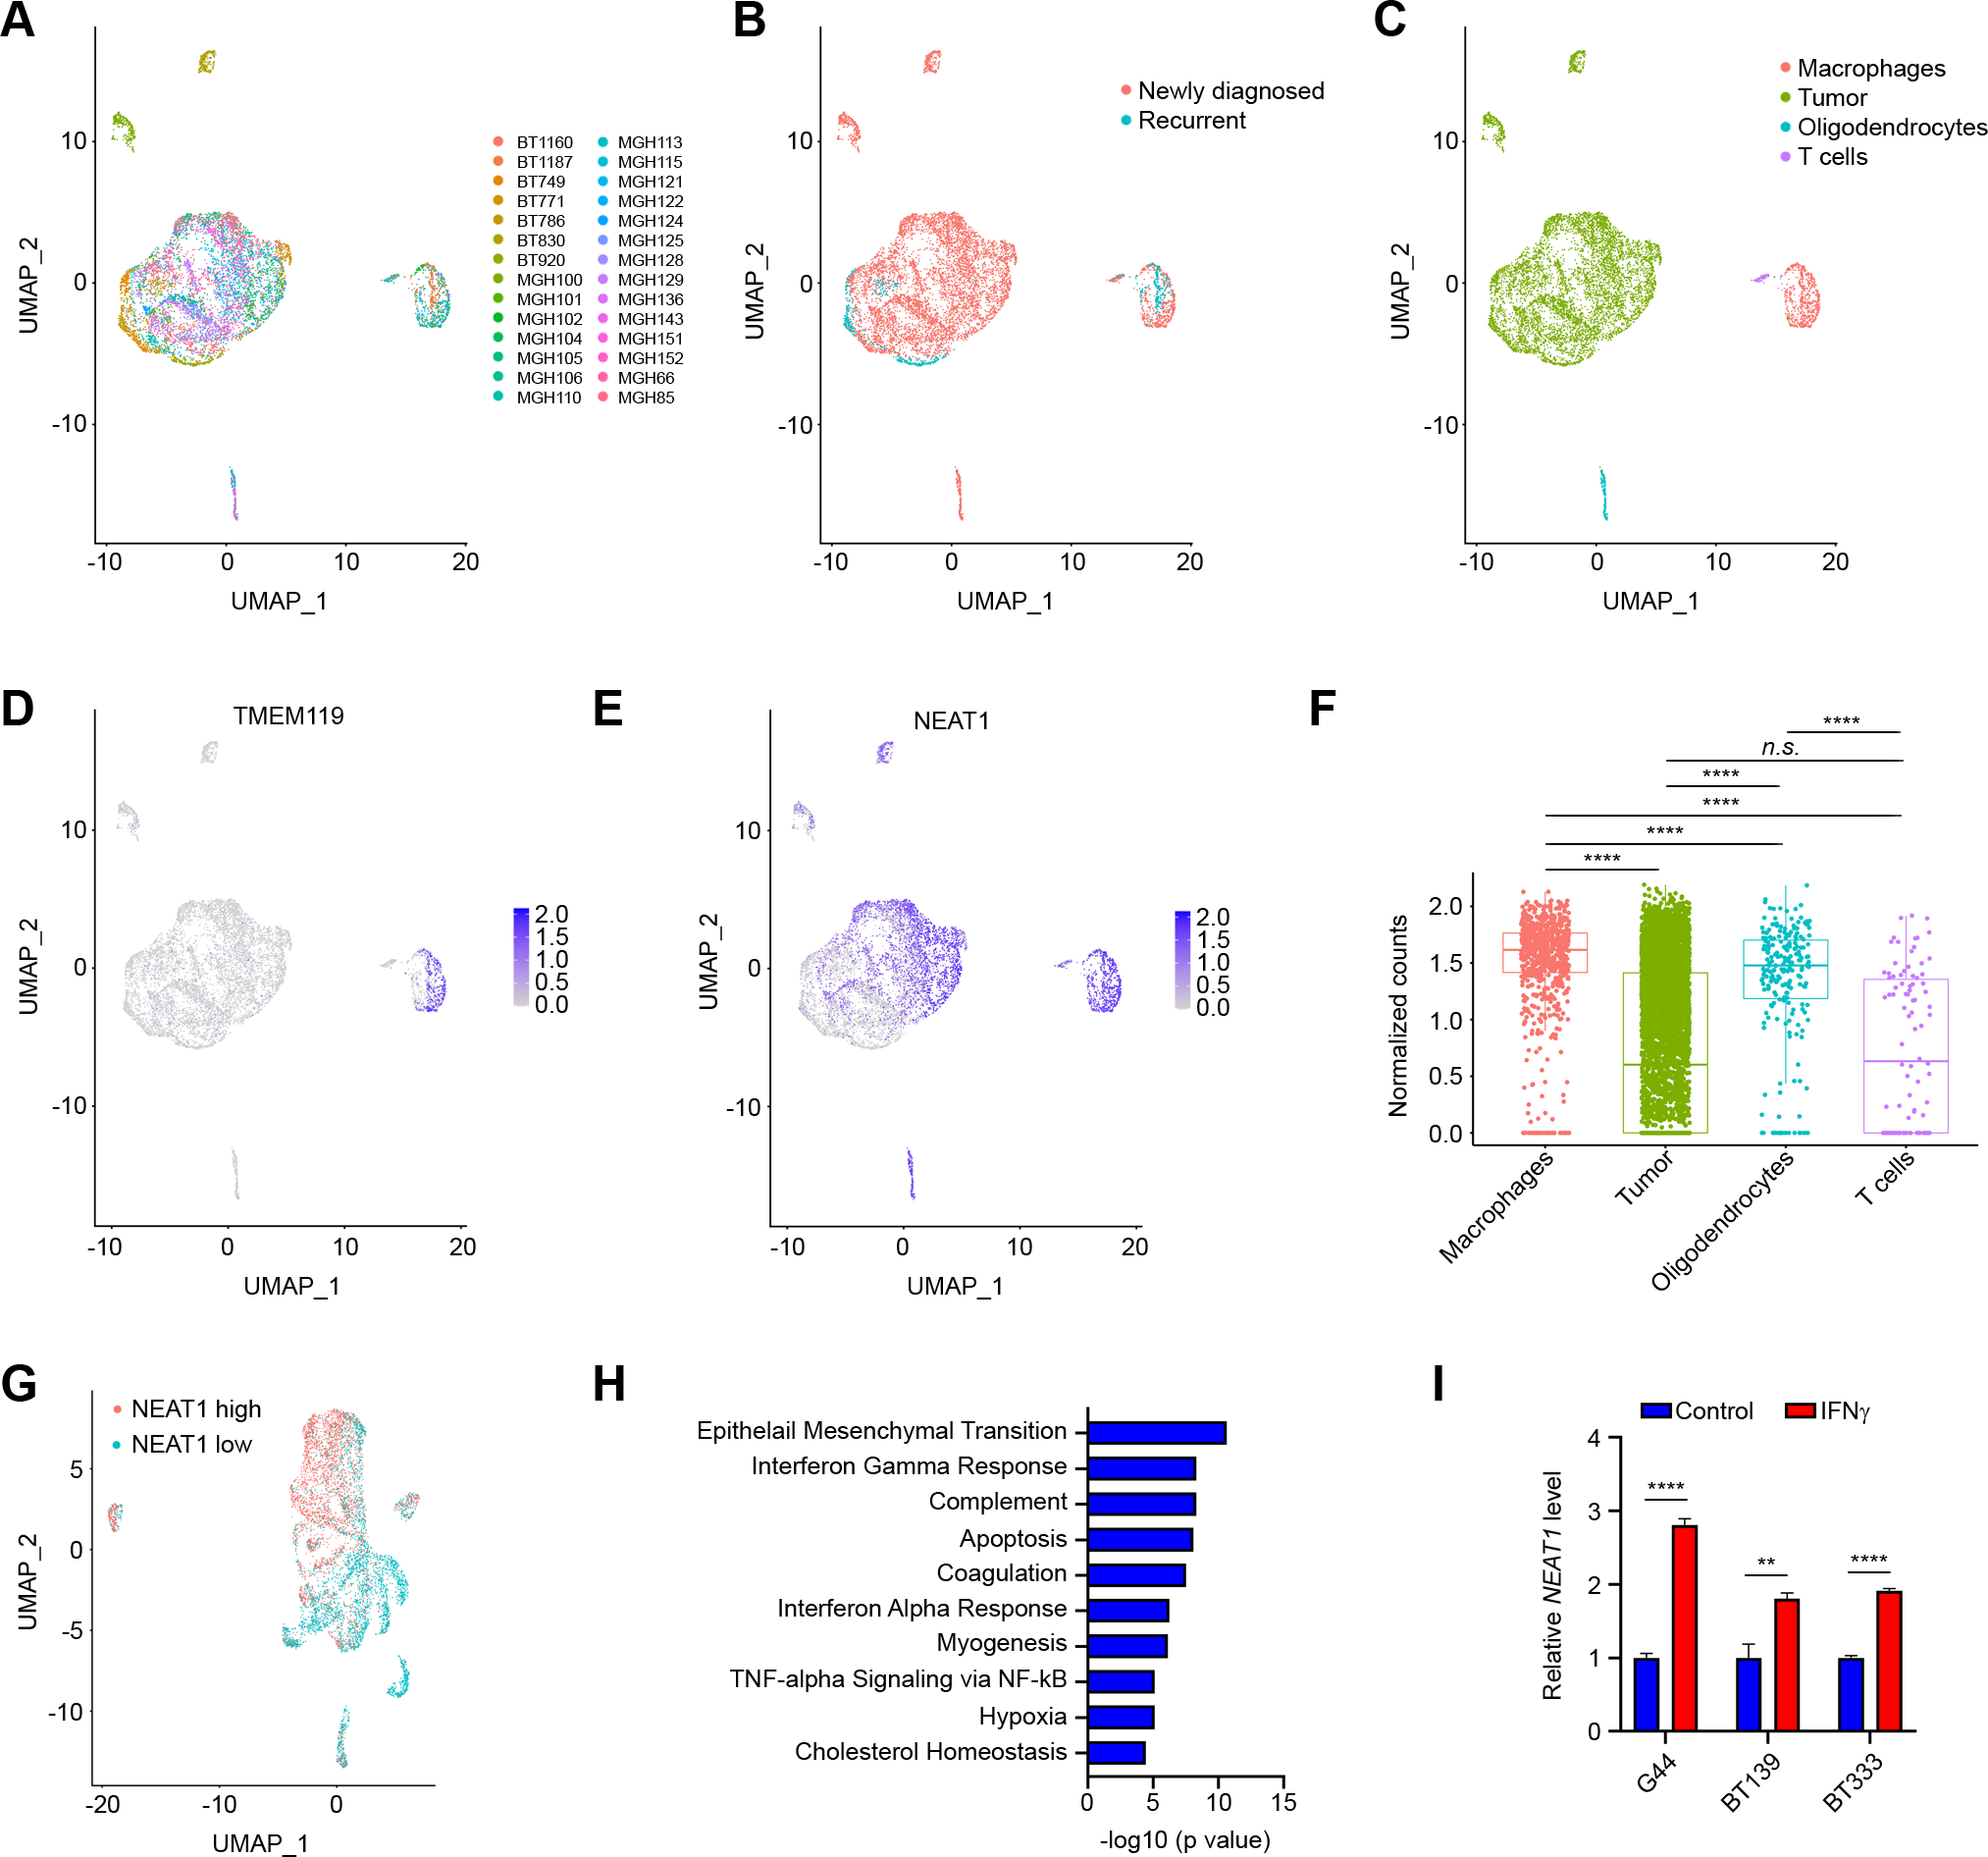
NEAT1 is expressed across the GBM tumor microenvironment. A, Uniform manifold approximation and projection (UMAP) visualization of 28 GBM patients colored based on patient ID (n = 7,930). B, UMAP visualization of single cells colored based on tumor type: newly diagnosed (red) and recurrent (blue). C, UMAP visualization of single cells colored based on the expression of marker genes for macrophages (red), tumor cells (green), oligodendrocytes (blue), or T cells (purple). D, UMAP visualization of TMEM119 expression in single cells. E, UMAP visualization of NEAT1 expression in single cells. F, Box plot of NEAT1 expression (normalized counts) between macrophages (red), tumor cells (green), oligodendrocytes (blue), or T cells (purple). Data were analyzed by Wilcoxon test: n.s. (non-significant), ****p < 0.0001. G, UMAP visualization of NEAT1-low (red) and NEAT1-high (blue) GBM cancer cells (n = 6,859). H, Analysis of pathways enriched in NEAT1-high GBM cancer cells. I, qRT-PCR analysis of NEAT1 expression in 3 unstimulated or IFNγ-stimulated (100 U/ml for 24 h) patient-derived GBM cell lines. Data were analyzed by unpaired t-test: **p < 0.01, ****p < 0.0001.
NEAT1 expression in GBM tumor cells is associated with increased infiltration of macrophages and microglia.
Since macrophages play an important role in the GBM tumor microenvironment and in the limited efficacy of immune checkpoint blockade against the disease (27), we subsequently assessed the association of NEAT1 expression in tumor cells with the number of infiltrating macrophages and microglia. For this analysis, we evaluated a separate single-cell RNA-seq dataset that included both newly diagnosed and recurrent GBMs in which all cells from the tumor microenvironment were retained (GEO: GSE182109) (20). We found that NEAT1 expression in tumor cells correlated with the number of macrophages infiltrating the tumor microenvironment (Supplementary Fig. S6A). On the contrary, no correlation between NEAT1 expression in tumor cells and infiltrating microglia was observed (Supplementary Fig. S6B). However, when newly diagnosed and recurrent GBM patients were analyzed separately, there was a positive correlation between recurrent tumor NEAT1 expression and the proportion of microglia infiltrates (Fig. 5A and 5B). In newly diagnosed GBMs, the number of infiltrating macrophages, but not microglia, correlated with NEAT1 expression in tumor cells (Supplementary Fig. S6C and S6D), Like the macrophages in the previously described single-cell dataset (GEO: GSE131928), most myeloid cells in this cohort expressed NEAT1. Therefore, we isolated and re-clustered the macrophage (Supplementary Fig. S6E and Fig. 5C) and the microglia (Supplementary Fig. S6F and Fig. 5D) populations and divided cells into two groups by median NEAT1 expression for pathway analysis. Of note, NEAT1-high macrophages and microglia clustered together and were strongly enriched for genes involved in TNF alpha/NFKB signaling in both newly diagnosed (Supplementary Fig. S6G and S6H) and recurrent (Fig. 5E and 5F) GBMs. Enriched genes associated with NEAT1 expression included transcription factors with important roles in inflammation (FOS, JUN), and several transcripts previously found in the bulk RNA-seq data (NAMPT, NFKBIA, BTG1, TNFAIP3, SOD2) (Supplementary Table S8). Collectively, these results suggest that GBM tumors with elevated NEAT1 expression are characterized by increased myeloid cell infiltration with upregulated inflammatory gene signature.
Figure 5.
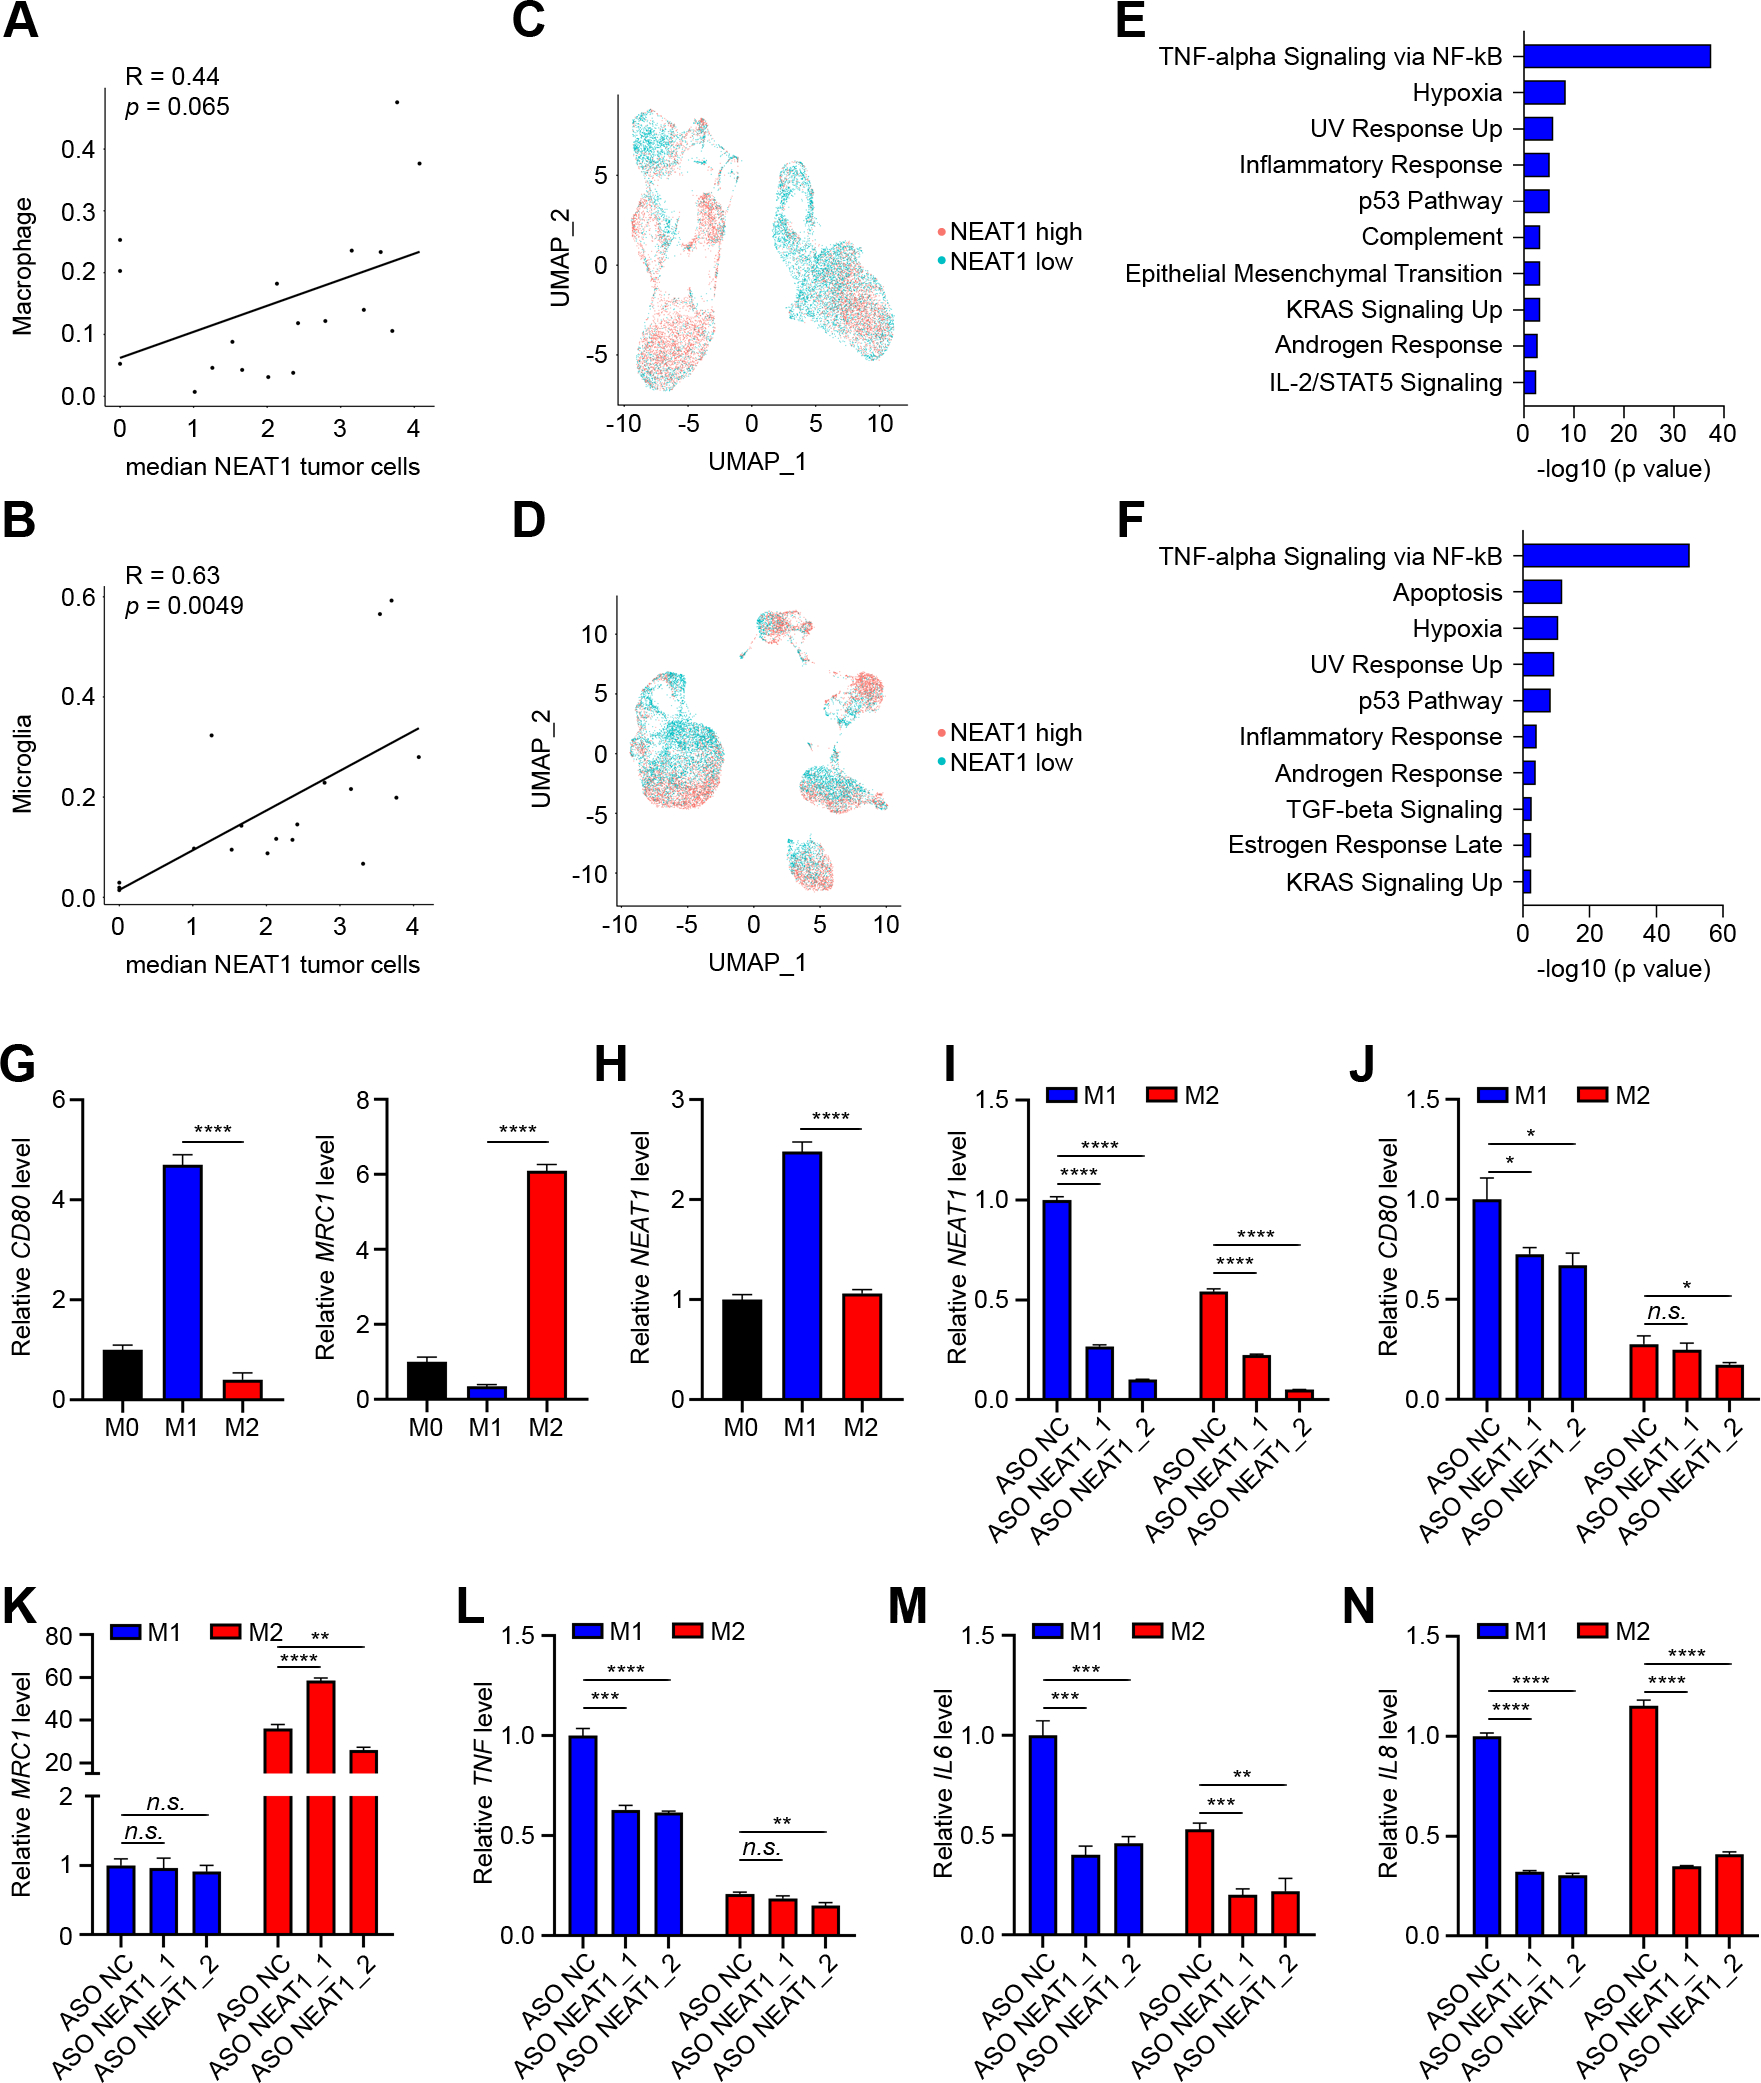
NEAT1 is differentially expressed between GBM tumor-associated macrophage subpopulations. A and B, Correlation of tumoral NEAT1 expression with number (as fraction of total cells in the sample) of macrophages (A) and microglia (B) infiltrates in recurrent GBMs. C and D, UMAP visualization of NEAT1-high (red) and NEAT1-low (blue) macrophages (n = 14,994 cells) (C) and microglia (n = 15,730 cells) (D) TAMs in recurrent GBMs. E and F, Analysis of pathways enriched in NEAT1-high macrophages (E) and microglia (F) TAMs in recurrent GBMs. G, qRT-PCR analysis of CD80 (left) and MRC1 (right) expression in THP-1 monocytic cells stimulated with PMA (M0 macrophages) and then polarized to M1 macrophages by stimulation with IFNγ and LPS or polarized to M2 by stimulation with IL4. H, qRT-PCR analysis of NEAT1 expression in M0, M1, and M2 differentiated macrophages. I-N, qRT-PCR analysis of NEAT1 (I), CD80 (J) MRC1 (K), TNF (L), IL6 (M), and IL8 (N) expression in M1 and M2 differentiated THP-1 macrophages transfected with LNA antisense oligonucleotide negative control (ASO NC) or two different LNA antisense oligonucleotides targeting NEAT1 (ASO NEAT1_1 and ASO NEAT1_2). Data were analyzed by unpaired t-test: n.s. (non-significant), *p < 0.05, **p < 0.01, ***p < 0.001, ****p < 0.0001.
NEAT1 regulates cytokine expression and macrophages polarization.
Macrophages are highly plastic cells that, in response to different stimuli, can present a diverse array of phenotypes, including the antitumor/pro-inflammatory or M1-like phenotype, and the protumor/anti-inflammatory or M2-like phenotype (28). To characterize how NEAT1 expression affects changes in macrophage polarization state, we first differentiated human THP-1 monocytes into M0 macrophages by stimulating them with PMA. We then obtained M1 and M2 polarization by incubating M0 THP-1 macrophages with IFNγ + LPS and IL4 respectively. Macrophage polarization was then assessed by qPCR analysis of the classical M1 marker, CD80, and M2 marker, MRC1 (Fig. 5G). We found that there was significantly higher NEAT1 expression in M1-like macrophages compared to M2-like macrophages (Fig. 5H). Silencing NEAT1 using two different ASOs resulted in a significant reduction in CD80 expression compared to the control ASO in M1-like macrophages with no variation in MRC1 levels (Fig. 5I and 5J). No consistent changes in CD80 and MRC1 levels were observed in M2-like differentiated macrophages (Fig. 5J and 5K). Moreover, compared to the control ASO, ASOs targeting NEAT1 significantly reduced the expression of TNF in M1-like macrophages and the expression of IL6 and IL8 in both M1-like and M2-like macrophages (Fig. 5L–N). Together, these results highlight the importance of NEAT1 expression in the phenotypic polarization of macrophages.
DISCUSSION
Monoclonal antibodies targeting PD-1 have been demonstrated to elicit an effective anti-tumor immune response in a certain subset of cancer patients (29). However, durable responses are rare across several cancer types, underscoring the need for biomarkers that can help identify patients who may best benefit from ICB. LncRNAs are critical regulators of gene expression in several biological processes, including immunity (14,17). There is growing evidence that lncRNAs are frequently deregulated during tumor development and may be associated with prognosis for multiple cancer types (30). LncRNA signatures have recently been constructed to help predict patient response to immunotherapy (31,32). However, these lncRNA signatures are tumor type-specific, and to our knowledge, no single lncRNA has been reported to be commonly enriched in responders across multiple cancers. In this study, we investigated the complete lncRNA transcriptome of melanoma and GBM pre-treatment fresh-frozen tumor samples to identify lncRNA transcripts that are associated with immunotherapy response. Our analysis revealed differential expression of several lncRNAs in responder tumors compared to non-responders. Among the commonly deregulated lncRNAs in melanoma and GBM, we identified NEAT1 (Nuclear Enriched Abundant Transcript 1) as the most abundant lncRNA exhibiting high expression in patients with better response to anti-PD-1 treatment. NEAT1 is a lncRNA widely expressed in multiple cell types and is a crucial component of the paraspeckles, subnuclear bodies enriched in various RNAs and proteins involved in gene expression regulation (33). By regulating paraspeckle formation, NEAT1 can influence immune cell differentiation and promote inflammation (23,34). In cancer, elevated expression of NEAT1 has been associated with increased tumor growth and resistance to chemotherapy (35). However, the effects of NEAT1 expression in the context of ICB therapy are still unknown.
Here we show that high levels of NEAT1 in tumors were associated with increased activation of the IFNγ and inflammatory pathways. In contrast, NEAT1 was negatively associated with cell cycle gene expression, including the “MYC targets” gene set. These results are in line with previous findings showing c-Myc as a negative regulator of NEAT1 expression (36). Notably, single-cell RNA-seq analysis confirmed that, compared to GBM cancer cells with low NEAT1 expression, GBM cancer cells with high NEAT1 expression demonstrated upregulation of the IFNγ pathway. Using patient-derived GBM cell lines, we showed that this is in part due to the upregulation of NEAT1 in response to IFNγ stimulation.
IFNγ is a pleiotropic cytokine with an important role in promoting immune responses against tumor cells (37). In the tumor microenvironment, natural killer (NK) cells and CD8+/CD4+ T lymphocytes are the main producers of IFNγ, which recruits various immune cells to the tumor site and promotes their activation (38). Interaction of IFNγ with its receptor IFNGR, which is expressed on the surface of nearly all types of cells, activates the JAK/STAT signal transduction pathway (39). This, in turn, promotes the expression of several IFNγ-stimulated genes (ISGs) with important anti-tumor functions (40). Our analysis showed IL15 and CIITA as the two ISGs that most correlated with NEAT1 expression in both melanoma and GBM. IL15, a cytokine that shares similar functions with IL2, was shown to promote T and NK cell expansion, maturation, and cytotoxic functions (41). The ability of IL15 to boost the immune system’s response to cancer has made it a promising immunotherapeutic agent (41). CIITA is a transactivator of MHC-II, whose expression in tumor cells has been shown to turn the tumor microenvironment from “non-inflamed or cold” to “inflamed or hot,” with increased infiltration of T cells (42). NEAT1 expression may therefore indicate active tumor interferon signaling, leading to an inflamed tumor phenotype necessary for clinical activity of anti-PD-1 ICB.
The importance of interferon signaling in patient response to ICB therapy has been reported in several studies. Zaretsky and colleagues identified mutations in the JAK1 and JAK2 genes as the driver cause of acquired resistance to anti-PD-1 therapy in metastatic melanoma (7). In GBM, patients with superior response to anti-PD-1 treatment exhibited a transcriptional increase in genes related to the IFNγ pathway, whereas non-responding patients demonstrated enrichment of cell cycle-related genes (24). IFNγ gene signatures have also been shown to predict response to agents targeting the PD-1 pathway in multiple cancers, including melanoma and head and neck squamous cell carcinomas, using a Nanostring platform and formalin-fixed, paraffin-embedded (FFPE) tissues (43). Our results suggest that NEAT1 may be utilized in addition to IFNγ signatures to predict response to ICB in samples analyzed by RNA-seq and potentially other methods, including quantitative PCR and gene arrays. RNA-seq provides a more detailed view of gene expression compared to low-throughput methods and microarray technologies (44). However, RNA quality remains a limiting factor that could influence measurements of expression levels. Formalin fixation of tissues is known to degrade RNA, which limits the detection of genes (45). Moreover, a comparison of formalin-fixed and fresh-frozen tissues suggested that longer transcripts are less stable than small RNAs (46). The NEAT1 gene produces two different isoforms, a 3,700 nucleotide transcript (NEAT1_1) and a 22,700 nucleotide transcript (NEAT1_2) (33). We observed that the number of NEAT1 reads was dramatically decreased in FFPE tissues compared to fresh-frozen samples. These results support the use of fresh-frozen tumor samples for the analysis of NEAT1 expression by RNA-seq. However, this has limited the number of patients and datasets we could include in our study. While the available sample size may have affected the number of potential lncRNA biomarkers identified, it was sufficient to find a statistically significant association between NEAT1 expression and anti-PD-1/PD-L1 response in the three independent datasets analyzed.
Our single-cell analysis also revealed NEAT1 expression in tumor immune infiltrates, particularly in tumor-associated macrophages (TAMs). Expression of NEAT1 in macrophages was shown to regulate the activation of several inflammasomes (23). In GBM, TAM populations, composed of tissue-resident microglia and tissue-invading monocyte-derived macrophages, represent the most abundant cellular component of the GBM immune microenvironment (47). Within the GBM microenvironment, TAMs undergo functional changes and polarization to an M2-like phenotype, which renders them pro-tumorigenic and immunosuppressive (48). In contrast, M1-like macrophages are pro-inflammatory and exhibit antitumor activity (28). Analyzing the GBM TAMs, we observed a significant correlation between tumor NEAT1 expression and infiltrating macrophages in newly diagnosed GBMs, and a significant correlation between tumor NEAT1 expression and infiltrating microglia in recurrent GBMs. Increased microglia infiltrates in the microenvironment of recurrent GBMs have been recently shown to predict survival in anti-PD-1 treated patients (49). NEAT1-high TAMs showed significant activation of TNFα/NF-kB signaling, which controls the inflammatory activity of macrophages. Notably, NEAT1 expression positively correlated with genes associated with both an M1-like and an M2-like phenotype. This corroborates previous findings showing that TAM polarization in GBM encompasses M1 and M2 features, including expression changes associated with chronic inflammatory stimuli (47). Moreover, our macrophage polarization experiments showed higher NEAT1 expression in M1-like differentiated macrophages. Silencing NEAT1 suppressed M1 polarization and reduced TNFα expression, along with cytokines produced in both M1 and M2 macrophages.
Taken together, our results suggest that active IFNγ signaling within the tumor microenvironment induces the expression of NEAT1 in both tumor cells and TAMs. This, in turn, promotes macrophage polarization to a more M1-like phenotype and the secretion of inflammatory cytokines (Fig. 6). Therefore, NEAT1 may play a central role in shaping the tumor-immune microenvironment and render tumors more responsive to ICB therapy. Further studies aimed at dissecting the mechanisms by which NEAT1 regulates cell phenotypes might result in the development of novel approaches to improve patient response to ICB and potentially other immunotherapies.
Figure 6.
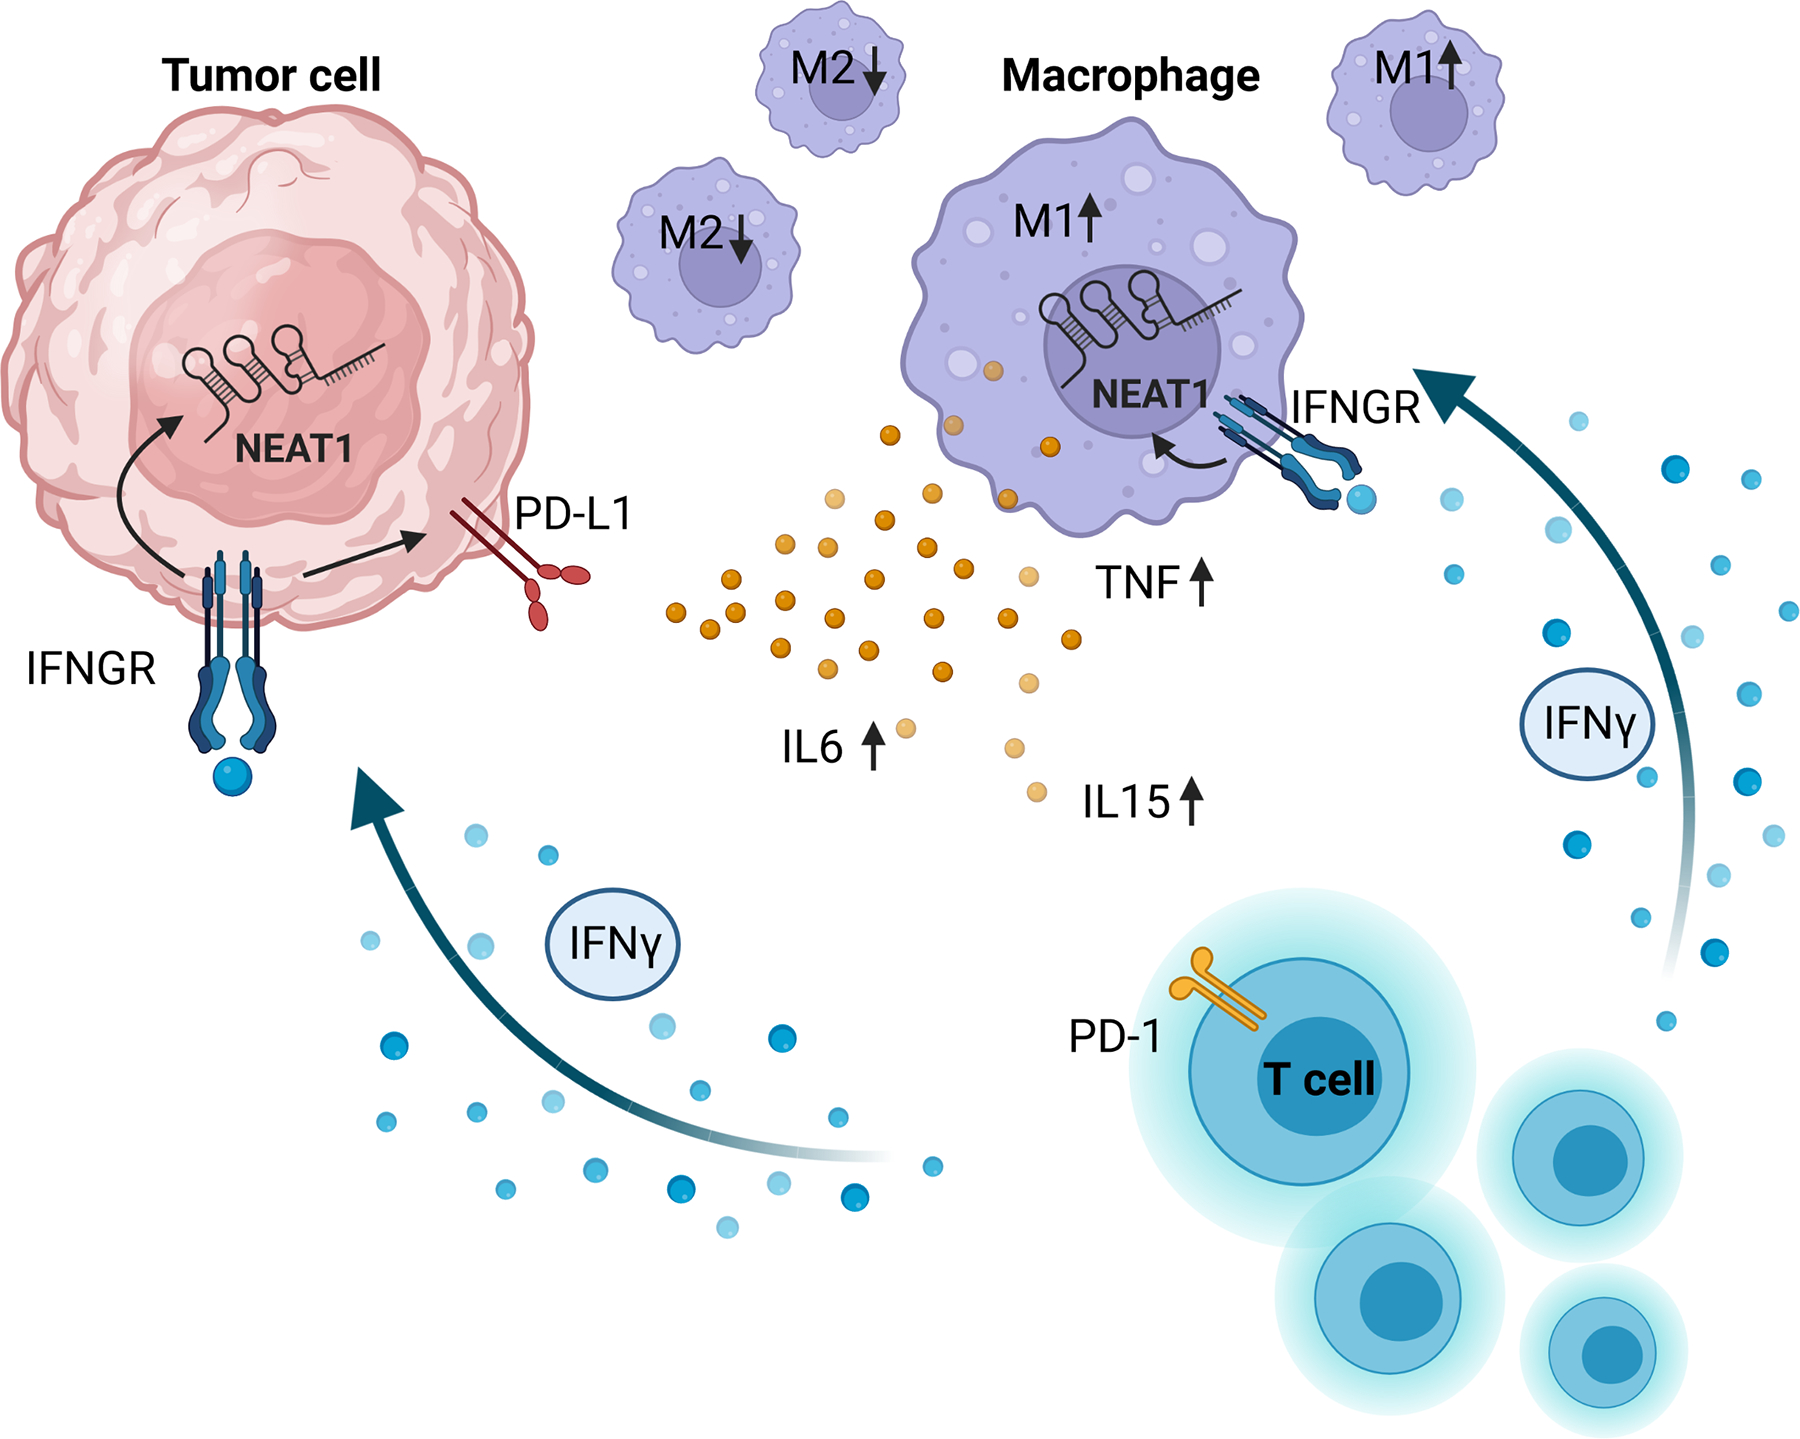
Proposed mechanism of NEAT1 expression in the tumor microenvironment. T cells infiltrating the tumor microenvironment secrete IFNγ, which will stimulate the expression of NEAT1 in tumor cells and tumor associated macrophages. Increased expression of NEAT1 in macrophages promotes M1-like polarization and secretion of inflammatory cytokines.
Supplementary Material
TRANSLATIONAL RELEVANCE:
While immune checkpoint blockade (ICB) has led to therapeutic breakthroughs in several cancers, the molecular basis of patient response to this type of therapy remains poorly understood. Long non-coding RNAs (lncRNAs) are major regulators of several biological processes and control antitumor immune response. Therefore, we hypothesized that clinical response to ICB could be associated with the expression of specific lncRNAs. In this study, expression of the lncRNA NEAT1 was associated with improved outcomes in melanoma and GBM patients receiving anti-PD-1/PD-L1 therapy. Tumor specimens with high NEAT1 expression were enriched for genes involved in interferon-gamma signaling, which plays a critical role in antitumor immunity. NEAT1 was found to be expressed in both malignant and immune cells within the GBM microenvironment, and high intratumoral NEAT1 levels were linked to increased infiltration of myeloid cells. NEAT1 may therefore be used as a biomarker to identify cancer patients that may benefit from ICB therapy.
ACKNOWLEDGMENTS
This work was supported by the BWH program for interdisciplinary neurosciences 2019 pilot project grant program and the Brigham Research Institute Fund to sustain research excellence (to MM), the Harvard College Research Program and award number T32GM144273 from the National Institutes of General Medical Science (to JT), the NREF fellowship grant (to GRV), NIH K12CA090354, Conquer Cancer Foundation/Sontag Foundation, and Brigham Research Institute NextGen award (to JBI), The Jennifer Oppenheimer Cancer Research Initiative, The Ben and Catherine Ivy Foundation, Hope It’s A Beach Thing, and the Pan Mass Challenge (Erica’s Entourage and CRUS11TOUR) (to DAR), NIH P01CA236749 (to CJW, DAR, EAC). This work is partially supported by the Broad/IBM Cancer Resistance Research Project (GG and LP). We thank Conor Messer, Kristy Schlueter-Kuck, Raquel Jacobs, Kara Slowik, Sam Pollock, Fanny Dao, Brian Danysh, Ignaty Leschiner, Filippo Utro, Chaya Levovitz, Kahn Rhrissorrakrai, William Pisano, Emily Lapinskas, Karen Bryan, Sebastian Valentin, and Sean Eddy for assistance and helpful discussions. We thank Robert Prins for sharing the clinical metadata related to the GBM study (GEO: GSE121810). We also thank Kyuson Yun and Nourhan Abdelfattah for sharing the cluster metadata related to the GBM single-cell sequencing study.
Footnotes
Conflict of interest:
Marco Mineo and E. Antonio Chiocca are inventors on a patent application covering the use of NEAT1 as a method for predicting treatment outcome to checkpoint inhibitors in cancer.
Disclaimer
The content is solely the responsibility of the authors and does not necessarily represent the official views of the National Institute of General Medical Sciences or the National Institutes of Health.
REFERENCES
- 1.Lamba N, Ott PA, Iorgulescu JB. Use of First-Line Immune Checkpoint Inhibitors and Association With Overall Survival Among Patients With Metastatic Melanoma in the Anti-PD-1 Era. JAMA Netw Open 2022;5:e2225459. [DOI] [PMC free article] [PubMed] [Google Scholar]
- 2.Beatty GL, Gladney WL. Immune escape mechanisms as a guide for cancer immunotherapy. Clin Cancer Res 2015;21:687–92 [DOI] [PMC free article] [PubMed] [Google Scholar]
- 3.Ribas A Adaptive Immune Resistance: How Cancer Protects from Immune Attack. Cancer Discov 2015;5:915–9 [DOI] [PMC free article] [PubMed] [Google Scholar]
- 4.Topalian SL, Hodi FS, Brahmer JR, Gettinger SN, Smith DC, McDermott DF, et al. Safety, activity, and immune correlates of anti-PD-1 antibody in cancer. N Engl J Med 2012;366:2443–54 [DOI] [PMC free article] [PubMed] [Google Scholar]
- 5.Haslam A, Gill J, Prasad V. Estimation of the Percentage of US Patients With Cancer Who Are Eligible for Immune Checkpoint Inhibitor Drugs. JAMA Netw Open 2020;3:e200423. [DOI] [PMC free article] [PubMed] [Google Scholar]
- 6.Iorgulescu JB, Braun D, Oliveira G, Keskin DB, Wu CJ. Acquired mechanisms of immune escape in cancer following immunotherapy. Genome Med 2018;10:87. [DOI] [PMC free article] [PubMed] [Google Scholar]
- 7.Zaretsky JM, Garcia-Diaz A, Shin DS, Escuin-Ordinas H, Hugo W, Hu-Lieskovan S, et al. Mutations Associated with Acquired Resistance to PD-1 Blockade in Melanoma. N Engl J Med 2016;375:819–29 [DOI] [PMC free article] [PubMed] [Google Scholar]
- 8.Khasraw M, Reardon DA, Weller M, Sampson JH. PD-1 Inhibitors: Do they have a Future in the Treatment of Glioblastoma? Clin Cancer Res 2020;26:5287–96 [DOI] [PMC free article] [PubMed] [Google Scholar]
- 9.Lim M, Weller M, Idbaih A, Steinbach J, Finocchiaro G, Raval RR, et al. Phase III trial of chemoradiotherapy with temozolomide plus nivolumab or placebo for newly diagnosed glioblastoma with methylated MGMT promoter. Neuro Oncol 2022;24:1935–49 [DOI] [PMC free article] [PubMed] [Google Scholar]
- 10.Reardon DA, Brandes AA, Omuro A, Mulholland P, Lim M, Wick A, et al. Effect of Nivolumab vs Bevacizumab in Patients With Recurrent Glioblastoma: The CheckMate 143 Phase 3 Randomized Clinical Trial. JAMA Oncol 2020;6:1003–10 [DOI] [PMC free article] [PubMed] [Google Scholar]
- 11.Akintola OO, Reardon DA. The Current Landscape of Immune Checkpoint Blockade in Glioblastoma. Neurosurg Clin N Am 2021;32:235–48 [DOI] [PubMed] [Google Scholar]
- 12.Ito H, Nakashima H, Chiocca EA. Molecular responses to immune checkpoint blockade in glioblastoma. Nat Med 2019;25:359–61 [DOI] [PMC free article] [PubMed] [Google Scholar]
- 13.Jiang S, Cheng SJ, Ren LC, Wang Q, Kang YJ, Ding Y, et al. An expanded landscape of human long noncoding RNA. Nucleic Acids Res 2019;47:7842–56 [DOI] [PMC free article] [PubMed] [Google Scholar]
- 14.Geisler S, Coller J. RNA in unexpected places: long non-coding RNA functions in diverse cellular contexts. Nat Rev Mol Cell Biol 2013;14:699–712 [DOI] [PMC free article] [PubMed] [Google Scholar]
- 15.Prensner JR, Chinnaiyan AM. The emergence of lncRNAs in cancer biology. Cancer Discov 2011;1:391–407 [DOI] [PMC free article] [PubMed] [Google Scholar]
- 16.Mineo M, Lyons SM, Zdioruk M, von Spreckelsen N, Ferrer-Luna R, Ito H, et al. Tumor Interferon Signaling Is Regulated by a lncRNA INCR1 Transcribed from the PD-L1 Locus. Mol Cell 2020;78:1207–23 e8 [DOI] [PMC free article] [PubMed] [Google Scholar]
- 17.Fitzgerald KA, Caffrey DR. Long noncoding RNAs in innate and adaptive immunity. Curr Opin Immunol 2014;26:140–6 [DOI] [PMC free article] [PubMed] [Google Scholar]
- 18.Love MI, Huber W, Anders S. Moderated estimation of fold change and dispersion for RNA-seq data with DESeq2. Genome Biol 2014;15:550. [DOI] [PMC free article] [PubMed] [Google Scholar]
- 19.Hao Y, Hao S, Andersen-Nissen E, Mauck WM 3rd, Zheng S, Butler A, et al. Integrated analysis of multimodal single-cell data. Cell 2021;184:3573–87 e29 [DOI] [PMC free article] [PubMed] [Google Scholar]
- 20.Abdelfattah N, Kumar P, Wang C, Leu JS, Flynn WF, Gao R, et al. Single-cell analysis of human glioma and immune cells identifies S100A4 as an immunotherapy target. Nat Commun 2022;13:767. [DOI] [PMC free article] [PubMed] [Google Scholar]
- 21.Liberzon A, Birger C, Thorvaldsdottir H, Ghandi M, Mesirov JP, Tamayo P. The Molecular Signatures Database (MSigDB) hallmark gene set collection. Cell Syst 2015;1:417–25 [DOI] [PMC free article] [PubMed] [Google Scholar]
- 22.Hugo W, Zaretsky JM, Sun L, Song C, Moreno BH, Hu-Lieskovan S, et al. Genomic and Transcriptomic Features of Response to Anti-PD-1 Therapy in Metastatic Melanoma. Cell 2016;165:35–44 [DOI] [PMC free article] [PubMed] [Google Scholar]
- 23.Zhang P, Cao L, Zhou R, Yang X, Wu M. The lncRNA Neat1 promotes activation of inflammasomes in macrophages. Nat Commun 2019;10:1495. [DOI] [PMC free article] [PubMed] [Google Scholar]
- 24.Cloughesy TF, Mochizuki AY, Orpilla JR, Hugo W, Lee AH, Davidson TB, et al. Neoadjuvant anti-PD-1 immunotherapy promotes a survival benefit with intratumoral and systemic immune responses in recurrent glioblastoma. Nat Med 2019;25:477–86 [DOI] [PMC free article] [PubMed] [Google Scholar]
- 25.Brennan CW, Verhaak RG, McKenna A, Campos B, Noushmehr H, Salama SR, et al. The somatic genomic landscape of glioblastoma. Cell 2013;155:462–77 [DOI] [PMC free article] [PubMed] [Google Scholar]
- 26.Neftel C, Laffy J, Filbin MG, Hara T, Shore ME, Rahme GJ, et al. An Integrative Model of Cellular States, Plasticity, and Genetics for Glioblastoma. Cell 2019;178:835–49 e21 [DOI] [PMC free article] [PubMed] [Google Scholar]
- 27.Saha D, Martuza RL, Rabkin SD. Macrophage Polarization Contributes to Glioblastoma Eradication by Combination Immunovirotherapy and Immune Checkpoint Blockade. Cancer Cell 2017;32:253–67 e5 [DOI] [PMC free article] [PubMed] [Google Scholar]
- 28.Murray PJ, Allen JE, Biswas SK, Fisher EA, Gilroy DW, Goerdt S, et al. Macrophage activation and polarization: nomenclature and experimental guidelines. Immunity 2014;41:14–20 [DOI] [PMC free article] [PubMed] [Google Scholar]
- 29.Tang Q, Chen Y, Li X, Long S, Shi Y, Yu Y, et al. The role of PD-1/PD-L1 and application of immune-checkpoint inhibitors in human cancers. Front Immunol 2022;13:964442. [DOI] [PMC free article] [PubMed] [Google Scholar]
- 30.Qian Y, Shi L, Luo Z. Long Non-coding RNAs in Cancer: Implications for Diagnosis, Prognosis, and Therapy. Front Med (Lausanne) 2020;7:612393. [DOI] [PMC free article] [PubMed] [Google Scholar]
- 31.Xue L, Wu P, Zhao X, Jin X, Wang J, Shi Y, et al. Using Immune-Related lncRNA Signature for Prognosis and Response to Immunotherapy in Cutaneous Melanoma. Int J Gen Med 2021;14:6463–75 [DOI] [PMC free article] [PubMed] [Google Scholar]
- 32.Zhou JG, Liang B, Liu JG, Jin SH, He SS, Frey B, et al. Identification of 15 lncRNAs Signature for Predicting Survival Benefit of Advanced Melanoma Patients Treated with Anti-PD-1 Monotherapy. Cells 2021;10. [DOI] [PMC free article] [PubMed] [Google Scholar]
- 33.Yamazaki T, Souquere S, Chujo T, Kobelke S, Chong YS, Fox AH, et al. Functional Domains of NEAT1 Architectural lncRNA Induce Paraspeckle Assembly through Phase Separation. Mol Cell 2018;70:1038–53 e7 [DOI] [PubMed] [Google Scholar]
- 34.Shui X, Chen S, Lin J, Kong J, Zhou C, Wu J. Knockdown of lncRNA NEAT1 inhibits Th17/CD4(+) T cell differentiation through reducing the STAT3 protein level. J Cell Physiol 2019;234:22477–84 [DOI] [PubMed] [Google Scholar]
- 35.Dong P, Xiong Y, Yue J, Hanley SJB, Kobayashi N, Todo Y, et al. Long Non-coding RNA NEAT1: A Novel Target for Diagnosis and Therapy in Human Tumors. Front Genet 2018;9:471. [DOI] [PMC free article] [PubMed] [Google Scholar]
- 36.Zeng C, Liu S, Lu S, Yu X, Lai J, Wu Y, et al. The c-Myc-regulated lncRNA NEAT1 and paraspeckles modulate imatinib-induced apoptosis in CML cells. Mol Cancer 2018;17:130. [DOI] [PMC free article] [PubMed] [Google Scholar]
- 37.Ikeda H, Old LJ, Schreiber RD. The roles of IFN gamma in protection against tumor development and cancer immunoediting. Cytokine Growth Factor Rev 2002;13:95–109 [DOI] [PubMed] [Google Scholar]
- 38.Burke JD, Young HA. IFN-gamma: A cytokine at the right time, is in the right place. Semin Immunol 2019;43:101280. [DOI] [PMC free article] [PubMed] [Google Scholar]
- 39.Majoros A, Platanitis E, Kernbauer-Holzl E, Rosebrock F, Muller M, Decker T. Canonical and Non-Canonical Aspects of JAK-STAT Signaling: Lessons from Interferons for Cytokine Responses. Front Immunol 2017;8:29. [DOI] [PMC free article] [PubMed] [Google Scholar]
- 40.Cheon H, Borden EC, Stark GR. Interferons and their stimulated genes in the tumor microenvironment. Semin Oncol 2014;41:156–73 [DOI] [PMC free article] [PubMed] [Google Scholar]
- 41.Pilipow K, Roberto A, Roederer M, Waldmann TA, Mavilio D, Lugli E. IL15 and T-cell Stemness in T-cell-Based Cancer Immunotherapy. Cancer Res 2015;75:5187–93 [DOI] [PMC free article] [PubMed] [Google Scholar]
- 42.Accolla RS, Ramia E, Tedeschi A, Forlani G. CIITA-Driven MHC Class II Expressing Tumor Cells as Antigen Presenting Cell Performers: Toward the Construction of an Optimal Anti-tumor Vaccine. Front Immunol 2019;10:1806. [DOI] [PMC free article] [PubMed] [Google Scholar]
- 43.Ayers M, Lunceford J, Nebozhyn M, Murphy E, Loboda A, Kaufman DR, et al. IFN-gamma-related mRNA profile predicts clinical response to PD-1 blockade. J Clin Invest 2017;127:2930–40 [DOI] [PMC free article] [PubMed] [Google Scholar]
- 44.Kukurba KR, Montgomery SB. RNA Sequencing and Analysis. Cold Spring Harb Protoc 2015;2015:951–69 [DOI] [PMC free article] [PubMed] [Google Scholar]
- 45.Evers DL, Fowler CB, Cunningham BR, Mason JT, O’Leary TJ. The effect of formaldehyde fixation on RNA: optimization of formaldehyde adduct removal. J Mol Diagn 2011;13:282–8 [DOI] [PMC free article] [PubMed] [Google Scholar]
- 46.Xi Y, Nakajima G, Gavin E, Morris CG, Kudo K, Hayashi K, et al. Systematic analysis of microRNA expression of RNA extracted from fresh frozen and formalin-fixed paraffin-embedded samples. RNA 2007;13:1668–74 [DOI] [PMC free article] [PubMed] [Google Scholar]
- 47.Klemm F, Maas RR, Bowman RL, Kornete M, Soukup K, Nassiri S, et al. Interrogation of the Microenvironmental Landscape in Brain Tumors Reveals Disease-Specific Alterations of Immune Cells. Cell 2020;181:1643–60 e17 [DOI] [PMC free article] [PubMed] [Google Scholar]
- 48.Wildes TJ, DiVita Dean B, Flores CT. Myelopoiesis during Solid Cancers and Strategies for Immunotherapy. Cells 2021;10. [DOI] [PMC free article] [PubMed] [Google Scholar]
- 49.Arrieta VA, Chen AX, Kane JR, Kang SJ, Kassab C, Dmello C, et al. ERK1/2 phosphorylation predicts survival following anti-PD-1 immunotherapy in recurrent glioblastoma. Nat Cancer 2021;2:1372–86 [DOI] [PMC free article] [PubMed] [Google Scholar]
Associated Data
This section collects any data citations, data availability statements, or supplementary materials included in this article.
Supplementary Materials
Data Availability Statement
The data generated in this study are available upon request from the corresponding author. Melanoma and Glioblastoma datasets are publicly available in Gene Expression Omnibus (GEO) at GSE78220, GSE121810, GSE131928, and GSE182109.