

Abstract
Purpose:
To develop a 3D downfield magnetic resonance spectroscopic imaging (DF-MRSI) protocol with whole brain coverage and post-processing pipeline for creation of metabolite maps.
Methods:
A 3D, circularly phase-encoded version of the previously developed 2D DF-MRSI sequence with spectral-spatial excitation and frequency selective refocusing was implemented and tested in 5 healthy volunteers at 3T. Downfield metabolite maps with a nominal spatial resolution of 0.7 cm3 were recorded in 8 slices at 3T in a scan time of 22m 40s. An MRSI post-processing pipeline was developed to create DF metabolite maps. Metabolite concentrations and uncertainty estimates were compared between region differences for nine downfield peaks.
Results:
LCModel analysis showed CRLB average values of 3–4% for protein amide resonances in the three selected regions (anterior cingulate (ACC), dorsolateral prefrontal cortex (DLPFC), and centrum semiovale (CSO)); CRLBs were somewhat higher for individual peaks but for the most part were less than 20%. While DF concentration maps were visually quite homogeneous throughout the brain, general linear regression analysis corrected for multiple comparisons found significant differences between CSO and DLPFC for peaks at 7.09 ppm (p= 0.014), 7.90 ppm (p=0.009), 8.18 ppm (p=0.009), combined amides (p=0.009), and between ACC and DLPFC for the 7.30 ppm peak (p=0.020). CRLB values were not significantly different between brain regions for any of the DF peaks.
Conclusion:
3D DF-MRSI of the human brain at 3T with wide spatial coverage for the mapping of exchangeable amide and other resonances is feasible at a nominal spatial resolution of 0.7 cm3.
Introduction
In proton magnetic resonance spectroscopy (MRS) of the human brain, signals occur both upfield (UF) and downfield (DF) from the water resonance (1). A variety of compounds with aromatic or exchangeable (e.g. amine, amide, hydroxyl) groups resonate in the DF region (2). The amide protons of mobile proteins and N-acetylaspartate (NAA) are usually the most prominent DF signals in brain, but signals from ATP, histidine, homocarnosine, phenylalanine, glucose, glutathione, and nicotinamide adenine dinucleotide (NAD) are also known to be present and resonate in the DF region of the proton spectrum (3). Recently, small signals from I-tryptophan, a precursor of NAD(+) and serotonin syntheses, were also observed in DF MRS (4).
Although there have been comparatively few prior research studies using DF MRS (5–9), there are some indications of potential in either clinical or preclinical applications. For instance, DF MRS has shown metabolic changes compared to normal brain in a murine brain glioma model (10), and changes in phenylalanine levels measured in patients with phenylketonuria (11). Also, estimations of brain pH have been shown to be feasible using the pH-dependence of the imidazole group resonances of histidine, with histidine levels increased using oral histidine supplementation (12).
Optimized detection of DF resonances depends on several factors: short echo time (TE) is important for minimization of T2 losses, since DF peaks typically have short apparent T2 relaxation times (13) including the effects of chemical exchange. In addition, since DF T1 relaxation times are also quite short (14), sensitivity can be enhanced by minimizing repetition times (TR) and also making use of the ‘relaxation enhancement’ effect due to chemical exchange or cross-relaxation (15, 24). A factor of critical importance is to avoid saturation of the water signal (e.g. as is commonly used in UF MRS for water suppression) so that the DF resonances are not saturated via exchange; one way of avoiding water pre-saturation while still removing the water signal from the final spectrum is to use the metabolite cycling methods (16,17). However, other techniques are possible including spectral-selective excitation (18,19).
Most prior DF MRS studies have used single voxel (SV) spatial localization (2,3,13,14,20–22). While SV MRS is usually rapid and generates high quality spectra, it does become prohibitively time-consuming and inefficient when multiple brain regions need to be measured. Recently, a single slice 2D MR spectroscopic imaging (MRSI) study of the DF resonances in normal human brain was published at a nominal spatial resolution of 1.5 cm3 using a 3T magnet (23). In this sequence, spectral-spatial excitation and frequency-selective 180° pulses were used to excite and refocus DF signals while avoiding saturation of the brain water magnetization. A relatively short TR was also used to maximize sensitivity via the ‘relaxation enhancement’ effect of exchange (or cross-relaxation) with the fully relaxed water signal (2,15,24,25). In the current communication, the further development of this sequence with increased spatial resolution and full brain coverage through the use of 3D-encoding is described. Results from 5 healthy volunteers are presented.
Methods
Five healthy volunteers (2 females, age 32.6±13.7 years, max 57, min 25) were scanned using a 45-minute MR protocol and a Philips 3T ‘Ingenia Elition’ scanner equipped with a 32-receive channel head coil. All participants provided written informed consent approved by the Johns Hopkins Medicine Institutional Review Board (JHMIRB). Anatomical MRI, 3D downfield and 3D water reference MRSI scans were performed.
Prior to MRSI, B0 field homogeneity was optimized to 2nd order using the a ‘FastMAP’ based technique (26). A 3D, circularly phase-encoded version of the previously developed 2D DF-MRSI sequence (23) with spectral-spatial excitation and frequency selective refocusing was implemented (Figure 1). Circular phase-encoding gives an approximately 22% reduction in scan time compared to square encoding, and also results in an isotropic point-spread function (43). All MRSI scans were performed with a FOV of 200×180×120 mm and a matrix size of 30×27×8 (elliptical k-space sampling), giving a nominal voxel size of 7×7×15 mm3 (≈ 0.7 cm3). Scan parameters were TR 287 ms, TE 22 ms, flip angle 78°, 1 excitation, scan time 22m 40s. The pulse was implemented with a maximum B1 of 22 μT and 5-lobe sinc pulses for slice selection, slice thickness 12 cm, and the delay (δ) set to give maximum excitation at 7.4 ppm. A frequency-selective sinc-Gauss 180° pulse applied at 7.8 ppm (11ms, 400 Hz BW) was used to refocus the downfield resonances. An inferior saturation pulse was also applied. Using an oblique axial prescription, spatial coverage was achieved from the base of the cerebellum to the vertex (Figure 2).
Figure 1.
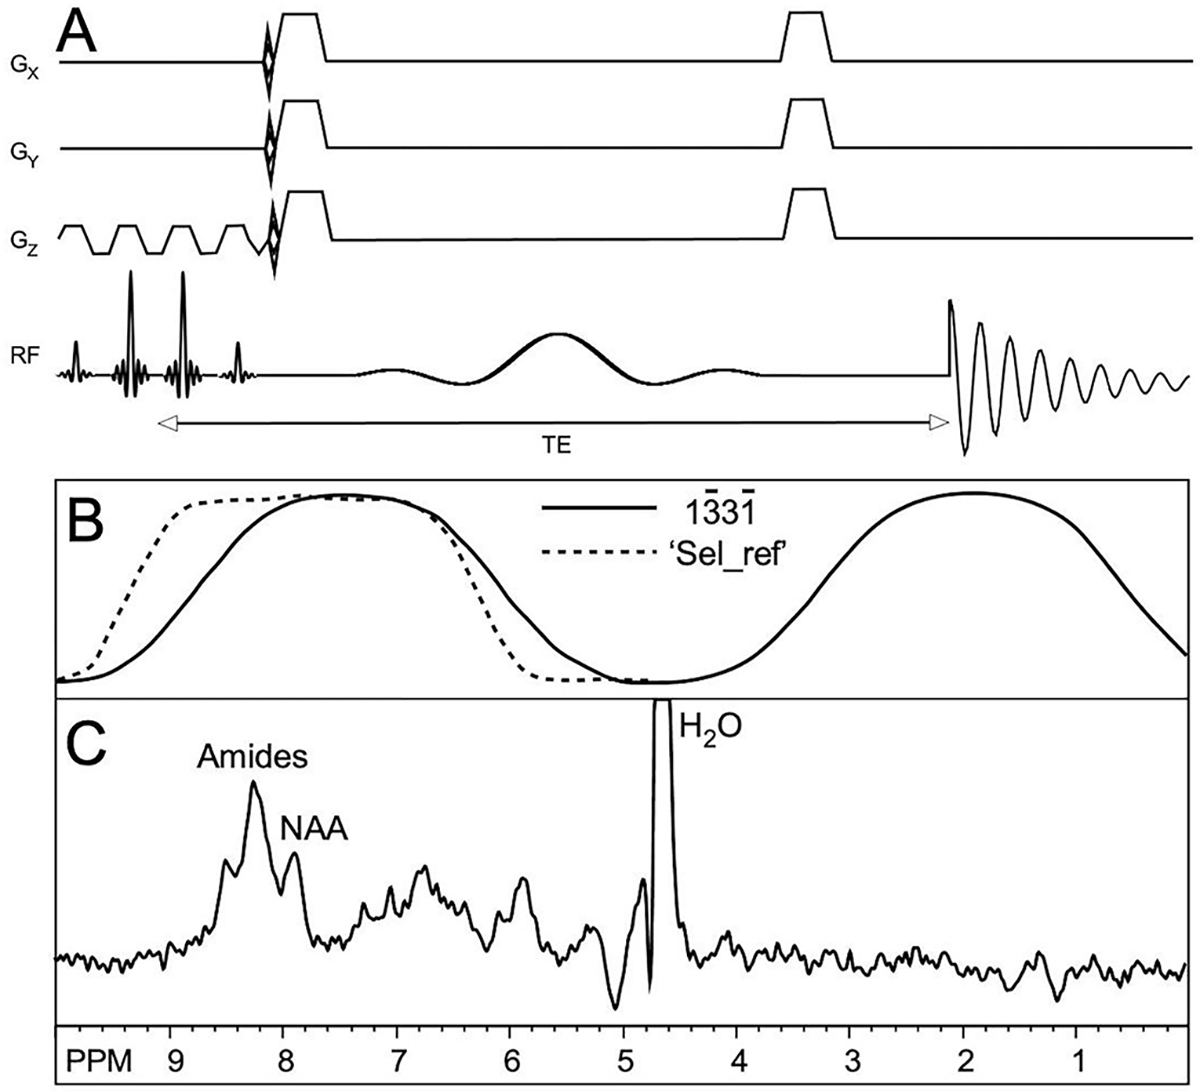
(A) Pulse sequence for 3D DF-MRSI. After spectral-spatial excitation, phase-encoding is applied in 3 dimensions followed by frequency selective refocusing and acquisition of the spin echo signal, (B) Excitation (solid line) and refocusing (dashed line) profiles of the excitation and selective (‘Sel_ref’) RF pulses, (C) Representative spectrum from one subject showing amide, NAA and residual water peaks (water truncated at 20% of maximum). Spectra were processed with zero-filling, 5 Hz Gaussian line-broadening, zero- and first-order phase correction.
Figure 2.
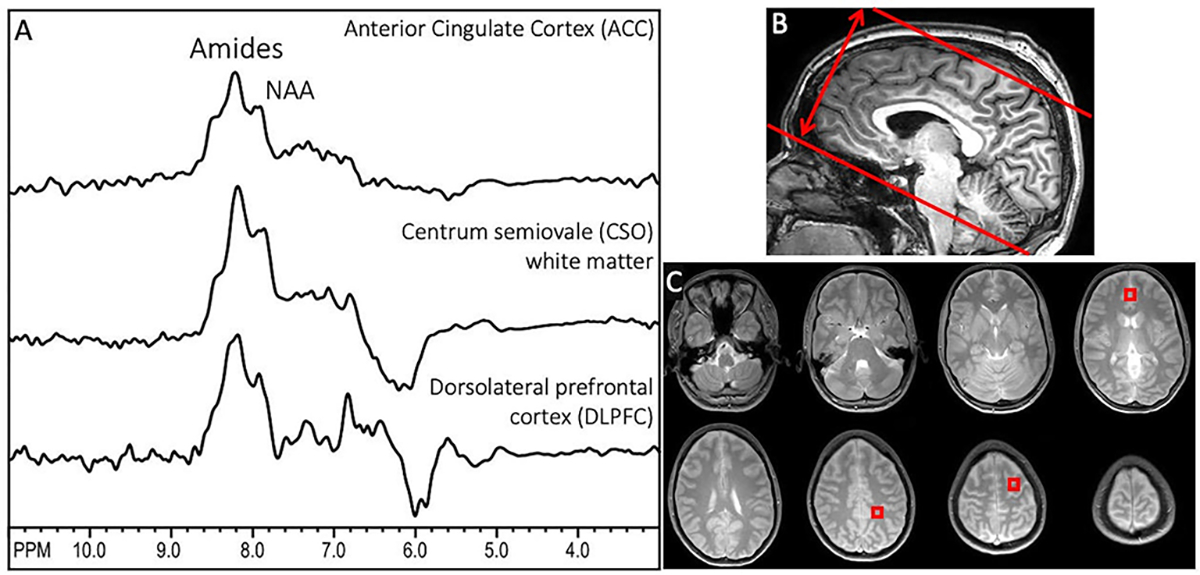
(A) Representative downfield spectra from one subject from the 3 brain regions used for quantitative analysis (anterior cingulate cortex (ACC), centrum semiovale (CSO), and dorsolateral prefrontal cortex (DLPFC), (B) sagittal T1-weighted MRI showing the oblique-axial slab prescription for 3D DF-MRSI; the slab thickness is (double arrow) is 12 cm in this case, (C) proton-density MRI showing the 8 slice locations covered by 3D DF-MRSI, including indicated voxel locations in ACC (slice 4), CSO (slice 6) and left DLPFC (slice 7). NAA and amide groups are the largest peaks at 7.9 and 8.2 ppm under the acquisition conditions used here. In these spectra, no first order phase or baseline correction is applied, but a high-pass filter (bandwidth 50 Hz) has been used to remove water at 4.7 ppm. The negative signal intensity seen in some of the spectra around 6 ppm is attributed to residual water signals.
A non-water suppressed FID-MRSI scan was also recorded at the same resolution and matrix size as the DF-MRSI. Scan parameters were TR 264 ms, TE 1 ms, flip angle 30°, 1 excitation, SENSE acceleration (R=2), scan time 11m 14s.
Spatial reconstruction of DF-MRSI data was performed by scanner software which includes the use of a Hamming filter in k-space to improve signal-to-noise ratios and reduce Gibbs-ringing. Further reconstruction of downfield metabolite maps was performed using MATLAB code and LCModel fitting (27). DF-MRSI spectra were frequency corrected using information from the water reference scan prior to the LCModel fitting, and residual water was removed using an HLSVD filter (28–30). The basis set for spectral fitting consisted of nine individual Gaussian peaks as described previously (23), specifically 6.83, 7.09, 7.30, 7.48, 7.90, 8.18, 8.24, 8.37, 8.49 ppm. Baseline spline stiffness was controlled using the LCModel parameter “DKNTMN”=5 (18). A full list of LCModel control parameters is given in the supplemental materials. DF peak areas from the LCModel, including the combined amide groups at 8.1–8.3 ppm, were expressed relative to the water signal in institutional units (‘i.u.’) for all spectra within the brain mask of the 3D DF-MRSI data. Brain masks were calculated from localized MRI scans using the ‘snakes’ active contour algorithm (42), an iterative region-growing image segmentation technique. Note that no attempts were made to estimate or adjust for regional variations in brain water content, or relaxation times. Metabolite maps were reconstructed in MATLAB using the concentration values from LCModel (estimated with an 8 Hz Lorentzian line broadening) and interpolated linearly by a factor of 8.
Maps of the distribution of the B0 field were reconstructed in one subject using the frequency of the water peak in the H20-MRSI scan; in addition, the change in resonance frequency during the scan (i.e., frequency drift) due to changes in gradient temperature was estimated from the frequency of the water peak in the raw k-space data.
Metabolite levels and Cramer Rao Lower Bounds (CRLBs) of the DF signals were compared between three selected regions of interest in gray matter (anterior cingulate cortex (ACC), dorsolateral prefrontal cortex (DLPFC)), and white matter (centrum semiovale (CSO)). Up to four voxels were averaged for each brain region in each subject. R 3.5.1 was used to perform statistical analysis (41). After log transformation, general linear regression method was performed to compare brain metabolite levels between ACC, CSO, and DLPFC. The Benjamini-Hochberg (BH) procedure was used for multiple comparison correction. P values corrected with the BH procedure was considered significant if its value was smaller than 0.05.
Pulse sequence software and the LCModel basis set used are available upon request.
Results
Figure 2 shows representative spectra from the three voxels in different brain regions selected for analysis in one subject, as well as the slab thickness of 120 mm and proton density localizer images for the 8 slices covered by MRSI. NAA and amide groups are the largest peaks at 7.9 and 8.1–8.3 ppm.
Figure 3A shows an example LCModel fit from an ACC spectrum, while 3B and 3C show LCModel fits for the DLPFC and CSO regions.
Figure 3.
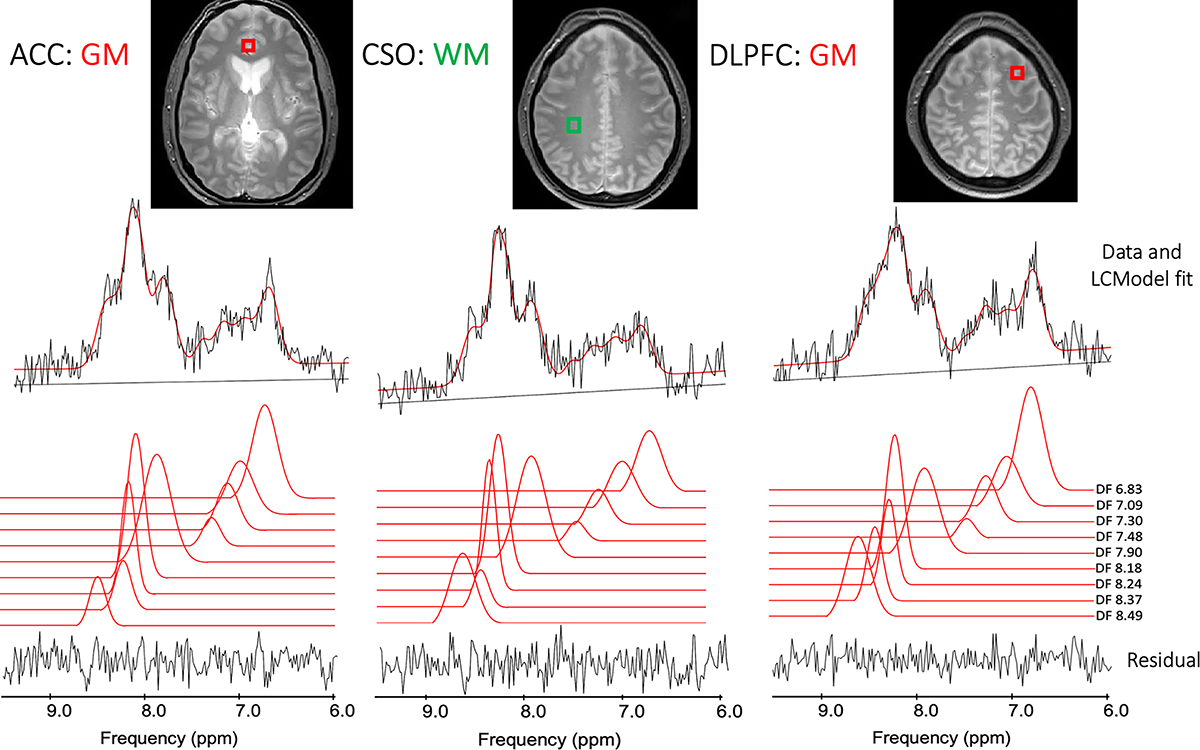
(A) Example LCModel outputs from the white matter left superior centrum semiovale (CSO) voxel in one subject, as well as gray matter voxels in (B) the left dorsolateral prefrontal cortex (DLPFC) and (C) mesial anterior cingulate cortex (ACC).
Figure 4 shows the results of the LCModel analysis (concentration levels and CRLBs) for the individual DF peaks, as well as the combined amide proton peaks, in all 5 subjects. For the combined amide resonances, concentration levels were in the range 5 to 8 (‘institutional units, ‘i.u.’) and CRLBs were on the order of 5%. The 7.90 ppm NAA amide peak concentration was around 2 i.u., with CRLB values in the 7–8% range. Individual, smaller peaks (including those with overlap with other resonances) had proton concentrations in the 1 to 2 i.u. range and somewhat larger CRLBs, on the order of 20% in some cases. For the amide concentration estimates, ACC was not significantly different from either CSO or DLPFC, while CSO and DLPFC were significantly different (p=0.009). There was no significant difference in CRLB values between ACC, CSO and DLPFC for any of the individual peaks, or the combined amide group. For other DF peaks, significant differences were found for metabolite concentrations in CSO and DLPFC for the metabolites at peaks 7.09 ppm (p= 0.014), 7.90 ppm (p=0.009), 8.18 ppm (p=0.009), and in ACC and DLPFC for metabolite 7.30 ppm (p=0.020).
Figure 4.
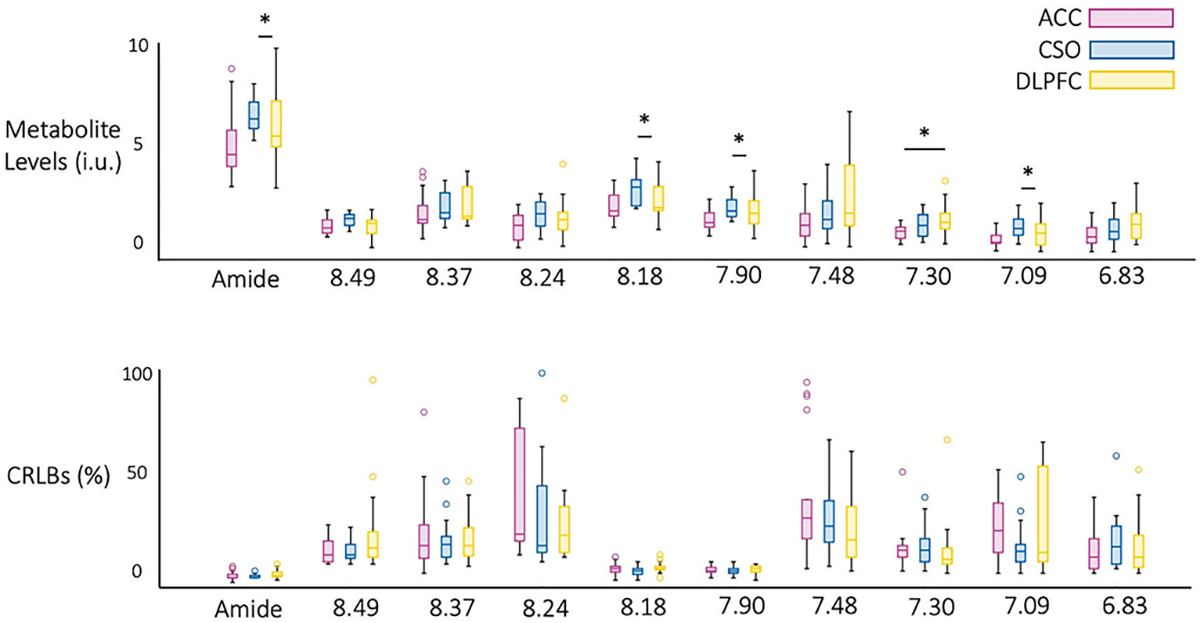
Descriptive statistics for (A) concentration and (B) CRLB values for the nine downfield peaks and combined amide resonances (8.1–8.3 ppm) in all 5 subjects. Significant differences were found estimated concentrations in CSO and DLPFC for peaks at 7.09 ppm (p= 0.014), 7.90 ppm (p=0.009), 8.18 ppm (p=0.009), and in ACC and DLPFC for metabolite 7.30 ppm (p=0.020). CRLB values were not significantly different between brain regions for any of the metabolites.
Figure 5 shows the reconstructed maps of the 7.90 ppm and combined amide resonances from all 8 slices in one subject. Relatively little contrast is seen between gray and white matter, but the spatial resolution is high enough to depict the ventricular CSF spaces with low signal. Loss of signal intensity in the most inferior and superior slices is due to the excitation profile of the slice (slab) selective pulse. Reconstructed maps of the other DF peaks are presented in the Figure 6.
Figure 5.
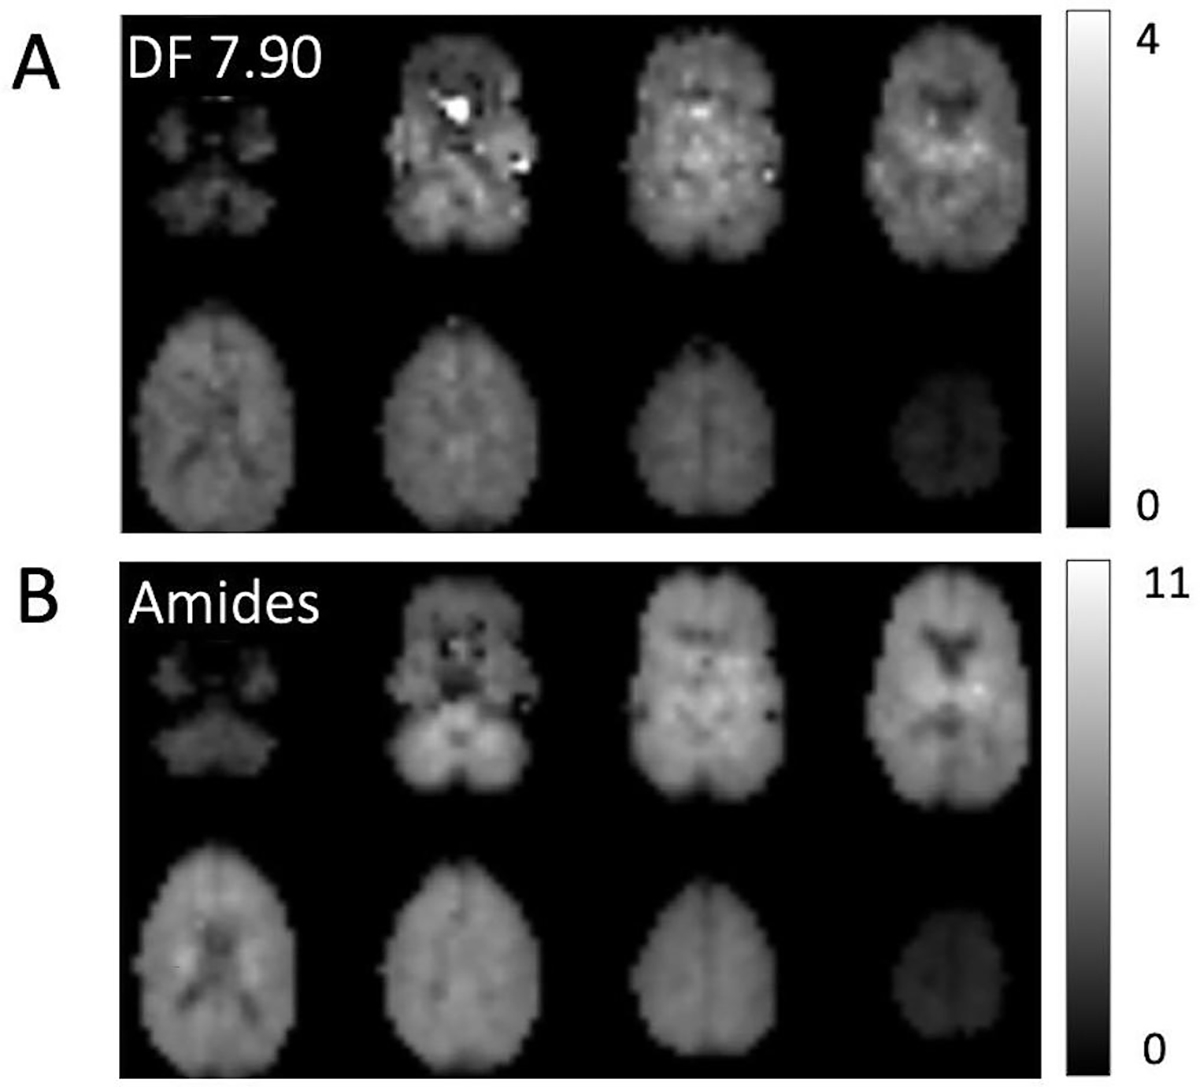
Example DF concentration maps from all 8 slices in 1 subject; maps are shown for (A) the NAA peak at 7.90 ppm as well as (B) the combined amide resonances (8.1–8.3 ppm). The maps are relatively homogeneous and show little gray-white contrast; however spatial resolution is high enough to depict CSF spaces such as the lateral ventricles which have low signal. There is some artifactual hyperintensity in the lower NAA slices attributable to residual water excited because of magnetic susceptibility effects (i.e. frequency shifts) due to adjacent air spaces.
Figure 6.
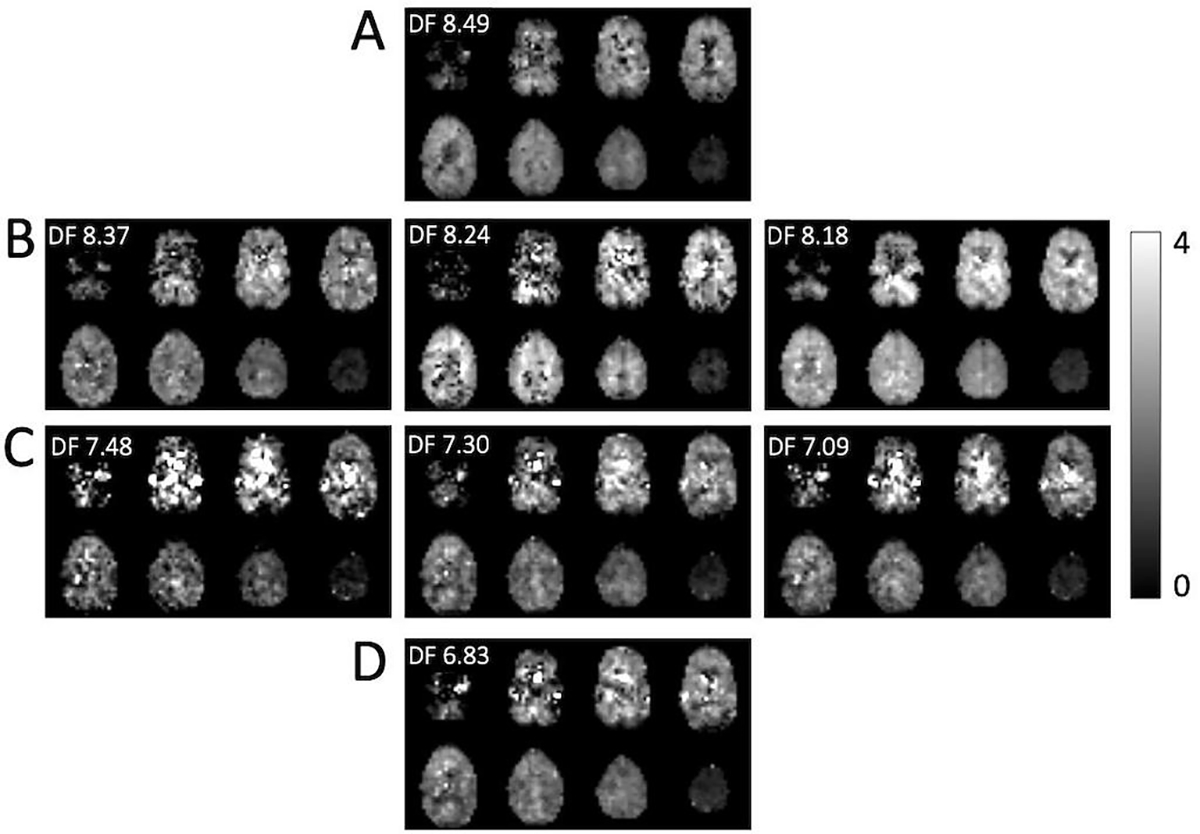
Reconstructed estimated concentrations maps (i.u.) for DF peaks (A) 8.49 ppm, (B) 8.37, 8.24 and 8.18 ppm peaks (amides), (C) 7.48, 7.30 and 7.09 ppm, and (D) 6.83 ppm. The maps are generally quite homogeneous, but for the smaller and overlapping peaks exhibit several artifacts which perhaps could be removed with more advanced post-processing techniques. For instance, hypointense pixels in the 8.24 ppm map seem to correspond to hyperintense pixels in the 8.18 ppm, likely because of incorrect fitting of overlapping peaks.
B0 field inhomogeneity data, both as frequency shift maps from the H2O-MRSI scan as well as in histogram form, and, in addition, the frequency drift over the time course of the 11-minute H2O-MRSI scan were illustrated in supplemental figure (S1).
Discussion
This study shows that downfield 3D-MRSI with near whole brain coverage and 7×7×15 mm3 nominal spatial resolution is possible at 3T in around a 20-minute scan time. Compared to upfield MRSI, DF-MRSI has some technical advantages, including the ability to use short TR (due to the short T1s and ‘relaxation enhancement’ effect), no need for additional water or lipid suppression, and slightly less sensitivity to field inhomogeneity, since the downfield resonances have broader intrinsic linewidths.
Significant regional variations were found for the amide, 8.18, 7.90 and 7.30 ppm DF peaks (Figure 4), despite the relatively homogenous appearance of the amide and 7.90 images shown in figure 5. The variations in quantitative analysis values should be interpreted with caution given the small sample size (n=5) in this study, and possible outliers from the LCModel analysis. No clear systematic differences between GM regions (ACC, DLPFC) or WM (CSO) regions were apparent. In the previous 2D-MRSI DF study (23), although no statistical comparison was performed, 6.83 and 7.30 ppm DF maps showed some GM/WM differences (with high concentrations in GM than WM). More detailed regional variations will require further studies in larger numbers of subjects and regions of interest, preferably using atlas-based analysis techniques (44). Nearly all prior single voxel DF MRS studies have been limited to just one brain region, so were not able to study regional variations (2,3,13,14,20–22).
T1 relaxation times and exchange rates of downfield peaks from, 6.84 to 8.50 ppm have previously been measured in the human brain at 3T (19). T1’s varied from as short as 176 to 525 ms, appreciably shorter than those of upfield resonances which are typically more than 1 s (40). In addition, exchange rates (kex) varied from 0.5 to 8.9 Hz; when the water signal is fully relaxed, the apparent relaxation rate (R1a = 1/T1a) of exchanging peaks is given by R1a = R1a + kex (1). For the 8.24 ppm amide resonance, with a T1 of 254 ms and kex of 7.5 Hz, the apparent T1 (T1a) is calculated to be as short as 87 ms; thus with the TR in the current experiments of 287ms, the Ernst angle (31) for optimum sensitivity is very close to 90° (87.8°). Other DF peaks have different T1’s and exchange rates; for instance, the 7.86 ppm amide peak of NAA has a longer T1 (525 ms) and slower exchange rate (2.4 Hz), so a much longer apparent T1 (415 ms). Therefore, not all peaks benefit equally from the relaxation enhancement effect, and to optimize sensitivity for the NAA amide peak would require a lower flip angle (Ernst angle = 59.9° for TR 287 ms). Similarly, the frequency offset for maximal excitation of the excitation pulse (7.4 ppm in the current experiments) and as well as the bandwidth and frequency offset of the refocusing (400 Hz/7.8 ppm) can be adjusted for preferential detection of different DF peaks. The current choice of parameters reflects a desire to maximize signals between 6 to 9 ppm with an emphasis on amide resonances; the 180° pulse refocusing profile also plays a role in quality of water suppression, since the pulse alone does generate an appreciable residual water in vivo.
Another factor to consider for 3D acquisitions with extended brain coverage is how B0 field inhomogeneity over the brain may affect both detection efficiency and the presence of artifacts. Using 2nd order shimming methods, field mapping experiments (Supplemental Figure S1) indicate that over 90% of brain voxels have frequency offsets due to B0 inhomogeneity of less than +/− 15 Hz, which should have negligible influence on MRSI results. However, voxels adjacent to the air spaces of the paranasal sinuses and external auditory canal may show shifts of as much as ~50 Hz, which can result in substantial excitation and refocusing of the water signal in these regions. These are regions where typically upfield MRS or MRSI is also not possible due to B0 inhomogeneity (32). In addition to B0 inhomogeneity, the influence of B0 drift also needs to be considered in the quite lengthy 3D MRSI scans used here. Again, the drift measurements shown in supplemental figure S1 show that (at least for the 3T system and pulse sequence used in the current experiments), the effects of field drift are negligible (< 5 Hz over an 11-minute scan duration).
Inspection of DF maps also indicates reduction of signal intensity in the most inferior and superior slice locations, due to the excitation profile of the slice selection RF pulses used in the pulse. The rectangularity of the slice profile was improved by adding additional side-lobes of the sinc pulses compared to those used in the prior 2D sequence; while this improves the slice profile, it also limited the maximum flip angle to 78° with the timing parameters used and a maximum B1 level of 22 μT. The high B1 level used resulted in high bandwidth for the individual elements of the pulse (≈ 11.6 kHz), so that the 3D slab excited experienced minimal chemical shift displacement effects (CSDE). For the frequency range of peaks analyzed in these scans (6.8 to 8.5 ppm, i.e. a frequency range of 1.7 ppm (~218 Hz)), the CSDE corresponded to approximately 2.3 mm only.
Although the current scan time for DF-MRSI was 22 minutes, it should be relatively straight forward to decrease this to under 10 minutes through further sequence optimization, and the use of fast-MRSI techniques, for instance, parallel-imaging approaches (e.g. SENSE- (33) and GRAPPA-MRSI (34)), sparse sampling (35), or readout gradients during data acquisition such as echo-planar spectroscopic imaging (EPSI) (36,37) or concentric circles (38).
Finally, amide proton transfer (APT) chemical exchange saturation transfer (CEST) MRI has been shown to have value in evaluating patients with brain tumors (39); DF-MRSI may give specific metabolic information on slowly exchanging molecules that is complementary to that observed using APT-CEST MRI, which is more sensitive for intermediate exchange rates. Compared to APT-CEST, DF-MRSI offers somewhat greater spectral resolution but lower spatial resolution, so may offer additional metabolic information beyond that available from CEST. Potential clinical applications of DF-MRSI include evaluating treatment response in patients with brain tumors undergoing chemo- and radiation-therapy; the ability of DF-MRSI to map lesion heterogeneity and potentially identify regions of recurrent tumor, treatment effect (necrosis), or edema could (if proven) be clinically useful, for instance for making further treatment decisions, or guiding biopsies.
In summary, 3D downfield MRSI of the human brain for the mapping of exchangeable amide and other resonances is feasible at 3T at a nominal spatial resolution of 0.7 cm3, and may be of use in future studies of brain tumors or other neuropathological conditions.
Supplementary Material
Supplemental Information Table 1 – Example Control file (.control) for LCModel analysis
Supporting Information Figure S1 – B0 field distribution over the 8 slices used for DF-MRSI in one subject: (A) B0 field maps in each slice (color map +/− 50 Hz), (B) histogram of frequency shift values within the brain over all 8 slices, (C) frequency drift in Hz measured from the water MRSI scan of 11 minutes duration (approximately 2500 transients in total). It can be seen that both field homogeneity over the volume of the brain, as well as B0 stability, are good in this subject.
Acknowledgements
Supported in part by NIH grants R01EB028259 and P41EB031771.
References
- 1.Mori S, Eleff SM, Pilatus U, Mori N, van Zijl PC. Proton NMR spectroscopy of solvent-saturable resonances: a new approach to study pH effects in situ. Magn Reson Med. 1998. Jul;40(1):36–42. [DOI] [PubMed] [Google Scholar]
- 2.Fichtner ND, Giapitzakis IA, Avdievich N, et al. In vivo characterization of the downfield part of (1) H MR spectra of human brain at 9.4 T: Magnetization exchange with water and relation to conventionally determined metabolite content. Magn Reson Med. 2018. Jun;79(6):2863–73. [DOI] [PubMed] [Google Scholar]
- 3.Borbath T, Murali-Manohar S, Wright AM, Henning A. In vivo characterization of downfield peaks at 9.4 T: T2 relaxation times, quantification, pH estimation, and assignments. Magn Reson Med. 2021. Feb;85(2):587–600. [DOI] [PubMed] [Google Scholar]
- 4.Nanga RPR, Elliott MA, Swain A, et al. Identification of l-Tryptophan by down-field (1) H MRS: A precursor for brain NAD(+) and serotonin syntheses. Magn Reson Med. 2022. Dec;88(6):2371–7. [DOI] [PMC free article] [PubMed] [Google Scholar]
- 5.van Zijl PCM, Moonen CTW. In situ changes in purine nucleotide and n-acetyl concentrations upon inducing global ischemia in cat brain. Magn Reson Med. 1993;29(3):381–5. [DOI] [PubMed] [Google Scholar]
- 6.van Zijl PCM, Zhou J, Mori N, Payen JF, Wilson D, Mori S. Mechanism of magnetization transfer during on-resonance water saturation. A new approach to detect mobile proteins, peptides, and lipids. Magn Reson Med. 2003;49(3):440–9. [DOI] [PubMed] [Google Scholar]
- 7.de Graaf RA, Behar KL. Detection of cerebral NAD+ by in vivo 1H NMR spectroscopy. NMR Biomed. 2014;27(7):802–9. [DOI] [PMC free article] [PubMed] [Google Scholar]
- 8.de Graaf RA, De Feyter HM, Brown PB, Nixon TW, Rothman DL, Behar KL. Detection of cerebral NAD(+) in humans at 7T. Magn Reson Med. 2017. Sep;78(3):828–35. [DOI] [PMC free article] [PubMed] [Google Scholar]
- 9.Dziadosz M, Hoefemann M, Döring A, Marjańska M, Auerbach EJ, Kreis R. Quantification of NAD+ in human brain with 1H MR spectroscopy at 3 T: Comparison of three localization techniques with different handling of water magnetization. Magn Reson Med. 2022;88(3):1027–38. [DOI] [PMC free article] [PubMed] [Google Scholar]
- 10.Gonçalves SI, Simões RV, Shemesh N. Short TE downfield magnetic resonance spectroscopy in a mouse model of brain glioma. Magnetic Resonance in Medicine. 2022;88(2):524–36. [DOI] [PubMed] [Google Scholar]
- 11.Kreis R, Zwygart K, Boesch C, Nuoffer JM. Reproducibility of cerebral phenylalanine levels in patients with phenylketonuria determined by 1H-MR spectroscopy. Magn Reson Med. 2009. Jul;62(1):11–6. [DOI] [PubMed] [Google Scholar]
- 12.Vermathen P, Capizzano AA, Maudsley AA. Administration and (1)H MRS detection of histidine in human brain: application to in vivo pH measurement. Magn Reson Med. 2000. May;43(5):665–75. [DOI] [PubMed] [Google Scholar]
- 13.Fichtner ND, Henning A, Zoelch N, Boesch C, Kreis R. Elucidation of the downfield spectrum of human brain at 7 T using multiple inversion recovery delays and echo times. Magn Reson Med. 2017. Jul;78(1):11–9. [DOI] [PubMed] [Google Scholar]
- 14.MacMillan EL, Chong DG, Dreher W, Henning A, Boesch C, Kreis R. Magnetization exchange with water and T1 relaxation of the downfield resonances in human brain spectra at 3.0 T. Magn Reson Med. 2011. May;65(5):1239–46. [DOI] [PubMed] [Google Scholar]
- 15.Shemesh N, Dumez JN, Frydman L. Longitudinal relaxation enhancement in 1H NMR spectroscopy of tissue metabolites via spectrally selective excitation. Chemistry Europe. 2013. Sep 23;19(39):13002–8. [DOI] [PubMed] [Google Scholar]
- 16.Dreher W, Leibfritz D. New method for the simultaneous detection of metabolites and water in localized in vivo 1H nuclear magnetic resonance spectroscopy. Magn Reson Med. 2005. Jul;54(1):190–5. [DOI] [PubMed] [Google Scholar]
- 17.Giapitzakis IA, Shao T, Avdievich N, Mekle R, Kreis R, Henning A. Metabolite-cycled STEAM and semi-LASER localization for MR spectroscopy of the human brain at 9.4T. Magn Reson Med. 2018;79(4):1841–50. [DOI] [PubMed] [Google Scholar]
- 18.Bagga P, Hariharan H, Wilson NE, Beer JC, Shinohara RT, Elliott MA, et al. Single-Voxel 1H MR spectroscopy of cerebral nicotinamide adenine dinucleotide (NAD+) in humans at 7T using a 32-channel volume coil. Magnetic Resonance in Medicine. 2020;83(3):806–14. [DOI] [PMC free article] [PubMed] [Google Scholar]
- 19.Meyer CH, Pauly JM, Macovski A, Nishimura DG. Simultaneous spatial and spectral selective excitation. Magn Reson Med. 1990. Aug;15(2):287–304. [DOI] [PubMed] [Google Scholar]
- 20.Kreis R, Boesch C. Localized 1H-MRS without water saturation: Techniques and initial results for human brain and muscle. In: ISMRM annual meeting abstract. Sydney, Australia; 1998. [Google Scholar]
- 21.Henning A, Fuchs A, Boesch C, Boesiger P, Kreis R. Downfield Spectra at Ultrahigh Field. In: ISMRM annual meeting abstract. Toronto, Canada; 2008. [Google Scholar]
- 22.Hoefemann M, Doring A, Fichtner ND, Kreis R. Combining chemical exchange saturation transfer and (1) H magnetic resonance spectroscopy for simultaneous determination of metabolite concentrations and effects of magnetization exchange. Magn Reson Med. 2021. Apr;85(4):1766–82. [DOI] [PMC free article] [PubMed] [Google Scholar]
- 23.Povazan M, Schar M, Gillen J, Barker PB. Magnetic resonance spectroscopic imaging of downfield proton resonances in the human brain at 3 T. Magn Reson Med. 2022. Apr;87(4):1661–72. [DOI] [PMC free article] [PubMed] [Google Scholar]
- 24.Gonçalves SI, Ligneul C, Shemesh N. Short echo time relaxation-enhanced MR spectroscopy reveals broad downfield resonances. Magn Reson Med. 2019;82(4):1266–77. [DOI] [PubMed] [Google Scholar]
- 25.Shemesh N, Rosenberg JT, Dumez JN, Muniz JA, Grant SC, Frydman L. Metabolic properties in stroked rats revealed by relaxation-enhanced magnetic resonance spectroscopy at ultrahigh fields. Nat Commun. 2014. Dec;5(1):4958. [DOI] [PubMed] [Google Scholar]
- 26.Automatic Gruetter R., localized in vivo adjustment of all first- and second-order shim coils. Magn Reson Med. 1993. Jun;29(6):804–11. [DOI] [PubMed] [Google Scholar]
- 27.Provencher SW. Automatic quantitation of localized in vivo 1H spectra with LCModel. NMR Biomed. 2001. Jun;14(4):260–4. [DOI] [PubMed] [Google Scholar]
- 28.Simpson R, Devenyi GA, Jezzard P, Hennessy TJ, Near J. Advanced processing and simulation of MRS data using the FID appliance (FID-A)—An open source, MATLAB-based toolkit. Magn Reson Med. 2017;77(1):23–33. [DOI] [PubMed] [Google Scholar]
- 29.Oeltzschner G, Zollner HJ, Hui SCN, et al. Osprey: Open-source processing, reconstruction & estimation of magnetic resonance spectroscopy data. J Neurosci Methods. 2020. Sep 1;343:108827. [DOI] [PMC free article] [PubMed] [Google Scholar]
- 30.Barkhuijsen H, de Beer R, van Ormondt D. Improved algorithm for noniterative time-domain model fitting to exponentially damped magnetic resonance signals. J Magn Reson. 1987. Jul 1;73(3):553–7. [Google Scholar]
- 31.Ernst RR, Anderson WA. Application of Fourier Transform Spectroscopy to Magnetic Resonance. Rev Sci Instrum. 1966. Jan;37(1):93–102. [Google Scholar]
- 32.Sabati M, Sheriff S, Gu M, et al. Multivendor implementation and comparison of volumetric whole-brain echo-planar MR spectroscopic imaging. Magn Reson Med. 2015. Nov;74(5):1209–20. [DOI] [PMC free article] [PubMed] [Google Scholar]
- 33.Dydak U, Weiger M, Pruessmann KP, Meier D, Boesiger P. Sensitivity-encoded spectroscopic imaging. Magn Reson Med. 2001. Oct;46(4):713–22. [DOI] [PubMed] [Google Scholar]
- 34.Tsai SY, Otazo R, Posse S, et al. Accelerated proton echo planar spectroscopic imaging (PEPSI) using GRAPPA with a 32-channel phased-array coil. Magn Reson Med. 2008. May;59(5):989–98. [DOI] [PubMed] [Google Scholar]
- 35.Klauser A, Klauser P, Grouiller F, Courvoisier S, Lazeyras F. Whole-brain high-resolution metabolite mapping with 3D compressed-sensing SENSE low-rank 1 H FID-MRSI. NMR Biomed. 2022. Jan;35(1):e4615. [DOI] [PMC free article] [PubMed] [Google Scholar]
- 36.Posse S, Dager SR, Richards TL, et al. In vivo measurement of regional brain metabolic response to hyperventilation using magnetic resonance: proton echo planar spectroscopic imaging (PEPSI). Magn Reson Med. 1997. Jun;37(6):858–65. [DOI] [PubMed] [Google Scholar]
- 37.Ebel A, Soher BJ, Maudsley AA. Assessment of 3D proton MR echo-planar spectroscopic imaging using automated spectral analysis. Magn Reson Med. 2001. Dec;46(6):1072–8. [DOI] [PubMed] [Google Scholar]
- 38.Chiew M, Jiang W, Burns B, et al. Density-weighted concentric rings k-space trajectory for 1 H magnetic resonance spectroscopic imaging at 7 T. NMR Biomed. 2018. Jan;31(1):e3838. [DOI] [PMC free article] [PubMed] [Google Scholar]
- 39.Jiang S, Eberhart CG, Zhang Y, et al. Amide Proton Transfer-Weighted MR Image-Guided Stereotactic Biopsy in Patients with Newly Diagnosed Gliomas. Eur J Cancer. 2017. Sep;83:9–18. [DOI] [PMC free article] [PubMed] [Google Scholar]
- 40.Li Y, Ozturk-Isik E, Lupo JM, Chen AP, Vigneron DB, Nelson SJ. T1 and T2 metabolite relaxation times in normal human brain at 3T and 7T. J Molecular Imag and Dynamic. 2012; S1:002. [Google Scholar]
- 41.The R Project for Statistical Computing. (2020). https://www.rproject.org/
- 42.Eviatar H, Somorjai R. A fast, simple active contour algorithm for biomedical images. Pattern Recognition Letters 1996; 17:969–974. [Google Scholar]
- 43.Maudsley AA, Matson GB, Hugg JW, Weiner MW. Reduced phase encoding in spectroscopic imaging. Magn Reson Med. 1994. Jun;31(6):645–51. [DOI] [PubMed] [Google Scholar]
- 44.Maudsley AA, Domenig C, Sheriff S. Reproducibility of Serial Whole-Brain MR Spectroscopic Imaging. NMR Biomed. 2010. Apr;23(3):251–6. [DOI] [PMC free article] [PubMed] [Google Scholar]
Associated Data
This section collects any data citations, data availability statements, or supplementary materials included in this article.
Supplementary Materials
Supplemental Information Table 1 – Example Control file (.control) for LCModel analysis
Supporting Information Figure S1 – B0 field distribution over the 8 slices used for DF-MRSI in one subject: (A) B0 field maps in each slice (color map +/− 50 Hz), (B) histogram of frequency shift values within the brain over all 8 slices, (C) frequency drift in Hz measured from the water MRSI scan of 11 minutes duration (approximately 2500 transients in total). It can be seen that both field homogeneity over the volume of the brain, as well as B0 stability, are good in this subject.