

Summary:
Sphingosine-1-phosphate (S1P) is an important signaling sphingolipid that regulates the immune system, angiogenesis, auditory function, and epithelial and endothelial barrier integrity. Spinster homolog 2 (Spns2) is an S1P transporter that exports S1P to initiate lipid signaling cascades. Modulating Spns2 activity can be beneficial in treatments of cancer, inflammation, and immune diseases. However, the transport mechanism of Spns2 and its inhibition remain unclear. Here we present six cryo-EM structures of human Spns2 in lipid nanodiscs, including two functionally relevant intermediate conformations that link the inward- and outward-facing states, to reveal the structural basis of the S1P transport cycle. Functional analyses suggest that Spns2 exports S1P via facilitated diffusion, a mechanism distinct from other MFS lipid transporters. Finally, we show that the Spns2 inhibitor 16d attenuates the transport activity by locking Spns2 in the inward-facing state. Our work sheds light on Spns2-mediated S1P transport and aids the development of advanced Spns2 inhibitors.
Keywords: Sphingolipid, S1P, Cryo-EM, major facilitator superfamily, Spns2, uniporter
Graphical Abstract

Analyses of Spns2 illuminate a distinct transport mechanism for the crucial signaling molecule sphingosine-1-phosphate (S1P) and the basis of pharmacological inhibition of the transporter.
Introduction
Sphingosine-1-phosphate (S1P) regulates the immune system, angiogenesis, auditory function, epithelial and endothelial barrier integrity1–5. Two sphingosine kinase (SphK) isoenzymes, SphK1 and SphK2, catalyze the phosphorylation of sphingosine (Sph) to produce S1P in cells6. In turn, the intracellularly synthesized S1P must be exported from cells to enter circulatory fluids and activate its receptors for downstream signaling. Two major facilitator superfamily (MFS) transporters are involved in S1P export — Spns2 primarily exports S1P in endothelial cells7–9, while Mfsd2b functions in erythrocytes and platelets10,11. Spns2 was the first identified mammalian S1P transporter12–14; it plays an essential role in the lymphatic system, supplying lymph S1P and enabling lymphocyte circulation. Notably, Spns2 also transports non-natural S1P analogues, including FTY720 phosphate15, a clinical drug used to treat multiple sclerosis16,17.
The physiological importance of Spns2 is further supported by studies in Spns2-knockout mice, which show rapid loss of auditory sensitivity and complete deafness before three weeks of age18 and aberrant lymphatic sinuses in the lymph nodes9. The absence of Spns2 impairs the postnatal retinal morphogenesis19. Interestingly, Spns2 deficiency protects mice from the development of multiple sclerosis and other autoimmune diseases20,21 and reduces pulmonary metastasis22. These findings uncover pivotal functions of Spns2 in cancer, auditory system, ocular development, and inflammatory and autoimmune diseases6,23. Therefore, pharmacological modulation of Spns2 has considerable therapeutic potential.
The molecular mechanism of how Spns2 transports S1P remains poorly understood. To date, five MFS lysolipid transporters — Spns1, Spns2, Mfsd2a, Mfsd2b, and bacterial LplT — have been shown to transport amphiphilic lysolipids24,25, but there is a paucity of structural information. Recently, structures of Mfsd2a, which transports omega-3 fatty acid across the blood–brain barrier, have been reported in its inward- and outward-facing states26–28. While one can expect Spns2 to have an overall architecture similar to that of Mfsd2a, insights gained from structures of the latter cannot be readily extended to Spns2, as these two transporters also share low sequence identity and have distinct substrate preferences. They also differ in transport mechanisms: Mfsd2a imports lysophosphatidylcholine into cells in a Na+-dependent manner29, whereas Spns2 was proposed to be a proton-coupled30 or a facilitated-diffusion S1P exporter31. Thus, structural information on Spns2 is required to understand this important transporter.
Here we capture structures of human Spns2 in multiple functionally relevant states, at resolutions of up to 2.9 Å, using single-particle cryo-electron microscopy (cryo-EM). The structures illuminate the S1P export cycle, revealing two intermediate conformations that connect the inward- and outward-facing states, which had not been previously captured for other MFS lipid transporters. Furthermore, we determine a structure that uncovers the inhibitory mechanism of the Spns2-specific inhibitor, 16d, described very recently32. Our structural and functional analyses elucidate the transport process of S1P via Spns2 and provide a better understanding of S1P metabolism and signaling.
Results
Structure determination of Spns2
Spns2 is a small membrane protein (~58 kDa), with most of its mass embedded in the membrane. The small size and lack of clear distinguishable features protruding out of the membrane make cryo-EM particle alignment challenging for Spns2. To overcome these obstacles, we fused a maltose-binding protein (MBP) to the N-terminus of Spns2 to increase the particle size and to allow accurate particle alignment. Specifically, we connected the C-terminal helix of MBP to the N-terminus of the first transmembrane helix of Spns2 (starting from residue 103). To further improve image alignment, we also fused an MBP binder (DARPin off7)33 to the C-terminus of Spns2, to serve as an additional fiducial marker (Figure S1A). This construct is referred to as Spns2cryo hereafter.
We conducted a cell-based S1P export assay34 to validate the activity of Spns2cryo. A similar method was used to measure the transport activity of Mfsd2a26–28 (Figure 1A). Briefly, we generated a HEK293 cell line that stably expresses human SphK1 using lentivirus, then transfected different Spns2 constructs into this cell line. We supplied the cells with a fluorescent S1P precursor (NBD-sphingosine), which was taken up and converted to intracellular fluorescent S1P (NBD-S1P). We then collected the extracellular medium to extract NBD-S1P and measured its fluorescence (Figure S1B). We used thin-layer chromatography to confirm that NBD-S1P was the main lipid present in the extracted sample used for measurement (Figure S1C), consistently with previous findings34. Our results show that Spns2cryo is expressed on the cell surface and shows activity similar to the wild-type protein (Spns2WT) (Figure 1B–D). We also used our system to measure the IC50 of Spns2 inhibitor 16d to Spns2WT, and the result (~6 μM) is similar to the previously reported value by mass spectrometry analysis32 (Figure 1E). To further validate the activity of Spns2, we used liquid chromatography–mass spectrometry to examine the export of native S1P by Spns2 (Figure S1B). The result reveals that both Spns2WT and Spns2cryo are capable of exporting S1P, and this activity could be inhibited by adding 16d (Figure 1F), which is consistent with our fluorescence assays.
Figure 1. Functional characterization of human Spns2cryo.

(A) Schematic of Spns2-mediated S1P export assay. Created with BioRender.com.
(B) Representative images of the cellular localization of human Spns2wt and Spns2cryo. Control, mCherry alone. The HEK293 cells expressing Spns2-mCherry were stained with Hoechst (blue). Scale bar, 10 μm.
(C) Western blot analysis of the expression level of Spns2-mCherry variants. Actin serves as a loading control. Control, mCherry alone; WT, wild type; cryo, construct for cryo-EM study.
(D) Functional validation of human Spns2WT and Spns2cryo. Spns2WT and Spns2cryo are overexpressed in HEK293 cells that stably express SphK1. Data are represented as mean ± SEM (n=3 biological replicates). ****P ≤ 0.0001, ns: not significant, calculated by ordinary one-way ANOVA with Dunnett’s multiple comparisons test using GraphPad Prism 9.
(E)The IC50 measurement of 16d. Data are represented as mean ± SEM (n=3 biological replicates). The experiments in panel (B-E) were conducted three times on different days with three independent group for each repeat. Similar results were obtained.
(F) LC-MS measurements of Spns2WT-mediated S1P export. Data are represented as mean ± SEM (n=3 biological replicates). **P ≤ 0.01, ****P ≤ 0.0001, ns: not significant, calculated by ordinary one-way ANOVA with Dunnett’s multiple comparisons test using GraphPad Prism 9. The experiments were conducted two times on different days with three independent group for each repeat. Similar results were obtained.
We next purified Spns2cryo and reconstituted the protein into saposin nanodiscs35 for cryo-EM investigations. After 3D reconstruction, the density for Spns2 and MBP was clearly resolved, whereas that for DARPin was visible but not as well defined (Figure S2A). Through 3D classification, we were able to observe two drastically different states of Spns2, in inward-facing and outward-facing conformations (Figure S2A). To further improve the density of Spns2, we employed a mask covering Spns2 and performed local refinements. This strategy resulted in an overall resolution of 2.9 Å and 3.5 Å for the inward- and outward-facing structures, respectively (Figure 2A and 2B, Figure S2, and Table S1).
Figure 2. Overall structures of human Spns2.
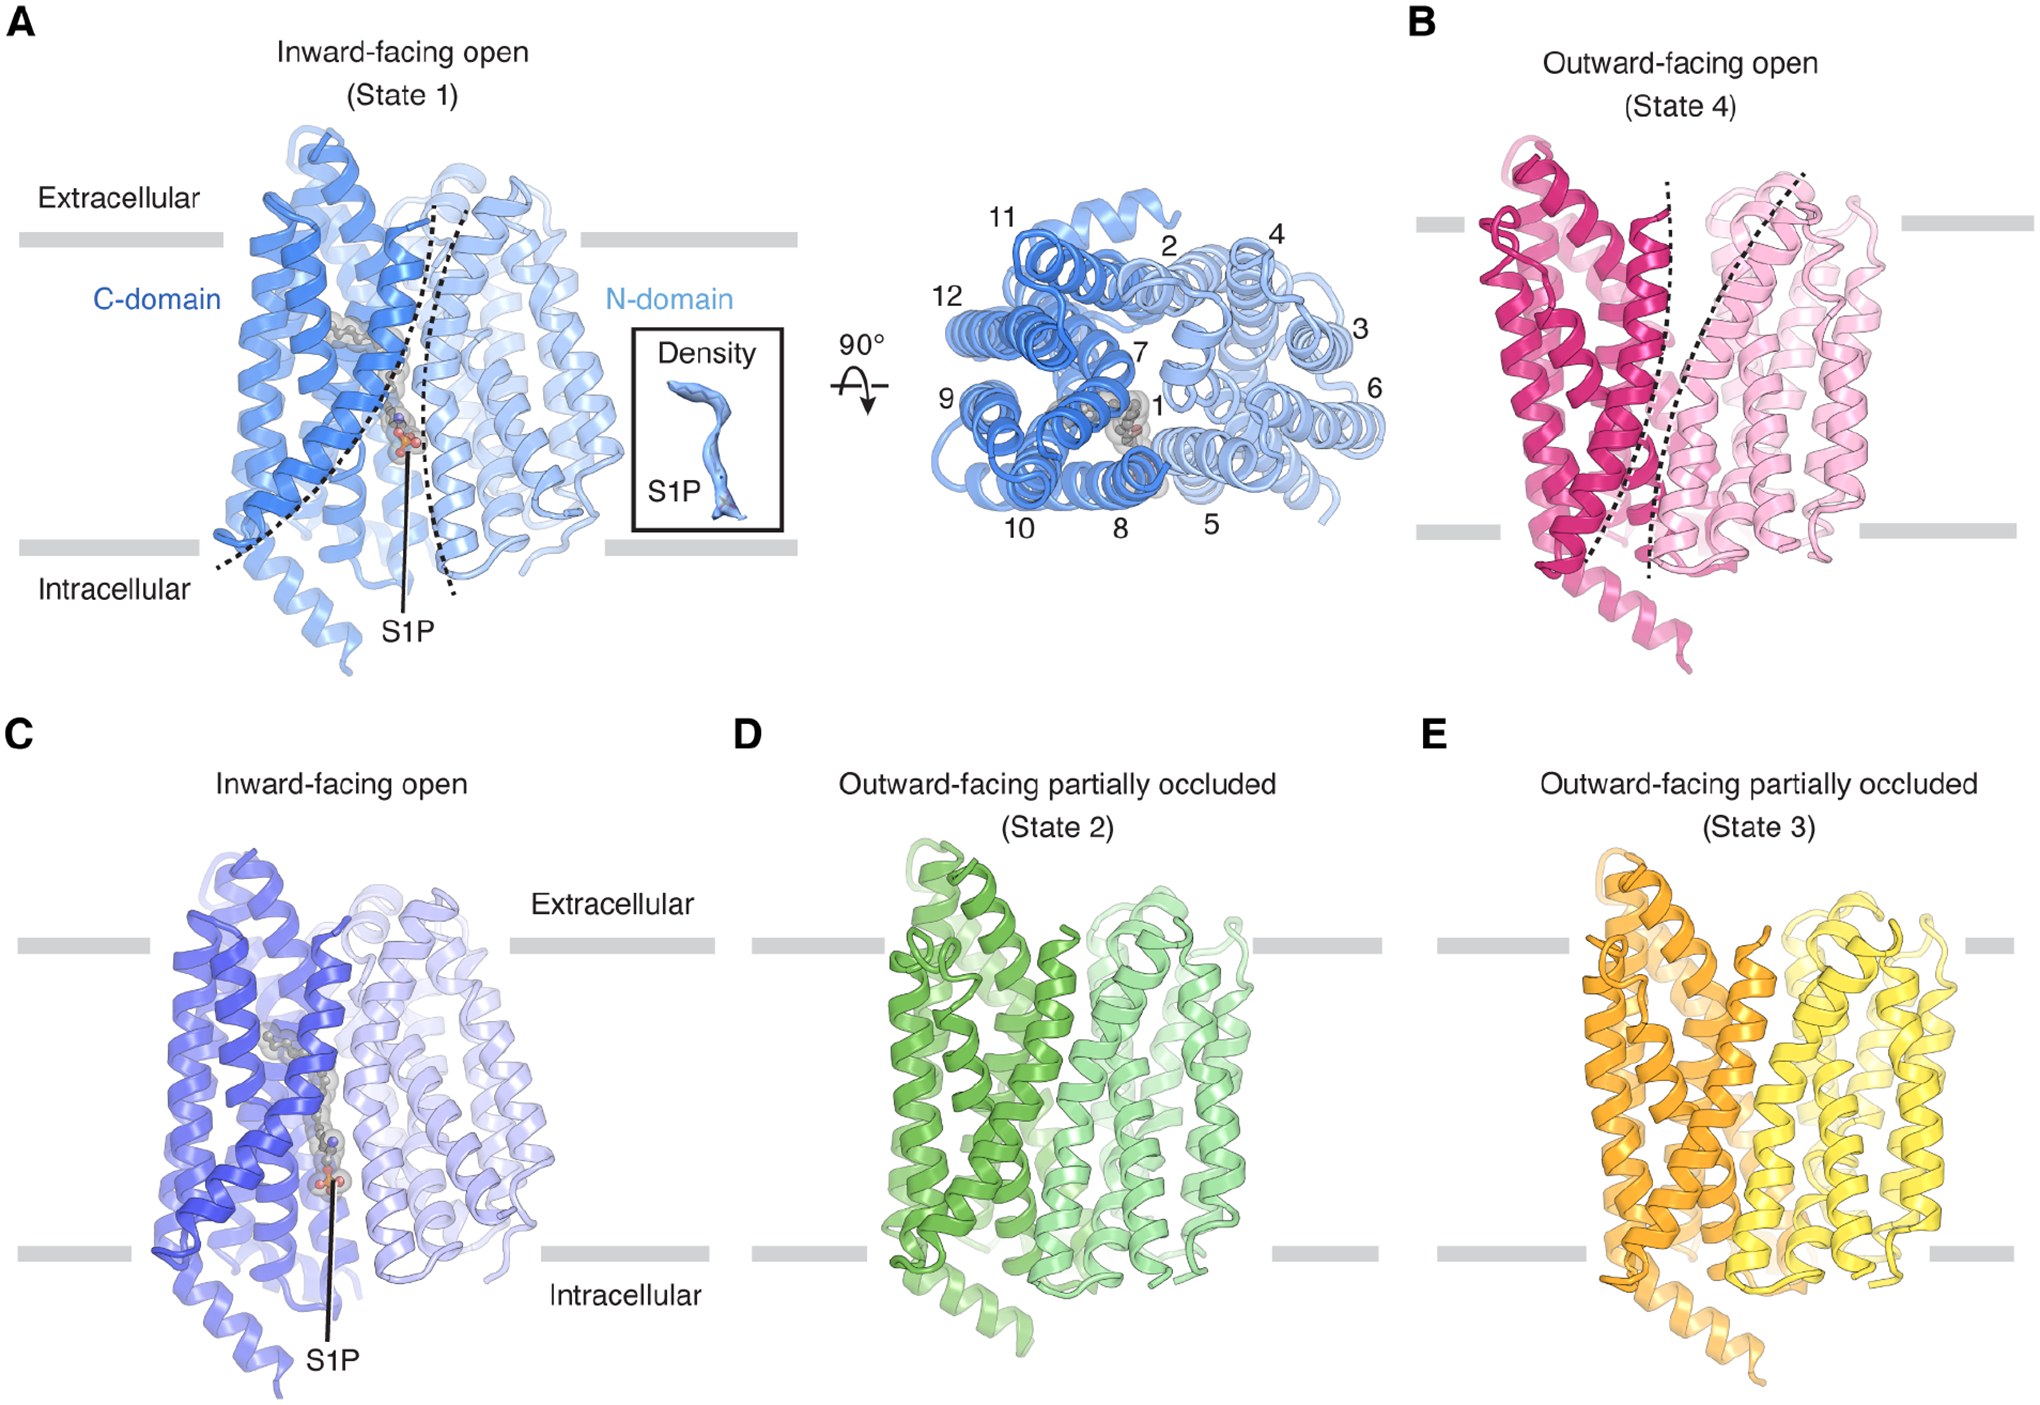
(A) Overall structure of S1P-bound Spns2 in an inward-facing open conformation (state 1) viewed from the side of the membrane (left) or from the extracellular space (right). S1P is shown as sticks in gray and its cryo-EM density is shown in the inset.
(B) Overall structure of Spns2 in an outward-facing open conformation (state 4).
(C) Overall structure of S1P-bound Spns2 in an inward-facing open conformation.
(D) Overall structure of Spns2 in an outward-facing partially occluded conformation (state 2).
(E) Overall structure of Spns2 in another outward-facing partially occluded conformation (state 3). S1P is shown as sticks in gray. The structures (A and B) were determined without additional S1P supplement in the protein solution. The structures (C-E) were determined in the presence of additional S1P in the protein solution.
To gain insight into how Spns2 recognizes the S1P substrate, we incubated the Spns2cryo nanodisc sample with additional S1P prior to vitrification. From this dataset, we captured three different conformations of Spns2: one inward- and two additional outward-facing conformations at 3.5–4.2 Å resolution (Figure 2C–E, Figures S2B, S3, and Table S1). In both inward-facing structures (obtained with or without S1P supplementation), we observed the density of an elongated lipid in the cavity created by the transmembrane region (Figure 2A and 2C). We extracted the total lipid content from the purified Spns2cryo sample not supplemented with additional S1P and performed mass spectrometry analysis. The analysis revealed S1P (d18:1) in the lipid extract (Figure S4), indicating that endogenous S1P binds to and copurifies with Spns2cryo. Since S1P fits snugly into the density map, we tentatively assign the density as S1P in both structures. We note that S1P binds to Spns2 in a position analogous to that of lysophosphatidylcholine bound to Mfsd2a in its inward-facing state (Figure S5A and S5B)26. However, the overall structures of Mfsd2a and Spns2 in the inward-facing state show considerable differences, with a root-mean-square deviation (RMSD) of 4.9 Å (Figure S5C).
Overall structures
Spns2 adopts the canonical MFS fold, comprising 12 transmembrane helices (TMs) that are divided into two pseudo-symmetric domains. The N-domain includes TMs 1–6, and the C-domain includes TMs 7–12 (Figure 2A). The intracellular loop between TM6 and TM7, which connects the two domains, and the extracellular loop between TM7 and TM8 were not visible in all cryo-EM maps, indicating the flexible nature of these loops.
The two inward-facing structures share a similar conformation, with an RMSD of 0.39 Å (Figure 2A and 2C). Owing to its higher resolution, we use the 2.9-Å resolution structure (obtained without S1P supplementation) as the representative for the substrate-bound inward-facing state (state 1, Figure 3A and 3B). The two outward-facing structures captured with S1P supplementation are intermediate states. In one of them (state 2, Figure 3C), the inward-facing cavity collapses and there is a partially occluded cavity facing the extracellular space. In the other (state 3, Figure 3C and 3D), the cytosolic opening of the transporter is further sealed, whereas TM7 tilts away from TM1 and increases the opening of the extracellular cavity. Finally, the outward-facing structure (state 4, Figure 3E) determined without additional S1P, features the widest opening on the outer leaflet side, with the extracellular halves of the TMs in the C-domain moving away from the center of Spns2 and generating a large cavity in the outer leaflet for the release of S1P to the extracellular space.
Figure 3. Structures of human Spns2 in distinct states.

(A) Surface representation of inward-facing cavity (state 1). The cytosolic side reveals two openings toward the intracellular solution. S1P is shown as sticks in gray.
(B) Interaction of S1P with residues in the cavity.
(C) Surface representation of outward-facing cavity of state 2. The asterisk indicates the closure of the inward-facing cavity.
(D) Surface representation of outward-facing cavity of state 3.
(E)Surface representation of outward-facing cavity of the state 4. In (C) to (E), residues Tyr120 and Met334 are shown as sticks. The movements of these marker residues highlight the opening of the outward-facing cavity.
(F) Structural comparison between the state 4 structure (magenta) and an outward-facing Mfsd2a structure (gray, PDB: 7N98). The comparison of putative lipid entrances is shown on right in a zoomed view. The arrow indicates the different arrangement of TM8s in Spns2 and Mfsd2a. TMs and related residues are labeled.
From state 1 to state 4, the intracellular opening occupied by S1P starts to constrict, whereas the extracellular opening of the transporter gradually expands. Such global conformational changes are expected to take place during substrate translocation by an exporter, and the 4 states captured here resolve fundamental steps of the S1P translocation cycle by Spns2. We noted earlier the low structural similarities between Snps2 and Mfsd2a in the inward-facing state; the same applies to the overall structures of Spns2 and Mfsd2a in the outward-facing state, with an RMSD of 5.7 Å.
Translocation pathway and lipid-binding site
Our structures reveal a solvent-accessible cavity between the N- and C-domains, presumably functioning as a substrate translocation pathway (Figure 3A and 3B). In state 1, TMs 1, 2, 4, 6, 7, 8, 10, and 11 generate the inward-facing solvent-accessible cavity that extends around halfway into the protein and binds a putative S1P substrate (Figure 3A). Spns2 has two lateral openings towards the cytosolic leaflet of the plasma membrane (Figure 3A, lower panel). The opening surrounded by TMs 5, 8, and 10, accommodates the polar head of S1P, with residues Ser232, Tyr235, and Gly374 making hydrophilic contacts (Figure 3B). The acyl tail of S1P adopts an “L” shape in the cavity in the midplane of the lipid bilayer (Figure 3A and 3B) and makes hydrophobic interactions with residues Ile238, Leu332, Ile336, Phe366, Ile429, Leu436, Phe437, and Trp440 (Figure 3B).
In the states 2, 3, and 4, the extracellular halves of TMs 1, 2, 5, 7, 8, and 11 create the outward-facing cavity in the extracellular leaflet (Figure 3C–E). We did not find any convincing lipid-like density in the states 2, 3, and 4. Since Spns2 transports the intracellularly synthesized S1P to the extracellular side, it is possible that in the outward-facing conformation, the affinity of S1P to the cavity becomes weaker than that in the inward-facing state, thus facilitating the release of S1P. A previous study on Mfsd2a in its outward-facing conformation showed a potential lipid site in the extracellular leaflet between TM5 and TM827, but this is not possible in Spns2. In our structures, hydrophobic interactions between residues Tyr246 in TM5 and Gly367 in TM8 and between Phe236 in TM5 and Phe375 in TM8 pack these two TMs against each other (Figure 3F), leaving no space to accommodate the lipid substrate between them. Instead, a large lateral opening exists between TM2 and TM11 of Spns2 (Figure 3E), and the S1P substrate might be released from this opening or from the outward-facing cavity, suggesting a mechanism of substrate transport that differs from that of Mfsd2a.
State transitions of Spns2
MFS transporters typically oscillate between outward-facing and inward-facing conformations to mediate alternating access transport. During the Spns2 transport cycle, the interactions between the N- and C-domains modulate the access of the S1P-binding pocket to the lipid bilayer. We aligned the N-domain of each structure and compared the movements of the C-domains (Figure 4A). In state 1, the lipid translocation pathway is sealed from the extracellular leaflet by the interaction between the hydroxyl group of Tyr246 and the carbonyl group in the main chain of Gly333 (Figure 4B), which appears to be specific to the inward-facing conformation.
Figure 4. Structural transitions during the transport cycle of Spns2.

(A) Structural comparison of four different states of Spns2. The N-domains (indicated as gray surface) are aligned.
(B) The transitions of four states. The hydrophilic interactions are indicated as dashed lines.
(C) and (D) Structural comparison of TM7 and TM8 between states 1 and 2. Cα positions of Ala368 and Gly471 are indicated by spheres. The clashes between S1P (in the state 1) and structural elements of Spns2 in state 2 are indicated by dashed circles.
(E) Structural comparisons of Spns2 in states 2, 3 and 4. The extracellular view shows considerable movements of the extracellular halves of TM7, 8, and 11 during the transitions of different states.
(F) Structural comparison of the C-domain between states 2 and 3.
(G) Structural comparison of C-domain between states 2 and 4. The movements of TMs are indicated by arrows.
In the transition from state 1 to state 2, the cytosolic half of TM8 undergoes a pronounced shift towards to the N-domain around the kink at Ala368 of TM8 (Figure 4C and 4D). Meanwhile, TM11 rotates counterclockwise, pivoting around Gly471, and its extracellular half moves away from the center, while its cytosolic half approaches the center (Figure 4D). Structural rearrangements of TMs 7, 8, 10, and 11 lead to a collapse of the S1P-binding site; in fact, Leu332 in TM7, Val378 in TM8, and Trp440 in TM10 in state 2 sterically hinder binding of S1P (Figure 4C and 4D). Concomitantly, the extracellular half of TM7 shifts away from the N-domain and the constriction formed by Gly333–Tyr246 interaction is released in state 2, where the distance between carbonyl group of Gly333 and the hydroxyl group of Tyr246 is ~4.1 Å. Thus, Tyr246 and Gly333 appear to serve as an extracellular gate in the translocation pathway, and in state 2, a pathway accessible from the extracellular side starts to emerge (Figure 4B). Additionally, whereas Asp220 and Arg456 in state 1 are separated by 16 Å, they approach each other (3.8 Å) and are primed for interaction in state 2 (Figure 4B).
In state 3, the hydrogen bond between Thr228 of TM5 and Asp445 of TM10 and the salt bridge between Asp220 of TM4 and Arg456 of TM11 further lock the cytosolic end of Spns2. Gly333 moves further away from Tyr246 (5.4 Å) (Figure 4B). The movements of the extracellular halves of TM7 and TM11 enlarge the outward-facing cavity (Figure 4B and 4E). From state 3 to state 4, the extracellular vestibule of the transporter continues to enlarge. While the cytosolic face of Spns2 superimpose well in states 3 and 4, notable conformational changes occur at the extracellular face of the C-domain (Figure 4E–G). The extracellular halves of all TMs in the C-domain move at least 3 Å away from the N-domain in state 4 compared to that of state 3 (Figure 4E). This finding reveals that local gating movements of TMs 7, 8, 10, and 11 of the C-domain are coupled to the remodeling of the S1P translocation pathway and contribute to substrate recruitment and release.
Thus, our structural analysis enables a direct visualization of the molecular transitions between multiple states, captured under the same experimental conditions, and reveals the details of substrate translocation (Supplementary Video 1). Moreover, our findings suggest that interactions between the N- and C-domains of Spns2 (e.g., Asp220–Arg456, Thr226–Asp445, and Tyr246–Gly333) control the opening and closure of the translocation pathway and play crucial roles in conformational switches during the transport cycle. Notably, Asp220, Tyr246, Gly333, Asp445 and Arg456 are conserved in the Spns2 homolog Spns1, suggesting that they may also have important roles in substrate translocation by Spns1 (Figure S5D).
Functional investigations on transport mechanism
To validate our structural observations, we mutated residues that would contribute to S1P engagement (Tyr235, Pro239, Leu332, Ile336, Gly374, Ile429, Phe437 and Trp440, Figure 3B) or participate in structural transitions during the transport cycle (Phe236 and Tyr246, Figures 3F and 4B). All variants localize on the cell surface and have expression level comparable to the wild type (Figure 5A and 5B). Consistent with our structural findings, most Ala substitutions, expect for L332A and G374A, considerably reduced the transport activity of Spns2 (Figure 5C). Leu332 is near the very end of the S1P acyl chain, and it is likely that the substitution of Leu with Ala does not drastically affect the hydrophobicity of the binding site to impair the engagement of S1P. In our structure, Gly374 interacts with S1P through its main chain carbonyl group, and it is thus reasonable that the substitution with Ala has minimal impact on the export of S1P.
Figure 5. Validation of the key residues of human Spns2 in S1P transport.
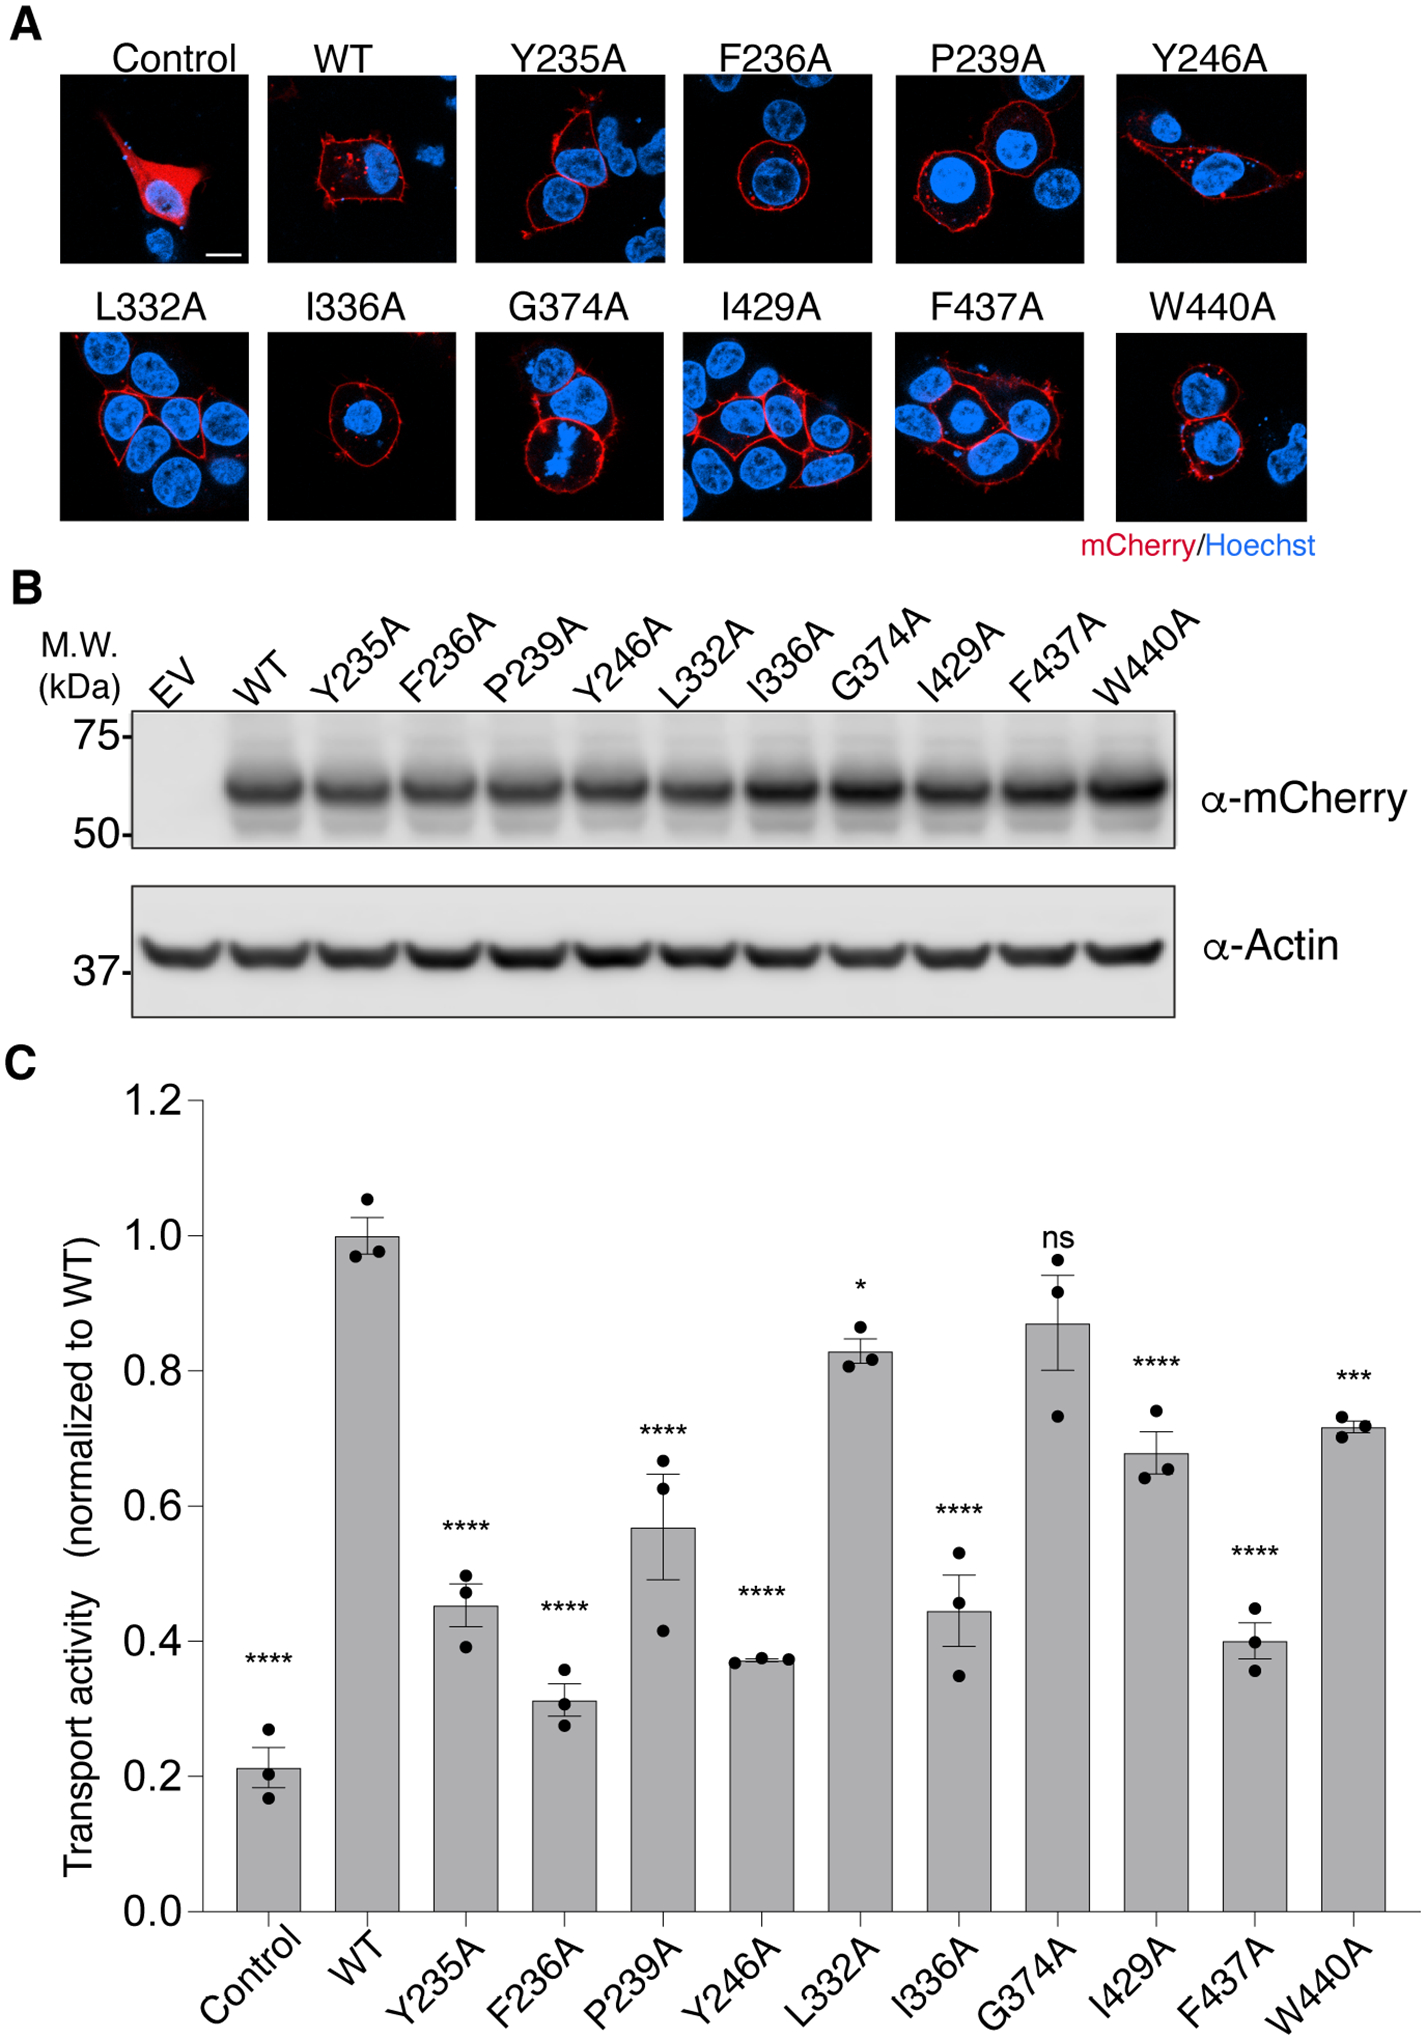
(A) Representative images of the localization of Spns2-mCherry variants. HEK293 cells expressing Spns2-mCherry were stained with Hoechst (blue). Control, mCherry alone; WT, wild type. Scale bar, 10 μm. The experiments were independently conducted two times, on different days, with similar results obtained.
(B) Western blot analysis of the expression level of human Spns2-mCherry variants. Actin serves as a loading control. EV, empty vector; WT, wild type. The experiments were independently conducted three times, on different days, with similar results obtained.
(C) Transport activity of mutants in key residues involved in substrate engagement and structural transitions. Control, mCherry alone; WT, wild type. Data are represented as mean ± SEM (n=3 biological replicates). * P ≤ 0.1, ** P ≤ 0.01, ***P ≤ 0.001, ****P ≤ 0.0001, ns: not significant, calculated by ordinary one-way ANOVA with Dunnett’s multiple comparisons test using GraphPad Prism 9. The experiments were conducted three times, on different days with three independent groups for each repeat, with similar results obtained.
The mechanism of S1P transport via Spns2 remains controversial: human Spns2 has been proposed to be a proton-coupled antiporter30 or a facilitated-diffusion uniporter31. To resolve this discrepancy and gain further mechanistic insight into the function of Spns2, we investigated how Spns2 transports S1P under different extracellular conditions. We first assessed whether transport by Spns2 is dependent on pH and found that altering extracellular pH (from 7.5 to 6.5 or 8.5) did not substantially change the export activity of Spns2 (Figure 6A). This result suggests the proton gradient may not be essential for Spns2 activity. Since Mfsd2a is a Na+-dependent transporter36, we also examined the effect of Na+ and K+ on Spns2 activity. Replacing extracellular Na+ with N-methyl-d-glucamine (NMDG) did not considerably reduce Spns2 activity (Figure 6B), suggesting that Spns2 transport of S1P is not coupled to Na+. A structure-based sequence alignment also shows that Na+ binding residues in Mfsd2a are not conserved in Spns2 (Figure S4D). On the other hand, replacing extracellular Na+ with K+ slightly increased Spns2 activity (Figure 6B). Together, our data indicate that while K+ might modulate the activity of Spns2, it is unlikely that Spns2 uses a Na+ or K+ gradient as a driving force to export S1P.
Figure 6. Functional investigations on Spns2 transport mechanism.

(A) and (B) The transport activity of Spns2 under different pHs (A) or different ionic environments (B). 140 mM NaCl, KCl, Hank’s balanced salt solution (HBSS) or N-methyl-D-glucamine (NMDG)-Cl was used in these experiments. 16d was added at a final concentration of 100 μM. Data are represented as mean ± SEM (n=3 biological replicates). ***P ≤ 0.001, ****P ≤ 0.0001, statistical significance between 16d treated and untreated samples was evaluated by two-tailed unpaired Student’s t test using GraphPad Prism 9.
(C) Schematic of Spns2-mediated NBD-S1P uptake assay. Created with BioRender.com.
(D) Uptake activity of Spns2 in HBSS or NMDG-Cl supplemented with 1 μM NDB-S1P. Control, mCherry alone. Data are represented as mean ± SEM (n=3 biological replicates). ** P ≤ 0.01, ***P ≤ 0.001, ns: not significant, calculated by ordinary one-way ANOVA with Dunnett’s multiple comparisons test using GraphPad Prism 9. The experiments in panel (A), (B) and (D) were conducted three times on different days with three independent groups for each repeat, with similar results obtained.
If Spns2 is a facilitated-diffusion uniporter, one would predict that when the extracellular S1P level is high enough, Spns2 would import S1P rather than export it (Figure 6C). To test this hypothesis, we performed a cell-based NBD-S1P uptake assay. We supplemented the cells overexpressing Spns2 with NBD-S1P, collected the cell pellets, and examined the imported NBD-S1P by thin layer chromatography (Figure S1B). Lipid analyses showed that Spns2WT, but not the loss-of-function mutant Spns2Y246A, can import NBD-S1P from the extracellular space into cells (Figure 6D and Figure S6). Furthermore, this uptake activity is not dependent on the presence of extracellular Na+. These results strongly support that Spns2 works as a facilitated-diffusion uniporter.
Structure of Spns2 bound to inhibitor 16d
Inhibition of Spns2 may help the treatment of diseases such as malignancies and autoimmune and chronic kidney conditions. The inhibitor 16d can prevent S1P export to suppress proinflammatory signaling and ameliorate kidney fibrosis in mice37. However, the potency of 16d is in the low micromolar range (~2 to 6 μM)32, and there is room for future development of small-molecule inhibitors targeting Spns2. To dissect the mechanism of the 16d inhibitor, we determined the structure of Spns2 bound to 16d at 3.6-Å resolution (Figure 7A and Figure S7). While Spns2 can adopt multiple conformations (either inward-facing or outward-facing) in the absence of 16d (Figure S2), only the inward-facing conformation of Spns2 was observed in the presence of 16d (Figure S7). The 16d-bound structure showed an RMSD of 0.32 Å with the state 1 structure. This observation suggests that 16d may trap the transporter in this particular state, thereby attenuating the transport cycle.
Figure 7. Spns2 structure in complex with the inhibitor 16d.

(A) Overall structure of 16d-bound Spns2 viewed from the side of the membrane. The inhibitor 16d ligand is shown as sticks in orange.
(B) Interactions between 16d and residues in the inward-facing cavity.
(C)and (D) Structural comparison of S1P-bound Spns2 (state 1, color in blue) and 16d-bound Spns2. Phe236 and Trp440 change their conformations in response to the binding of 16d. S1P and 16d are shown as sticks. S1P is in gray and 16d is in orange.
Notably, we observed extra density around the inward-facing cavity of the 16d-bound Spns2, but it was not sufficiently resolved to unambiguously model 16d. Although one 16d molecule can fit into the density, there is residual density close to its phenyl ring (Figure S7E). We then performed molecular dynamics simulations to study the binding mode of the inhibitor in the cavity (Supplementary Video 2), and the results suggest that 16d could adopt multiple poses in Spns2, likely leading to heterogeneity in the sample. Based on the cryo-EM density, we tentatively modeled the 16d molecule into Spns2 (Figure 7A). The amino head group of 16d is wedged between TM5 and TM8, while its acyl tail inserts into the central cavity. Tyr235 and Ile238 in TM5, Val378 in TM 8, and Trp440 and Ala441 in TM10 are responsible for inhibitor recognition (Figure 7B).
Comparing the 16d-bound with the S1P-bound structure suggests that 16d would prevent the engagement of Spns2 with S1P. In the S1P-bound structure, Phe236 in TM5 points toward the membrane to accommodate the polar head of S1P. In contrast, in the 16d-bound structure, Phe236 moves toward the S1P-binding site and forms a hydrophobic interaction with Phe375 (Figure 7C), a rearrangement that seals the opening between TM5 and TM8. Moreover, Trp440 undergoes a substantial conformational change and moves away from the S1P-binding site (Figure 7D). While the precise mechanism of 16d or its analogs in Spns2 inhibition warrants further investigations, our results indicate that 16d directly compete with S1P by occupying a site overlapping with the substrate, and that the binding of 16d locks the transporter in the inward-facing state to abolish the transport activity.
Discussion
In this study, we report four different functional states of the human S1P transporter Spns2. The S1P substrate is accommodated by an inward-facing cavity, with its acyl tail interacting with hydrophobic residues in TMs 7, 8, and 10 (Figure 3B). Structural analysis reveals an asymmetric rearrangement in Spns2 during alternating-access transport (Figure 4B). Hydrophilic interactions between charged residues in the N- and C-domains contribute to the rocker-switch-type movement of both domains, modulating the translocation pathway of S1P. Particularly, the local gating movements of TMs 7, 8, 10, and 11 in the C-domain are coupled with substrate engagement and release.
Under physiological conditions, the intracellularly synthesized S1P binds Spns2 in its inward-facing state. The transporter then transitions to the outward-facing state and brings S1P to the extracellular side. S1P may detach from the transporter and exit to the outer leaflet of the membrane. Alternatively, S1P may be directly transferred to its chaperone (such as HDL-bound ApoM) in the extracellular space38,39. Understanding whether and how Spns2 facilitates this type of transfer process requires further investigations.
Relevant intermediate states have not been structurally identified for Mfsd2a26–28, and thus it remains unknown how Mfsd2a transits between inward- and outward-facing states to allow substrate translocation. Since both Spns2 and Mfsd2a transport lysolipids and adopt an MFS fold, the intermediate states of Spns2 reported in this study not only delineate fundamental steps during the transport cycle, but also provide insights into the structural transitions of Mfsd2a and other MFS lipid transporters. We observe multiple conformations of Spns2 in our cryo-EM datasets, suggesting that the energy barriers between the inward- and outward-facing states are not high, and that Spns2 can effectively isomerize to adopt different conformations during its transport cycle without additional energy sources. This is consistent with our functional analyses showing that Spns2 is likely a facilitated-diffusion transporter.
Some MFS sugar transporters have been reported as uniporters and transport the substrate following its concentration gradient40,41. Notably, the conformational landscape of these MFS sugar transporters has been deduced from structures of different orthologs, mutants or constructs42. In contrast, by capturing the structural dynamics of Spns2 under the same experimental conditions, our study provides a more comprehensive and robust structural depiction of a transporter’s functional cycle. These results demonstrate how the hydrophobic lipid cargo is transported via a facilitated-diffusion manner and advance our understanding on other MFS transporters that use a rocker-switch alternating-access mechanism.
Our structural findings, along with molecular dynamics simulations, suggest that the Spns2 inhibitor 16d interferes with lipid substrate recruitment by occupying the inward-facing cavity. Furthermore, binding of 16d seems to confine Spns2 to its inward-facing state. It would be of interest to develop small molecules that favor other relevant functional states. For example, molecules that bind to the extracellular cavity (Figure 3E) may help trap Spns2 in its outward-facing conformation. Our inhibitor-bound structure provides a blueprint for the development of next-generation Spns2 inhibitors, which will not only yield useful tools to study Spns2 and S1P biology but also create fresh opportunities for therapeutics design.
Limitations of the study
Our structures were determined using saposin nanodiscs. It is possible that in other types of nanodiscs or in the cell membrane, Spns2 may adopt different conformations. We employed cell-based assays to demonstrate that Spns2 functions as a facilitated-diffusion uniporter, transporting S1P along its concentration gradient across the membrane. Nevertheless, future in vitro transport assays with purified components that can precisely control the extracellular/intracellular concentrations of S1P and chaperones are needed to provide further insights into the S1P transport via Spns2. Interestingly, the Spns2 homolog Spns1 was recently shown to transport lysophospholipids but not S1P in a H+-dependent manner25. How two related spinster homologs (54% sequence identity) acquire different substate specificity and coupling mechanism awaits elucidation.
STAR★Methods
RESOURCE AVAILABILITY
Lead contact
Further information and requests for resources and reagents should be directed to and will be fulfilled by the lead contact, Xiaochun Li (xiaochun.li@utsouthwestern.edu).
Materials availability
Plasmids generated in this study will be distributed upon request.
Data and code availability
The 3D cryo-EM density maps have been deposited in the Electron Microscopy Data Bank (EMDB) under the accession numbers EMD-28650, EMD-28651, EMD-28652, EMD-28653, EMD-28654, and EMD-29860. Atomic coordinates for the atomic model have been deposited in the Protein Data Bank (PDB) under the accession numbers 8EX4, 8EX5, 8EX6, 8EX7, 8EX8 and 8G92.
This paper does not report original code.
Any additional information required to reanalyze the data reported in this paper is available from the lead contact upon request.
EXPERIMENTAL MODEL AND SUBJECT DETAILS
Bacterial strains
SHuffle T7 Express Competent E. coli (New England Biolabs) was used to express Saposin A. The transformed cells were grown in terrific broth until the optical density at 600 nm reached 0.8, and then induced with 0.2 mM IPTG at 18°C overnight. E. coli DH5α competent cells (GoldBio) were used for molecular cloning and E. coli DH10Bac competent cells (Thermo Fisher) were used for production of recombinant bacmids, both of which were grown in LB broth (Fisher Scientific) with appropriate antibiotics.
Cell lines
Spodoptera frugiperda Sf9 cells (ATCC) were used to generate baculovirus and maintained in Sf-900 III SFM medium (Gibco) at 27°C with shaking. HEK293T cells (ATCC) were used for lentivirus generation. HEK293 cells (ATCC) were used for generating the stable cell line expressing SphK1-GFP fusion protein (HEK293-SphK1). HEK293-SphK1 cells were used for NBD-S1P or S1P export assays. HEK293S cells (ATCC) were used in the NBD-S1P uptake assays and to express Spns2 for cryo-EM studies. All HEK293 cell derivatives except HEK293S GnTI− were maintained in DMEM high glucose supplemented with 10% FBS and 1× penicillin-streptomycin at 37°C in a humidity and CO2 controlled incubator. HEK293S GnTI− cells were maintained in Freestyle 293 expression medium supplemented with 2% FBS and 1× penicillin-streptomycin at 37°C and 8% CO2 with shaking.
METHOD DETAILS
NBD-S1P Export Assays
Human SphK1 was cloned into pLVX-EF1α-IRES-Puro vector (TakaraBio) with a GFP fused at the C-terminus and used for generating lentivirus in HEK293T cells. HEK293 cells were transduced with the lentivirus to stably express SphK1 (HEK293-SphK1). Spns2 wild-type and variants were cloned into pcDNA3.1 vector (Invitrogen) with an mCherry fused at the C-terminus, except for Spns2cryo where the mCherry was fused at the N-terminus. Plasmids were transfected into HEK293-SphK1 cells using FuGene 6 transfection reagent (Promega) according to the manufacturer’s directions. Cells grown in 6-well plates were maintained in Dulbecco’s Modified Eagle Medium (high glucose, Sigma-Aldrich) supplemented with 10% FBS in an incubator at 37 °C and 8% CO2. The cells were harvested 24 h after transfection. Spns2 transport activity was assayed by using NBD-Sphingosine (Cayman Chemical), which is phosphorylated by SphKs to produce NBD-S1P in the cells. The cells were washed first with PBS and resuspended in assay buffer-1 (Hank’s balanced salt solution supplemented with 5 mM HEPES pH 7.5, 0.1% fatty acid-free bovine serum albumin, and 5 μM NBD-Sphingosine) at a density of 1.0 × 10⁶ cells per ml. The cell suspension was aliquoted to 100 μl per tube and incubated at 37 °C for 60 min. The supernatant was collected and subjected to lipid extraction in alkaline conditions34. Briefly, 90 μl supernatant was mixed with 180 μl chloroform–methanol (1:1) and 9 μl NH4OH (7 M), vortexed vigorously and incubated at room temperature for 5 min. Then, 180 μl chloroform was added to the mixture, followed by vigorous vortex and incubation at room temperature for 5 min. The mixture was centrifuged at 14,000×g for 5 min. The upper aqueous phase was transferred to a black 96-well microplate and mixed with ¼ volume of dimethylformamide. The fluorescence intensities were measured at 465/540 nm (Excitation/Emission) using Synergy Neo2 microplate reader (BioTek). A one-way ANOVA test followed by Dunnett’s multiple comparisons test was used to calculate statistical differences between wild-type Spns2 and mutants in Prism 9 (GraphPad). The unpaired Student’s t test was used to calculate statistical differences between inhibitor treated and non-treated conditions. Alternatively, the aqueous phase and organic phase were transferred to glass vials and dried under nitrogen flow, and the lipids were resuspended in chloroform–methanol (4:1). The lipids were spotted onto a TLC plate (Supelco HPTLC silica gel 60) and separated with mobile phase 1-Butanol–Acetic Acid–Water (3:1:1). Fluorescent lipids were visualized by ChemiDoc MP imaging system (Bio-Rad).
To test the effect of pHs and different cations Spns2 transport activity, Spns2WT-mCherry and human SphK1-GFP were co-transfected into HEK293 cells. Buffer-2 (140 mM NaCl, 20 mM HEPES-NaOH pH 7.5, 2 mM CaCl2, 1 g/L D-glucose), buffer-3 (140 mM KCl, 20 mM HEPES-KOH pH 7.5, 2 mM CaCl2, 1 g/L D-glucose), buffer-4 (140 mM N-methyl-D-glucamine, 20 mM HEPES-NaOH pH 7.5, 2 mM CaCl2, 1 g/L D-glucose), buffer-5 (140 mM NaCl, 20 mM Tris-HCl pH 8.5, 2 mM CaCl2, 1 g/L D-glucose), buffer-6 (140 mM NaCl, 20 mM MES pH 6.5, 2 mM CaCl2, 1 g/L D-glucose), or Hank’s balanced salt solution with 5 mM HEPES pH 7.5 was used.
S1P Measurements by LC-MS
The transfected HEK293-SphK1 cells were washed first with 0.1% fatty-acid-free BSA in DMEM (high glucose) medium and incubated in DMEM (high glucose) supplemented with 10 mM β-glycerophosphate, 5 mM sodium fluoride, 2 mM semicarbazide and 2 μM sphingosine (d18:1) at 37 °C for 60 min. The conditioned medium was harvested and S1P was detected using liquid chromatography–mass spectrometry (LC-MS) based on the previously published methods43. In brief, samples were extracted twice using a monophasic mixture of methanol (MeOH) and dichloromethane. Lipid extracts were hydrolyzed for 2 hours at 48 °C with 100 mM potassium hydroxide. Samples were injected in to an HPLC and resolved using a Phenomenex Kinetex C18 column (50×2.1 mm; 2.6 μM particle size) with a gradient of A (58:41:1 MeOH: H2O: formic acid) and B (99:1 MeOH: formic acid). S1P was ionized using electrospray in the positive mode and detected by multiple reaction monitoring (MRM) with the 380.3 Da and 264.4 Da mass pair.
NBD-S1P Uptake Assay
HEK293S cells (ATCC, CRL-3022) were seeded from the suspension culture into 6-well plates in FreeStyle 293 medium supplemented with 10% FBS in an incubator at 37 °C and 5% CO2. The next day cells were transfected with plasmids using FuGene 6 and incubated for an additional 24 h. The cells were trypsinized, washed with ice-cold PBS and suspended in HBSS supplemented with 5 mM HEPES pH 7.5, 0.1% fatty acid-free BSA and 1 μM NBD-S1P. The cells were reseeded in a 24-well plate at a density of 3×10⁵ cells per well and incubated at 37 °C for 30 min. The cells were harvested and washed twice with ice-cold PBS. The cell pellets were resuspended in 200 μl PBS and subjected to lipid extraction under acidic condition as described previously44. Briefly, the cell suspension was added with 20 μl HCl (1N) and 400 μl chloroform–methanol–10N HCl (100:200:1), vortexed vigorously and incubated at room temperature for 5 min. Then 300 μl chloroform and 300 μl KCl (2 M) were added to the mixture, followed by vigorous vortex and incubation at room temperature for 5 min. The mixture was centrifuged at 1000×g for 5 min. The organic phase was transferred to a glass vial and dried under nitrogen flow, and the lipids were resuspended in chloroform–methanol (4:1). The lipids were spotted onto a TLC plate (Supelco HPTLC silica gel 60) and separated with mobile phase 1-Butanol–Acetic Acid–Water (3:1:1). Fluorescent lipids were visualized by ChemiDoc MP imaging system (Bio-Rad), and images were quantified by Image Lab software version 6.1 (Bio-Rad).
Spns2 Cellular Localization
One day before transfection, HEK293 cells were seeded in 35 mm glass bottom dishes (Cellvis) at a density of 1.5×10⁵ cells per dish. The cells were transfected with plasmids encoding Spns2-mCherry wild-type and variants. After 24 h post transfection, the cell nuclei were stained by Hoechst 33342 (Invitrogen) and fluorescence images were acquired using a Zeiss LSM 800 microscope system (Zeiss).
Immunoblotting
HEK293 cells were transfected with plasmids encoding Spns2-mCherry wild-type and variants using FuGene 6 transfection reagent in 60 mm dishes. 48 h post transfection, cells were harvested and whole cell lysates were prepared using RIPA buffer (Thermo Scientific) supplemented with protease inhibitor cocktail (Roche). Protein samples were loaded Bolt 4–12% Bis-Tris plus gels (Invitrogen) and transferred to TransBlot Turbo nitrocellulose membranes (Bio-Rad). Membranes were blocked for 1 h at room temperature with 5% milk in PBS with 0.05% Tween 20 (PBST). Primary antibodies were diluted in PBST and incubated with membranes for 2 h at room temperature. Membranes were washed three times with PBST each for 5 min at room temperature, then incubated with anti-mouse IgG HRP-linked secondary antibody (Cell Signaling Technology) diluted in PBST for 1 h at room temperature. After three more washes with PBST, membranes were developed for 2 min at room temperature using SuperSignal West Pico PLUS Chemiluminescent Substrate (Thermo Scientific) and then imaged using the LI-COR Odyssey Fc imaging system. The following primary antibodies were used: Actin (C2), Santa Cruz, cat# sc-8432 (1:3,000); FLAG (FLA-1), MBL International, cat# M185–3L (1:3,000); mCherry (1C51), Novus Biologicals cat# NBP1–96752SS (1:2,000).
Protein expression and purification of human Spns2cryo
The complementary DNA (cDNA) encoding human Spns2 was cloned into the pEG BacMam vector45. For Spns2cryo, an N-terminal mVenus tag46 was inserted before the coding sequence of MBP, followed by a helical linker, Spns2 (residues 103–549), and a C-terminal DARPin (off7). For the functional analyses of Spns2cryo, the mVenus tag is replaced by mCherry. Spns2cryo proteins were expressed in HEK293S GnTI− cells. Baculoviruses were produced by transfecting Sf9 cells with the bacmids using TransIT Insect (Mirus). After one or two rounds of amplification, viruses were used for cell transduction. When HEK293S GnTI− suspension cultures were grown to a density of 4 × 10⁶ cells/ml at 37 °C, baculoviruses (10% v/v) were added to initiate transduction. After 14 h, 10 mM sodium butyrate was supplemented to the cultures, and the culture temperature was shifted to 25 °C. Cells were collected at 60 h post-transduction.
The pellet of cells expressing Spns2cryo was resuspended using hypotonic buffer (10 mM NaCl, 1 mM MgCl2, 20 mM HEPES pH 7, benzonase, and protease inhibitors) for 30 min. The cell lysate was then spun at 39,800 g for 30 mins to sediment crude membranes. The membrane pellet was mechanically homogenized and solubilized in extraction buffer (1.5% digitonin, 300 mM NaCl, 20 mM HEPES pH 7, 1 mM TCEP, and protease inhibitors) for 1.5 hours. Solubilized membranes were clarified by centrifugation at 39,800 g for 45 min. The supernatant was applied to a GFP nanobody-coupled Sepharose resin, which was subsequently washed with 10 column volumes of wash buffer A (0.05% digitonin, 150 mM NaCl, 20 mM HEPES pH 7, 4 mM NaATP, 4 mM MgCl2, and 1 mM TCEP), followed by 7 column volumes of wash buffer B (0.05% digitonin, 150 mM NaCl, 20 mM HEPES pH 7, and 1 mM TCEP). The washed resin was incubated with Saposin A, at a molar ratio of 1:15 (Spns2: Saposin A). After 30 mins, γ-cyclodextrin was added to the sample to remove digitonin and initialize the nanodisc reconstitution. After 14 hours, the resin was washed with 15 column volumes of wash buffer C (150 mM NaCl, 20 mM HEPES pH 7, and 1 mM TCEP). The washed resin was incubated with 3C protease for 2 hours at a target protein to protease ratio of 40:1 (w/w) to cleave off mVenus and release the protein from the resin. The protein was eluted with wash buffer C, concentrated, and further purified by gel-filtration chromatography using a Superose 6 Increase column equilibrated with SEC buffer (150 mM NaCl, 20 mM HEPES pH 7, and 1 mM TCEP). Peak fractions were pooled and concentrated to desired concentrations for cryo-EM experiments. Co-purified S1P was detected by LC-MS using the same procedure as described above.
Expression and purification of Saposin A
Saposin A with an N-terminal His tag and a 3C protease cleavage site was expressed in E.coli Shuffle cells. The cells were lysed in buffer D (150 mM NaCl, 20 mM imidazole, and 20 mM HEPES, pH 7.5). The cell lysate was centrifuged, and the supernatant was incubated at 80 °C for 10 mins. The supernatant was centrifuged again before loaded onto a Ni-NTA (Qiagen) column. The resin was washed with 20 column volumes of buffer E (150 mM NaCl, 40 mM imidazole, and 20 mM HEPES, pH 7.5) and the protein was eluted with buffer E with 250 mM imidazole. The His tag was removed by incubation with His-tagged 3C protease at a Saposin A to 3C protease ratio of 40:1 (w/w). After dialysis overnight at 4 °C against 2 L of 150 mM NaCl and 20 mM HEPES pH 7.5, the sample was loaded onto a Ni-NTA column to separate the cleaved Saposin A and His-tagged 3C protease. The protein was further purified using a Superdex75 column equilibrated with 150 mM NaCl and 20 mM HEPES pH 7.5. The Saposin A-containing fractions were concentrated to ~5 mg/ml and stored at −80 °C.
Cryo-EM sample preparation and data acquisition
Protein samples were concentrated to 10 mg/ml. For the relevant samples, 18:1 S1P or 16d was added to a final concentration of 1 mM (nominal) or 300 μM, respectively. We spun down the protein sample and removed the insoluble S1P before grid preparation. Aliquots of 3.5 μl protein samples were applied to plasma-cleaned UltrAuFoil R1.2/1.3 300 mesh grids (Quantifoil). After 25 s, the grids were blotted for 3 s and plunged into liquid ethane using a Vitrobot Mark IV (FEI) operated at 10 °C and 100% humidity. The grids were loaded onto a 300 kV Titan Krios transmission electron microscope for data collection. Raw movie stacks were recorded with a K3 camera at a physical pixel size of 0.649 Å per pixel and a nominal defocus range of 0.6–1.6 μm. The exposure time for each micrograph was 2 s, dose-fractionated into 70 frames with a dose rate of ~0.93–1.07 e−/pixel/s. For the inhibitor 16d dataset, protein samples were applied to Quantifoil R1.2/1.3 400 mesh Au holey carbon grids (Quantifoil). The grids were blotted for 4.5 s and plunged into liquid ethane using a Vitrobot Mark IV (FEI) operated at 22 °C and 100% humidity. Raw movie stacks were collected at 0.83 Å per pixel and a nominal defocus range of 1–2 μm. The exposure time for each micrograph was 5 s, dose-fractionated into 50 frames with a dose rate of ~1.2 e−/pixel/s.
Cryo-EM Image Processing
For datasets without the inhibitor 16d, the image stacks were gain-normalized and corrected for beam-induced motion using MotionCor247. Defocus parameters were estimated from motion-corrected images using cryoSPARC348. Micrographs not suitable for further analysis were removed by manual inspection. Particle picking (blob picker and template picker) and 2D classifications were done in cryoSPARC3 (Figure S2A). After 2D classifications, selected particles were used for training in the Topaz particle-picking pipeline49. Particles picked by Topaz were subjected to 2D classifications. Selected particles were combined with particles from blob picker and template picker, and duplicated particles were removed. Iterative 3D classifications were then performed with subsequent ab initio reconstructions and heterogeneous refinements to remove suboptimal particles and to separate particle populations that belong to different states. Particles of individual classes were then refined with nonuniform refinements48, followed by local refinements with soft masks covering Spns2 to further improve the map quality. The refined particles were subjected to Bayesian polishing in RELION 3.150. The polished particles were imported into cryoSPARC3 where additional nonuniform and local refinements were performed (Figure S2A).
For dataset with the inhibitor 16d, dark subtracted images were first normalized by gain reference. Motion correction was performed using MotionCor2 and performed in RELION 3.150. The contrast transfer function (CTF) was estimated using CTFFIND451. Auto picking was performed with crYOLO v1.7.6 using the general model52 with the particle threshold of 0.1. Subsequent 2D classification, multi-class ab-initio reconstruction, heterogenous 3D refinement were performed in cryoSPARC3. Particles of individual classes were then refined with nonuniform refinements48, followed by local refinements with soft masks covering Spns2 to further improve the map quality (Figure S7A). The mask-corrected FSC curves were calculated in cryoSPARC3 (Figure S1A and S7B), and reported resolutions are based on the 0.143 criterion. Local resolution estimations were performed in cryoSPARC3 (Figure S3A and S7D).
Model building and refinement
A predicted model of inward-facing Spns2 was generated by AlphaFold53. This model was docked into the density map using Chimera54. The model was then refined iteratively using Coot55 and Phenix56. The model of outward-facing Spns2 was generated by splitting the model of inward-facing Spns2 into two parts: N-domain and C-domain. These two parts were then docked into the density map independently. The resulting model was refined iteratively using Coot and Phenix. The Spns2 structural models include residues 103–284, 301–346, and 360–539. Structural model validation was performed using Phenix and MolProbity57. Figures were prepared using PyMOL and Chimera.
Construction of model
The Spns2 structure was modeled as follows. The atomic coordinates were constructed from the 16d-bound Spns2. For the 16d ligand, the hydrogen atoms were constructed using Avogadro (http://avogadro.cc/); the force field parameters were obtained using the CGenFF server58.
Hydrogen atoms were added using H-build from CHARMM59. An initial protonation pattern at pH 7 was obtained by calculating the pKa values of all titratable residues. For this, electrostatic energy computations were carried out with PROPKA60. Based on these results, a disulfide bridge was constructed between Cys353-Cys358. Next, using the CHARMM-GUI61 and OPM database62, the protein was inserted in a lipid bilayer consisting of a cytosolic leaflet and an extracellular leaflet. The cytosolic leaflet contains 40% cholesterol, 20% dilauroyl-Dglycero-1-Phosphatidylethanolamine (DLPE), 20% DLPS (dilauroyl-D-glycero-1-Phosphatidylserine), and 20% Di-myristoyl-inositol (DMPI); the extracellular leaflet contains 40% cholesterol, 30% sphingomyelin and 30% didecanoyl-D-glycero-3-Phosphatidylcholine (DDPC). The protein-membrane system was next solvated in water with 150 mM KCl concentration, resulting in K+ (114) and Cl− (64) ions to neutralize charge, and 23,351 explicit TIP3 water molecules63. The total system (109,171 atoms) was simulated in a rectangular box of dimension 100.7 Å × 100.7 Å × 116.8 Å.
Geometry optimizations and molecular dynamics
The initial geometry of each solvated protein-membrane complex was optimized with 1500 steps of steepest descent (SD) energy minimization, followed by 1500 adopted basis Newton-Raphson (ABNR) steps to remove any close contacts. Energy minimizations and geometry optimizations were carried out with NAMD64 using the all-atom CHARMM36 parameter set for the protein and lipid molecules65 and the TIP3P model for water molecules63. The initial geometry of each solvated protein-membrane complex was optimized with 10,000 steps of conjugate gradient energy minimization to remove any close contacts. All energy minimizations used the all-atom CHARMM36 parameter set for the protein, lipid, and ion molecules and the TIP3P model for water molecules63. The solvated ligand-protein-membrane complex was simulated with molecular dynamics (MD) at 310 K according to the following protocol: 1) equilibration MD with Langevin dynamics (time step of 1 fs) for 50 ps followed by CPT dynamics (time step 2 fs) for 350 ps; 2) production MD with CPT dynamics (time step 2 fs) for 100 ns. To simulate a continuous system, periodic boundary conditions were applied. Electrostatic interactions were summed with the Particle Mesh Ewald method66 (grid spacing ~0.92.; fftx 108, ffty 108, fftz 128). A nonbonded cutoff of 16.0 was used, and Heuristic testing was performed at each energy call to evaluate whether the nonbonded pair list should be updated.
QUANTIFICATION AND STATISTICAL ANALYSIS
Statistical analyses of data were performed using GraphPad Prism 9. Quantification methods and tools used are described in each relevant section of the methods or figure legends.
Supplementary Material
(A) Schematic of Spns2cryo construct.
(B) Experimental flow diagram of Spns2 functional assays. Created with BioRender.com.
(C) Thin layer chromatography (TLC) analyses of lipid extractions from the media/pellets of Spns2WT overexpressing cells. The aqueous phase of the supernatant sample used for fluorescence measurements contains mostly the cell-exported NBD-S1P. The positions of NBD-S1P and NBD-Sph on the TLC plates are marked. *, **, other NBD-coupled metabolites.
(A) Summary of image processing procedures of Spns2cryo. Left, the dataset in the absence of additional S1P supplement. Right, the dataset in the presence of additional S1P supplement. All procedures were done in cryoSPARC, except for particle polishing which was in RELION. The two inward-facing open structures are similar and thus are labeled as state 1 and state 1*.
(B) Fourier shell correlation (FSC) curves between two half maps.
(C) Angular distribution of particles for the final 3D reconstructions.
(A) Local resolution of cryo-EM maps. Maps are colored according to local resolution, estimated using cryoSPARC. The two inward-facing open structures are similar and thus are labeled as state 1 and state 1*.
(B) cryo-EM map of the transmembrane helix (TM) of Spns2 in state 1.
(C) cryo-EM density of S1P with surrounding residues in state 1.
(D) cryo-EM map of the transmembrane helix (TM) of Spns2 in state 1*.
Lipids were extracted from the purified Spns2cryo sample (without supplemented with additional S1P) that was used for cryo-EM study. The blank buffer (A), S1P (d18:1) standard (B), and lipid extracts from purified proteins (C) were measured by LC-MS. The retention time of S1P is 2.89 min, and the peaks in the three panels are shown on the same scale. The experiments were conducted with two samples which were purified on different days. Similar results were obtained.
(A) Structure of Spns2 in the state 1. S1P is shown as stick in gray.
(B) Structure of Mfsd2a in the inward-open state (PDB: 7MJS). The lysophosphatidylcholine (LPC) is shown as stick in orange.
(C) Structural comparison between Mfsd2a (gray) and Spns2 (blue).
(D) Sequence alignment between Spns1, Spns2, Mfsd2a and Mfsd2b. The key residues for substrate and sodium binding are highlighted. Hs, Homo sapiens; Gg, Gallus gallus; Mm, Mus musculus.
A representative thin layer chromatography analysis is shown. Control, mCherry alone. The band intensity of the sample from wild-type Spns2 in HBSS (Hank’s balanced salt solution) is used for normalizing the signals from the other conditions.
(A) Summary of image processing procedures of 16d-bound Spns2cryo. All procedures were done in cryoSPARC, except for particle polishing and 3D classification without image alignment which were in RELION.
(B) Fourier shell correlation (FSC) curves between two half maps.
(C) Angular distribution of particles for the final 3D reconstructions.
(D) Local resolution of cryo-EM map. Map is colored according to local resolution, estimated using cryoSPARC.
(E) cryo-EM density of 16d ligand. The 16d is shown as sticks in orange.
(F) cryo-EM density of 16d with surrounding residues.
Supplementary Video 1 Conformational changes of Spns2 in distinct states, related to Figures 2, 3 and 4
Molecular dynamics trajectory showing 16d exploring the intracellular cavity in a time span of 100 ns. 16d is shown as sticks in cyan and all sidechains within 3-Å distance of 16d are depicted.
Key resources table
| REAGENT or RESOURCE | SOURCE | IDENTIFIER |
|---|---|---|
| Antibodies | ||
| Mouse monoclonal anti-FLAG tag antibody | MBL International | Cat# M185-3L; RRID:AB_11123930 |
| Mouse monoclonal anti-mCherry antibody | Novus Biologicals | Cat# NBP1-96752SS; RRID:AB_11008969 |
| Mouse monoclonal anti-Actin antibody | Santa Cruz Biotechnology | Cat# sc-8432; RRID: AB_626630 |
| Anti-mouse IgG, HRP-linked antibody | Cell Signaling Technology | Cat# 7076; RRID:AB_330924 |
| Bacterial and Virus Strains | ||
| E. coli DH5α Competent Cells | GoldBio | Cat# CC-101-TR |
| E. coli DH10Bac Competent Cells | Thermo Fisher | Cat# 10361012 |
| SHuffle T7 Express Competent E. coli | New England Biolabs | Cat# C3029J |
| Chemicals, Peptides, and Recombinant Proteins | ||
| LB broth | Fisher Scientific | Cat# BP1426-500 |
| Sf-900 III SFM medium | Gibco | Cat# 12658027 |
| Freestyle 293 expression medium | Gibco | Cat# 12338018 |
| HEPES | Gibco | Cat# 11344041 |
| Sodium butyrate | Millipore-Sigma | Cat# 303410 |
| Phenylmethylsulfonyl fluoride (PMSF) | GoldBio | Cat# P-470-25 |
| Leupeptin | vivitide | Cat# ILP-4041 |
| Benzonase nuclease | Millipore-Sigma | Cat# E1014-25KU |
| Digitonin | Thermo Scientific | Cat# 407560050 |
| TCEP solution | Thermo Scientific | Cat# 77720 |
| 3C protease | GenScript | Cat# Z03092 |
| d18:1 Sphingosine 1-phosphate | Echelon Biosciences | Cat# S20001MG |
| Spns2 inhibitor 16d (SLF1081851) | MedChemExpress | Cat# HY-149004 |
| γ-Cyclodextrin | Millipore-Sigma | Cat# C4892-5G |
| Ni-NTA agarose | Qiagen | Cat# 30250 |
| Isopropyl-beta-D-thiogalactoside (IPTG) | GoldBio | Cat# I2481C100 |
| Octyl Maltoside, Fluorinated | Anatrace | Cat# O310F 1 GM |
| DMEM high glucose medium | Millipore-Sigma | Cat# D5796-500ML |
| Fetal Bovine Serum (FBS) | Cytiva | Cat# SH30396.03 |
| Puromycin dihydrochloride | Millipore-Sigma | Cat# P8833 |
| Penicillin-Streptomycin solution (100x) | Corning | Cat# 30-002-CI |
| NBD-Sphingosine | Cayman Chemical | Cat# 25348 |
| d18:1 Sphingosine | Avanti Polar Lipids | Cat# 860490 |
| NBD Sphingosine-1-Phosphate | Avanti Polar Lipids | Cat# 810207 |
| Fatty Acid Free Bovine Serum Albumin (BSA) | GoldBio | Cat# A-421-10 |
| N-Methyl-D-glucamine | Millipore-Sigma | Cat# 90928 |
| D-glucose | Millipore-Sigma | Cat# G7021 |
| Hank’s balanced salt solution | Gibco | Cat# 14025076 |
| N,N-Dimethylformamide | Millipore-Sigma | Cat# D4551-500ML |
| Ammonium hydroxide solution | Millipore-Sigma | Cat# 221228-100ML-A |
| Hoechst 33342 | Invitrogen | Cat# R37605 |
| FuGENE 6 transfection reagent | Promega | Cat# E2692 |
| TransIT-Insect transfection reagent | Mirus | Cat# MIR 6100 |
| X-tremeGENE HP DNA Transfection Reagent | Millipore-Sigma | Cat# XTGHP-RO |
| cOmplete Mini protease inhibitor cocktail | Roche | Cat# 04693124001 |
| RIPA Lysis and Extraction Buffer | Thermo Scientific | Cat# 89900 |
| Phosphate buffered saline with Tween 20 (PBST) | Millipore-Sigma | Cat# 08057-100TAB-F |
| Deposited Data | ||
| Cryo-EM structure of chicken Mfsd2a (inward-facing sate) | Cater et al.26 | PDB: 7MJS; EMDB: EMD-23883 |
| Cryo-EM structure of mouse Mfsd2a (outward-facing state) | Wood et al.27 | PDB: 7N98; EMDB: EMD-24252 |
| Cryo-EM structure of SPNS2-S1P (Inward-facing open, state 1) | This paper | PDB: 8EX4; EMDB: EMD-28650 |
| Cryo-EM structure of SPNS2 (Outward-facing open, state 4) | This paper | PDB: 8EX5; EMDB: EMD-28651 |
| Cryo-EM structure of SPNS2-S1P (Inward-facing open, state 1*) | This paper | PDB: 8EX6; EMDB: EMD-28652 |
| Cryo-EM structure of SPNS2 (Outward-facing partially occluded, state 2) | This paper | PDB: 8EX7; EMDB: EMD-28653 |
| Cryo-EM structure of SPNS2 (Outward-facing partially occluded, state 3) | This paper | PDB: 8EX8; EMDB: EMD-28654 |
| Cryo-EM structure of SPNS2-16d | This paper | PDB: 8G92; EMDB: EMD-29860 |
| Experimental Models: Cell Lines | ||
| Sf9 insect cell | ATCC | Cat# CRL-1711; RRID:CVCL_0549 |
| HEK293S GnTI− | ATCC | Cat# CRL-3022; RRID:CVCL_A785 |
| HEK293T | ATCC | Cat# CRL-3216 |
| HEK293 | ATCC | Cat# CRL-1573 |
| HEK293-SphK1 stable cell line | This paper | N/A |
| Recombinant DNA | ||
| pLVX-EF1α-IRES-Puro | Takara Bio | Cat# 631988 |
| pLVX-EF1α-IRES-Puro-SphK1-GFP | This paper | N/A |
| pcDNA3.1 | Invitrogen | Cat# V79020 |
| pcDNA3.1-SphK1-GFP | This paper | N/A |
| pcDNA3.1-Spns2FL-mCherry | This paper | N/A |
| pcDNA3.1-mCherry-MBP-Spns2aa103-549-DARPin(off7) | This paper | N/A |
| pEG BacMam-mVenus-MBP-Spns2aa103-549-DARPin(off7) | This paper | N/A |
| pET21b-6×His-Saposin A | This paper | N/A |
| pET21b- GFP nanobody-6×His | This paper | N/A |
| Software and Algorithms | ||
| MotionCor2 | Zheng et al.47 | https://emcore.ucsf.edu/ucsf-motioncor2 |
| CTFFIND4 | Rohou and Grigorieff51 | http://grigoriefflab.janelia.org/ctffind4 |
| RELION 3.1 | Zivanov et al.50 | https://www3.mrc-lmb.cam.ac.uk/relion/ |
| SPHIRE-crYOLO v1.7.6 | Wagner et al.52 | http://sphire.mpg.de/ |
| Topaz | Bepler et al.49 | https://cb.csail.mit.edu/cb/topaz/ |
| cryoSPARC v3.3.1 | Punjani et al.48 | https://cryosparc.com/ |
| UCSF Chimera 1.13 | Pettersen et al.54 | http://www.cgl.ucsf.edu/chimera |
| Coot 0.9.6 | Emsley et al.55 | https://www2.mrc-lmb.cam.ac.uk/personal/pemsley/coot/ |
| Phenix 1.16 | Adams et al.56 | http://www.phenix-online.org/ |
| PyMOL 2.3.4 | Schrödinger | https://pymol.org/2/ |
| MolProbity | Williams et al.57 | http://molprobity.biochem.duke.edu |
| Prism 9 | GraphPad | https://www.graphpad.com/ |
| Avogadro | Avogadro Chemistry | https://avogadro.cc/ |
| CHARMM | Brooks et al.59 | https://www.charmm.org/ |
| PROPKA | Li et al.60 | https://github.com/jensengroup/propka |
| NAMD | Phillips et al.64 | http://www.ks.uiuc.edu/Research/namd/ |
| Other | ||
| SuperSignal West Pico PLUS Chemiluminescent Substrate | Thermo Scientific | Cat# 34580 |
| R1.2/1.3 400 mesh Au holey carbon grids | Quantifoil | Cat# 1210627 |
| Superdex 75 Increase 10/300 GL column | Cytiva | Cat# 29148721 |
| Superose 6 Increase 10/300 GL column | Cytiva | Cat# 29091596 |
| CNBr-activated Sepharose 4B | Cytiva | Cat# 17-0430-01 |
| Phenomenex Kinetex C18 column | Phenomenex | Cat# 00B-4462-AN |
| HPTLC Silica gel 60 | Millipore-Sigma | Cat# 1056310001 |
Highlights:
MBP/DARPin fusion facilitates structural determination of small membrane proteins
Cryo-EM structures of human Spns2 reveal S1P transport mechanism
Spns2 exports S1P through facilitated diffusion
The inhibitor 16d locks Spns2 in an inward-facing state
Acknowledgments
The Cryo-EM data were collected at the Cryo-EM Center of the St. Jude Children’s Research Hospital and at the UT Southwestern Medical Center Cryo-EM Facility (funded in part by the CPRIT Core Facility Support Award RP170644). We thank Y. Wang for cell culture. We thank I. Chen and E. Debler for editing the manuscript and thank J. Saunders and J. Fortanet (Casma Therapeutics) for 16d synthesis. This work was supported by NIH P01 HL160487 and 1P30DK127984 (to J.G.M.), R01 GM135343 and Welch Foundation (I-1957) (to X.L.), NIH R01 GM143282 (to C.-H.L) and by ALSAC (to C.-H.L). X.L. is a Damon Runyon-Rachleff Innovator supported by the Damon Runyon Cancer Research Foundation (DRR-53S-19).
Inclusion and diversity
We support inclusive, diverse, and equitable conduct of research.
Footnotes
Publisher's Disclaimer: This is a PDF file of an unedited manuscript that has been accepted for publication. As a service to our customers we are providing this early version of the manuscript. The manuscript will undergo copyediting, typesetting, and review of the resulting proof before it is published in its final form. Please note that during the production process errors may be discovered which could affect the content, and all legal disclaimers that apply to the journal pertain.
Declaration of interests
The authors declare no competing interests.
References:
- 1.Cartier A, and Hla T (2019). Sphingosine 1-phosphate: Lipid signaling in pathology and therapy. Science 366. 10.1126/science.aar5551. [DOI] [PMC free article] [PubMed] [Google Scholar]
- 2.Rosen H, Stevens RC, Hanson M, Roberts E, and Oldstone MB (2013). Sphingosine-1-phosphate and its receptors: structure, signaling, and influence. Annual review of biochemistry 82, 637–662. 10.1146/annurev-biochem-062411-130916. [DOI] [PubMed] [Google Scholar]
- 3.Proia RL, and Hla T (2015). Emerging biology of sphingosine-1-phosphate: its role in pathogenesis and therapy. The Journal of clinical investigation 125, 1379–1387. 10.1172/JCI76369. [DOI] [PMC free article] [PubMed] [Google Scholar]
- 4.Green CD, Maceyka M, Cowart LA, and Spiegel S (2021). Sphingolipids in metabolic disease: The good, the bad, and the unknown. Cell metabolism 33, 1293–1306. 10.1016/j.cmet.2021.06.006. [DOI] [PMC free article] [PubMed] [Google Scholar]
- 5.Lu E, and Cyster JG (2019). G-protein coupled receptors and ligands that organize humoral immune responses. Immunol Rev 289, 158–172. 10.1111/imr.12743. [DOI] [PMC free article] [PubMed] [Google Scholar]
- 6.Spiegel S, Maczis MA, Maceyka M, and Milstien S (2019). New insights into functions of the sphingosine-1-phosphate transporter SPNS2. Journal of lipid research 60, 484–489. 10.1194/jlr.S091959. [DOI] [PMC free article] [PubMed] [Google Scholar]
- 7.Kawahara A, Nishi T, Hisano Y, Fukui H, Yamaguchi A, and Mochizuki N (2009). The sphingolipid transporter spns2 functions in migration of zebrafish myocardial precursors. Science 323, 524–527. 10.1126/science.1167449. [DOI] [PubMed] [Google Scholar]
- 8.Osborne N, Brand-Arzamendi K, Ober EA, Jin SW, Verkade H, Holtzman NG, Yelon D, and Stainier DY (2008). The spinster homolog, two of hearts, is required for sphingosine 1-phosphate signaling in zebrafish. Current biology : CB 18, 1882–1888. 10.1016/j.cub.2008.10.061. [DOI] [PMC free article] [PubMed] [Google Scholar]
- 9.Nagahashi M, Kim EY, Yamada A, Ramachandran S, Allegood JC, Hait NC, Maceyka M, Milstien S, Takabe K, and Spiegel S (2013). Spns2, a transporter of phosphorylated sphingoid bases, regulates their blood and lymph levels, and the lymphatic network. FASEB J 27, 1001–1011. 10.1096/fj.12-219618. [DOI] [PMC free article] [PubMed] [Google Scholar]
- 10.Vu TM, Ishizu AN, Foo JC, Toh XR, Zhang F, Whee DM, Torta F, Cazenave-Gassiot A, Matsumura T, Kim S, et al. (2017). Mfsd2b is essential for the sphingosine-1-phosphate export in erythrocytes and platelets. Nature 550, 524–528. 10.1038/nature24053. [DOI] [PubMed] [Google Scholar]
- 11.Kobayashi N, Kawasaki-Nishi S, Otsuka M, Hisano Y, Yamaguchi A, and Nishi T (2018). MFSD2B is a sphingosine 1-phosphate transporter in erythroid cells. Scientific reports 8, 4969. 10.1038/s41598-018-23300-x. [DOI] [PMC free article] [PubMed] [Google Scholar]
- 12.Hisano Y, Kobayashi N, Yamaguchi A, and Nishi T (2012). Mouse SPNS2 functions as a sphingosine-1-phosphate transporter in vascular endothelial cells. PloS one 7, e38941. 10.1371/journal.pone.0038941. [DOI] [PMC free article] [PubMed] [Google Scholar]
- 13.Fukuhara S, Simmons S, Kawamura S, Inoue A, Orba Y, Tokudome T, Sunden Y, Arai Y, Moriwaki K, Ishida J, et al. (2012). The sphingosine-1-phosphate transporter Spns2 expressed on endothelial cells regulates lymphocyte trafficking in mice. The Journal of clinical investigation 122, 1416–1426. 10.1172/JCI60746. [DOI] [PMC free article] [PubMed] [Google Scholar]
- 14.Nijnik A, Clare S, Hale C, Chen J, Raisen C, Mottram L, Lucas M, Estabel J, Ryder E, Adissu H, et al. (2012). The role of sphingosine-1-phosphate transporter Spns2 in immune system function. Journal of immunology 189, 102–111. 10.4049/jimmunol.1200282. [DOI] [PMC free article] [PubMed] [Google Scholar]
- 15.Hisano Y, Kobayashi N, Kawahara A, Yamaguchi A, and Nishi T (2011). The sphingosine 1-phosphate transporter, SPNS2, functions as a transporter of the phosphorylated form of the immunomodulating agent FTY720. The Journal of biological chemistry 286, 1758–1766. 10.1074/jbc.M110.171116. [DOI] [PMC free article] [PubMed] [Google Scholar]
- 16.Kappos L, Radue EW, O’Connor P, Polman C, Hohlfeld R, Calabresi P, Selmaj K, Agoropoulou C, Leyk M, Zhang-Auberson L, et al. (2010). A placebo-controlled trial of oral fingolimod in relapsing multiple sclerosis. N Engl J Med 362, 387–401. 10.1056/NEJMoa0909494. [DOI] [PubMed] [Google Scholar]
- 17.Brinkmann V, Billich A, Baumruker T, Heining P, Schmouder R, Francis G, Aradhye S, and Burtin P (2010). Fingolimod (FTY720): discovery and development of an oral drug to treat multiple sclerosis. Nature reviews. Drug discovery 9, 883–897. 10.1038/nrd3248. [DOI] [PubMed] [Google Scholar]
- 18.Chen J, Ingham N, Kelly J, Jadeja S, Goulding D, Pass J, Mahajan VB, Tsang SH, Nijnik A, Jackson IJ, et al. (2014). Spinster homolog 2 (spns2) deficiency causes early onset progressive hearing loss. PLoS Genet 10, e1004688. 10.1371/journal.pgen.1004688. [DOI] [PMC free article] [PubMed] [Google Scholar]
- 19.Fang C, Bian G, Ren P, Xiang J, Song J, Yu C, Zhang Q, Liu L, Chen K, Liu F, et al. (2018). S1P transporter SPNS2 regulates proper postnatal retinal morphogenesis. FASEB J 32, 3597–3613. 10.1096/fj.201701116R. [DOI] [PubMed] [Google Scholar]
- 20.Donoviel MS, Hait NC, Ramachandran S, Maceyka M, Takabe K, Milstien S, Oravecz T, and Spiegel S (2015). Spinster 2, a sphingosine-1-phosphate transporter, plays a critical role in inflammatory and autoimmune diseases. FASEB J 29, 5018–5028. 10.1096/fj.15-274936. [DOI] [PMC free article] [PubMed] [Google Scholar]
- 21.Okuniewska M, Fang V, Baeyens A, Raghavan V, Lee JY, Littman DR, and Schwab SR (2021). SPNS2 enables T cell egress from lymph nodes during an immune response. Cell reports 36, 109368. 10.1016/j.celrep.2021.109368. [DOI] [PMC free article] [PubMed] [Google Scholar]
- 22.van der Weyden L, Arends MJ, Campbell AD, Bald T, Wardle-Jones H, Griggs N, Velasco-Herrera MD, Tuting T, Sansom OJ, Karp NA, et al. (2017). Genome-wide in vivo screen identifies novel host regulators of metastatic colonization. Nature 541, 233–236. 10.1038/nature20792. [DOI] [PMC free article] [PubMed] [Google Scholar]
- 23.Yasuda S, Sumioka T, Miyajima M, Iwanishi H, Morii T, Mochizuki N, Reinach PS, Kao WWY, Okada Y, Liu CY, and Saika S (2022). Anomaly of cornea and ocular adnexa in spinster homolog 2 (Spns2) knockout mice. Ocul Surf 26, 111–127. 10.1016/j.jtos.2022.08.007. [DOI] [PubMed] [Google Scholar]
- 24.Quistgaard EM, Low C, Guettou F, and Nordlund P (2016). Understanding transport by the major facilitator superfamily (MFS): structures pave the way. Nature reviews. Molecular cell biology 17, 123–132. 10.1038/nrm.2015.25. [DOI] [PubMed] [Google Scholar]
- 25.He M, Kuk ACY, Ding M, Chin CF, Galam DLA, Nah JM, Tan BC, Yeo HL, Chua GL, Benke PI, et al. (2022). Spns1 is a lysophospholipid transporter mediating lysosomal phospholipid salvage. Proceedings of the National Academy of Sciences of the United States of America 119, e2210353119. 10.1073/pnas.2210353119. [DOI] [PMC free article] [PubMed] [Google Scholar]
- 26.Cater RJ, Chua GL, Erramilli SK, Keener JE, Choy BC, Tokarz P, Chin CF, Quek DQY, Kloss B, Pepe JG, et al. (2021). Structural basis of omega-3 fatty acid transport across the blood-brain barrier. Nature 595, 315–319. 10.1038/s41586-021-03650-9. [DOI] [PMC free article] [PubMed] [Google Scholar]
- 27.Wood CAP, Zhang J, Aydin D, Xu Y, Andreone BJ, Langen UH, Dror RO, Gu C, and Feng L (2021). Structure and mechanism of blood-brain-barrier lipid transporter MFSD2A. Nature 596, 444–448. 10.1038/s41586-021-03782-y. [DOI] [PMC free article] [PubMed] [Google Scholar]
- 28.Martinez-Molledo M, Nji E, and Reyes N (2022). Structural insights into the lysophospholipid brain uptake mechanism and its inhibition by syncytin-2. Nature structural & molecular biology 29, 604–612. 10.1038/s41594-022-00786-8. [DOI] [PubMed] [Google Scholar]
- 29.Nguyen LN, Ma D, Shui G, Wong P, Cazenave-Gassiot A, Zhang X, Wenk MR, Goh EL, and Silver DL (2014). Mfsd2a is a transporter for the essential omega-3 fatty acid docosahexaenoic acid. Nature 509, 503–506. 10.1038/nature13241. [DOI] [PubMed] [Google Scholar]
- 30.Dastvan R, Rasouli A, Dehghani-Ghahnaviyeh S, Gies S, and Tajkhorshid E (2022). Proton-driven alternating access in a spinster lipid transporter. Nature communications 13: 5161. 10.1038/s41467-022-32759-2. [DOI] [PMC free article] [PubMed] [Google Scholar]
- 31.Goto H, Miyamoto M, and Kihara A (2021). Direct uptake of sphingosine-1-phosphate independent of phospholipid phosphatases. The Journal of biological chemistry 296, 100605. 10.1016/j.jbc.2021.100605. [DOI] [PMC free article] [PubMed] [Google Scholar]
- 32.Fritzemeier R, Foster D, Peralta A, Payette M, Kharel Y, Huang T, Lynch KR, and Santos WL (2022). Discovery of In Vivo Active Sphingosine-1-phosphate Transporter (Spns2) Inhibitors. Journal of medicinal chemistry 65, 7656–7681. 10.1021/acs.jmedchem.1c02171. [DOI] [PMC free article] [PubMed] [Google Scholar]
- 33.Binz HK, Amstutz P, Kohl A, Stumpp MT, Briand C, Forrer P, Grutter MG, and Pluckthun A (2004). High-affinity binders selected from designed ankyrin repeat protein libraries. Nat Biotechnol 22, 575–582. 10.1038/nbt962. [DOI] [PubMed] [Google Scholar]
- 34.Kobayashi N, Otsuka M, Yamaguchi A, and Nishi T (2016). Fluorescence-based rapid measurement of sphingosine-1-phosphate transport activity in erythrocytes. Journal of lipid research 57, 2088–2094. 10.1194/jlr.D071068. [DOI] [PMC free article] [PubMed] [Google Scholar]
- 35.Flayhan A, Mertens HDT, Ural-Blimke Y, Martinez Molledo M, Svergun DI, and Low C (2018). Saposin Lipid Nanoparticles: A Highly Versatile and Modular Tool for Membrane Protein Research. Structure 26, 345–355 e345. 10.1016/j.str.2018.01.007. [DOI] [PMC free article] [PubMed] [Google Scholar]
- 36.Quek DQ, Nguyen LN, Fan H, and Silver DL (2016). Structural Insights into the Transport Mechanism of the Human Sodium-dependent Lysophosphatidylcholine Transporter MFSD2A. The Journal of biological chemistry 291, 9383–9394. 10.1074/jbc.M116.721035. [DOI] [PMC free article] [PubMed] [Google Scholar]
- 37.Tanaka S, Zheng S, Kharel Y, Fritzemeier RG, Huang T, Foster D, Poudel N, Goggins E, Yamaoka Y, Rudnicka KP, et al. (2022). Sphingosine 1-phosphate signaling in perivascular cells enhances inflammation and fibrosis in the kidney. Science translational medicine 14, eabj2681. 10.1126/scitranslmed.abj2681. [DOI] [PMC free article] [PubMed] [Google Scholar]
- 38.Christoffersen C, Obinata H, Kumaraswamy SB, Galvani S, Ahnstrom J, Sevvana M, Egerer-Sieber C, Muller YA, Hla T, Nielsen LB, and Dahlback B (2011). Endothelium-protective sphingosine-1-phosphate provided by HDL-associated apolipoprotein M. Proceedings of the National Academy of Sciences of the United States of America 108, 9613–9618. 10.1073/pnas.1103187108. [DOI] [PMC free article] [PubMed] [Google Scholar]
- 39.Swendeman SL, Xiong Y, Cantalupo A, Yuan H, Burg N, Hisano Y, Cartier A, Liu CH, Engelbrecht E, Blaho V, et al. (2017). An engineered S1P chaperone attenuates hypertension and ischemic injury. Science signaling 10. 10.1126/scisignal.aal2722. [DOI] [PMC free article] [PubMed] [Google Scholar]
- 40.Nomura N, Verdon G, Kang HJ, Shimamura T, Nomura Y, Sonoda Y, Hussien SA, Qureshi AA, Coincon M, Sato Y, et al. (2015). Structure and mechanism of the mammalian fructose transporter GLUT5. Nature 526, 397–401. 10.1038/nature14909. [DOI] [PMC free article] [PubMed] [Google Scholar]
- 41.Deng D, Xu C, Sun P, Wu J, Yan C, Hu M, and Yan N (2014). Crystal structure of the human glucose transporter GLUT1. Nature 510, 121–125. 10.1038/nature13306. [DOI] [PubMed] [Google Scholar]
- 42.Drew D, North RA, Nagarathinam K, and Tanabe M (2021). Structures and General Transport Mechanisms by the Major Facilitator Superfamily (MFS). Chemical reviews 121, 5289–5335. 10.1021/acs.chemrev.0c00983. [DOI] [PMC free article] [PubMed] [Google Scholar]
- 43.Sullards MC, Liu Y, Chen Y, and Merrill AH Jr. (2011). Analysis of mammalian sphingolipids by liquid chromatography tandem mass spectrometry (LC-MS/MS) and tissue imaging mass spectrometry (TIMS). Biochimica et biophysica acta 1811, 838–853. 10.1016/j.bbalip.2011.06.027. [DOI] [PMC free article] [PubMed] [Google Scholar]
- 44.Mendoza A, Breart B, Ramos-Perez WD, Pitt LA, Gobert M, Sunkara M, Lafaille JJ, Morris AJ, and Schwab SR (2012). The transporter Spns2 is required for secretion of lymph but not plasma sphingosine-1-phosphate. Cell reports 2, 1104–1110. 10.1016/j.celrep.2012.09.021. [DOI] [PMC free article] [PubMed] [Google Scholar]
- 45.Goehring A, Lee CH, Wang KH, Michel JC, Claxton DP, Baconguis I, Althoff T, Fischer S, Garcia KC, and Gouaux E (2014). Screening and large-scale expression of membrane proteins in mammalian cells for structural studies. Nature protocols 9, 2574–2585. 10.1038/nprot.2014.173. [DOI] [PMC free article] [PubMed] [Google Scholar]
- 46.Rana MS, Wang X, and Banerjee A (2018). An Improved Strategy for Fluorescent Tagging of Membrane Proteins for Overexpression and Purification in Mammalian Cells. Biochemistry 57, 6741–6751. 10.1021/acs.biochem.8b01070. [DOI] [PMC free article] [PubMed] [Google Scholar]
- 47.Zheng SQ, Palovcak E, Armache JP, Verba KA, Cheng Y, and Agard DA (2017). MotionCor2: anisotropic correction of beam-induced motion for improved cryo-electron microscopy. Nature methods 14, 331–332. 10.1038/nmeth.4193. [DOI] [PMC free article] [PubMed] [Google Scholar]
- 48.Punjani A, Rubinstein JL, Fleet DJ, and Brubaker MA (2017). cryoSPARC: algorithms for rapid unsupervised cryo-EM structure determination. Nature methods 14, 290–296. 10.1038/nmeth.4169. [DOI] [PubMed] [Google Scholar]
- 49.Bepler T, Morin A, Rapp M, Brasch J, Shapiro L, Noble AJ, and Berger B (2019). Positive-unlabeled convolutional neural networks for particle picking in cryo-electron micrographs. Nature methods 16, 1153–1160. 10.1038/s41592-019-0575-8. [DOI] [PMC free article] [PubMed] [Google Scholar]
- 50.Zivanov J, Nakane T, Forsberg BO, Kimanius D, Hagen WJ, Lindahl E, and Scheres SH (2018). New tools for automated high-resolution cryo-EM structure determination in RELION-3. eLife 7. 10.7554/eLife.42166. [DOI] [PMC free article] [PubMed] [Google Scholar]
- 51.Rohou A, and Grigorieff N (2015). CTFFIND4: Fast and accurate defocus estimation from electron micrographs. J. Struct. Biol 192, 216–221. [DOI] [PMC free article] [PubMed] [Google Scholar]
- 52.Wagner T, Merino F, Stabrin M, Moriya T, Antoni C, Apelbaum A, Hagel P, Sitsel O, Raisch T, Prumbaum D, et al. (2019). SPHIRE-crYOLO is a fast and accurate fully automated particle picker for cryo-EM. Commun. Biol 2, 218. [DOI] [PMC free article] [PubMed] [Google Scholar]
- 53.Jumper J, Evans R, Pritzel A, Green T, Figurnov M, Ronneberger O, Tunyasuvunakool K, Bates R, Zidek A, Potapenko A, et al. (2021). Highly accurate protein structure prediction with AlphaFold. Nature 596, 583–589. 10.1038/s41586-021-03819-2. [DOI] [PMC free article] [PubMed] [Google Scholar]
- 54.Pettersen EF, Goddard TD, Huang CC, Couch GS, Greenblatt DM, Meng EC, and Ferrin TE (2004). UCSF Chimera--a visualization system for exploratory research and analysis. Journal of computational chemistry 25, 1605–1612. 10.1002/jcc.20084. [DOI] [PubMed] [Google Scholar]
- 55.Emsley P, and Cowtan K (2004). Coot: model-building tools for molecular graphics. Acta crystallographica. Section D, Biological crystallography 60, 2126–2132. 10.1107/S0907444904019158. [DOI] [PubMed] [Google Scholar]
- 56.Adams PD, Afonine PV, Bunkoczi G, Chen VB, Davis IW, Echols N, Headd JJ, Hung LW, Kapral GJ, Grosse-Kunstleve RW, et al. (2010). PHENIX: a comprehensive Python-based system for macromolecular structure solution. Acta crystallographica. Section D, Biological crystallography 66, 213–221. 10.1107/S0907444909052925. [DOI] [PMC free article] [PubMed] [Google Scholar]
- 57.Chen VB, Arendall WB 3rd, Headd JJ, Keedy DA, Immormino RM, Kapral GJ, Murray LW, Richardson JS, and Richardson DC (2010). MolProbity: all-atom structure validation for macromolecular crystallography. Acta crystallographica. Section D, Biological crystallography 66, 12–21. 10.1107/S0907444909042073. [DOI] [PMC free article] [PubMed] [Google Scholar]
- 58.Vanommeslaeghe K, Hatcher E, Acharya C, Kundu S, Zhong S, Shim J, Darian E, Guvench O, Lopes P, Vorobyov I, and Mackerell AD Jr. (2010). CHARMM general force field: A force field for drug-like molecules compatible with the CHARMM all-atom additive biological force fields. Journal of computational chemistry 31, 671–690. 10.1002/jcc.21367. [DOI] [PMC free article] [PubMed] [Google Scholar]
- 59.Brooks BR, Bruccoleri RE, Olafson BD, States DJ, Swaminathan S, and Karplus M (1983). CHARMM: A program for macromolecular energy, minimization, and dynamics calculations. Journal of computational chemistry 4, 30. [Google Scholar]
- 60.Li H, Robertson AD, and Jensen JH (2005). Very fast empirical prediction and rationalization of protein pKa values. Proteins 61, 704–721. 10.1002/prot.20660. [DOI] [PubMed] [Google Scholar]
- 61.Jo S, Kim T, Iyer VG, and Im W (2008). CHARMM-GUI: a web-based graphical user interface for CHARMM. Journal of computational chemistry 29, 1859–1865. 10.1002/jcc.20945. [DOI] [PubMed] [Google Scholar]
- 62.Lomize MA, Lomize AL, Pogozheva ID, and Mosberg HI (2006). OPM: orientations of proteins in membranes database. Bioinformatics 22, 623–625. 10.1093/bioinformatics/btk023. [DOI] [PubMed] [Google Scholar]
- 63.Jorgensen W, Chandrasekhar J, Madura J, Impey R, and Klein M (1983). Comparison of simple potential functions for simulating liquid water. The Journal of Chemical Physics 79, 9. [Google Scholar]
- 64.Phillips JC, Braun R, Wang W, Gumbart J, Tajkhorshid E, Villa E, Chipot C, Skeel RD, Kale L, and Schulten K (2005). Scalable molecular dynamics with NAMD. Journal of computational chemistry 26, 1781–1802. 10.1002/jcc.20289. [DOI] [PMC free article] [PubMed] [Google Scholar]
- 65.MacKerell AD, Bashford D, Bellott M, Dunbrack RL, Evanseck JD, Field MJ, Fischer S, Gao J, Guo H, Ha S, et al. (1998). All-atom empirical potential for molecular modeling and dynamics studies of proteins. J Phys Chem B 102, 3586–3616. 10.1021/jp973084f. [DOI] [PubMed] [Google Scholar]
- 66.Essmann U, Perera L, Berkowitz ML, Darden T, Lee H, and Pedersen LG (1995). A smooth particle mesh Ewald method. J. Chem. Phys 103, 16. [Google Scholar]
Associated Data
This section collects any data citations, data availability statements, or supplementary materials included in this article.
Supplementary Materials
(A) Schematic of Spns2cryo construct.
(B) Experimental flow diagram of Spns2 functional assays. Created with BioRender.com.
(C) Thin layer chromatography (TLC) analyses of lipid extractions from the media/pellets of Spns2WT overexpressing cells. The aqueous phase of the supernatant sample used for fluorescence measurements contains mostly the cell-exported NBD-S1P. The positions of NBD-S1P and NBD-Sph on the TLC plates are marked. *, **, other NBD-coupled metabolites.
(A) Summary of image processing procedures of Spns2cryo. Left, the dataset in the absence of additional S1P supplement. Right, the dataset in the presence of additional S1P supplement. All procedures were done in cryoSPARC, except for particle polishing which was in RELION. The two inward-facing open structures are similar and thus are labeled as state 1 and state 1*.
(B) Fourier shell correlation (FSC) curves between two half maps.
(C) Angular distribution of particles for the final 3D reconstructions.
(A) Local resolution of cryo-EM maps. Maps are colored according to local resolution, estimated using cryoSPARC. The two inward-facing open structures are similar and thus are labeled as state 1 and state 1*.
(B) cryo-EM map of the transmembrane helix (TM) of Spns2 in state 1.
(C) cryo-EM density of S1P with surrounding residues in state 1.
(D) cryo-EM map of the transmembrane helix (TM) of Spns2 in state 1*.
Lipids were extracted from the purified Spns2cryo sample (without supplemented with additional S1P) that was used for cryo-EM study. The blank buffer (A), S1P (d18:1) standard (B), and lipid extracts from purified proteins (C) were measured by LC-MS. The retention time of S1P is 2.89 min, and the peaks in the three panels are shown on the same scale. The experiments were conducted with two samples which were purified on different days. Similar results were obtained.
(A) Structure of Spns2 in the state 1. S1P is shown as stick in gray.
(B) Structure of Mfsd2a in the inward-open state (PDB: 7MJS). The lysophosphatidylcholine (LPC) is shown as stick in orange.
(C) Structural comparison between Mfsd2a (gray) and Spns2 (blue).
(D) Sequence alignment between Spns1, Spns2, Mfsd2a and Mfsd2b. The key residues for substrate and sodium binding are highlighted. Hs, Homo sapiens; Gg, Gallus gallus; Mm, Mus musculus.
A representative thin layer chromatography analysis is shown. Control, mCherry alone. The band intensity of the sample from wild-type Spns2 in HBSS (Hank’s balanced salt solution) is used for normalizing the signals from the other conditions.
(A) Summary of image processing procedures of 16d-bound Spns2cryo. All procedures were done in cryoSPARC, except for particle polishing and 3D classification without image alignment which were in RELION.
(B) Fourier shell correlation (FSC) curves between two half maps.
(C) Angular distribution of particles for the final 3D reconstructions.
(D) Local resolution of cryo-EM map. Map is colored according to local resolution, estimated using cryoSPARC.
(E) cryo-EM density of 16d ligand. The 16d is shown as sticks in orange.
(F) cryo-EM density of 16d with surrounding residues.
Supplementary Video 1 Conformational changes of Spns2 in distinct states, related to Figures 2, 3 and 4
Molecular dynamics trajectory showing 16d exploring the intracellular cavity in a time span of 100 ns. 16d is shown as sticks in cyan and all sidechains within 3-Å distance of 16d are depicted.
Data Availability Statement
The 3D cryo-EM density maps have been deposited in the Electron Microscopy Data Bank (EMDB) under the accession numbers EMD-28650, EMD-28651, EMD-28652, EMD-28653, EMD-28654, and EMD-29860. Atomic coordinates for the atomic model have been deposited in the Protein Data Bank (PDB) under the accession numbers 8EX4, 8EX5, 8EX6, 8EX7, 8EX8 and 8G92.
This paper does not report original code.
Any additional information required to reanalyze the data reported in this paper is available from the lead contact upon request.