Abstract
Background:
Primary aldosteronism is frequently caused by an adrenocortical aldosterone-producing adenoma (APA) carrying a somatic mutation that drives aldosterone overproduction. APAs with a mutation in KCNJ5 (APA-KCNJ5MUT) are characterized by heterogeneous CYP11B2 (aldosterone synthase) expression, a particular cellular composition and larger tumor diameter than those with wild type KCNJ5 (APA-KCNJ5WT). We exploited these differences to decipher the roles of transcriptome and metabolome reprogramming in tumor pathogenesis.
Methods:
Consecutive adrenal cryosections (7 APAs and 7 paired adjacent adrenal cortex) were analyzed by spatial transcriptomics (10x Genomics platform) and metabolomics (in situ matrix-assisted laser desorption/ionization mass spectrometry imaging) co-integrated with CYP11B2 immunohistochemistry.
Results:
We identified intra-tumoral transcriptional heterogeneity that delineated functionally distinct biological pathways. Common transcriptomic signatures were established across all APA specimens which encompassed 2 distinct transcriptional profiles in CYP11B2-immunopositive regions (CYP11B2-type 1 or 2). The CYP11B2-type 1 signature was characterized by zona glomerulosa gene markers and was detected in both APA-KCNJ5MUT and APA-KCNJ5WT. The CYP11B2-type 2 signature displayed markers of the zona fasciculata or reticularis and predominated in APA-KCNJ5MUT. Metabolites that promote oxidative stress and cell death accumulated in APA-KCNJ5WT. In contrast, antioxidant metabolites were abundant in APA-KCNJ5MUT. Finally, APA-like cell subpopulations- negative for CYP11B2 gene expression- were identified in adrenocortical tissue adjacent to APAs suggesting the existence of tumor precursor states.
Conclusions:
Our findings provide insight into intra- and inter-tumoral transcriptional heterogeneity and support a role for prooxidant versus antioxidant systems in APA pathogenesis highlighting genotype-dependent capacities for tumor expansion.
Keywords: adrenal gland, hyperaldosteronism, in situ MALDI-MSI, oxidative stress, PUFA, spatial metabolomics, spatial transcriptomics
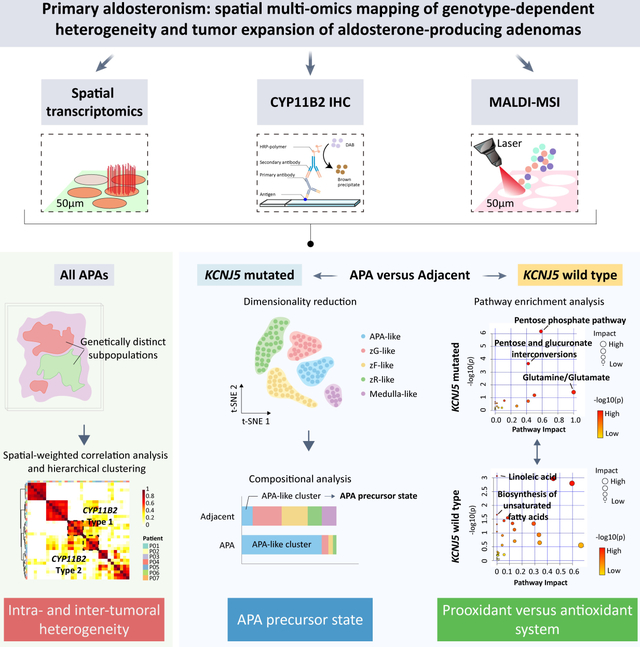
Graphical Abstract
INTRODUCTION
Aldosterone-producing adenomas (APAs) are a major subtype of primary aldosteronism (PA) in which a single somatic mutation drives the constitutive upregulation of CYP11B2 gene transcription (encoding aldosterone synthase) and aldosterone biosynthesis in adrenal zona glomerulosa (zG) cells.1 These mutations include variants in the GIRK4 K+ channel2 (encoded by KCNJ5), the calcium channels CaV1.33,4 and CaV3.25 (CACNA1D and CACNA1H, respectively) and the CIC-2 chloride channel6 (CLCN2), as well as in subunits of the ion pumps Na+/K+-ATPase4,7 (ATP1A1), and the plasma membrane Ca2+ transporting ATPase7 (ATP2B3). In most reports, APA mutations in KCNJ5 predominate over mutations in other genes.8,9
Cells with the potential to produce aldosterone in adrenal tissues can be localized using specific antibodies to CYP11B2 in immunohistochemistry of adrenal sections,10–12 which has provided new insight into APA pathogenesis from a histological perspective.11,13,14 KCNJ5-mutated APAs (APA-KCNJ5MUT) display distinct phenotypes from other APA (APA-KCNJ5WT). These differences include the intra-tumoral heterogeneous CYP11B2 expression that is frequently observed in the tumor areas of APA-KCNJ5MUT by immunostaining.15,16 Moreover, APA-KCNJ5MUT display a predominance of lipid-rich clear cells (zona fasciculata [zF]-like cells with CYP11B1 [11β-hydroxylase] and CYP17A1 [17β-hydroxylase/17,20-lyase] expression) rather than the prevailing small compact eosinophilic cell phenotype (zG-like cells with CYP11B2 expression) in APA-KCNJ5WT.17 Further, APA-KCNJ5MUT are generally larger than APA-KCNJ5WT,9,18 suggesting divergent mechanisms of tumorigenesis.19 However, transcriptional networks that determine the APA-KCNJ5MUT phenotype remain to be elucidated.
Spatial transcriptomics is a powerful approach to dissect the transcriptional diversity of complex biological systems within the morphological context.20,21 In addition, spatial metabolomics using matrix-assisted laser desorption/ionization mass spectrometry imaging (MALDI-MSI) of paraffin-embedded tissue sections has been used to investigate adrenal gland physiology22 and pathophysiology23,24 and has shown distinct metabolome patterns of APA-KCNJ5MUT compared with APA-CACNA1DMUT.23 However, the use of paraffin-embedded tissue can result in the decreased detection of functionally relevant lipid species, which are lost during the tissue embedding process.25,26
Herein, we combined spatial transcriptomics and MSI-based spatial metabolomic profiling of adrenal tissue cryosections to define the role of transcriptomic and metabolomic reprogramming in APA pathophysiology. We hypothesized that the elucidation of biological processes which differentiate APA-KCNJ5MUT and APA-KCNJ5WT can identify causal molecular and cellular mechanisms of APA histological heterogeneity and tumor growth.
MATERIALS AND METHODS
The expanded methods are available in the Data Supplement. The authors declare that all supporting data are available within the article and Data Supplement or are available upon reasonable request. The study was performed in accordance with local ethics committee guidelines and was approved by the institutional review board at the Ludwig Maximilian University of Munich (ref. 379–10). All patients provided written informed consent. Details of patients, diagnosis of PA,11,27–30 adrenal tissue samples and histology,10 sample processing,24,31–33 genotyping,34,35 methods for spatial transcriptomics and spatial metabolomics,36–39 and bioinformatics are provided in the Online Supplement.
RESULTS
Intra-tumoral transcriptional heterogeneity of APAs
To delineate and compare APA intra-tumoral transcriptional heterogeneity stratified by genotype, we conducted spatial transcriptomics (Visium, 10X genomics) of adrenal cryosections from APA-KCNJ5MUT (n = 4) and APA-KCNJ5WT (n = 3) (Figure 1 and Table S1). First, we deconvolved APA-KCNJ5MUT samples using a non-negative matrix factorization (NNMF) approach to quantify factors that were preferentially co-expressed by subsets of spots representing transcriptionally distinct regions within each sample specimen (Figure S1), as exemplified by NNMF of the APA section from Patient 1 (Figure 2A). Of the 3 tumor-related transcriptome signatures (factors 1, 3 and 4), factors 1 and 3 exhibited high CYP11B2 expression and defined structures with aldosterone hypersecretion. Gene ontology (GO) analysis revealed a functional difference between factors 1 and 3, with enrichment of cell death-related pathways in factor 1 (Figure 2B) and of pathways associated with metabolic processes in factor 3 (Figure 2C). The tumor region annotated by factor 4 was negative for CYP11B2 expression and associated with tissue remodeling, defined by the expression of genes of the extracellular matrix (IGFBP7, MGP), angiogenesis and cell population proliferation (Figure 2D). Factors 2 and 5 were transcriptional signatures associated with non-tumor regions of the adjacent adrenal tissue (Figure S2).
Figure 1. Adrenal tissue sections for spatial multi-omics profiling.
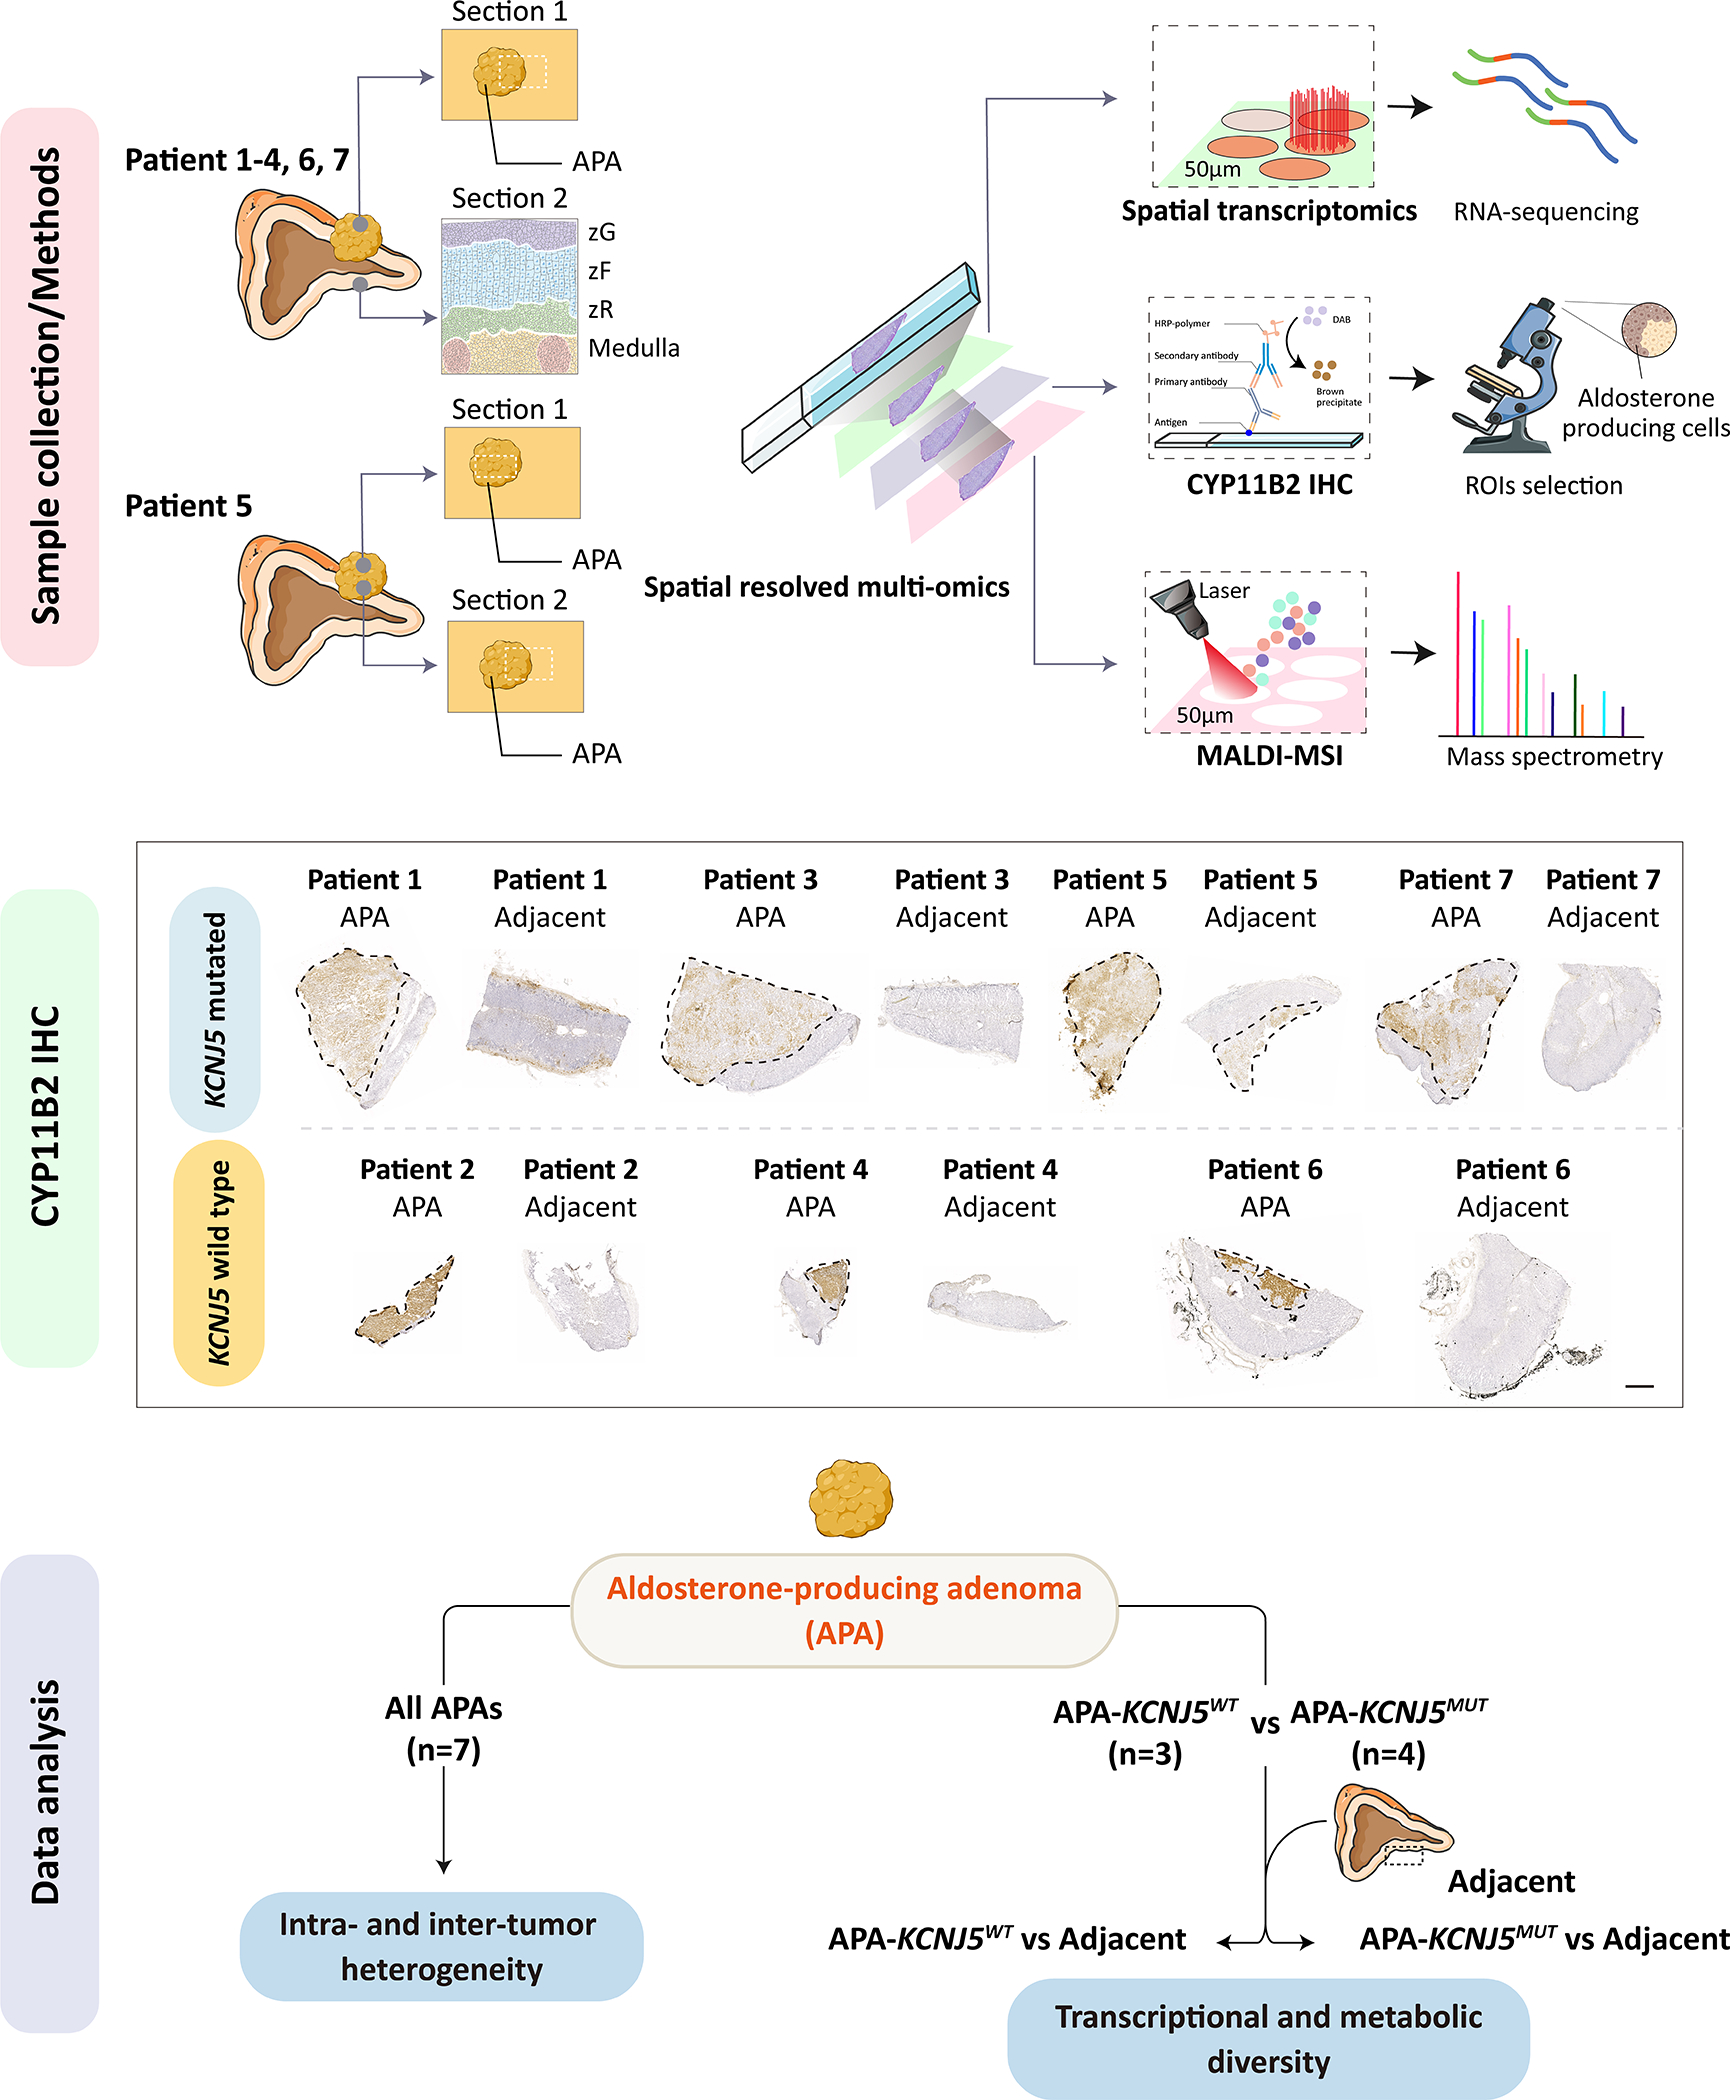
Illustration of adrenal samples used for spatial datasets. For patients 1–4 and 6–7, an adrenal section with an APA (section 1) and a separate section of adjacent adrenal tissue (section 2 showing adrenal zones, zG, zona glomerulosa; zF, zona fasciculata; zR, zona reticularis) was used. For patient 5, section 1 comprised APA tissue only, section 2 encompassed adjacent adrenal and an APA region. Tumor regions are outlined with a black dashed line. An overview of analytical approaches used is also shown (Upper panel). Successive cryosections were processed for spatial transcriptomic (10x Genomics Visium platform), CYP11B2 IHC to identify ROIs (Middle panel, ROIs indicated by dashed lines, scale bar, 1 mm), and MALDI-MSI. An overview of the data analysis strategy is also shown (Bottom panel). IHC, immunohistochemistry; MALDI-MSI, matrix-assisted laser desorption/ionization mass spectrometry imaging; ROIs, regions of interest. Illustration used SMART servier medical art (https://smart.servier.com/).
Figure 2. Intra-tumoral transcriptional heterogeneity of an APA with a KCNJ5 mutation.
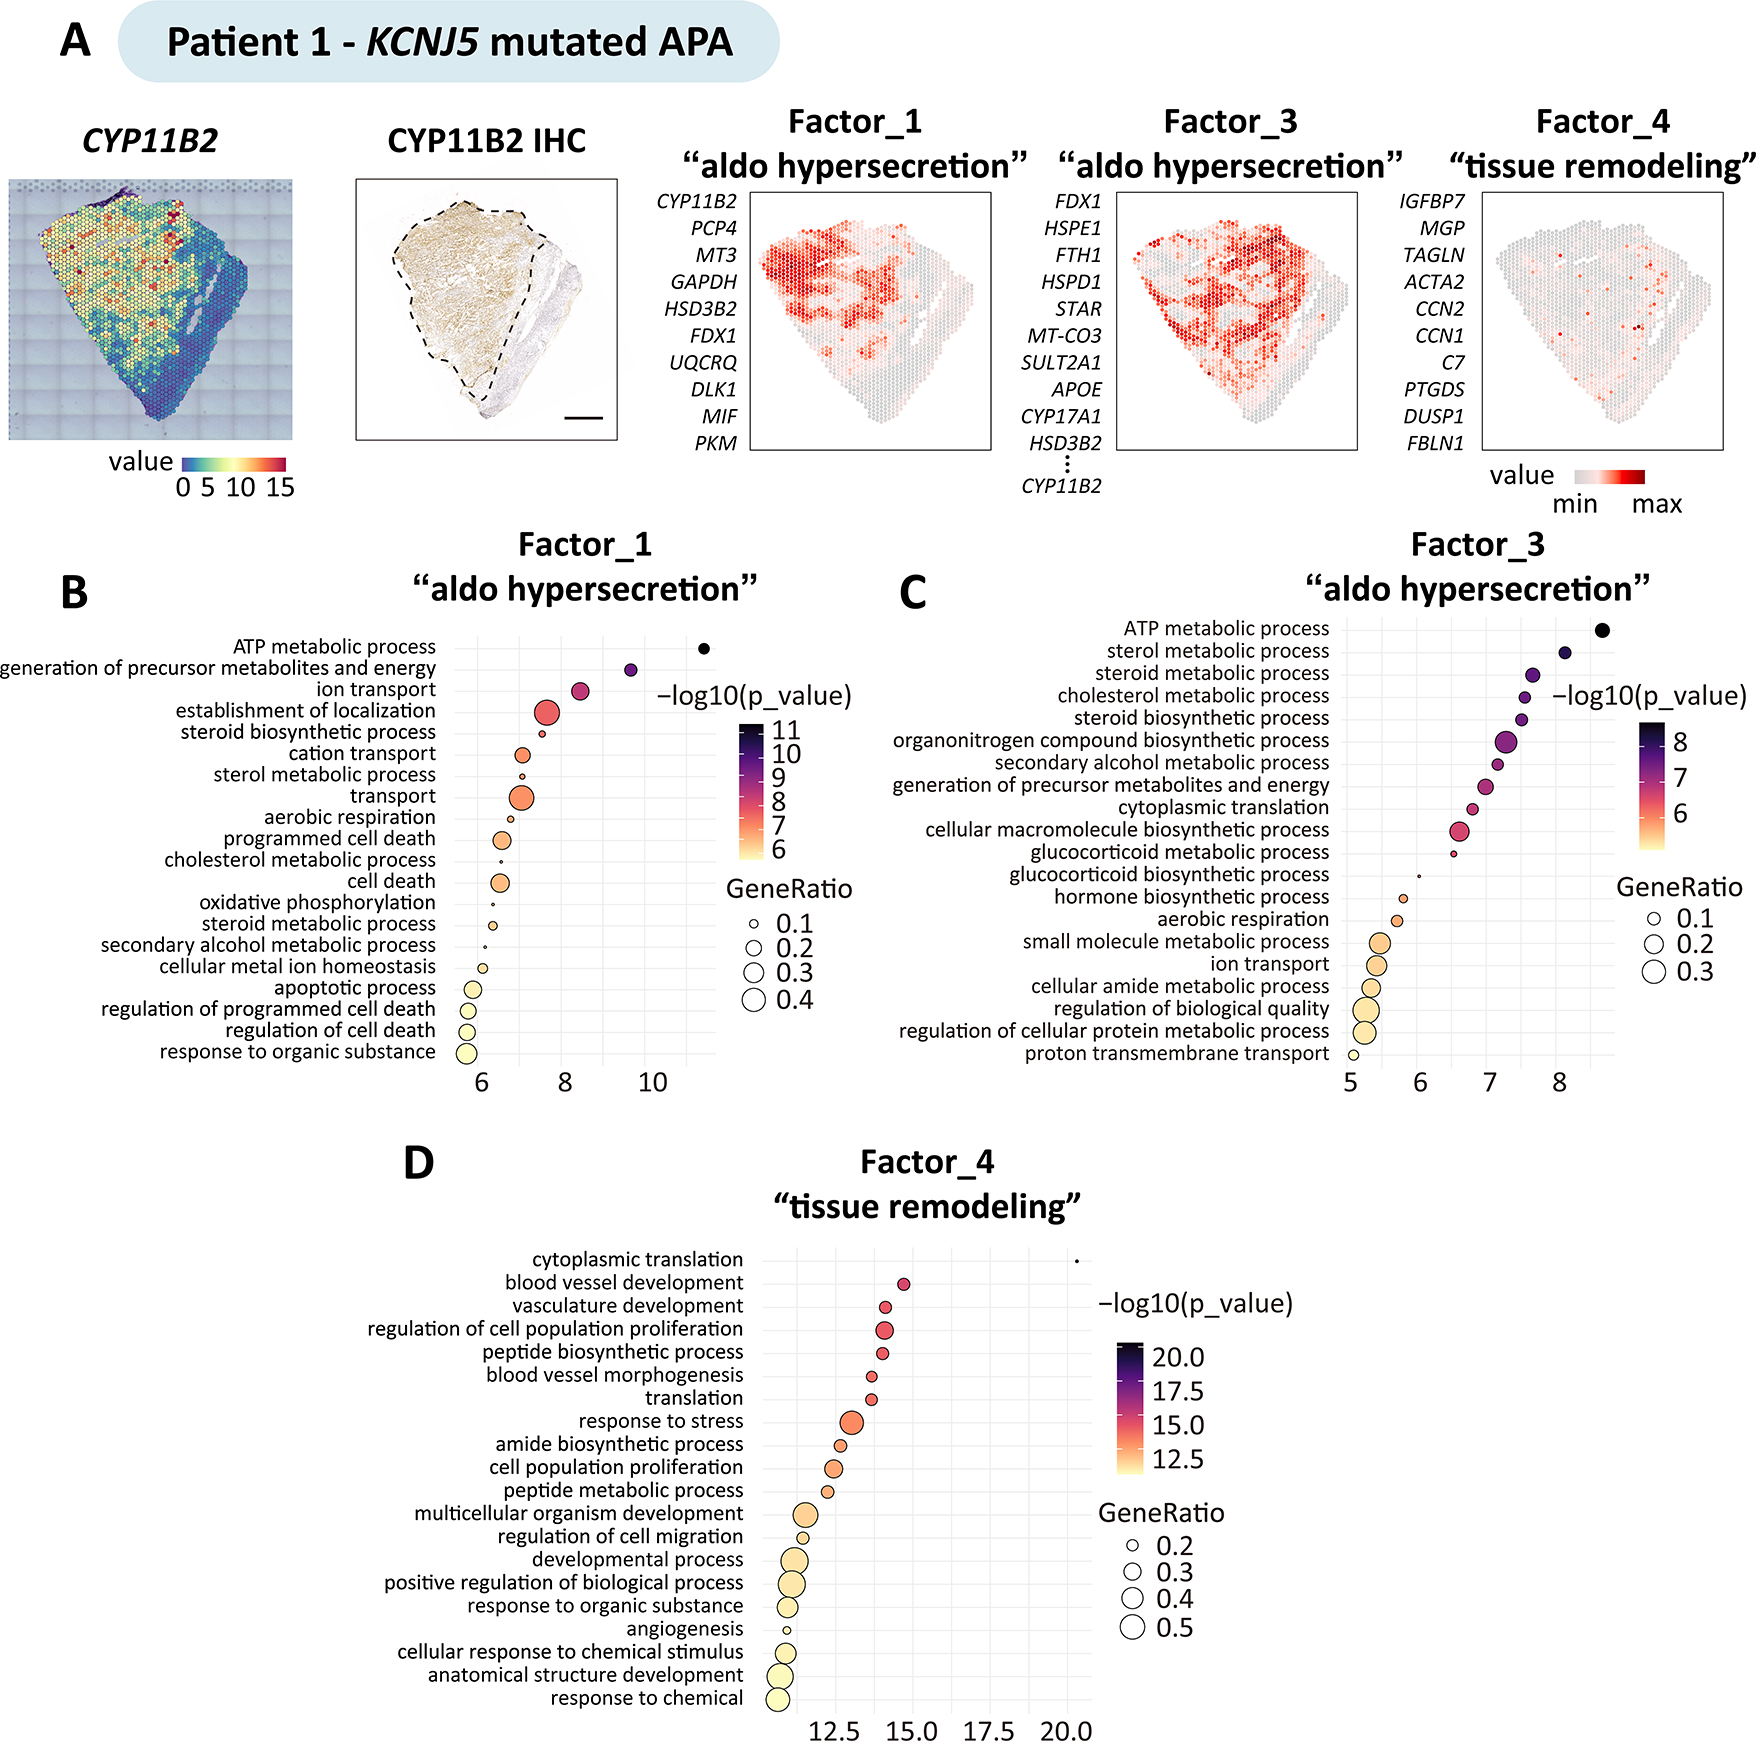
Non-negative matrix factorization expression-based analysis identified the top genes defining factors (transcriptionally distinct regions) in adrenal sections with an APA. The figure shows the analysis of patient 1 carrying a KCNJ5 mutation; the same approach was used for the analysis of patients 2 to 7. A, Spatial CYP11B2 expression and spatial distribution of tumor-related factors, colour-codes indicate gene expression levels. Factor 1, 3 and 4, are tumor-related factors: factor 1 and factor 3 comprised gene sets preferentially co-expressed in subsets of CYP11B2 expressing tumour regions. CYP11B2, PCP4, MT3, GAPDH and HSD3B2 were the top genes defining factor 1; FDX1, HSPE1, FTH1, HSPD1, and STAR, as well as CYP11B2 defined factor 3; conversely factor 4 defined tumor regions without CYP11B2 gene expression with enrichment of angiogenesis and cell proliferation. Scale bar, 1 mm. B-D, Geno Ontology analysis showing enriched biological processes associated with factors related to “aldosterone hypersecretion” (factor 1 and factor 3) and “tissue remodeling” (factor 4).
CYP11B2 heterogeneity characterized by a lower proportion of cells with CYP11B2-positive immunostaining is often seen in APA-KCNJ5MUT.15,16 To identify molecular profiles which distinguish diverse CYP11B2 expression levels in APA-KCNJ5MUT, tumor spatial transcriptomic spots were annotated into 2 clusters after subdivision into high and low CYP11B2 expression (Figure S3A). Gene and pathway enrichment analysis predicted by PROGENy showed that high CYP11B2 expressing transcriptome populations displayed upregulated steroidogenesis-related genes- like PCP4, FDX1, MC2R- and steroidogenesis-related pathways- like VEGF signaling, p53 signaling, and androgen signaling (Figure S3B–D). In the CYP11B2-expressing regions of Patients 4 and 6, a single APA-KCNJ5WT tumor-related transcriptome signature was identified. In contrast, 3 distinct transcriptome signatures were annotated in the CYP11B2-expressing tumor regions of Patient 2 (factors 2, 3 and 4) (Figure S4 and Figure S5). Together these data validate the previously reported tumor cell heterogeneity in APAs16 and illustrate the intra-tumoral diversity of transcriptional programs.
Spatial profiling of APA reveals 2 distinct transcriptional profiles in CYP11B2-immunopositive adrenal regions.
Hierarchical cluster analysis identified common transcriptional signatures (or factors) across all 7 APAs and highlighted 2 distinct transcriptional signatures in CYP11B2-expressing regions (referred to here as CYP11B2-type 1 and CYP11B2-type 2) (Figure 3A). The CYP11B2-type 1 and CYP11B2-type 2 signatures each comprised genes which were markers of different cell types of the adrenal cortex (from the zG, zF and zona reticularis [zR]) (Table S2). Thus, the CYP11B2-type 1 region primarily encompassed genes expressed in the zG, such as KCNJ5 and VSNL1, and showed functional enrichment of hallmark gene sets- from MSigDB (Molecular Signatures Database hallmark- associated with cell stress (defined by the TP53 pathway, reactive oxygen species pathway and apoptosis). The CYP11B2-type 2 region expressed the zF and zR genes CYP17A1, CYP11B1, and SULT2A1, and showed enrichment of pathways related to mTORC1 and hypoxia-associated signals (Figure 3B). CYP11B2-type 1 was dominant in APA-KCNJ5WT, consistent with their predominance of compact eosinophilic cells with CYP11B2 and KCNJ5 expression (zG-like cells)7,9. CYP11B2-type 2 was dominant in APA-KCNJ5MUT coherent with their higher proportion of lipid-rich clear cells with CYP11B1 and CYP17A1 expression (zF-like cells)7,9 (Figure 3C).
Figure 3. Co-integrated spatial transcriptomics and metabolomics of APAs.
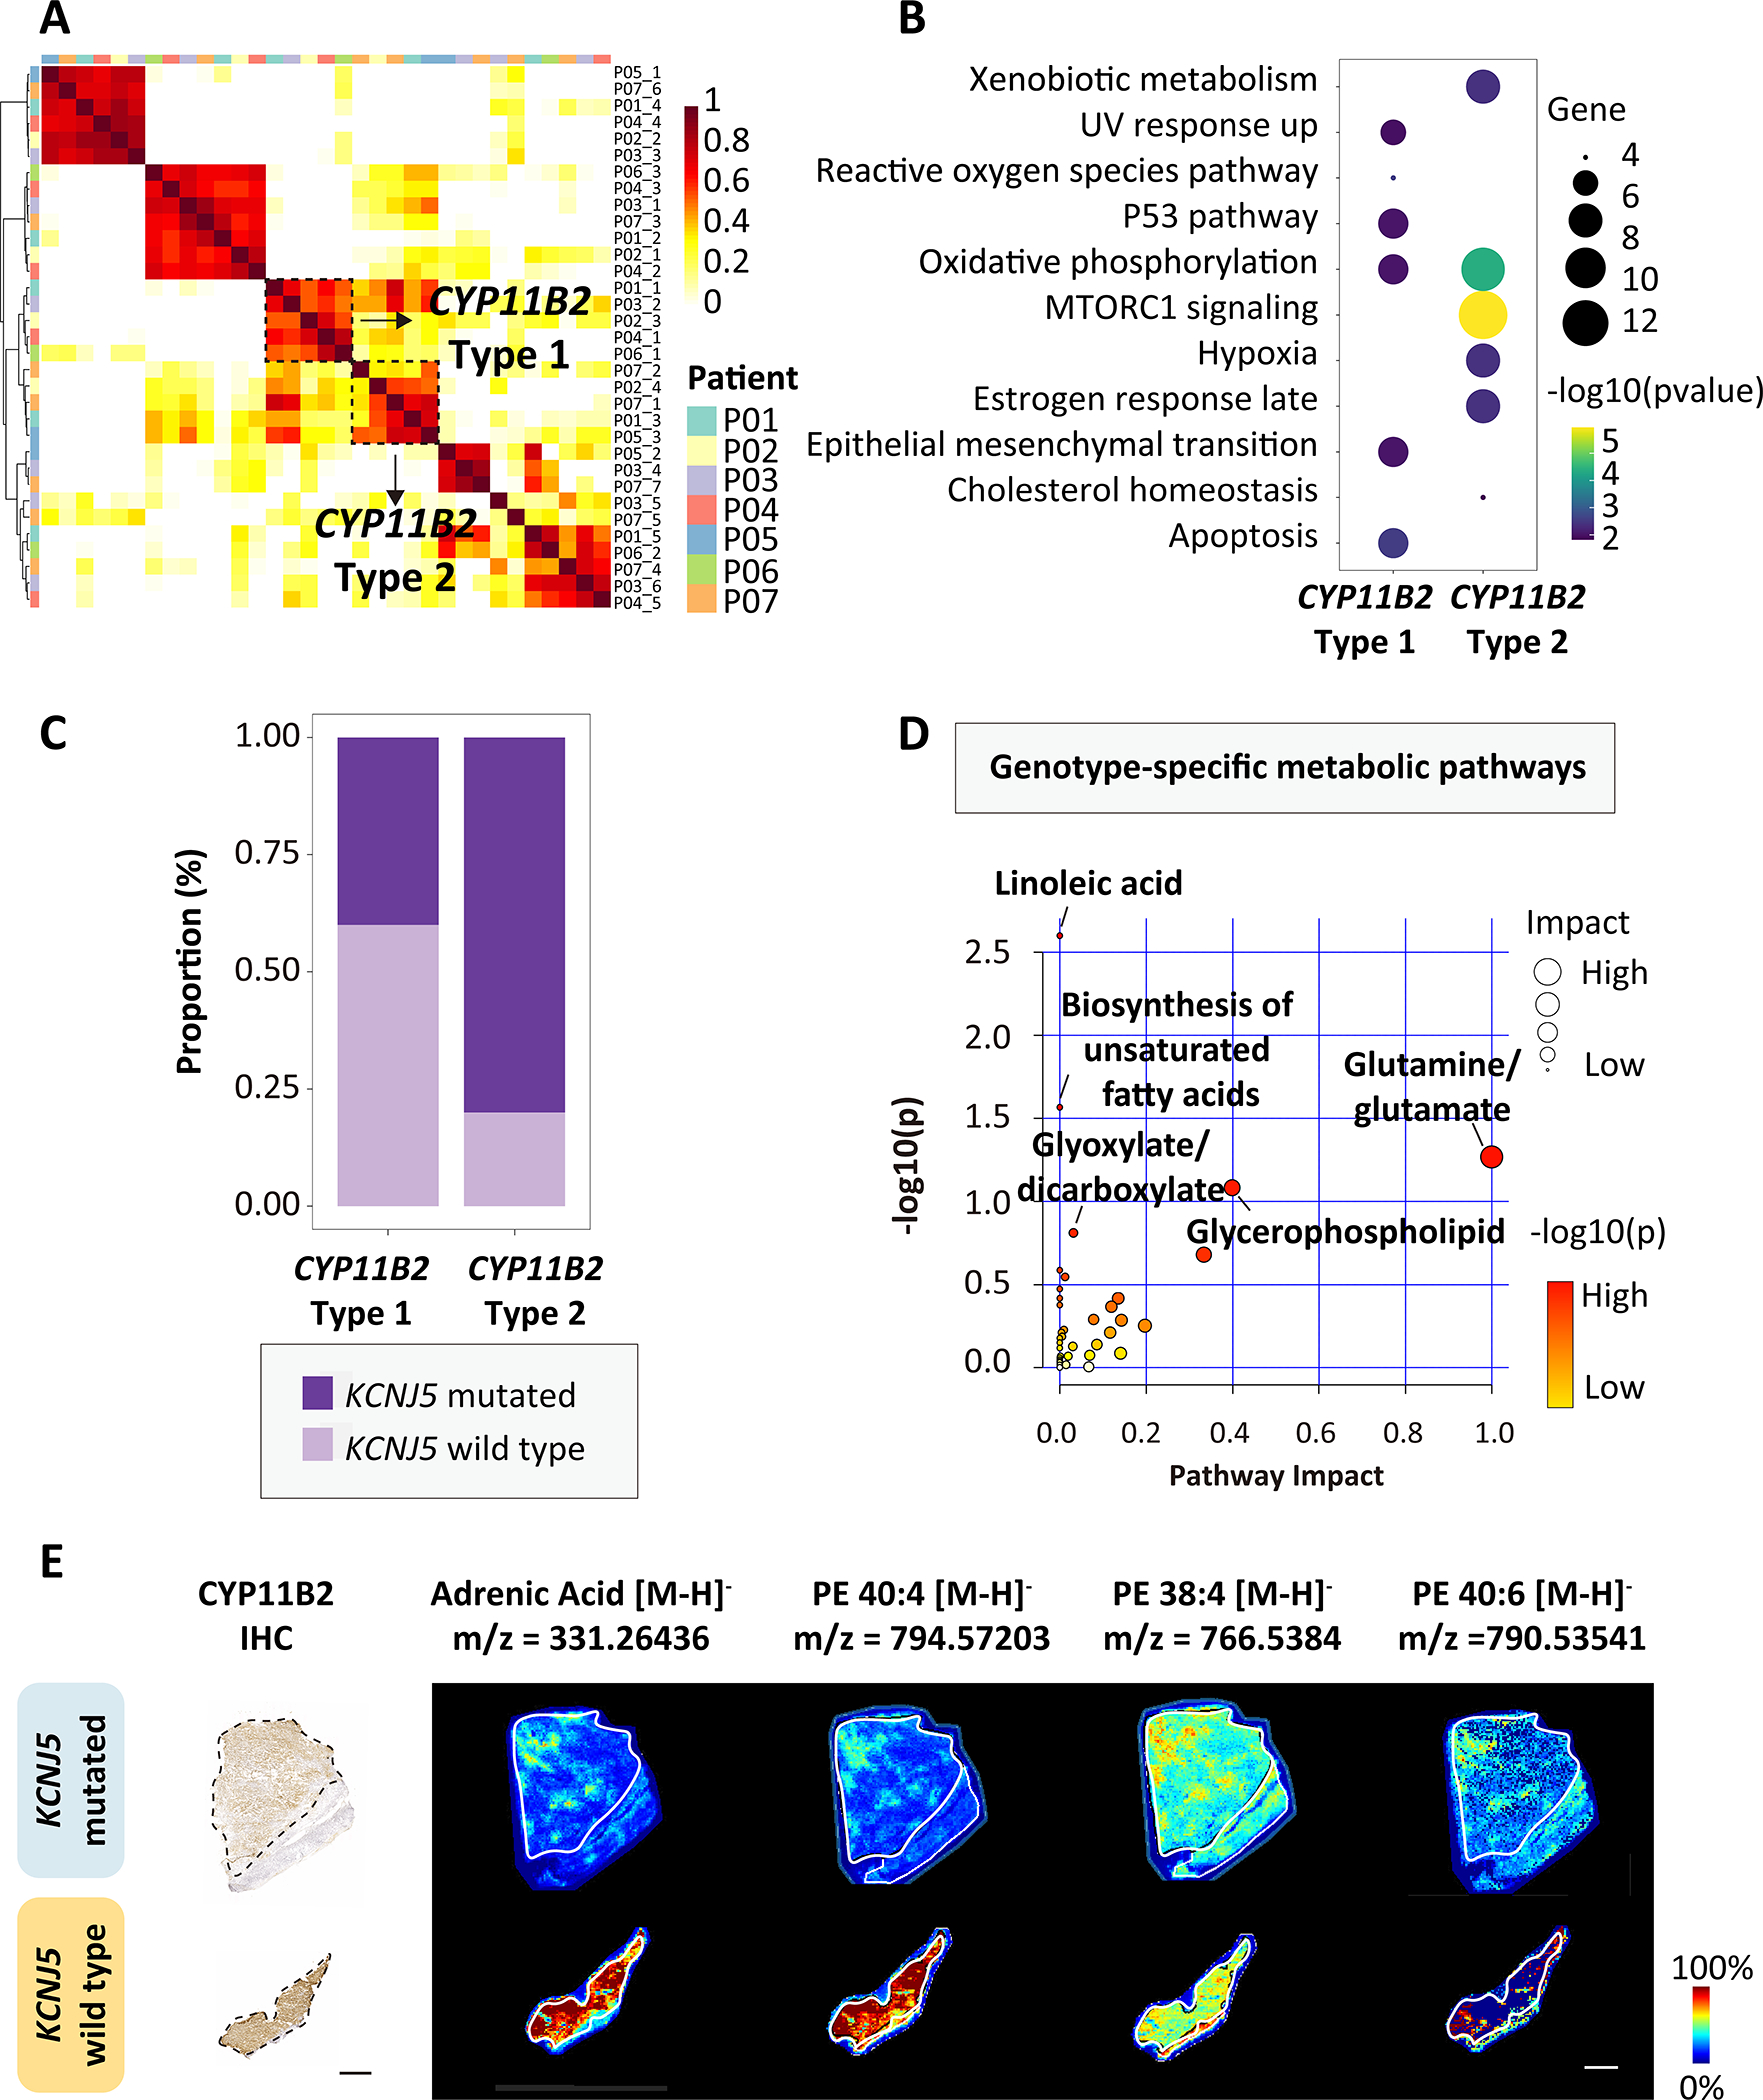
A, Spatial-weighted correlation analysis and Ward.D2 hierarchical clustering of 7 APA (P01-P07) identified 2 distinct signatures with CYP11B2 expression (CYP11B2-type 1 and CYP11B2-type 2). B, HALLMARK gene set enrichment of CYP11B2-type 1 and CYP11B2-type 2. C, Distribution of KCNJ5 mutated (APA-KCNJ5MUT) and wild type APA (APA-KCNJ5WT) according to CYP11B2-type 1 and CYP11B2-type 2 transcriptomic signatures. D, MetaboAnalyst 5.0 pathway enrichment analysis of discriminative metabolites in APA-KCNJ5MUTversus APA-KCNJ5WT. Annotated pathways selected by unadjusted P<0.05 (hypergeometric test). Circles indicate pathway impact (horizontal axis, topology analyses; vertical axis, enrichment). E, CYP11B2 immunohistochemistry and MALDI-MSI showing spatial distribution of pro-ferroptotic metabolites in 2 APAs with or without a KCNJ5 mutation. Scale bars, 1 mm.
Spatial metabolomics was used to further characterize genotype-related heterogeneity. We used in situ MALDI-MS imaging of all adrenal specimens (7 APAs and their paired adjacent cortex) to quantify and visualize metabolites and identify the enriched metabolomic profiles in tumor regions. We identified 207 discriminative masses: 162 enriched in APA-KCNJ5WT and 45 abundant in APA-KCNJ5MUT. APA-KCNJ5WT were characterized by metabolomic signatures related to linoleic acid metabolism and the biosynthesis of polyunsaturated fatty acids (PUFAs eg., adrenic acid and docosapentaenoic acid) and an abundance of phosphatidylethanolamine PE (40:4), PE (38:4), and PE (40:6) (Figure 3D and 3E; Table S3). In contrast, APA-KCNJ5MUT exhibited abundant metabolites of glutamine and glutamate metabolism. The accumulation of ferroptosis-promoting PUFAs and PE in APA-KCNJ5WT support a role for activated cell death mechanisms to restrict tumor cell expansion.40,41 In contrast, elevated pools of glutamine and glutamate in APA-KCNJ5MUT reflect the presence of active metabolic signals favorable for tumor survival and growth.42,43
Spatial profiling of APA and adjacent adrenal tissue uncovers mechanisms underlying genotype-related differences in tumor size.
We investigated the transcriptomic and metabolomic divergence of APA from paired adjacent adrenal tissue. For this, 14 cryosections were processed for spatial multi-omics profiling comprising the 7 APAs described above, plus a section of adrenocortical tissue adjacent to each APA. The basic structure of APA and adjacent adrenal was captured by NNMF,44 which identified 3 transcriptomic structural landscapes classified as adjacent zF and zR, adrenal medulla, and a mixture of APA and adjacent zG demonstrating that different morphological regions can have the same basic structure with shared transcriptional programs (APA-KCNJ5MUT, Figure S6 and Figure 4A; APA-KCNJ5WT, Figure S7 and Figure 4B). Multiple biological processes of metabolism and steroid biosynthesis were identified in APA-KCNJ5MUT whereas abundant cell death pathways with anti-tumoral metabolic signatures were highlighted in APA-KCNJ5WT (Figure 4C and 4D). These observations were further supported by spatial metabolomic profiling which identified the enrichment of glucose metabolism in APA-KCNJ5MUT versus adjacent adrenal cortex demonstrating active pathways for protection from steroidogenesis-mediated oxidative stress, including the oxidative arm of the pentose phosphate pathway and pentose glucuronate interconversions (Figure 4E and Figure S8; Table S4).
Figure 4. Spatial transcriptomics and metabolomics of APAs and adjacent adrenal tissue.
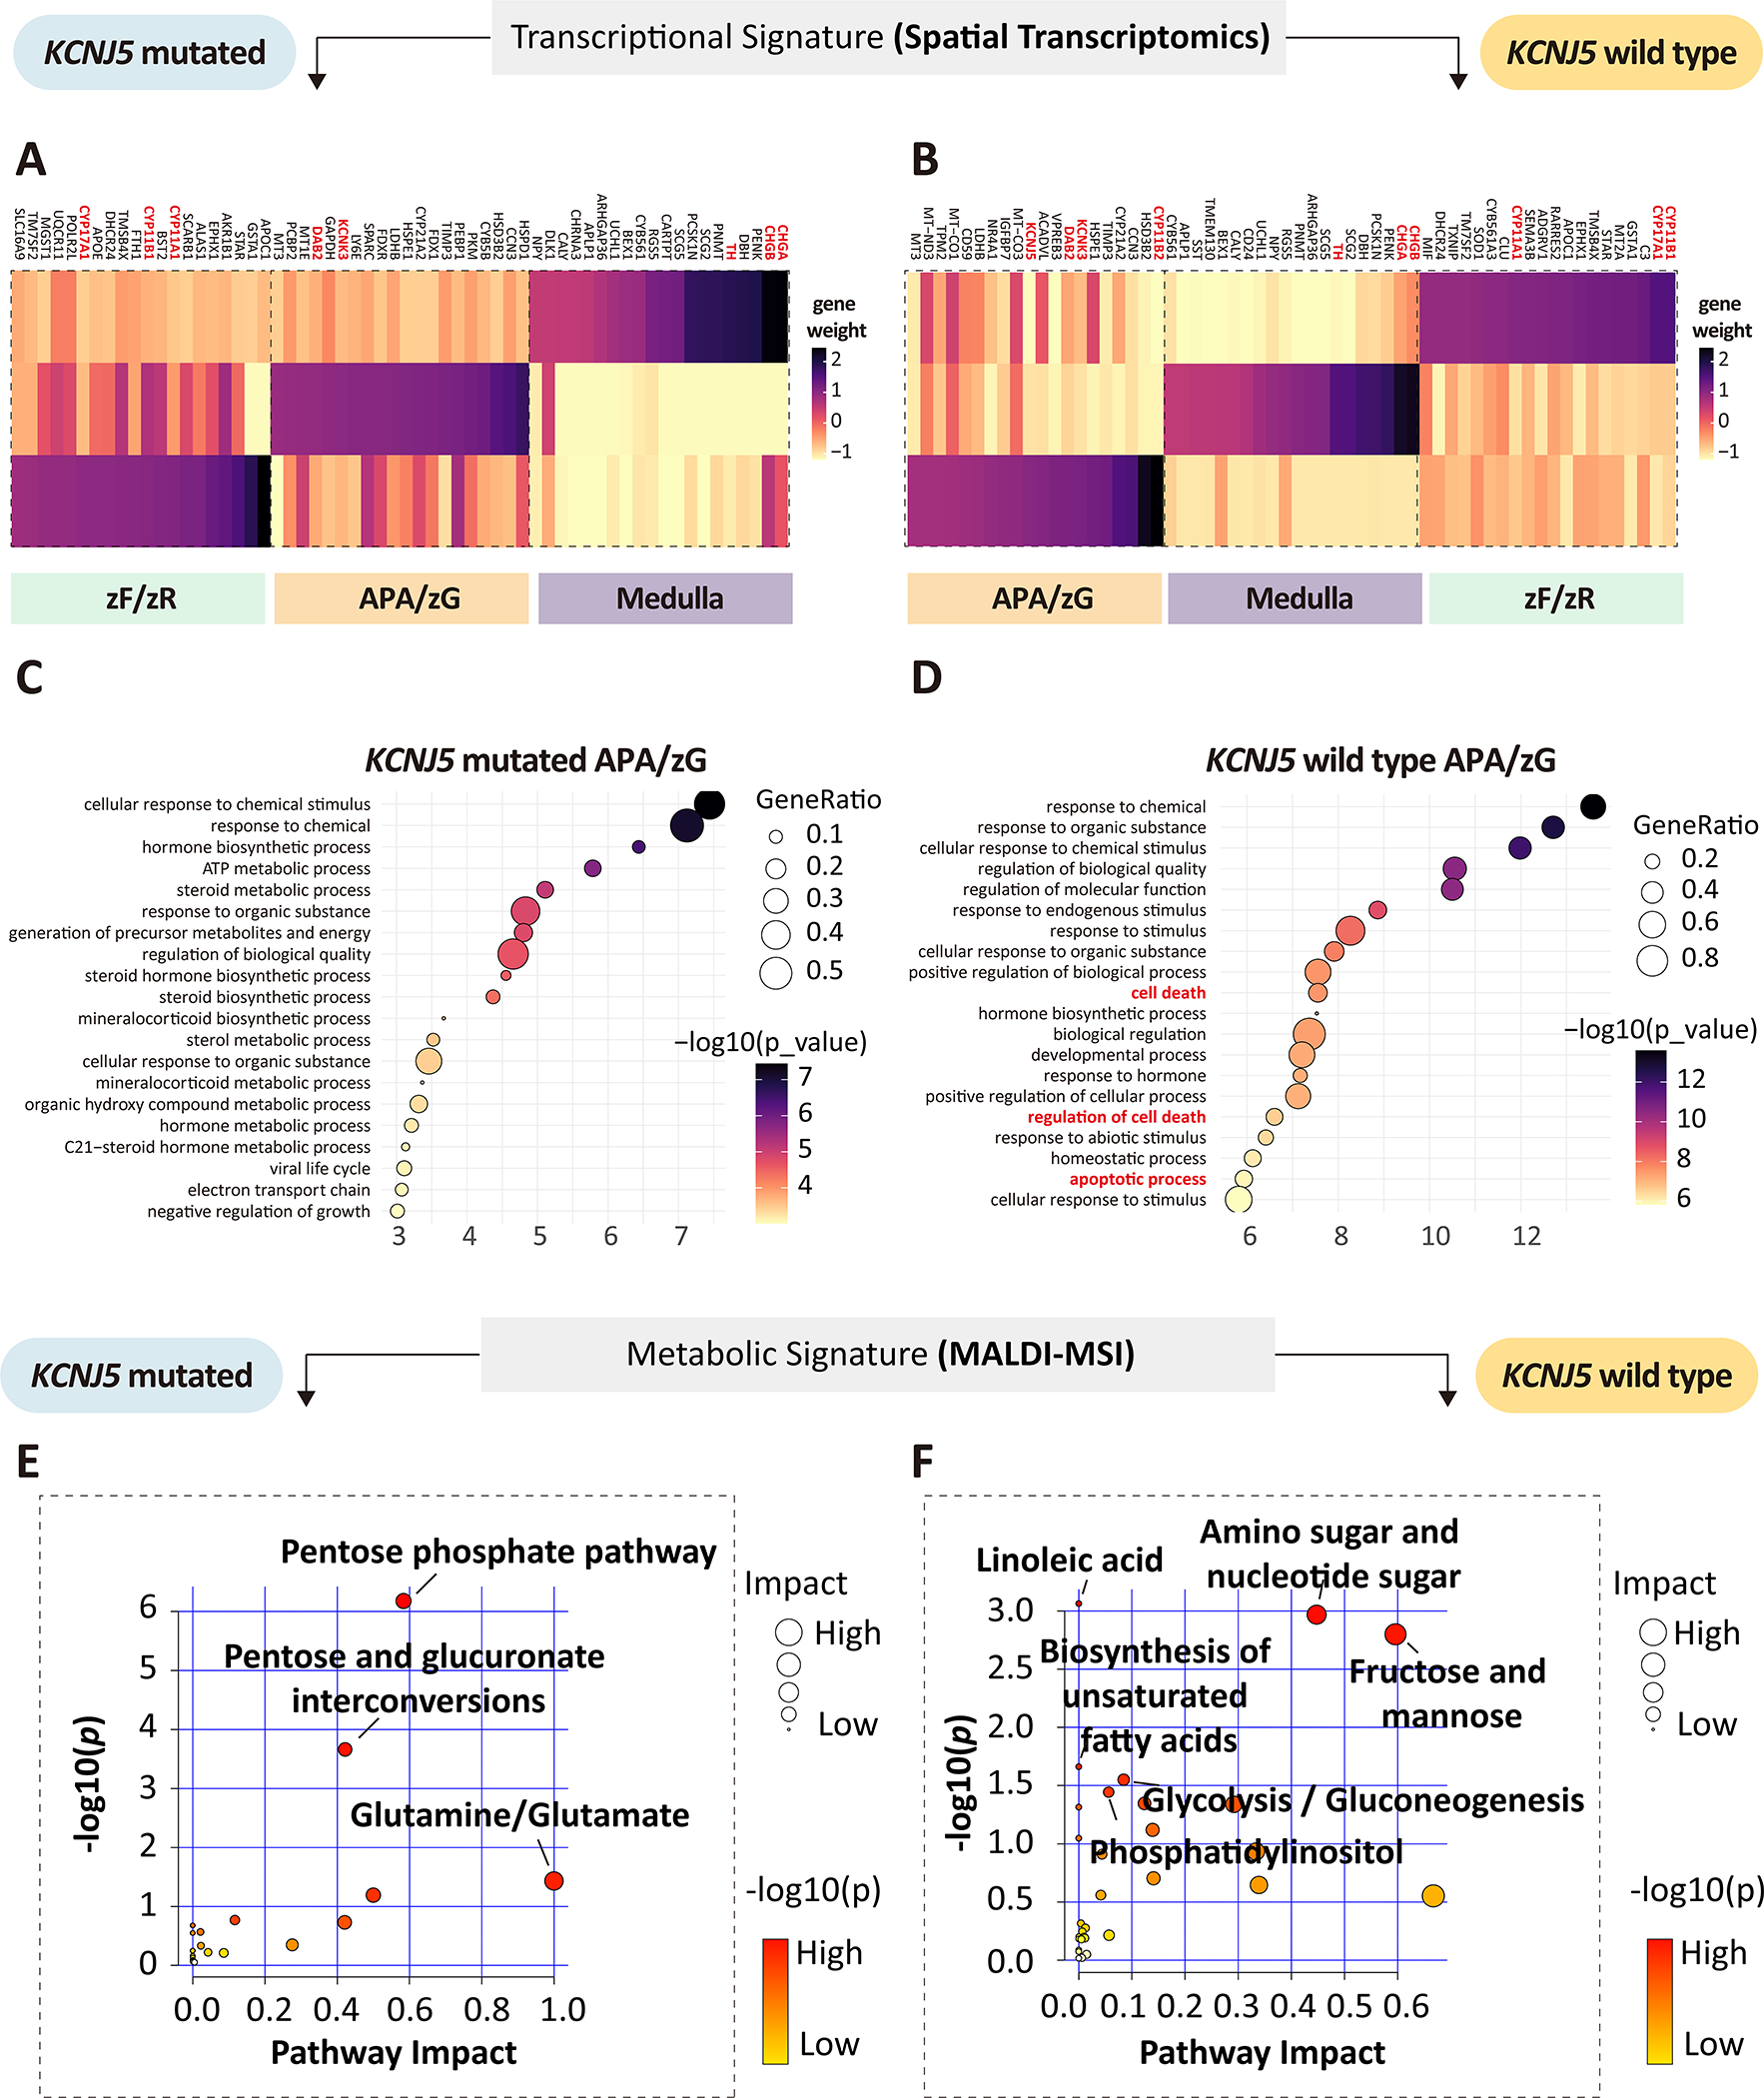
A-B, Heatmap of top genes contributing to each factor (transcriptionally distinct region) of APA-KCNJ5MUT and APA-KCNJ5WT. Genes indicated in red represent zonation markers of the zona glomerulosa (zG) (CYP11B2, DAB2, and KCNJ5); markers of the zona fasciculata (zF) or zona reticularis (zR) (CYP11B1 and CYP17A1); and of the adrenal medulla (CHGB, CHGA and TH). C-D, Gene ontology analysis (biological process) of tumor-related factors (factor 2 in APA-KCNJ5MUT, Figure S6; factor 3 in APA-KCNJ5WT, Figure S7). E-F, pathway enrichment analysis of upregulated metabolites in APA-KCNJ5MUT (left) or APA-KCNJ5WT (right) versus adjacent adrenal (unadjusted P<0.05, hypergeometric test).
Analysis of APA-KCNJ5WT versus the adjacent adrenal cortex identified enrichment of omega-3 (for example, alpha-linolenic acid and docosahexaenoic acid) and omega-6 (for example, docosapentaenoic acid and gamma-linolenic acid) PUFAs (Figure 4F and Figure 5; Table S5) whereas metabolites of glutathione metabolism were preferentially localized in APA-KCNJ5MUT (Figure S9). Therefore, the enrichment of PUFAs in APA-KCNJ5WT and glutathione in APA-KCNJ5MUT highlight prooxidant versus antioxidant responses indicating genotype-related diverse capacities for tumor expansion.
Figure 5. MALDI-MSI identification of upregulated omega-3 and omega-6 polyunsaturated fatty acids in KCNJ5 mutated APA compared with adjacent adrenal cortex.
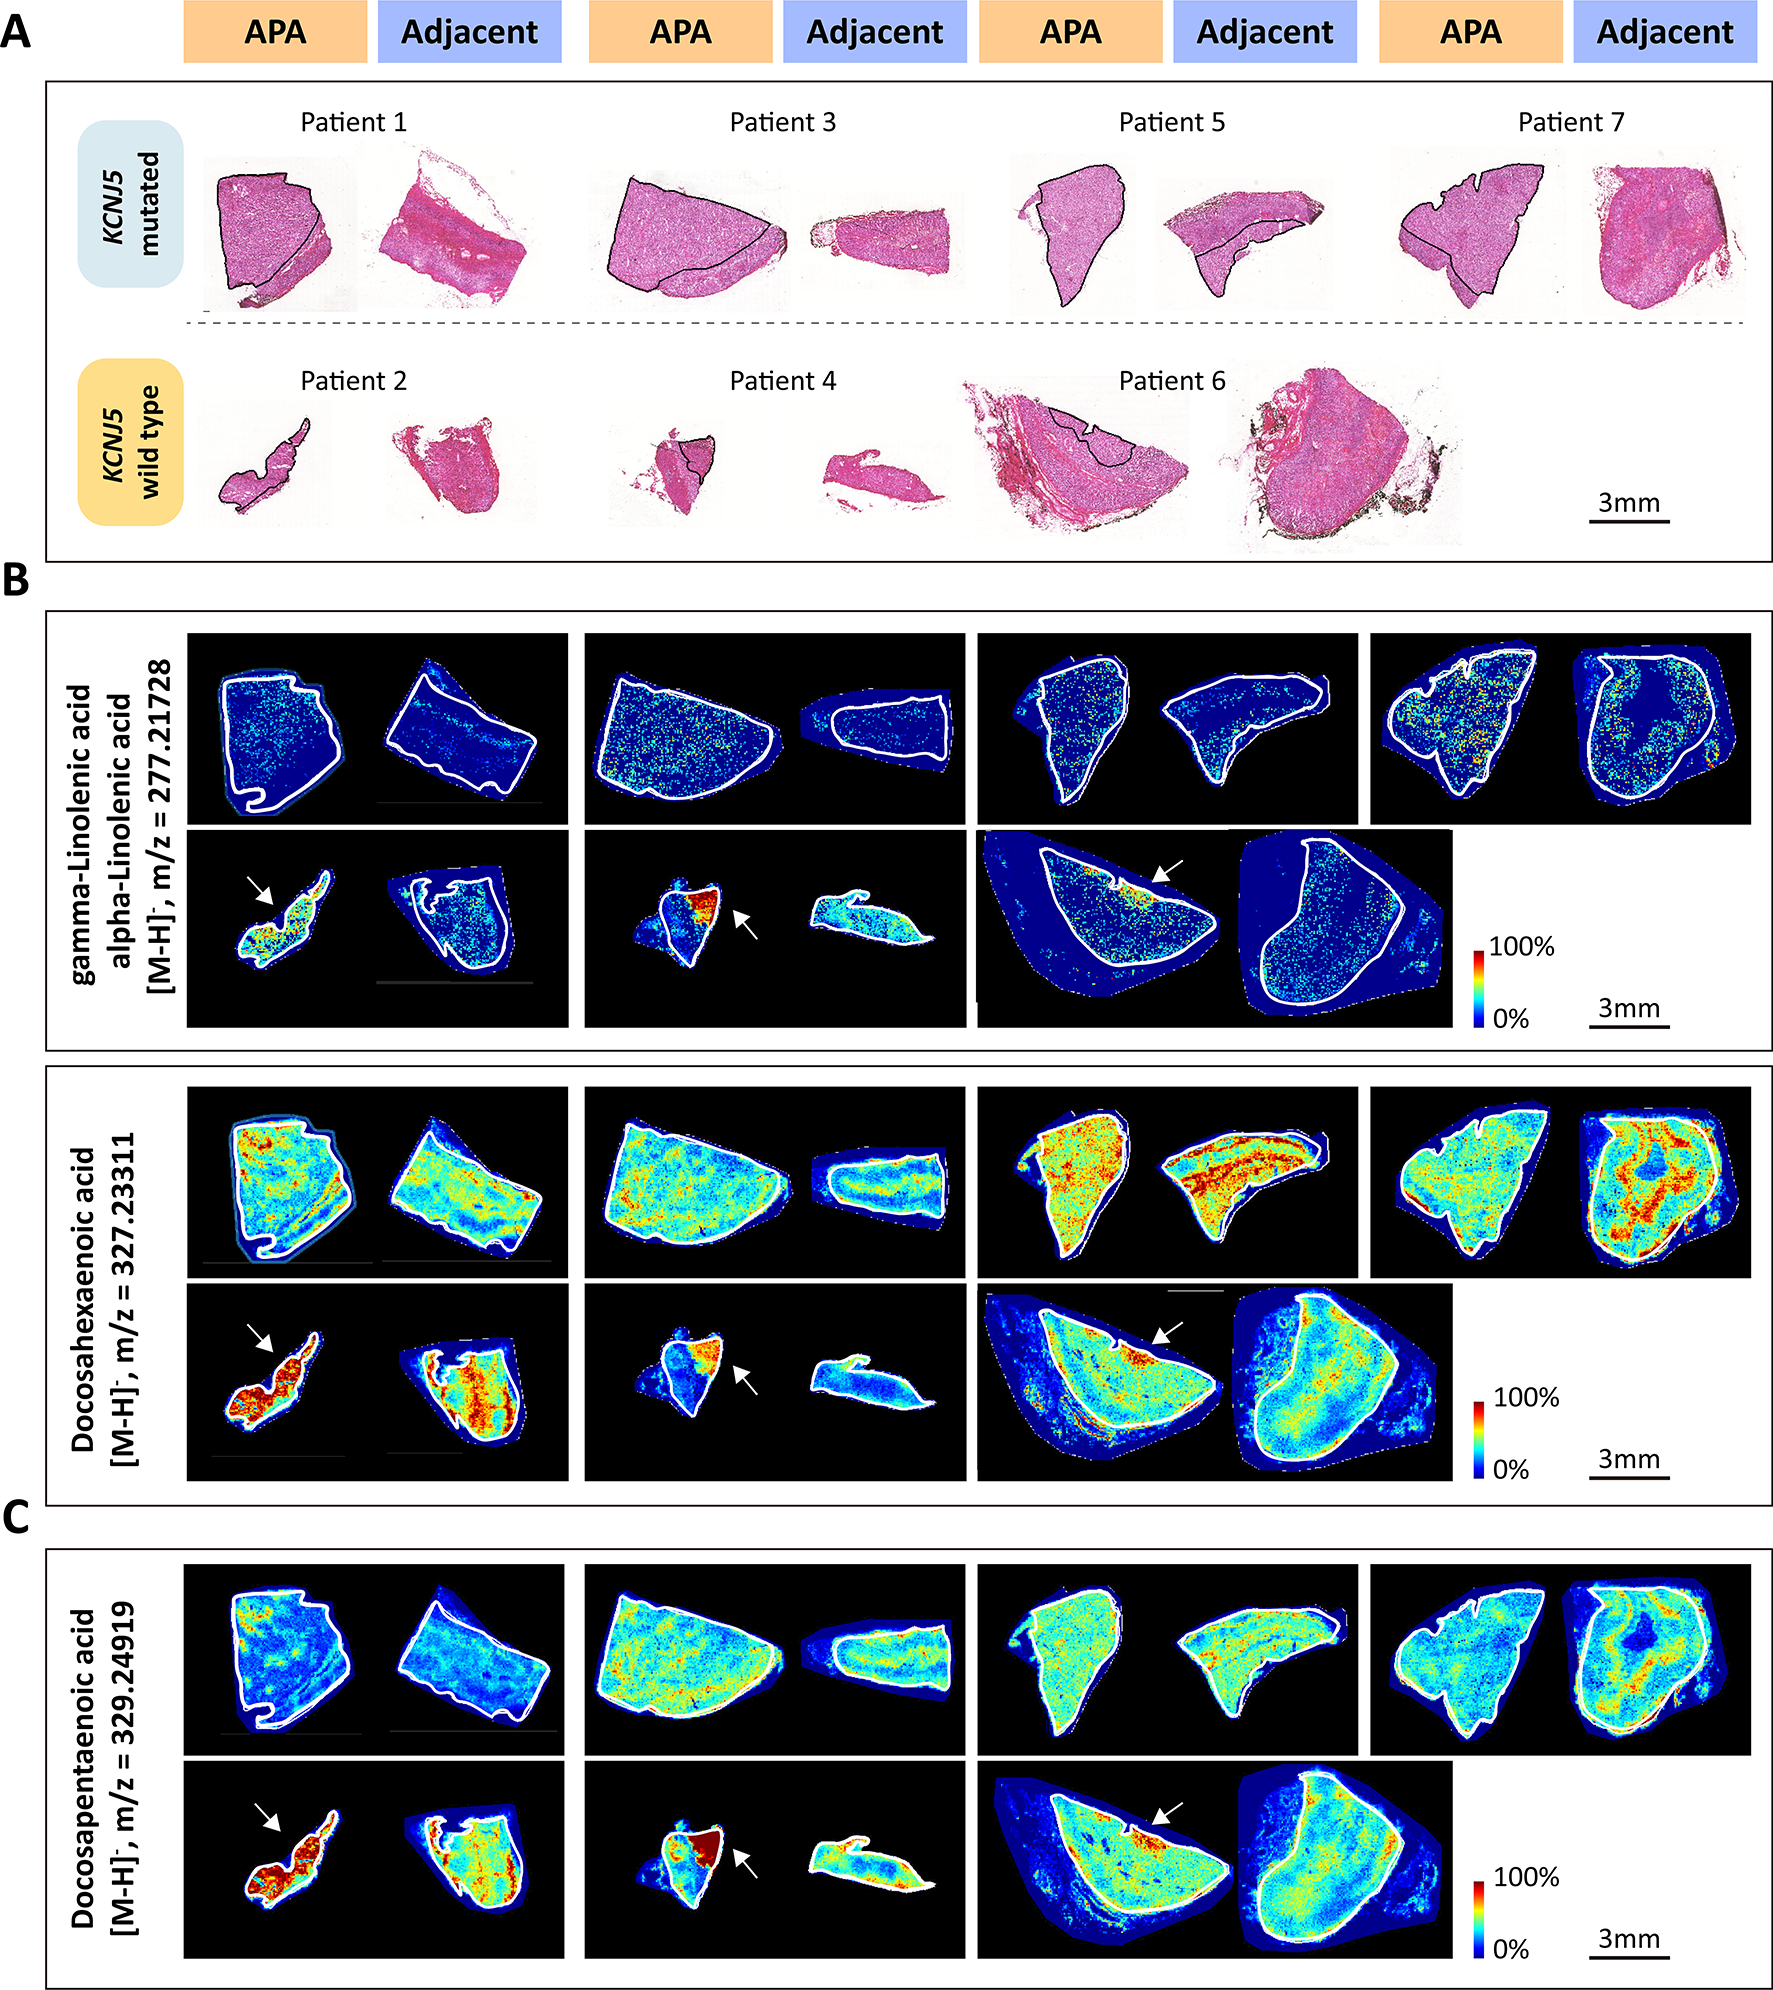
A, corresponding H&E-stained tissues of KCNJ5 mutated APA (Upper) or KCNJ5 wildtype APA (Lower) and adjacent adrenal gland used for MALDI-MSI. Outlined regions in black indicate APA tumor areas with positive CYP11B2 immunostaining. B-C, representative images showing spatial distribution of omega-3 polyunsaturated fatty acids (B) and omega-6 polyunsaturated fatty acids (C). Outlined regions in white represent the borders of the tissue section.
APA-like subpopulations in the adjacent adrenal cortex
Tissue-covered transcriptomics spots in APA and adjacent cortex stratified by APA genotype were integrated and corrected for batch effects. TSNE (t-distributed stochastic neighbor embedding) identified 6 unique transcriptome subpopulations in adrenals (APA + adjacent cortex) from patients with APA-KCNJ5MUT and 7 unique subpopulations in adrenals from patients with APA-KCNJ5WT (Figure 6). Subpopulations were annotated based on CYP11B2 immunostaining (Figure 1), expression of marker genes (Figure S10, Figure S11 and Table S6), and gene ontology analyses. The adrenals with APA-KCNJ5MUT comprised 2 clearly distinct tumor clusters, termed clusters APA-like 1 and APA-like 2. APA-like 1 displayed CYP11B2 gene expression whereas APA-like 2 did not (Figure S10). Both APA-like clusters were also located in the adjacent cortex to APA-KCNJ5MUT (Figure 6A, C and E). Adrenals with APA-KCNJ5WT exhibited a single tumor cluster- termed APA-like 3 - which expressed the CYP11B2 gene (Figure S10) and was in the tumor region and the adjacent cortex (Figure 6B, D and F). Notably, although the signature of APA-like subpopulations 1 and 3 comprised the CYP11B2 gene transcript, CYP11B2 gene expression was present only within tumor regions and not in the corresponding subpopulations in the adjacent adrenal cortex. Comparisons of tumor samples versus the adjacent cortex of patients with a different APA genotype, for example, tumor specimens from APA-KCNJ5MUT compared with the adjacent cortex of APA-KCNJ5WT and vice versa, consistently identified APA-like 1, 2, and 3 subpopulations (Figure S12). However, the APA-like 1 subpopulation in the tumor regions of APA-KCNJ5MUT was undetectable in the adrenal cortical tissue adjacent to APA-KCNJ5WT (Figure S12E).
Figure 6. Spatial transcriptomics establishes APA-like subpopulations in the adjacent adrenal cortex.
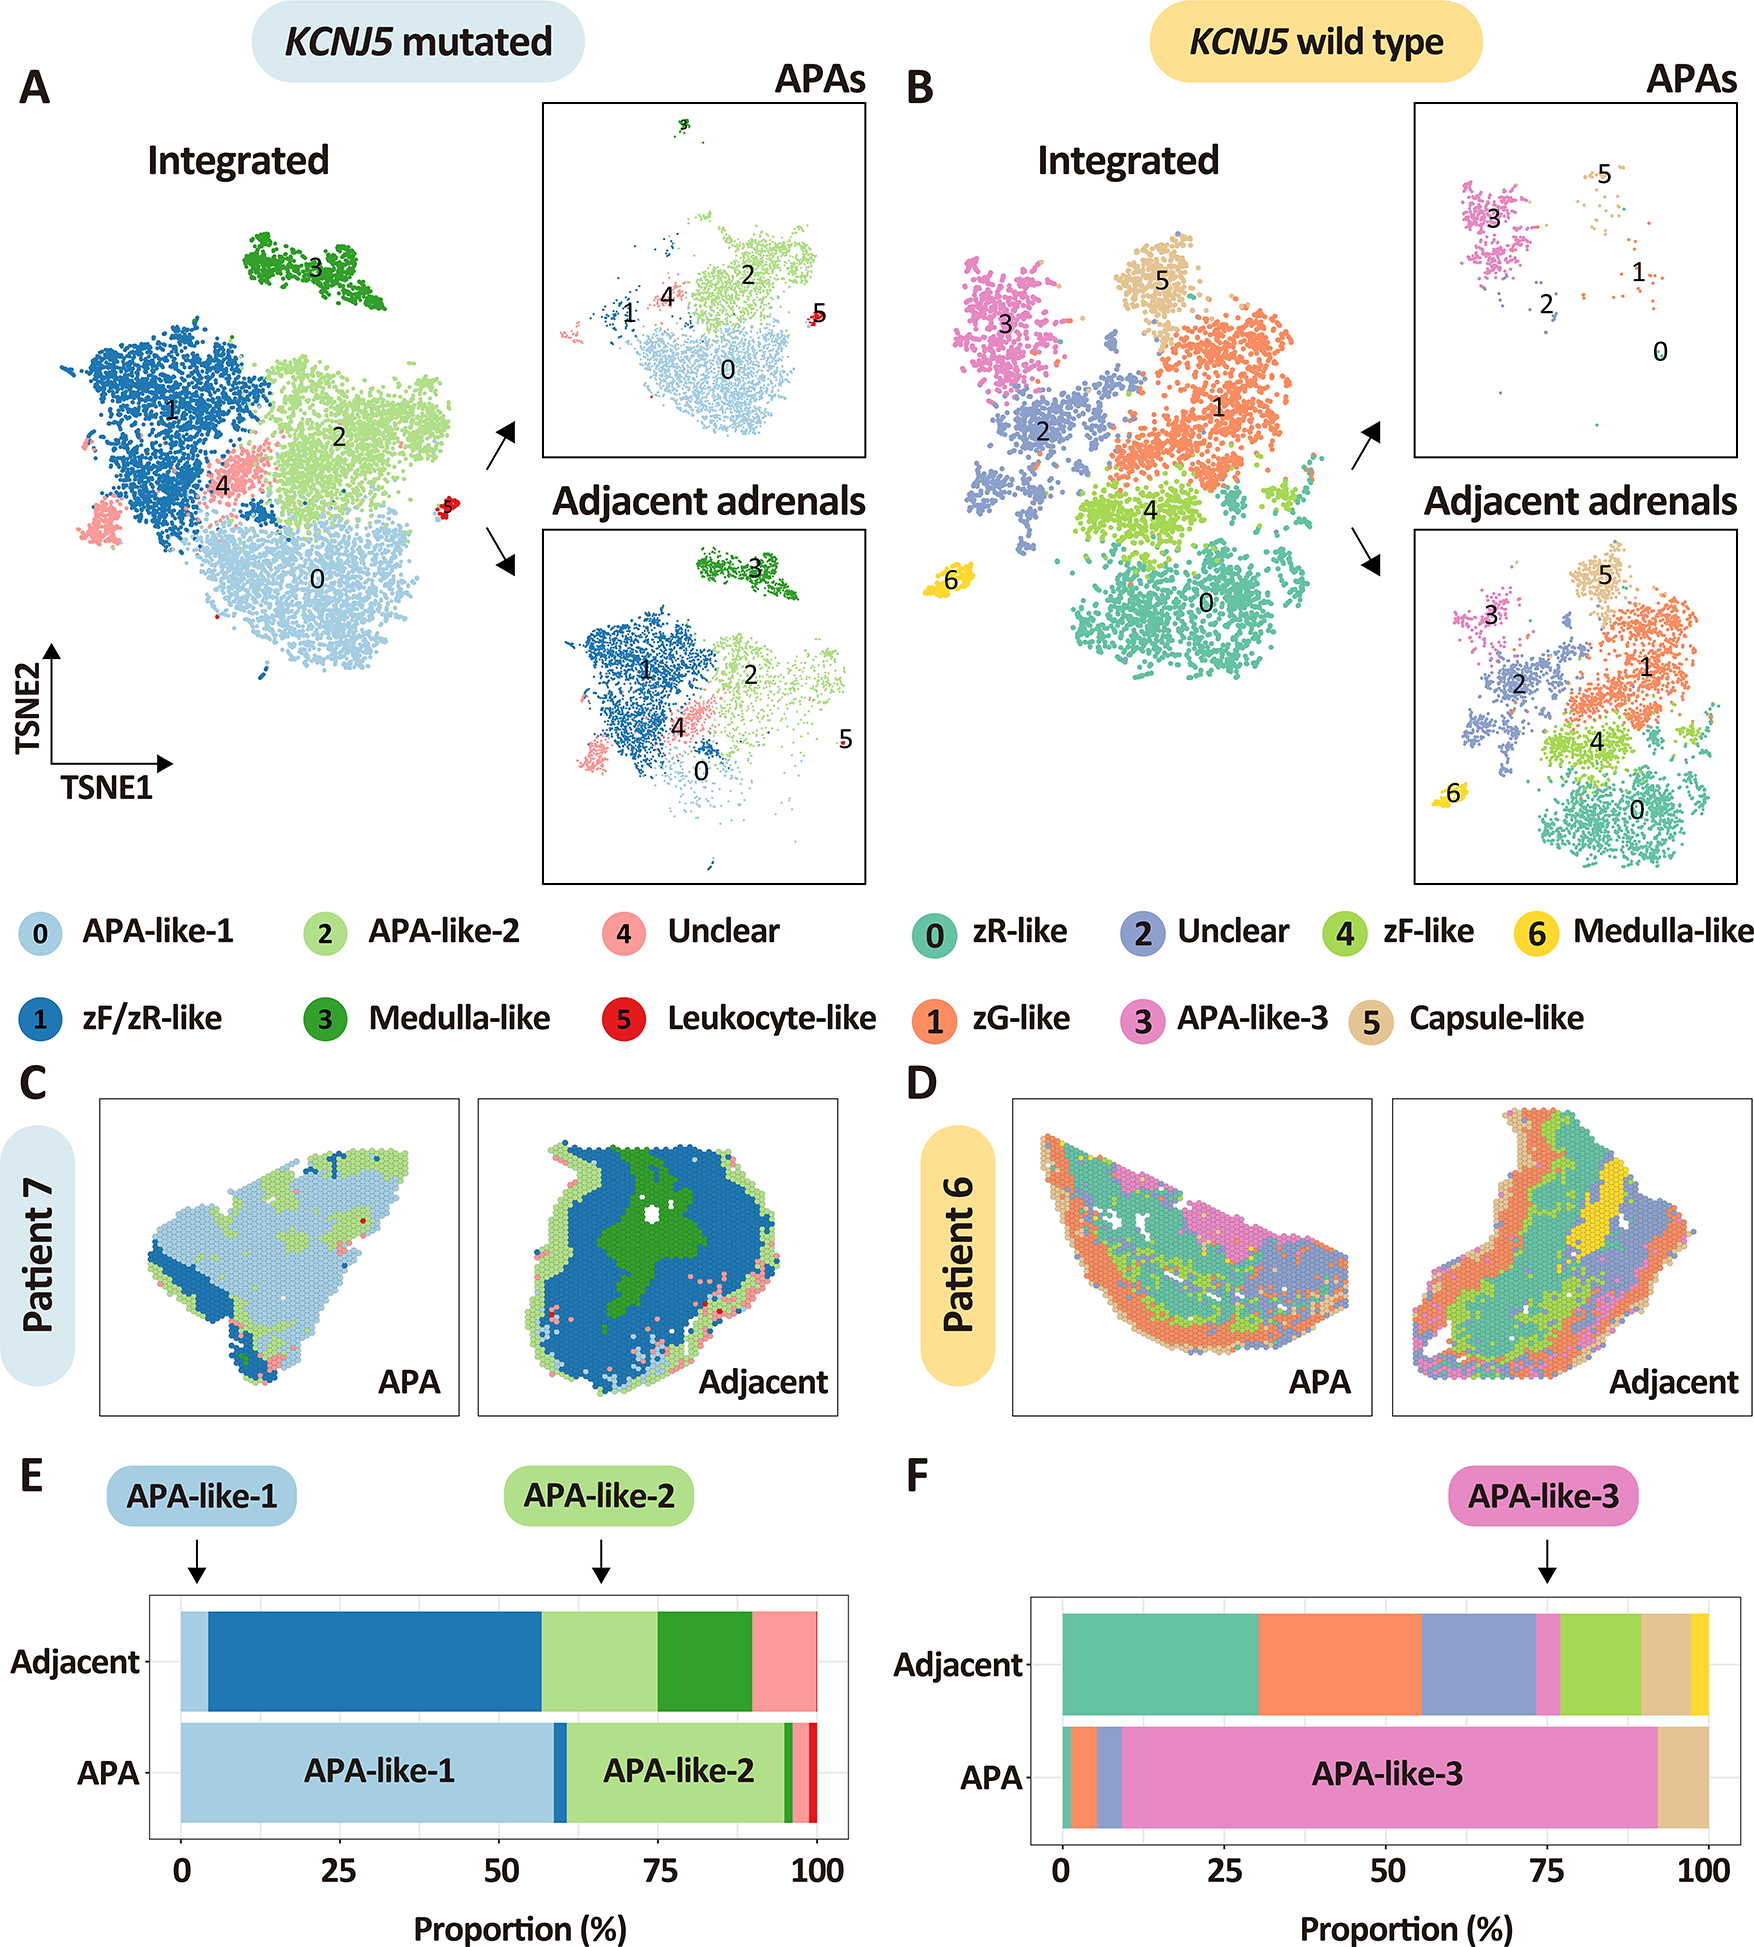
A-B, t-distributed stochastic neighbor embedding representations of the integrated spatial transcriptomes of APAs and adjacent adrenal tissues stratified by APA-KCNJ5 mutation status and tissue type. Panels A and B show integrated spatial transcriptomic spots from APAs and adjacent adrenal tissues (left image of A and B) as well as separated into APAs (boxed image, top right of A and B) and adjacent adrenal tissues (boxed image, bottom right of A and B). Colors represent transcriptome subpopulations as indicated. A, APA-KCNJ5MUT (n = 4) and their adjacent adrenal cortex (n = 4). B, APA-KCNJ5WT (n = 3) and their adjacent adrenal cortex (n = 3). C-D, representative spatial transcriptomics sections showing the distribution of spots in APAs and adjacent adrenals from patient 7 with a KCNJ5 mutation (male) and patient 6 without a KCNJ5 mutation (female). E-F, stacked plots showing the proportion of each transcriptome cluster in APAs and adjacent adrenals. Left panels and right panels indicate adrenal tissues from patients with a KCNJ5 mutation (represented in light blue, Left,) or without a KCNJ5 mutation (represented in light yellow, Right). All APA-like signatures (APA-like 1, 2 and 3) are common to tumor areas and adjacent tissue and may represent precursor APA subpopulations.
DISCUSSION
The biological mechanisms driving the predominant APA-KCNJ5MUT phenotype of larger tumor diameter, particular cell composition and heterogeneous CYP11B2 immunostaining, are unknown. 4,9,15,16,18,19 To address this knowledge gap, this study had three main goals: (i) to characterize the intra- and inter-tumor transcriptional heterogeneity of APAs; (ii) to delineate the transcriptional and metabolomic mechanisms through which KCNJ5 mutation status contributes to tumor expansion; (iii) to spatially distinguish pre-APA-like cells in the adrenal cortex adjacent to APAs.
The histological heterogeneity of CYP11B2 immunostaining in APA-KCNJ5MUT has been previously reported.15,16 In this context, tumor regions with varying levels of CYP11B2 expression in APA-KCNJ5MUT share identical somatic KCNJ5 variants with similar variant allele frequencies,15,45 indicating that transcriptional diversity between tumor regions with different CYP11B2 expression levels should occur in a spatial context. Here, we establish APA heterogeneity at the transcriptional level through the unbiased analysis of the transcriptome landscape. Our findings suggest that heterogenous CYP11B2 expression may be caused by differential regulation of specific signaling pathways because biological pathways related to the stimulation of aldosterone production, such as VEGF,46 p53,47 and androgen48 pathways, are dominant in tumor regions of APA-KCNJ5MUT with higher CYP11B2 expression.
Defining the functional significance of clear versus compact eosinophilic cells in APAs using spatial transcriptomics is of particular interest because it has been challenging to define the transcriptional programs of these different cell subpopulations, in part because APAs comprise a mixture of the 2 cell types.4 Our bioinformatics analyses identified 2 distinct APA transcriptional signatures associated with CYP11B2 expressing regions, referred to here as CYP11B2-type 1 and CYP11B2-type 2, across genotype groups. The distribution of these signatures matched that of the previously described APA morphology (small compact versus clear cells) with diverse relative proportions of these cell types according to KCNJ5 mutation status and tumor diameter.15,17,49 In the spatial context of our study, the CYP11B2-type 1 transcriptome signature was enriched in compact eosinophilic cells and was characterized by increased cell stress-associated signaling activity, suggesting that microenvironmental stress conditions may restrict their capacity for cell proliferation. Conversely, the CYP11B2-type 2 transcriptome signature which predominated in APA-KCNJ5MUT- which have a higher proportion of lipid-rich clear cells- exhibited enhanced mTORC1 and hypoxia-associated signaling activity, consistent with the promotion of metabolic adaptations for proliferation under hypoxic conditions.50,51
We resolve enriched cell stress transcriptional signals and accumulated PUFAs and pro-ferroptotic arachidonoyl-PE species in APA-KCNJ5WT relative to their adjacent cortex and to APA-KCNJ5MUT. Prior studies have demonstrated that an abundance of PUFAs and pro-ferroptotic arachidonoyl-PE species can activate cell death pathways such as ferroptosis in various diseases.40,41,52,53 In contrast, enriched metabolites of the oxidative pentose phosphate pathway and of glutathione metabolism in APA-KCNJ5MUT highlight active antioxidant defense mechanisms to eliminate stress overload signals and maintain tissue homeostasis.54–56 Therefore, taken together, these data can help explain the restricted growth of APA-KCNJ5WT tumors and the sustained growth of APA-KCNJ5MUT and help account for the genotype-related differences in APA tumor size.
Our data report previously unappreciated APA-like molecular regions in the adrenal cortex adjacent to APAs. We identified 2 APA-like transcriptome subpopulations common to APA-KCNJ5MUT and their paired adjacent cortex (APA-like 1 and APA-like 2), and a single APA-like subpopulation in the tumor and adjacent cortex of APA-KCNJ5WT (APA-like 3). Spatial transcriptomics spots of these APA-like subpopulations in APA and their adjacent cortex were clustered according to their similar gene expression profiles. CYP11B2 transcripts were absent from the APA-like 2 subpopulation in APA-KCNJ5MUT, which is consistent with the heterogeneous CYP11B2 immunostaining observed in these tumors.15 In contrast, CYP11B2 transcripts were part of the APA-like 1 and APA-like 3 signatures; however, the corresponding subpopulations expressed the CYP11B2 gene only in tumor regions and not in the adjacent cortex. Thus, APA-like 1 and APA-like 3 are distinct from aldosterone-producing micronodules11 and might represent distinct precursor APA-like states. In addition, the APA-like-1 subpopulation identified in APA-KCNJ5MUT and the adjacent cortex was apparently absent from the adjacent cortex to APA-KCNJ5WT thus indicating that this signature could be a unique feature of adrenals harboring a APA-KCNJ5MUT. However, because tumors may influence their surrounding microenvironment, we cannot rule-out the possibility that the APA-like 1 signature in the adjacent cortex to APA-KCNJ5MUT resulted from modulatory effects on the tumor microenvironment by the APA itself. Further investigation of larger cohorts is needed to confirm our findings and assess the potential influence of gender in the context of KCNJ5 mutations.
In conclusion, we demonstrate intra-tumoral transcriptional heterogeneity of APA-KCNJ5MUT and the transcriptome signatures of the component compact eosinophilic cells and lipid-rich clear cells. We propose that APA tumor cells require metabolic adaptations to oxidative stress signals to survive and proliferate and we provide evidence to support the existence of novel molecular zones in the adrenal cortex which might represent tumor precursor states.
PERSPECTIVES
Conventional techniques that apply bulk or single cell RNA sequencing cannot effectively dissect the tissue organization of gene expression levels. In contrast, spatially resolved transcriptomics profiling (spatial RNA sequencing) combined with state-of-the-art bioinformatics platforms can quantifiably assess gene expression at the cellular level within the context of tissue morphology. We applied this approach to surgically removed adrenal glands from patients operated for an APA. We established transcriptomics signatures which define the distinct cell compositions of APAs and the molecular and cellular diversity of these tumors according to KCNJ5 mutation status. Further, the integration of spatial transcriptomics and metabolomics datasets demonstrated that the cellular response to oxidative stress might direct genotype-related APA size differences. In the adrenocortical tissue adjacent to APAs, APA-like transcriptomic signatures were uncovered without aldosterone synthase transcription thereby suggesting the existence of novel tumor precursor cells prior to the acquisition of autonomous aldosterone production. Overall, we establish how spatial omics technologies can provide a blueprint for understanding the spatial architecture and genotype-specific tumorigenesis of APAs.
Supplementary Material
NOVELTY AND RELEVANCE.
What Is New?
We integrated spatial transcriptomics and spatial metabolomics profiles with CYP11B2 immunohistochemistry of surgically removed adrenals from patients operated for an APA.
What Is Relevant?
Despite high inter-tumoral transcriptional heterogeneity, 2 specific transcriptional signatures common to all APAs were identified that characterize compact eosinophilic cells or lipid-rich clear cells.
Antioxidant metabolites are enriched in APAs with a KCNJ5 mutation and prooxidant metabolites are enriched in APAs without a KCNJ5 mutation.
Novel APA-like molecular subpopulations without CYP11B2 expression are identified in the adrenal cortex that suggest the existence of tumor precursor states.
Clinical/Pathophysiological Implications
Our findings advance the understanding of the transcriptional context of inter- and intra-tumoral APA heterogeneity and provide novel insight into the genotype-dependent tumor expansion capabilities of APAs.
ACKNOWLEDGEMENTS
The authors thank Isabella Sabrina-Kinker (LMU Munich, Germany) for assistance with cryosectioning and immunohistochemistry and Manuel Schulze (TU Dresden, Germany) for advice with the high-performance computing system platform used for data analysis.
SOURCES OF FUNDING
This work was financed by the European Research Council (ERC) under the European Union’s Horizon 2020 research and innovation programme (grant agreement no. 694913 to M Reincke) and the Deutsche Forschungsgemeinschaft (DFG) project number 444776998 to TA Williams (WI 5359/-1) and M Reincke (RE 752/31-1) and project number 314061271-TRR 205 “The Adrenal: Central Relay in Health and Disease” to M Reincke, A Walch, and TA Williams. The Else Kröner-Fresenius Stiftung (2012_A103, 2015_A228, and 2019_A104; Else-Kröner Hyperaldosteronismus-German Conn Registry) also supports the work of M Reincke. WE Rainey is supported by the National Institutes of Health/National Institute of Diabetes and Digestive and Kidney Diseases (R01DK043140). S Gong is supported by a fellowship from the China Scholarship Council.
Nonstandard Abbreviations and Acronyms
- APA
aldosterone-producing adenoma
- PA
primary aldosteronism
- zG
zona glomerulosa
- zF
zona fasciculate
- zR
zona reticularis
- MALDI-MSI
matrix-assisted laser desorption/ionization mass spectrometry imaging
- KCNJ5
gene encoding GIRK4 (G-protein-gated inwardly rectifying potassium channel 4)
- NNMF
non-negative matrix factorization
- PUFA
polyunsaturated fatty acid
- PE
phosphatidylethanolamine
Footnotes
CONFLICTS OF INTEREST/DISCLOSURES
None
Contributor Information
Siyuan Gong, Medizinische Klinik und Poliklinik IV, Klinikum der Universität München, LMU München, München, Germany.
Na Sun, Research Unit Analytical Pathology, German Research Center for Environmental Health, Helmholtz Zentrum München, Germany.
Lucie S Meyer, Medizinische Klinik und Poliklinik IV, Klinikum der Universität München, LMU München, München, Germany.
Martina Tetti, Medizinische Klinik und Poliklinik IV, Klinikum der Universität München, LMU München, München, Germany.
Christina Koupourtidou, Department for Cell Biology and Anatomy, Biomedical Center, Ludwig-Maximilians-Universität (LMU), Planegg-Martinsried, Germany; Graduate School Systemic Neurosciences, Ludwig-Maximilians-Universität (LMU), Planegg-Martinsried, Germany.
Stefan Krebs, Laboratory for Functional Genome Analysis, Gene Center, LMU Munich, 81377 Munich, Germany.
Giacomo Masserdotti, Institute of Stem Cell Research, Helmholtz Center Munich, Neuherberg, Germany; Physiological Genomics, Biomedical Center (BMC), Ludwig-Maximilians-Universität (LMU), Planegg-Martinsried, Germany.
Helmut Blum, Laboratory for Functional Genome Analysis, Gene Center, LMU Munich, 81377 Munich, Germany.
William E. Rainey, Department of Molecular and Integrative Physiology, University of Michigan, Ann Arbor, Michigan, USA Division of Metabolism, Endocrine, and Diabetes, Department of Internal Medicine, University of Michigan, Ann Arbor, Michigan, USA.
Martin Reincke, Medizinische Klinik und Poliklinik IV, Klinikum der Universität München, LMU München, München, Germany.
Axel Walch, Research Unit Analytical Pathology, German Research Center for Environmental Health, Helmholtz Zentrum München, Germany.
Tracy Ann Williams, Medizinische Klinik und Poliklinik IV, Klinikum der Universität München, LMU München, München, Germany.
REFERENCES
- 1.Williams TA, Reincke M. Pathophysiology and histopathology of primary aldosteronism. Trends Endocrinol Metab. 2022;33:36–49. doi: 10.1016/j.tem.2021.10.002 [DOI] [PubMed] [Google Scholar]
- 2.Choi M, Scholl UI, Yue P, Bjorklund P, Zhao B, Nelson-Williams C, Ji W, Cho Y, Patel A, Men CJ, et al. K+ channel mutations in adrenal aldosterone-producing adenomas and hereditary hypertension. Science. 2011;331:768–772. doi: 10.1126/science.1198785 [DOI] [PMC free article] [PubMed] [Google Scholar]
- 3.Scholl UI, Goh G, Stolting G, de Oliveira RC, Choi M, Overton JD, Fonseca AL, Korah R, Starker LF, Kunstman JW, et al. Somatic and germline CACNA1D calcium channel mutations in aldosterone-producing adenomas and primary aldosteronism. Nat Genet. 2013;45:1050–1054. doi: 10.1038/ng.2695 [DOI] [PMC free article] [PubMed] [Google Scholar]
- 4.Azizan EA, Poulsen H, Tuluc P, Zhou J, Clausen MV, Lieb A, Maniero C, Garg S, Bochukova EG, Zhao W, et al. Somatic mutations in ATP1A1 and CACNA1D underlie a common subtype of adrenal hypertension. Nat Genet. 2013;45:1055–1060. doi: 10.1038/ng.2716 [DOI] [PubMed] [Google Scholar]
- 5.Nanba K, Blinder AR, Rege J, Hattangady NG, Else T, Liu CJ, Tomlins SA, Vats P, Kumar-Sinha C, Giordano TJ, et al. Somatic CACNA1H Mutation As a Cause of Aldosterone-Producing Adenoma. Hypertension. 2020;75:645–649. doi: 10.1161/HYPERTENSIONAHA.119.14349 [DOI] [PMC free article] [PubMed] [Google Scholar]
- 6.Dutta RK, Arnesen T, Heie A, Walz M, Alesina P, Soderkvist P, Gimm O. A somatic mutation in CLCN2 identified in a sporadic aldosterone-producing adenoma. Eur J Endocrinol. 2019;181:K37–K41. doi: 10.1530/EJE-19-0377 [DOI] [PubMed] [Google Scholar]
- 7.Beuschlein F, Boulkroun S, Osswald A, Wieland T, Nielsen HN, Lichtenauer UD, Penton D, Schack VR, Amar L, Fischer E, et al. Somatic mutations in ATP1A1 and ATP2B3 lead to aldosterone-producing adenomas and secondary hypertension. Nat Genet. 2013;45:440–444, 444e441–442. doi: 10.1038/ng.2550 [DOI] [PubMed] [Google Scholar]
- 8.Williams TA, Monticone S, Mulatero P. KCNJ5 mutations are the most frequent genetic alteration in primary aldosteronism. Hypertension. 2015;65:507–509. doi: 10.1161/HYPERTENSIONAHA.114.04636 [DOI] [PubMed] [Google Scholar]
- 9.Lenzini L, Rossitto G, Maiolino G, Letizia C, Funder JW, Rossi GP. A Meta-Analysis of Somatic KCNJ5 K(+) Channel Mutations In 1636 Patients With an Aldosterone-Producing Adenoma. J Clin Endocrinol Metab. 2015;100:E1089–1095. doi: 10.1210/jc.2015-2149 [DOI] [PubMed] [Google Scholar]
- 10.Gomez-Sanchez CE, Qi X, Velarde-Miranda C, Plonczynski MW, Parker CR, Rainey W, Satoh F, Maekawa T, Nakamura Y, Sasano H, et al. Development of monoclonal antibodies against human CYP11B1 and CYP11B2. Mol Cell Endocrinol. 2014;383:111–117. doi: 10.1016/j.mce.2013.11.022 [DOI] [PMC free article] [PubMed] [Google Scholar]
- 11.Williams TA, Gomez-Sanchez CE, Rainey WE, Giordano TJ, Lam AK, Marker A, Mete O, Yamazaki Y, Zerbini MCN, Beuschlein F, et al. International Histopathology Consensus for Unilateral Primary Aldosteronism. J Clin Endocrinol Metab. 2021;106:42–54. doi: 10.1210/clinem/dgaa484 [DOI] [PMC free article] [PubMed] [Google Scholar]
- 12.Mete O, Erickson LA, Juhlin CC, de Krijger RR, Sasano H, Volante M, Papotti MG. Overview of the 2022 WHO Classification of Adrenal Cortical Tumors. Endocr Pathol. 2022;33:155–196. doi: 10.1007/s12022-022-09710-8 [DOI] [PMC free article] [PubMed] [Google Scholar]
- 13.Meyer LS, Handgriff L, Lim JS, Udager AM, Kinker IS, Ladurner R, Wildgruber M, Knosel T, Bidlingmaier M, Rainey WE, et al. Single-Center Prospective Cohort Study on the Histopathology, Genotype, and Postsurgical Outcomes of Patients With Primary Aldosteronism. Hypertension. 2021;78:738–746. doi: 10.1161/HYPERTENSIONAHA.121.17348 [DOI] [PubMed] [Google Scholar]
- 14.Wu VC, Peng KY, Kuo YP, Liu H, Tan BC, Lin YH, Lai TS, Chen YM, Chueh JS, Taipai. Subtypes of Histopathologically Classical Aldosterone-Producing Adenomas Yield Various Transcriptomic Signaling and Outcomes. Hypertension. 2021;78:1791–1800. doi: 10.1161/HYPERTENSIONAHA.121.18006 [DOI] [PubMed] [Google Scholar]
- 15.De Sousa K, Boulkroun S, Baron S, Nanba K, Wack M, Rainey WE, Rocha A, Giscos-Douriez I, Meatchi T, Amar L, et al. Genetic, Cellular, and Molecular Heterogeneity in Adrenals With Aldosterone-Producing Adenoma. Hypertension. 2020;75:1034–1044. doi: 10.1161/HYPERTENSIONAHA.119.14177 [DOI] [PMC free article] [PubMed] [Google Scholar]
- 16.Yamazaki Y, Omata K, Tezuka Y, Ono Y, Morimoto R, Adachi Y, Ise K, Nakamura Y, Gomez-Sanchez CE, Shibahara Y, et al. Tumor Cell Subtypes Based on the Intracellular Hormonal Activity in KCNJ5-Mutated Aldosterone-Producing Adenoma. Hypertension. 2018;72:632–640. doi: 10.1161/HYPERTENSIONAHA.118.10907 [DOI] [PMC free article] [PubMed] [Google Scholar]
- 17.Ono Y, Yamazaki Y, Omata K, Else T, Tomlins SA, Rhayem Y, Williams TA, Reincke M, Carling T, Monticone S, et al. Histological Characterization of Aldosterone-producing Adrenocortical Adenomas with Different Somatic Mutations. J Clin Endocrinol Metab. 2020;105:e282–289. doi: 10.1210/clinem/dgz235 [DOI] [PMC free article] [PubMed] [Google Scholar]
- 18.Zheng FF, Zhu LM, Nie AF, Li XY, Lin JR, Zhang K, Chen J, Zhou WL, Shen ZJ, Zhu YC, et al. Clinical characteristics of somatic mutations in Chinese patients with aldosterone-producing adenoma. Hypertension. 2015;65:622–628. doi: 10.1161/HYPERTENSIONAHA.114.03346 [DOI] [PubMed] [Google Scholar]
- 19.Yang Y, Gomez-Sanchez CE, Jaquin D, Aristizabal Prada ET, Meyer LS, Knosel T, Schneider H, Beuschlein F, Reincke M, Williams TA. Primary Aldosteronism: KCNJ5 Mutations and Adrenocortical Cell Growth. Hypertension. 2019;74:809–816. doi: 10.1161/HYPERTENSIONAHA.119.13476 [DOI] [PMC free article] [PubMed] [Google Scholar]
- 20.Marx V. Method of the Year: spatially resolved transcriptomics. Nat Methods. 2021;18:9–14. doi: 10.1038/s41592-020-01033-y [DOI] [PubMed] [Google Scholar]
- 21.Rao A, Barkley D, Franca GS, Yanai I. Exploring tissue architecture using spatial transcriptomics. Nature. 2021;596:211–220. doi: 10.1038/s41586-021-03634-9 [DOI] [PMC free article] [PubMed] [Google Scholar]
- 22.Sun N, Wu Y, Nanba K, Sbiera S, Kircher S, Kunzke T, Aichler M, Berezowska S, Reibetanz J, Rainey WE, et al. High-Resolution Tissue Mass Spectrometry Imaging Reveals a Refined Functional Anatomy of the Human Adult Adrenal Gland. Endocrinology. 2018;159:1511–1524. doi: 10.1210/en.2018-00064 [DOI] [PMC free article] [PubMed] [Google Scholar]
- 23.Murakami M, Rhayem Y, Kunzke T, Sun N, Feuchtinger A, Ludwig P, Strom TM, Gomez-Sanchez C, Knosel T, Kirchner T, et al. In situ metabolomics of aldosterone-producing adenomas. JCI Insight. 2019;4. doi: 10.1172/jci.insight.130356 [DOI] [PMC free article] [PubMed] [Google Scholar]
- 24.Sun N, Meyer LS, Feuchtinger A, Kunzke T, Knosel T, Reincke M, Walch A, Williams TA. Mass Spectrometry Imaging Establishes 2 Distinct Metabolic Phenotypes of Aldosterone-Producing Cell Clusters in Primary Aldosteronism. Hypertension. 2020;75:634–644. doi: 10.1161/HYPERTENSIONAHA.119.14041 [DOI] [PubMed] [Google Scholar]
- 25.Buck A, Ly A, Balluff B, Sun N, Gorzolka K, Feuchtinger A, Janssen KP, Kuppen PJ, van de Velde CJ, Weirich G, et al. High-resolution MALDI-FT-ICR MS imaging for the analysis of metabolites from formalin-fixed, paraffin-embedded clinical tissue samples. J Pathol. 2015;237:123–132. doi: 10.1002/path.4560 [DOI] [PubMed] [Google Scholar]
- 26.Butler LM, Perone Y, Dehairs J, Lupien LE, de Laat V, Talebi A, Loda M, Kinlaw WB, Swinnen JV. Lipids and cancer: Emerging roles in pathogenesis, diagnosis and therapeutic intervention. Adv Drug Deliv Rev. 2020;159:245–293. doi: 10.1016/j.addr.2020.07.013 [DOI] [PMC free article] [PubMed] [Google Scholar]
- 27.Funder JW, Carey RM, Mantero F, Murad MH, Reincke M, Shibata H, Stowasser M, Young WF, Jr. The Management of Primary Aldosteronism: Case Detection, Diagnosis, and Treatment: An Endocrine Society Clinical Practice Guideline. J Clin Endocrinol Metab. 2016;101:1889–1916. doi: 10.1210/jc.2015-4061 [DOI] [PubMed] [Google Scholar]
- 28.Williams TA, Reincke M. MANAGEMENT OF ENDOCRINE DISEASE: Diagnosis and management of primary aldosteronism: the Endocrine Society guideline 2016 revisited. Eur J Endocrinol. 2018;179:R19–R29. doi: 10.1530/EJE-17-0990 [DOI] [PubMed] [Google Scholar]
- 29.Mulatero P, Monticone S, Deinum J, Amar L, Prejbisz A, Zennaro MC, Beuschlein F, Rossi GP, Nishikawa T, Morganti A, et al. Genetics, prevalence, screening and confirmation of primary aldosteronism: a position statement and consensus of the Working Group on Endocrine Hypertension of The European Society of Hypertension. J Hypertens. 2020;38:1919–1928. doi: 10.1097/HJH.0000000000002510 [DOI] [PubMed] [Google Scholar]
- 30.Williams TA, Lenders JWM, Mulatero P, Burrello J, Rottenkolber M, Adolf C, Satoh F, Amar L, Quinkler M, Deinum J, et al. Outcomes after adrenalectomy for unilateral primary aldosteronism: an international consensus on outcome measures and analysis of remission rates in an international cohort. Lancet Diabetes Endocrinol. 2017;5:689–699. doi: 10.1016/S2213-8587(17)30135-3 [DOI] [PMC free article] [PubMed] [Google Scholar]
- 31.Girardot C, Scholtalbers J, Sauer S, Su SY, Furlong EE. Je, a versatile suite to handle multiplexed NGS libraries with unique molecular identifiers. BMC Bioinformatics. 2016;17:419. doi: 10.1186/s12859-016-1284-2 [DOI] [PMC free article] [PubMed] [Google Scholar]
- 32.Parigi SM, Larsson L, Das S, Ramirez Flores RO, Frede A, Tripathi KP, Diaz OE, Selin K, Morales RA, Luo X, et al. The spatial transcriptomic landscape of the healing mouse intestine following damage. Nat Commun. 2022;13:828. doi: 10.1038/s41467-022-28497-0 [DOI] [PMC free article] [PubMed] [Google Scholar]
- 33.Andersson A, Larsson L, Stenbeck L, Salmen F, Ehinger A, Wu SZ, Al-Eryani G, Roden D, Swarbrick A, Borg A, et al. Spatial deconvolution of HER2-positive breast cancer delineates tumor-associated cell type interactions. Nat Commun. 2021;12:6012. doi: 10.1038/s41467-021-26271-2 [DOI] [PMC free article] [PubMed] [Google Scholar]
- 34.Nanba K, Omata K, Else T, Beck PCC, Nanba AT, Turcu AF, Miller BS, Giordano TJ, Tomlins SA, Rainey WE. Targeted Molecular Characterization of Aldosterone-Producing Adenomas in White Americans. J Clin Endocrinol Metab. 2018;103:3869–3876. doi: 10.1210/jc.2018-01004 [DOI] [PMC free article] [PubMed] [Google Scholar]
- 35.Nanba K, Rainey WE, Udager AM. Approaches to Gene Mutation Analysis Using Formalin-Fixed Paraffin-Embedded Adrenal Tumor Tissue From Patients With Primary Aldosteronism. Front Endocrinol (Lausanne). 2021;12:683588. doi: 10.3389/fendo.2021.683588 [DOI] [PMC free article] [PubMed] [Google Scholar]
- 36.Chen YP, Yin JH, Li WF, Li HJ, Chen DP, Zhang CJ, Lv JW, Wang YQ, Li XM, Li JY, et al. Single-cell transcriptomics reveals regulators underlying immune cell diversity and immune subtypes associated with prognosis in nasopharyngeal carcinoma. Cell Res. 2020;30:1024–1042. doi: 10.1038/s41422-020-0374-x [DOI] [PMC free article] [PubMed] [Google Scholar]
- 37.Hanzelmann S, Castelo R, Guinney J. GSVA: gene set variation analysis for microarray and RNA-seq data. BMC Bioinformatics. 2013;14:7. doi: 10.1186/1471-2105-14-7 [DOI] [PMC free article] [PubMed] [Google Scholar]
- 38.Korsunsky I, Millard N, Fan J, Slowikowski K, Zhang F, Wei K, Baglaenko Y, Brenner M, Loh PR, Raychaudhuri S. Fast, sensitive and accurate integration of single-cell data with Harmony. Nat Methods. 2019;16:1289–1296. doi: 10.1038/s41592-019-0619-0 [DOI] [PMC free article] [PubMed] [Google Scholar]
- 39.Zappia L, Oshlack A. Clustering trees: a visualization for evaluating clusterings at multiple resolutions. Gigascience. 2018;7. doi: 10.1093/gigascience/giy083 [DOI] [PMC free article] [PubMed] [Google Scholar]
- 40.Yang WS, Kim KJ, Gaschler MM, Patel M, Shchepinov MS, Stockwell BR. Peroxidation of polyunsaturated fatty acids by lipoxygenases drives ferroptosis. Proc Natl Acad Sci U S A. 2016;113:E4966–4975. doi: 10.1073/pnas.1603244113 [DOI] [PMC free article] [PubMed] [Google Scholar]
- 41.Dierge E, Debock E, Guilbaud C, Corbet C, Mignolet E, Mignard L, Bastien E, Dessy C, Larondelle Y, Feron O. Peroxidation of n-3 and n-6 polyunsaturated fatty acids in the acidic tumor environment leads to ferroptosis-mediated anticancer effects. Cell Metab. 2021;33:1701–1715 e1705. doi: 10.1016/j.cmet.2021.05.016 [DOI] [PubMed] [Google Scholar]
- 42.Altman BJ, Stine ZE, Dang CV. From Krebs to clinic: glutamine metabolism to cancer therapy. Nat Rev Cancer. 2016;16:619–634. doi: 10.1038/nrc.2016.71 [DOI] [PMC free article] [PubMed] [Google Scholar]
- 43.Yoo HC, Yu YC, Sung Y, Han JM. Glutamine reliance in cell metabolism. Exp Mol Med. 2020;52:1496–1516. doi: 10.1038/s12276-020-00504-8 [DOI] [PMC free article] [PubMed] [Google Scholar]
- 44.Lin X, Boutros PC. Optimization and expansion of non-negative matrix factorization. BMC Bioinformatics. 2020;21:7. doi: 10.1186/s12859-019-3312-5 [DOI] [PMC free article] [PubMed] [Google Scholar]
- 45.Lerario AM, Nanba K, Blinder AR, Suematsu S, Omura M, Nishikawa T, Giordano TJ, Rainey WE, Else T. Genetics of aldosterone-producing adenomas with pathogenic KCNJ5 variants. Endocr Relat Cancer. 2019;26:463–470. doi: 10.1530/ERC-18-0364 [DOI] [PMC free article] [PubMed] [Google Scholar]
- 46.Gennari-Moser C, Khankin EV, Escher G, Burkhard F, Frey BM, Karumanchi SA, Frey FJ, Mohaupt MG. Vascular endothelial growth factor-A and aldosterone: relevance to normal pregnancy and preeclampsia. Hypertension. 2013;61:1111–1117. doi: 10.1161/HYPERTENSIONAHA.111.00575 [DOI] [PubMed] [Google Scholar]
- 47.Cherian-Shaw M, Das R, Vandevoort CA, Chaffin CL. Regulation of steroidogenesis by p53 in macaque granulosa cells and H295R human adrenocortical cells. Endocrinology. 2004;145:5734–5744. doi: 10.1210/en.2004-0253 [DOI] [PubMed] [Google Scholar]
- 48.Yanes LL, Romero DG. Dihydrotestosterone stimulates aldosterone secretion by H295R human adrenocortical cells. Mol Cell Endocrinol. 2009;303:50–56. doi: 10.1016/j.mce.2008.12.020 [DOI] [PMC free article] [PubMed] [Google Scholar]
- 49.Monticone S, Castellano I, Versace K, Lucatello B, Veglio F, Gomez-Sanchez CE, Williams TA, Mulatero P. Immunohistochemical, genetic and clinical characterization of sporadic aldosterone-producing adenomas. Mol Cell Endocrinol. 2015;411:146–154. doi: 10.1016/j.mce.2015.04.022 [DOI] [PMC free article] [PubMed] [Google Scholar]
- 50.Tsai PY, Lee MS, Jadhav U, Naqvi I, Madha S, Adler A, Mistry M, Naumenko S, Lewis CA, Hitchcock DS, et al. Adaptation of pancreatic cancer cells to nutrient deprivation is reversible and requires glutamine synthetase stabilization by mTORC1. Proc Natl Acad Sci U S A. 2021;118. doi: 10.1073/pnas.2003014118 [DOI] [PMC free article] [PubMed] [Google Scholar]
- 51.Saxton RA, Sabatini DM. mTOR Signaling in Growth, Metabolism, and Disease. Cell. 2017;168:960–976. doi: 10.1016/j.cell.2017.02.004 [DOI] [PMC free article] [PubMed] [Google Scholar]
- 52.Das UN. Saturated Fatty Acids, MUFAs and PUFAs Regulate Ferroptosis. Cell Chem Biol. 2019;26:309–311. doi: 10.1016/j.chembiol.2019.03.001 [DOI] [PubMed] [Google Scholar]
- 53.Liu J, Xu M, Zhao Y, Ao C, Wu Y, Chen Z, Wang B, Bai X, Li M, Hu W. n-3 polyunsaturated fatty acids abrogate mTORC1/2 signaling and inhibit adrenocortical carcinoma growth in vitro and in vivo. Oncol Rep. 2016;35:3514–3522. doi: 10.3892/or.2016.4720 [DOI] [PubMed] [Google Scholar]
- 54.Kuehne A, Emmert H, Soehle J, Winnefeld M, Fischer F, Wenck H, Gallinat S, Terstegen L, Lucius R, Hildebrand J, et al. Acute Activation of Oxidative Pentose Phosphate Pathway as First-Line Response to Oxidative Stress in Human Skin Cells. Mol Cell. 2015;59:359–371. doi: 10.1016/j.molcel.2015.06.017 [DOI] [PubMed] [Google Scholar]
- 55.Bansal A, Simon MC. Glutathione metabolism in cancer progression and treatment resistance. J Cell Biol. 2018;217:2291–2298. doi: 10.1083/jcb.201804161 [DOI] [PMC free article] [PubMed] [Google Scholar]
- 56.Patra KC, Hay N. The pentose phosphate pathway and cancer. Trends Biochem Sci. 2014;39:347–354. doi: 10.1016/j.tibs.2014.06.005 [DOI] [PMC free article] [PubMed] [Google Scholar]
Associated Data
This section collects any data citations, data availability statements, or supplementary materials included in this article.


