

Abstract
During freeze/thaw, cells are exposed to mechanical, thermal, chemical, and osmotic stresses, which cause loss of viability and function. Cryopreservation agents such as Dimethyl Sulfoxide (DMSO) are deployed to minimize freeze/thaw damage. However, there is a pressing need to eliminate DMSO from cryopreservation solutions due to its adverse effects. This is of the highest priority especially for cryopreservation of infusible/transplantable cell therapy products. In order to address this issue, we introduce reversible encapsulation in agarose hydrogels in the presence of the membrane-impermeable cryoprotectant, trehalose, as a viable, safe, and effective cryopreservation method. Our findings, which are supported by IR spectroscopy and differential scanning calorimetry analyses, demonstrate that encapsulation in 0.75% agarose hydrogels containing 10–20% trehalose inhibits mechanical damage induced by eutectic phase change, devitrification, and re-crystallization, resulting in post-thaw viability comparable to the gold standard 10% DMSO.
Keywords: Cryopreservation, encapsulation, trehalose, DMSO, recrystallization, eutectic melting, devitrification
Graphical Abstract

Introduction
During freeze/thaw, cells are exposed to mechanical, thermal, chemical, and osmotic stresses that may cause loss of viability and function.1, 2 Specifically during cooling, nucleation and growth of ice intra/extra-cellularly physically damages the cellular structures such as the cytoskeleton, the organelles, and the plasma membrane.3, 4 Extracellular ice formation also dehydrates cells, inducing osmotic and chemical stresses.1, 5 At lower cryogenic temperatures, pH changes due to selective precipitation of the buffer electrolytes,6 and eutectic formation7 induce further chemical, and mechanical stresses on the cell.8 During warming, primary sources of cryoinjury are devitrification (ice crystallization in the amorphous phase following glass melting), eutectic melting, and ice recrystallization (formation of larger ice crystals through fusion of smaller ones).9–12 With the goal of eliminating/minimizing these stresses, chemicals such as polyols, disaccharides, sugar alcohols, and polar solvents are routinely added to the cells to be cryopreserved.13 These chemicals (and their mixtures known as “cryopreservation cocktails”)14 act by changing the freeze/thaw kinetics and the thermodynamic behaviors of the solutions in which the cells are suspended.
Most widely used cryopreservation cocktails include mixtures of fetal calf/bovine (FCS/FBS) serum, weak buffers, and membrane permeable cryoprotectant agents such as dimethyl sulfoxide (DMSO),15 glycerol,16 and ethylene glycol.17 However, there is a pressing need for eliminating DMSO from cryopreservation protocols, especially when it is used for stabilization of cellular therapy products. DMSO is known to adversely affect the post-thaw cytotoxic functions of natural killer (NK) cells and T-cells to18–21 while introducing significant workflow/use challenges in the clinic.15, 22, 23 Many studies therefore focused on reducing the amount of DMSO needed in the cryoprotectant formulations18, 24–29 using additives such as albumin,18, 27, 30 FCS/FBS,25, 26 and growth media.29 However, there is an ongoing debate on the safety and ethicality31, 32 of using FCS/FBS as they are not clinical reagents that can be safely used in injectable/infusible cell therapy products.
Encapsulation of cells in hydrogels for cryopreservation has been shown to be beneficial in decreasing the need for using high concentrations of membrane permeable cryopreservation agents, relaxing fast cooling requirements.15, 33–35 For a very detailed analysis of the studies conducted with DMSO and other membrane permeable cryoprotectants used to cryopreserve encapsulated cells, please see the reviews by Gurruchaga et al.15 and Zhang et al.17 As detailed in the Gurruchaga review, none of the studies to date have been successful in eliminating the need for membrane permeable cryopreservation agents such as DMSO, ethylene glycol or 1,2-propanediol and still depended heavily on the use of FCS/FBS. Furthermore, some of these methods require direct liquid nitrogen immersion of the encapsulated cells loaded in microcapillaries are therefore not scalable and pose a very high risk of contamination. Therefore, cryopreservation of cellular therapy products is an ongoing challenge.36–38
In this manuscript, we present an encapsulation-based cryopreservation method capable of preserving mammalian cells without using membrane-permeable cryopreservation agents (e.g., DMSO) or FCS/FBS at slow cooling rates (2°C/min) and without controlling ice nucleation. We have chosen agarose as the encapsulating gel because of its cytocompatibility, ease of use, and reversibility (by agarase digestion) and extracellular trehalose to cryopreserve a model cell line (MDA-MB-231). Trehalose is a widely used kosmotrope cryoprotectant,39 which disrupts water-water hydrogen bonding, and therefore inhibits ice formation while increasing the glass transition temperature of the freeze-concentrated liquid.40, 41 Furthermore, trehalose is biocompatible and nontoxic to cells, and thus approved as an injectable inactive ingredient by the FDA.40, 42 All of these characteristics, make this method suitable for cryopreservation of cellular therapy products.
Furthermore, using Differential Scanning Calorimetry (DSC) and Fourier Transform Infrared (FTIR) microspectroscopy analyses, we show that the mechanisms of cryoprotection offered by agarose encapsulation in the presence of trehalose are: 1) Decreasing the amount of free water within the sample, 2) increasing the volume of the freeze-vitrified solution, 3) creating smaller ice crystals of uniform size distribution, and 4) inhibition of devitrification, ice recrystallization, and eutectic phase transition damages. Therefore, the model cells encapsulated in the agarose hydrogel with trehalose are well protected from mechanical damage during the freeze/thaw process,43 as reflected by high cellular viability and proliferation post-thaw.
Materials and Methods
Cell culture
MDA-MB-231 cells were obtained from ATCC (ATCC, Manassas, VA) at passage number 38. Cells were grown in Dulbecco’s Modified Eagle Medium (Gibco, Waltham, MA) supplemented with 10% FBS (Gibco, Waltham, MA), and 1% penicillin/streptomycin (Fischer Scientific, Hampton, NH). Cells were passaged at 80 – 90% confluence. To resuspend the MDA-MB-231 cells, the cells attached to the culture dish were washed with isotonic phosphate-buffered saline solution (1xPBS) and then treated with 0.05% trypsin-EDTA (Gibco, Waltham, MA) at 37°C and 5% CO2. After 5 minutes of incubation, the cell culture medium was added to stop trypsinization, and the cell suspension was pelleted by centrifugation at 250 × g for 2 minutes.
Hydrogel encapsulation
To prepare agarose hydrogels, 0.25, 0.5, 0.75, 1.5, 2.5, or 4% (w/w) of agarose powder (low-gelling temperature agarose, Sigma-Aldrich, Saint Louis, MO) was added to 1xPBS. To prepare agarose-trehalose hydrogels, 10 or 20% trehalose (w/w) (Sigma-Aldrich, Saint Louis, MO) was also added to the solution. The solution was incubated in a water bath (>65°C) to accelerate dissolution and mixing. After the solution was completely transparent, the agarose solution was transferred to and kept in a 37°C water bath until use. To encapsulate the cells in an agarose-trehalose hydrogel, the cell pellet was first suspended and incubated in a cell culture medium containing 10% trehalose and then in 20% trehalose for 15 minutes. This was done to minimize the hyperosmotic stress experienced by the cells during encapsulation. To encapsulate the cells in an agarose hydrogel, the cell pellet was resuspended in 1xPBS agarose solution containing trehalose at 37°C to achieve a cell concentration of 107 cells/ml. The solution was gently and thoroughly mixed in a microtube and then stored at 4°C to induce gelation. After a few minutes, the gels hardened and uniformly encapsulated the cells.
Freeze/thaw protocol and post-thaw viability measurements
In control experiments, the cell pellets were suspended in 10% DMSO in 1xPBS (v/v), 10%, and 20% trehalose (w/w) prepared in 1xPBS or directly in 1xPBS solution. Agarose and agarose-trehalose solutions were prepared, and cell encapsulation was conducted following the protocols described above. Note that the sample of 0.25% agarose + 20% trehalose remained liquid but, did not form a gel.
In freeze/thaw experiments conducted in the cryostage, a small amount of the sample (2–4 μL solution or hydrogel containing the encapsulated cells) was sandwiched between two CaF2 windows and loaded into the cryostage (FDCS 196, Linkam, Tadworth, UK). The sample was then cooled down from 10°C to −150°C at a rate of 2°C/min. Note that since DMSO is toxic to cells at room temperature, the experiment was started at 10°C. Extracellular ice nucleation was not controlled during the cooling process. Ice nucleation generally occurred in the range of −15 to −25°C. Once the temperature reached −150°C, the sample was rapidly rewarmed to room temperature at a warming rate of 100°C/min. Note that the rapid warming protocol was only applied in the freeze/thaw experiments used for viability measurements as a high warming rate is necessary to maximize viability. For the experiments used to identify kinetic and thermodynamic transitions, both the cooling and the warming rates were fixed at 2°C/min. Post-thaw viability of the encapsulated cells was measured using 20 μg/mL acridine orange (AO)/propidium iodide (PI) fluorescent dye (Nexcelom, Lawrence, USA). The live (green) and dead (red) cells in the sample were counted in five representative areas for each sample using a Nikon Eclipse TE200 inverted fluorescence microscope (Melville, NY, USA). The final percent viability of the cells was calculated with respect to the freshly harvested MDA-MB-231 cells.
Cell extraction/recovery from hydrogel
To extract encapsulated cells from agarose hydrogel, a solution of cell culture media containing 100 U/ml β-Agarase I (New England Biolabs, Ipswich, MA) was added and mixed with an equal volume of the hydrogel. Agarase is a glycoside hydrolase enzyme that can cleave agarose into oligosaccharides.44 The mixture was homogenized for a few seconds to break down the hydrogel matrix into smaller pieces. After gently and thoroughly mixing the hydrogel with agarase solution, the sample was incubated on a temperature-controlled shaker (~39°C) at 300 rpm for 1 hour. Viability of the cells after extraction was also measured using the AO/PI dye using the method outlined above.
Cell proliferation assay
Frozen/thawed and extracted cells were centrifuged and suspended in cell culture media at a cell concentration of 104 cells/ml. Cell suspensions from each experimental group were added to a 96-well plate at a concentration of 3000 cells per well. In parallel, freshly harvested MDA-MB-231 cells were seeded as the positive control group. For background subtraction and instrument gain modification, some wells were left empty or only contained cell culture media. The 96-well plate was incubated at 37°C for up to 3 days. On day 0, 1, 3, or 10 μL WST-8 solution (Abcam) was added to each well that contained the control or experimental groups. After 4 hours of incubation at 37°C at an atmosphere of 5% CO2 and 95% humidity, absorbance at 460 nm were measured using a microplate reader (INFINITE 200 PRO, Tecan, Zurich, Switzerland). Cells were normalized with control sample, wells containing growth medium. Absorbances recorded for each experimental conditions were also normalized to their respective day 0 absorbances to calculate the proliferation rate.
Differential Scanning Calorimetry (DSC) analysis
A differential scanning calorimeter (Q2000, TA Instruments, New Castle, DE) equipped with a refrigerated cooling accessory was used to analyze the experimental and control samples during freeze/thaw. To prepare DSC samples, 2–10 mg solution or hydrogel was weighed in a Tzero hermetic pan (TA Instruments, New Castle, DE) and sealed with a lid. Each sample was initially cooled from room temperature to −150°C at 2°C/min, then heated back to 10°C at 2°C/min. Dry nitrogen was used to purge the sample chamber continuously at a flowrate of 50 ml/min. The DSC scans were analyzed using the TA Universal Analysis software (V4.5A, TA Instruments, New Castle, DE)
Fourier Transform Infrared Spectroscopy (FTIR) analysis
Fourier transform infrared spectroscopy was also used to monitor the thermodynamic and kinetic changes of the sample during freeze/thaw. 0.1–1 μL of experimental and control samples spiked with 5% D2O (99.8% purity, Sigma-Aldrich, St. Louis, MO) were sandwiched between two CaF2 windows and sealed with vacuum grease to avoid evaporation. The assembly was then transferred to the cryostage attached to an infrared microscope, which was connected to an FTIR spectrometer (Thermo-Nicolet Continuum, Thermo Electron, Waltham, MA) equipped with a mercury cadmium telluride detector (Thermo Electron, Waltham, MA). The sample was first cooled from 10°C to −150°C at a rate of 2°C/min, then warmed back to 10°C at 2°C/min, following the identical freeze/thaw protocol used in the DSC analysis. Infrared (IR) spectra were collected from a sample area of 100 μm × 100 μm every 2°C, and 64 IR scans at a resolution of 4 cm−1 were averaged in 9000 to 900 cm−1 wavenumber range to obtain each spectrum. The IR spectra were analyzed using the OMNIC software (Thermo-Nicolet, Madison, WI,). Changes in the ν-(OD) band (2500 cm−1),45 δ-(OH) band (1650 cm−1),46 and the glycosidic band (995 cm−1)47, 48 were examined as the sample was cooled and heated. Note that since the ν-(OH) band is saturated due to the high-water content in the samples, 5% D2O was added to all samples. Therefore, the ν-(OD) band could be analyzed to study transitions of water.
Statistical analysis
All of the experiments (and control measurements) were repeated 3 times. Results are presented as mean ± standard deviation. Two-tailed Student’s t-test was used to determine the statistical significance. The difference in results was considered to be statistically significant if p < 0.05. In plots, * indicates p < 0.05, ** indicates p < 0.01, and *** indicates p < 0.001.
Results and Discussion
Thermodynamic and kinetic transitions of agarose hydrogel with trehalose during freeze/thaw:
We first utilized Differential Scanning Calorimetry (DSC) analyses to detect the effects of agarose encapsulation on the kinetic and thermodynamic transitions of the trehalose solution and determined that while not contributing to the vitrification kinetics of the solution, encapsulation had significant effects on ice kinetics during cooling and warming.
As a control, frozen ultrapure water was warmed at a heating rate of 2°C/min from −150°C to 10°C, and a single endothermic peak was observed in the DSC scan at 0°C (Tm) caused by the release of heat of fusion (data not shown). Note that the area under this endotherm is proportional to the amount of ice formed during cooling, and is therefore used to calculate the enthalpy of heat of fusion, ΔH of water.49 When a similar warming experiment was conducted with frozen 1xPBS, a much smaller lower temperature peak corresponding to eutectic melting (Te ~ −22°C) also became apparent (Figure 1A). Analysis of the eutectic melting peak (Figure 1A insert) revealed a small shoulder starting around −25°C, a very sharp peak around −22°C, and a broad shoulder persisting up to higher temperatures (up to around −17°C). This relatively complex behavior is due to melting of the NaCl•2H2O-ice phase.50, 51 The smaller amounts of KCl, Na2HPO4, and KH2PO4 also contribute to the complexity of this peak, but their contributions are considered negligible when compared to NaCl.
Figure 1.

DSC warming scans of (A) 1xPBS solution, (B) 2.5% agarose in 1xPBS, and (C) 0% (red), 0.75% (blue), 2.5% (green), and 4% agarose (purple) + 20% trehalose (in 1xPBS). (Te: eutectic melting temperature, Tg: glass transition temperature, Tm’: onset of ice melting endotherm, Tm: ice melting temperature.
When encapsulated by an agarose gel, a significant change in the transitions of 1xPBS solution became apparent as the eutectic melting peak gradually disappeared with increasing agarose concentration (see Figure 1B and its insert for eutectic melting of 1xPBS encapsulated in a 2.5% agarose gel). Furthermore, ΔH decreased as the concentration of agarose in the sample increased (Figure 1C), indicating that the amount of ice crystallized during cooling (the “free water” in the sample) decreased with increasing agarose concentration. Addition of 20% w/w (584 mM) trehalose further depressed eutectic melting (Figure 1C) - consistent with previous findings51, 52 - and enabled vitrification of the freeze-concentrated solution during freezing. Glass-amorphous liquid transition could be detected by the lower temperature baseline shift in specific heat capacity (Cp) measured during warming (Figure 1C insert). The midpoint temperature of this shift is assigned as the glass transition temperature (Tg) of the solution.53–55 As the concentration of agarose increased, Tg moved very slightly to lower temperatures (within experimental error) without significant change in ΔCp (Table 1). This observation, coupled to the persistence of the ice exotherms in the presence of trehalose showed that agarose encapsulation did not result in uniform vitrification of the trehalose solution, but vitrification was confined to the initially freeze-concentrated solution.
Table 1.
Glass transition temperature (Tg), change in specific heat capacity during glass transition (ΔCp), onset temperature of ice melting (Tm’), ice melting temperature (Tm), heat of fusion (ΔH), and normalized heat of fusion (ΔHN) for 1xPBS, trehalose and different agarose hydrogels containing 20% trehalose. Values are shown as mean ± standard deviation from mean. Values marked with different superscripts (a, b, c) within a column are statistically significantly different (p < 0.05).
| Sample | Tg (°C) | ΔCp (J/g °C) | Tm’ (°C) | Tm (°C) | ΔH (J/g) | ΔHN (J/g) |
|---|---|---|---|---|---|---|
| 1x PBS | N/A | N/A | N/A | −0.45 ± 0.13 a | 291.5 ± 12.8 a | 291.5 ± 12.8 a |
| 2.5% agarose | N/A | N/A | N/A | −0.81 ± 0.17 b | 284.2 ± 10.7 a | 291.3 ± 11.0 a |
| 4% agarose | N/A | N/A | N/A | −0.62 ± 0.07 b | 286.7 ± 7.4 a | 298.1 ± 7.7 a |
| 20% trehalose | −44.77 ± 0.53 a | 0.0983 ± 0.008 a | −34.01 ± 0.60 a | −2.87 ± 0.07 c | 178.9 ± 2.9 b | 223.6 ± 3.6 b |
| 0.75% agarose + 20% trehalose | −45.09 ± 0.41 a | 0.1088 ± 0.013 a | −33.74 ± 0.71a | −2.80 ± 0.02 c | 170.3 ± 5.2 b, c | 212.9 ± 6.6 b |
| 2.5% agarose + 20% trehalose | −45.48 ± 0.76 a· b | 0.1097 ± 0.014 a | −33.93 ± 0.65 a | −2.89 ± 0.14 c | 163.4 ± 7.1 c | 208.4 ± 9.1 b |
| 4% agarose + 20% trehalose | −46.89 ± 1.03 b | 0.0931 ± 0.025 a | −34.89 ± 0.98 a | −2.64 ± 0.22 c | 157.7 ± 12.3 c | 203.5 ± 15.9 b |
In the DSC scabs, the small shoulder observed at higher temperatures (denoted as Tm’) is due to the onset of melting of the impure ice crystals that contain solutes trapped within during nonequilibrium freezing,54, 56 and potentially due to some devitrification (i.e., ice formation in the amorphous liquid above the glass transition temperature). This shoulder disappeared at high agarose concentrations (Figure 1C insert), suggesting that less trehalose was trapped within the ice during freezing, resulting in the formation of more homogenous (and pure) ice and freeze-concentrated liquid phases and/or the ice crystal sizes have decreased in size in high agarose content gels. The latter explanation is more logical as the agarose pore size decreases with increasing agarose concentration.
The ΔH values of samples containing trehalose and agarose were much lower than that of the 1xPBS solution, which could be attributed to either the inhibition of ice formation by these compounds or a decrease in water content within the sample. To eliminate the influence of lower water content on ΔH with the increase in concentrations of agarose and trehalose, we calculated the water weight percentage in each sample and normalized ΔH by this value, calculating ΔHN (as presented in Table 1). The normalized parameter, ΔHN, is a more direct indication of the efficacy of agarose and/or trehalose suppressing ice formation. No significant difference in ΔHN was found between 1xPBS and 4% agarose solutions, suggesting that similar amounts of ice have formed during freezing (i.e., that agarose binding of water was insignificant).
On the other hand, ΔHN of 20% trehalose was significantly lower than that of 1xPBS, indicating that trehalose greatly inhibited ice formation during freezing (i.e., vitrified water content of the sample was higher). In addition, ΔHN slightly decreased with increasing agarose concentration from 0 to 4% in trehalose solution but this was not quite statistically significant (p < 0.1). Although ΔH decreased with increasing agarose concentration, the insensitivity of ΔHN to increasing agarose concentration (tested up to 4%) shows that the agarose gel did not facilitate trehalose vitrification. This observation is in opposition to the previous reports advocating that encapsulation enables vitrification.35, 57 However, those studies were based on indirect observations made by transmitted light cryomicroscopy experiments, and therefore are subjective. Note that agarose gels in the 1–4% w/v range form pores in the range of 40 to 300 nm58, 59 (for example, see Figure S1), which is not sufficient to promote confinement induced vitrification.
To complement our observations made by the DSC analyses, further experiments were conducted using Fourier Transform Infrared Spectroscopy (FTIR). These experiments provided in-depth molecular level detail on the behaviors of the individual components of the solutions tested in response to temperature changes and further verified our conclusions.
Representative IR spectra collected from 2.5% agarose, 0, 0.75, 2.5, 4% agarose + 20% trehalose solutions and gels at 10°C are shown in Figure 2. Since the ν-(OH) band (3500 cm−1)60, 61 was saturated because of the high water content of the samples, 5% D2O was added to each solution, and the ν-(OD) (2500 cm−1) band45 was used to study the phase change behavior of water during the freeze/thaw event. During cooling, ν-(OD) gradually shifts to lower wavenumbers (Figure S2), indicating that more hydrogen bonds (HBs) form between water molecules.61, 62 Upon freezing, an abrupt drop in wavenumber and a significant increase in peak intensity (inset “a” in Figure 2) were observed due to the formation of fully tetrahedrally hydrogen-bonded water molecules (ice). On the other hand, the ν-(OD) band shifted to higher wavenumbers during the warming process, and a sudden spike was seen when the sample melted.
Figure 2.
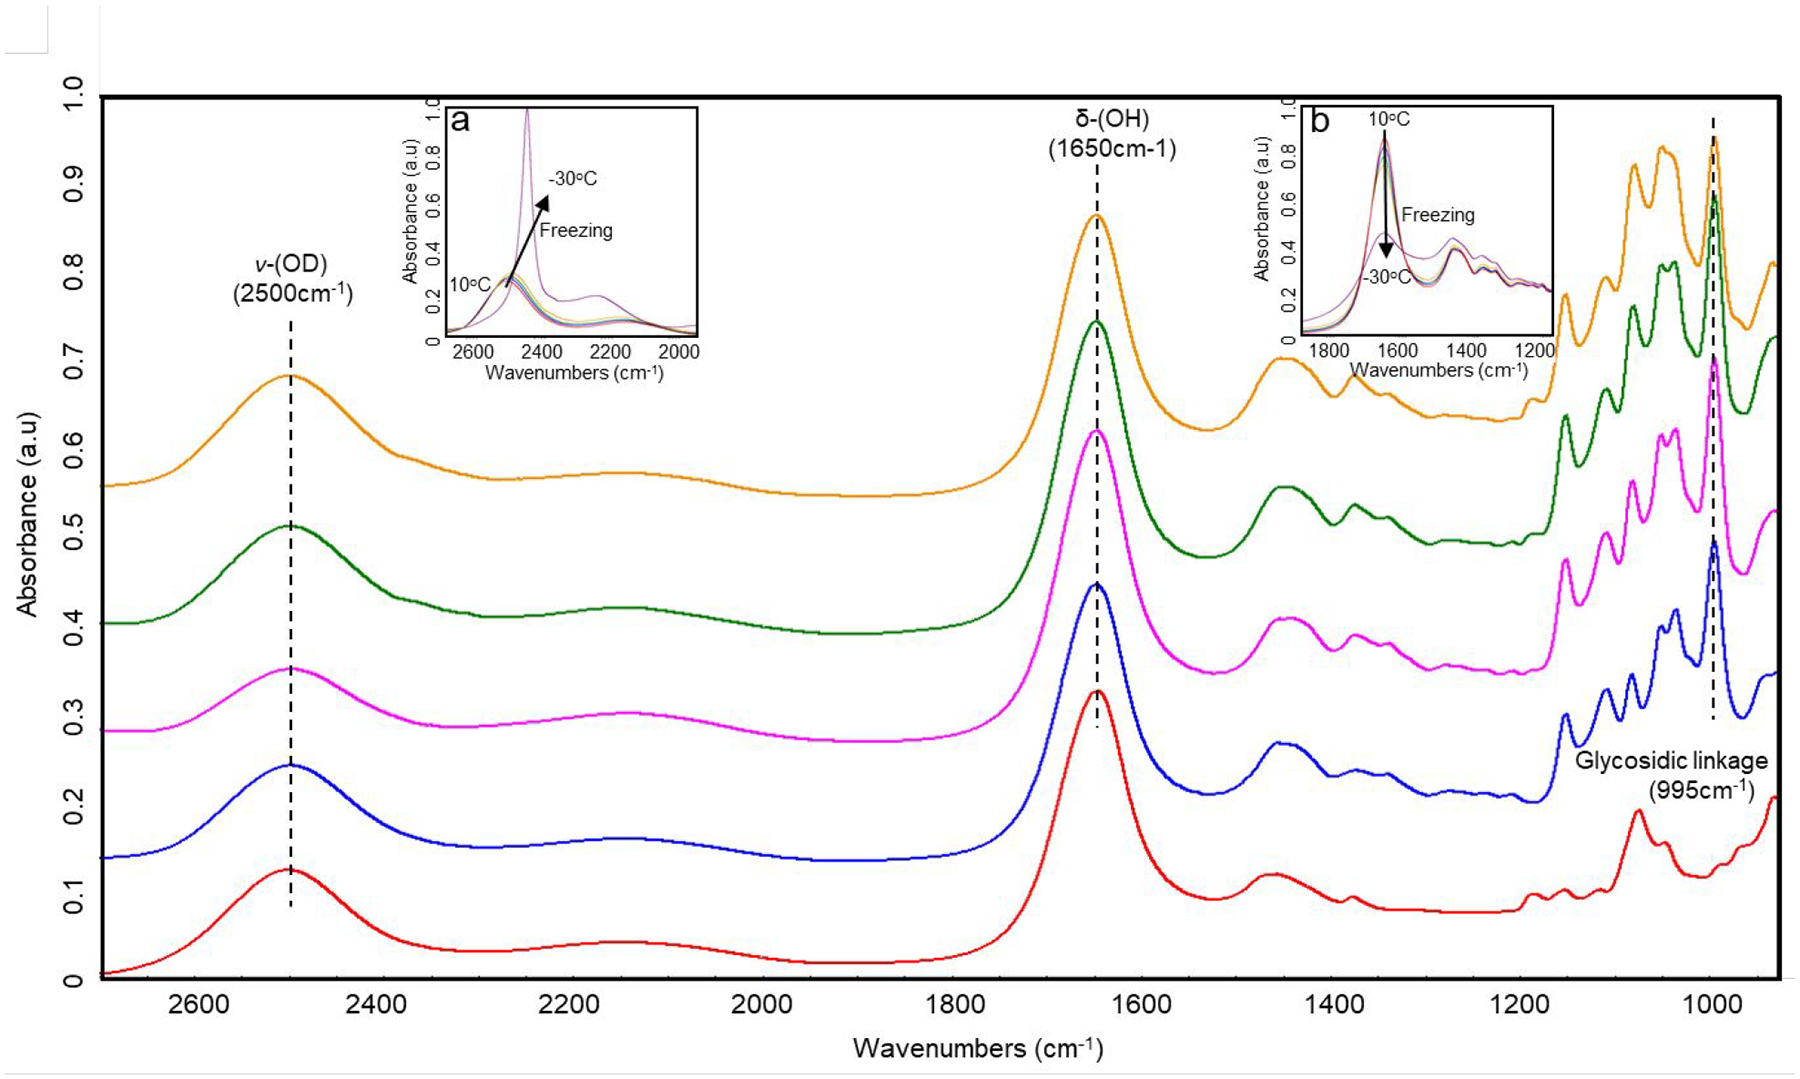
Representative IR spectra of 2.5% agarose (red), 20% trehalose (blue), 0.75% agarose with 20% trehalose (purple), 2.5% agarose with 20% trehalose (green), and 4% agarose with 20% trehalose (orange) at 10°C. All samples included 5% D2O.
To further investigate the water structure change with temperature in the agarose hydrogel containing trehalose, δ-(OH) band (1650 cm−1) was also analyzed. Different from the water stretching band (which is strongly affected by the hydrogen bonding between water and carbohydrates),46, 63, 64 δ-(OH) band mainly originates from the water population that is not fully hydrogen bonded.46, 65 Therefore, this peak is hardly affected by HB between water and trehalose.46 Due to more tetrahedral HBs forming during the cooling process, peak intensity of δ-(OH) reduced with decreasing temperature, and a sudden drop was observed upon freezing (inset “b” in Figure 2). When the samples reached −150°C (Figure 3A), 2.5% agarose hydrogel showed a very weak δ-(OH) band, suggesting that the amount of unfrozen (i.e., vitrified) water in the sample was small, and almost all the water molecules were tetrahedrally hydrogen-bonded. On the other hand, the 20% trehalose solution showed a stronger δ-(OH) band, indicating that the amount of vitrified water in the sample was higher than that in the 2.5% agarose hydrogel. This is expected as trehalose is a strong glass-former.40, 46, 66 In addition, the peak intensity of the δ-(OH) band was further increased when the concentration of agarose in the 20% trehalose solution was increased, indicating that the vitrified volume in the combination system was even higher than trehalose or agarose alone. This supported the DSC measurements and trends shown in Table 1. A similar trend was observed in δ-(OH) peak location during the cooling process (Figure 3B). Upon cooling of the 2.5% agarose hydrogel, an abrupt decrease in δ-(OH) peak location was observed upon freezing. The peak location continued to shift to lower wavenumbers with decreasing temperature. The redshift of the δ-(OH) band with decreasing temperature after freezing indicated that the structure of ice got more ordered (transitioning from noncrystalline to polycrystalline),67 due to an increase in HB networking among the water molecules. On the other hand, in the presence of trehalose δ-(OH) peak location showed a smaller drop upon freezing, and the temperature-induced redshift of δ-(OH) was greatly inhibited after freezing. This indicated that water molecules in the combination system (agarose + trehalose) undergo very little structural change, especially in the 4% agarose + 20% trehalose gel, during ice nucleation and subsequent cooling. These results are consistent with our findings in DSC analysis that the amount of ice formed in the combination system is less than that in trehalose or agarose alone, indicating that more water was vitrified in the combination system during cooling. Furthermore, spatially resolved IR data revealed that the structure of the frozen solution is more spatially homogeneous and stable against temperature decrease (data not shown).
Figure 3.

(A) IR spectra of 2.5% agarose (red), 20% trehalose (blue), 0.75% agarose + 20% trehalose (purple), 2.5% agarose + 20% trehalose (green), and 4% agarose + 20% trehalose (orange) at −150°C. (B) Peak shift of ν-(OD) band of these four samples during the cooling process. Samples were cooled at 2°C/min from 10 °C to −150 °C. All samples included 5% D2O.
To investigate the water-trehalose and trehalose-trehalose HB interactions during the freeze/thaw event, temperature-induced shift of the trehalose glycosidic linkage (connecting the two glucose pyranose rings in trehalose)48 peak located at 995 cm−1 was analyzed (Figure 4). Both peaks at 1150 cm−1 and 995 cm−1 originate from the ν-(CO) vibration of the glycosidic linkage47, 48 however, only the 995 cm−1 peak was studied since the interference from agarose at this frequency is negligible. Peak shift magnitude of the glycosidic linkage is a measure of the flexibility of the carbohydrate:46, 68, 69 At higher concentrations, more inter/intramolecular carbohydrate-carbohydrate HBs form, which causes the folding of the carbohydrate around its glycosidic linkage.46 As a result, flexibility of the carbohydrate molecule decreases and the glycosidic band shifts to lower wavenumbers.
Figure 4.

Peak shift of the glycosidic band (~995 cm−1) during cooling (blue) and warming (red) processes of; (A) 20% trehalose, (B) 0.75% agarose + 20% trehalose (C) 2.5% agarose + 20% trehalose, (D) 4% agarose + 20% trehalose solutions. Samples were cooled from 10 °C to −150 °C and then warmed back to 10 °C at 2 °C/min.
During cooling, the glycosidic band (995 cm−1) gradually shifted to higher wavenumbers, experiencing an abrupt drop around −30°C, which corresponded to the freezing of the sample. The blueshift of glycosidic linkage peak location with decreasing temperature is due to the increase in hydration level for trehalose.46, 68 More water-trehalose HBs form at lower temperatures, decreasing the amount of trehalose-trehalose intermolecular HBs (note that trehalose does not form intramolecular HBs),47, 70 also increasing the flexibility of trehalose around the glycosidic linkage.46 On the other hand, the abrupt redshift during freezing was because of the formation of the freeze-concentrated liquid (FCL). Compared to the supercooled liquid, FCL has a much higher trehalose concentration (therefore, more trehalose-trehalose HBs are formed) than the supercooled liquid. Therefore, the flexibility of trehalose decreases significantly when ice forms.
During the warming process, three transitions were observed in the IR spectra. The first transition (at the lowest temperature) is located around −45°C (which very gradually decreases with increasing concentration of agarose), corresponding to the glass melting temperature of the FCL in the sample. This is in perfect agreement with the DSC data listed in Table 1. During glass melting, previously vitrified FCL transitions into a supercooled liquid, which increases the mobility of the trehalose molecules. As a result, the glycosidic band shifts to higher wavenumbers. Similarly, a significant increase in peak position was observed after the third transition, corresponding to the melting of the bulk ice. Upon melting, HBs are formed extensively between liquid water and trehalose, which increases the hydration level and the flexibility of trehalose.
On the other hand, the mechanism of the second transition is more difficult to interpret than either transition 1 or 3 (Figure 4). During the second transition, the glycosidic band shifts to lower wavenumbers with increasing temperature. Since the peak shifts very fast (especially for 20% trehalose) during this transition, the redshift cannot simply be explained by a reduction in the hydration level of trehalose with increasing temperature. To further investigate the mechanism of transition 2, two additional experiments were performed:
20% trehalose solution was frozen and thawed following the protocol described in the Materials and Methods section. When the sample reached −20°C (a temperature between transition 2 and transition 3), it was held isothermal for 1 hour and then warmed back to 10°C.
20% trehalose solution was frozen and thawed following the same protocol as above. When the sample was warmed to −20°C, it was re-cooled down to −50°C (below the temperature of transition 1, i.e., Tg). This cooling/warming cycle (between −20°C and −50°C) was repeated twice before the sample was warmed back to 10°C.
The 20% trehalose solution was chosen for these experiments since the peak shift of the glycosidic linkage during transition 2 was much more significant than the samples containing agarose. The plots of wavenumbers versus temperature/time are shown in Figure 5. In the first experiment, the shift in the glycosidic band continued to evolve towards lower wavenumbers when the sample was kept isothermal at −20°C (Figure 5A). The shift rate gradually decreased with time. In the second experiment, the wavenumbers of the glycosidic band decreased with increasing temperature when the sample was warmed from transition 2 to −20°C. Interestingly, when the cooling step (from −20°C to −50°C) was applied, this peak didn’t shift back to higher wavenumbers. Instead, its wavenumbers further dropped until the temperature of the sample reached transition 1 (Tg). As a result, a significant drop in wavenumbers was observed between successive cycles in the range of −50°C to −20°C (Figure 5B). These findings suggest that transition 2 is a nonequilibrium process that takes place in the temperature range between Tg and Tm. According to previous studies, both ice recrystallization,9, 69 and trehalose crystallization69, 71, 72 may occur in this temperature range (both processes decrease the flexibility of trehalose significantly). However, trehalose crystallization in a frozen solution is a rather slow process, which may take tens of hours (with seeding) to a couple of days (without seeding) during annealing.71, 72 Since the hold time we applied (1 hour) was much shorter, we attributed transition 2 to ice recrystallization, where the rapid growth of ice crystals in the FCL decreased the hydration level and the flexibility of trehalose. To determine the magnitude of ice recrystallization (ΔR), the peak shift between the second transition (onset of ice recrystallization) and the third transition (melting of bulk ice) for each sample was measured. By increasing the concentration of agarose in the sample, ΔR decreased from 0.7 cm−1 (20% trehalose) to 0.1 cm−1 (4% agarose + 20% trehalose). The significant decrease of ΔR indicates that the ice recrystallization was greatly inhibited by agarose in the combination system.
Figure 5.

Peak shift of the glycosidic band (995cm−1) of 20% trehalose solution during the cooling (blue) and warming (red) processes. (A) A one-hour isothermal wait step was applied at −20°C during the warming process (inset). (B) Two cooling/warming cycles (between −50°C and −20°C) were applied during the warming process.
Post-thaw viability and proliferation of MDA-MB-231 cells frozen/thawed in the agarose hydrogel with extracellular trehalose
Post-thaw viability of MDA-MB-231 cells measured by AO/PI staining is shown in Figure 6. Poor survival was observed when the encapsulated cells (in 0.75% agarose) were frozen and thawed in the absence of any trehalose. Also, when the unencapsulated cells were frozen in 1xPBS solution containing extracellular trehalose, post-thaw viability was lower than 40%. It is known that trehalose needs to be present intracellularly to offer any cryoprotection. Therefore, it was not surprising that that extracellular trehalose or agarose alone do not protect cells effectively at cryogenic temperatures. Viability of the cells increased significantly (to 69.8 ± 5.6%) when they were encapsulated and frozen/thawed after encapsulation in 0.75% agarose hydrogel in the presence of 10% trehalose. The viability could be further improved (to 78.7 ± 3.4%) when the concentration of trehalose was increased from 10% to 20% but further increase in agarose concentration (up to 4%) did not increase viability further. The post-thaw survival of cells encapsulated in 0.75% agarose hydrogel with trehalose was comparable to the positive control group, where cells were frozen in 10% DMSO (70.9 ± 3.6%). Viability of encapsulated cells were also compared after extraction of the agarose gel post-thaw. Viability of the extracted cells varied between 69–76% depending on the initial seeding density in the gel (Table S1). The relatively low extraction efficiency (74.3% at lower seeding density) indicated that further optimization of the gel extraction process is warranted.
Figure 6.

Post-thaw viability of MDA-MB-231 cells cooled at 2°C/min to −150°C, and warmed at 100°C/min to 10°C (* indicates p<0.05, ** indicates p<0.01, and *** indicates p < 0.001)
Lastly, cell proliferation post-thaw was measured for fresh and cryopreserved cells using WST-8/CCK-8 assay (Figure 7). Absorbance values recorded with growth medium were subtracted from the experimental conditions containing cells. A standard curve was used to calculate the number of cells in each sample for each day of experiment. Proliferation rate was calculated by taking the ratio of number of cells each day to the respective day 0 cell number. Fresh and cells frozen using 10% DMSO proliferated at similar rates. Proliferation rates for encapsulated and extracted cells were lower (almost by half as measured on day 7). One possible explanation for this is the incomplete extraction of cells from agarose gels. This is also supported by the low extraction efficiency from the gel (Table S1). We have observed that there are still small residues of agarose left in the samples post-extraction. While these residues may not affect the immediate viability of the cells, they could possibly prevent the cells from attaching to the plate surface. This shows that the extraction process we apply needs to be further optimized.
Figure 7.

MDA-MB-231 proliferation post-thaw. Cell proliferation was measured using WST-8 assay at days 0, 1, 3, 5, and 7. The experimental condition include fresh (not frozen) cells (blue), cells frozen/thawed in 10% DMSO (orange), and agarose encapsulated cells extracted post-freeze/thaw (gray).
Use of DMSO as a cryopreservation agent especially for infusible therapeutic cell preservation presents problems: Even though immediate post-thaw viability of NK cells are generally reported to be quite high (albeit with some cell loss), drastic decrease in cytotoxicity (down to 10–25% of the fresh cells) post-thaw is very common.18–21 Furthermore, in vivo persistence of frozen-thawed NK cells is also reported to be orders of magnitude lower than fresh cells.73 The main reason for cytotoxicity loss are ascribed to the loss of motility,18 and significant changes in NK cell phenotype, specifically decrease in the cytotoxic CD16+ populations.18, 20, 74 To resolve the issues associated with cell number and cytotoxicity loss, therapeutic cells need to be expanded for 3–7 days post-thaw to increase cell numbers, and activated through interleukin stimulation for a minimum of 12–16 hours to recover cytotoxic capability.19, 21 Extra processing required in the clinic, with the need for additional quality control/lot testing requirements increases costs, delays the treatment, and also increases the risk for contamination during expansion of the cells. Another problem with the use of DMSO in cryopreservation formulations is the patient morbidity risk75, 76 requiring the infusion rates to be slowed down and sometimes distributed over multiple sessions. Therefore, elimination of DMSO from cryopreservation protocols is of major importance and therefore was the focus of this manuscript.
Conclusion
The manuscript presents an encapsulation-based cryopreservation method that eliminates the need for DMSO. This is achieved by encapsulating the cells in a cytocompatible agarose hydrogel in the presence of extracellular trehalose, a membrane-impermeable cryoprotective agent. The study demonstrates that the method offers effective cryoprotection through the following mechanisms: First, as proven by the DSC and FTIR analyses, hydrogel encapsulation decreased the amount of free water in the solution, resulting in a smaller ice phase volume (Figure 1, Table 1, and Figure 3A) with a less ordered water structure (Figure 3B), resulting in a higher vitrified volume. Second, devitrification and ice recrystallization during warming were inhibited (Figure 4), potentially due to the hydrogel network mechanically inhibiting formation, progression, and fusion of ice crystals. And finally, damaging eutectic crystallization/melting transitions were inhibited (Figure 1). Therefore, cells encapsulated in the agarose hydrogel in the presence of trehalose are well protected against detrimental mechanical damage observed during freeze/thaw43 as reflected by a very high viability post-thaw (Figure 6). Lower proliferation rate observed in the first few days post-thaw/extraction (Figure 7) on the other hand suggests the need for further optimization of the extraction process post-thaw.
Supplementary Material
Figure S1: SEM image showing the microstructure of the 1.5% agarose gel. Figure S2: Peak shift of the the ν-(OD) band during freeze/thaw. Table S1: Cell viability and extraction efficiency
Acknowledgements
The research conducted here was supported by an NIH grant (CA261734).
References
- (1).Mazur P; Leibo SP; Chu EH A two-factor hypothesis of freezing injury. Evidence from Chinese hamster tissue-culture cells. Exp. Cell Res 1972, 71 (2), 345–355. DOI: 10.1016/0014-4827(72)90303-5. [DOI] [PubMed] [Google Scholar]
- (2).Gao D; Critser JK Mechanisms of cryoinjury in living cells. ILAR J 2000, 41 (4), 187–196. [DOI] [PubMed] [Google Scholar]
- (3).Stott SL; Karlsson JOM Visualization of intracellular ice formation using high-speed video cryomicroscopy. Cryobiology 2009, 58 (1), 84–95. DOI: 10.1016/j.cryobiol.2008.11.003 From NLM. [DOI] [PubMed] [Google Scholar]
- (4).Mazur P Kinetics of water loss from cells at subzero temperatures and the likelihood of intracellular freezing. J. Gen. Physiol 1963, 47, 347–369. [DOI] [PMC free article] [PubMed] [Google Scholar]
- (5).Flowers TJ; Munns R; Colmer TD Sodium chloride toxicity and the cellular basis of salt tolerance in halophytes. Annals of botany 2015, 115 (3), 419–431. [DOI] [PMC free article] [PubMed] [Google Scholar]
- (6).Sundaramurthi P; Shalaev E; Suryanarayanan R “pH Swing” in Frozen Solutions—Consequence of Sequential Crystallization of Buffer Components. The Journal of Physical Chemistry Letters 2009, 1 (1), 265–268. DOI: 10.1021/jz900164q. [DOI] [PubMed] [Google Scholar]
- (7).Drebushchak V; Ogienko A; Yunoshev A Metastable eutectic melting in the NaCl-H2O system. Thermochimica Acta 2017, 647, 94–100. [Google Scholar]
- (8).Bumsoo Han JCB Direct cell injury associated with eutectic crystallization during freezing. Cryobiology 2004, 46 (1), 8–21. [DOI] [PubMed] [Google Scholar]
- (9).Regand A; Goff HD Effect of biopolymers on structure and ice recrystallization in dynamically frozen ice cream model systems. J Dairy Sci 2002, 85 (11), 2722–2732. DOI: 10.3168/jds.S0022-0302(02)74359-2. [DOI] [PubMed] [Google Scholar]
- (10).Martino MN; Zaritzky N Ice recrystallization in a model system and in frozen muscle tissue. Cryobiology 1989, 26 (2), 138–148. [DOI] [PubMed] [Google Scholar]
- (11).Pegg DE Principles of cryopreservation. Methods Mol Biol 2015, 1257, 3–19. DOI: 10.1007/978-1-4939-2193-5_1. [DOI] [PubMed] [Google Scholar]
- (12).Cao E; Chen Y; Cui Z; Foster PR Effect of freezing and thawing rates on denaturation of proteins in aqueous solutions. Biotechnology and bioengineering 2003, 82 (6), 684–690. [DOI] [PubMed] [Google Scholar]
- (13).Fuller BJ; Lane AN; Benson EE Life in the Frozen State; CRC Press, 2004. [Google Scholar]
- (14).Fahy GM; Wowk B; Wu J; Paynter S Improved vitrification solutions based on the predictability of vitrification solution toxicity. Cryobiology 2004, 48 (1), 22–35. DOI: 10.1016/j.cryobiol.2003.11.004. [DOI] [PubMed] [Google Scholar]
- (15).Gurruchaga H; Saenz del Burgo L; Hernandez RM; Orive G; Selden C; Fuller B; Ciriza J; Pedraz JL Advances in the slow freezing cryopreservation of microencapsulated cells. Journal of Controlled Release 2018, 281, 119–138. DOI: 10.1016/j.jconrel.2018.05.016. [DOI] [PubMed] [Google Scholar]
- (16).Fahy GM; MacFarlane DR; Angell CA; Meryman HT Vitrification as an Approach to Cryopreservation. Cryobiology 1984, 21 (4), 407–426. [DOI] [PubMed] [Google Scholar]
- (17).Zhang C; Zhou Y; Zhang L; Wu L; Chen Y; Xie D; Chen W Hydrogel Cryopreservation System: An Effective Method for Cell Storage. Int J Mol Sci 2018, 19 (11). DOI: 10.3390/ijms19113330 From NLM. [DOI] [PMC free article] [PubMed] [Google Scholar]
- (18).Mark C; Czerwinski T; Roessner S; Mainka A; Hörsch F; Heublein L; Winterl A; Sanokowski S; Richter S; Bauer N Cryopreservation impairs cytotoxicity and migration of NK cells in 3-D tissue: Implications for cancer immunotherapy. bioRxiv 2019, 812172. [Google Scholar]
- (19).Mata MM; Mahmood F; Sowell RT; Baum LL Effects of cryopreservation on effector cells for antibody dependent cell-mediated cytotoxicity (ADCC) and natural killer (NK) cell activity in (51)Cr-release and CD107a assays. J. Immunol. Methods 2014, 406, 1–9. DOI: 10.1016/j.jim.2014.01.017 From NLM. [DOI] [PMC free article] [PubMed] [Google Scholar]
- (20).Berg M; Lundqvist A; McCoy P Jr; Samsel L; Fan Y; Tawab A; Childs R Clinical-grade ex vivo-expanded human natural killer cells up-regulate activating receptors and death receptor ligands and have enhanced cytolytic activity against tumor cells. Cytotherapy 2009, 11 (3), 341–355. [DOI] [PMC free article] [PubMed] [Google Scholar]
- (21).Oyer JL; Croom-Perez TJ; Dieffenthaller TA; Robles-Carillo LD; Gitto SB; Altomare DA; Copik AJ Cryopreserved PM21-Particle-Expanded Natural Killer Cells Maintain Cytotoxicity and Effector Functions In Vitro and In Vivo. Frontiers in Immunology 2022, 13, Original Research. DOI: 10.3389/fimmu.2022.861681. [DOI] [PMC free article] [PubMed] [Google Scholar]
- (22).Rowley SD; Feng Z; Yadock D; Holmberg L; Macleod B; Heimfeld S Post-thaw removal of DMSO does not completely abrogate infusional toxicity or the need for pre-infusion histamine blockade. Cytotherapy 1999, 1 (6), 439–446. DOI: 10.1080/0032472031000141303 From NLM. [DOI] [PubMed] [Google Scholar]
- (23).Chen C; Sharma S; Doo H; Reynafarje A; Jallilzeinali B; Shore TB; Schuster MW Washing Stem Cells Cryopreserved in Dimethyl Sulfoxide (DMSO) before Infusion Prevents DMSO-Related Side Effects with Little Loss of CD34 Positive Cells and Prompt Engraftment. Blood 2004, 104 (11), 4998–4998. DOI: 10.1182/blood.V104.11.4998.4998 (acccessed 9/15/2020). [DOI] [Google Scholar]
- (24).Saeko F; Mitoshi A; Michio Y; Toshio S; Kyoko K; Masayuki H; Seishi K; Jones SL Cryopreservation of human lymphocytes for assessment of lymphocyte subsets and natural killer cytotoxicity. J. Immunol. Methods 1986, 90 (2), 265–273. [DOI] [PubMed] [Google Scholar]
- (25).Voshol H; Dullens HF; Den Otter W; Vliegenthart JF Human natural killer cells: a convenient purification procedure and the influence of cryopreservation on cytotoxic activity. J. Immunol. Methods 1993, 165 (1), 21–30. [DOI] [PubMed] [Google Scholar]
- (26).Duske H; Sputtek A; Binder T; Kröger N; Schrepfer S; Eiermann T Assessment of physiologic natural killer cell cytotoxicity in vitro. Hum. Immunol 2011, 72 (11), 1007–1012. [DOI] [PubMed] [Google Scholar]
- (27).Lapteva N; Szmania SM; van Rhee F; Rooney CM Clinical grade purification and expansion of natural killer cells. Critical Reviews™ in Oncogenesis 2014, 19 (1–2). [DOI] [PMC free article] [PubMed] [Google Scholar]
- (28).Domogala A; Madrigal JA; Saudemont A Cryopreservation has no effect on function of natural killer cells differentiated in vitro from umbilical cord blood CD34+ cells. Cytotherapy 2016, 18 (6), 754–759. [DOI] [PubMed] [Google Scholar]
- (29).El Assal R; Abou‐Elkacem L; Tocchio A; Pasley S; Matosevic S; Kaplan DL; Zylberberg C; Demirci U Bioinspired preservation of natural killer cells for cancer immunotherapy. Advanced Science 2019, 6 (6), 1802045. [DOI] [PMC free article] [PubMed] [Google Scholar]
- (30).Min B; Choi H; Her JH; Jung MY; Kim H-J; Jung M.-y.; Lee E-K; Cho SY; Hwang YK; Shin E-C Optimization of large-scale expansion and cryopreservation of human natural killer cells for anti-tumor therapy. Immune network 2018, 18 (4). [DOI] [PMC free article] [PubMed] [Google Scholar]
- (31).Jochems CEA; van der Valk JBF; Stafleu FR; Baumans V The Use of Fetal Bovine Serum: Ethical or Scientific Problem? Alternatives to Laboratory Animals 2002, 30 (2), 219–227. DOI: 10.1177/026119290203000208 (acccessed 2022/10/20). [DOI] [PubMed] [Google Scholar]
- (32).Jochems CE; van der Valk JB; Stafleu FR; Baumans V The use of fetal bovine serum: ethical or scientific problem? Altern Lab Anim 2002, 30 (2), 219–227. DOI: 10.1177/026119290203000208 From NLM. [DOI] [PubMed] [Google Scholar]
- (33).Cagol N; Bonani W; Maniglio D; Migliaresi C; Motta A Effect of Cryopreservation on Cell-Laden Hydrogels: Comparison of Different Cryoprotectants. Tissue Engineering Part C: Methods 2018, 24 (1), 20–31. DOI: 10.1089/ten.tec.2017.0258. [DOI] [PubMed] [Google Scholar]
- (34).Huang H; Choi JK; Rao W; Zhao S; Agarwal P; Zhao G; He X Alginate Hydrogel Microencapsulation Inhibits Devitrification and Enables Large-Volume Low-CPA Cell Vitrification. Advanced Functional Materials 2015, 25 (44), 6839–6850. DOI: 10.1002/adfm.201503047. [DOI] [PMC free article] [PubMed] [Google Scholar]
- (35).Huang H; Choi JK; Rao W; Zhao S; Agarwal P; Zhao G; He X Alginate Hydrogel Microencapsulation Inhibits Devitrification and Enables Large-Volume Low-CPA Cell Vitrification. Adv Funct Mater 2015, 25 (44), 6939–6850. DOI: 10.1002/adfm.201503047 From NLM. [DOI] [PMC free article] [PubMed] [Google Scholar]
- (36).Yang T; Zhang Q; Xie L; Zhang R; Qian R; Tian Y; Chen G; Tian W hDPSC-laden GelMA microspheres fabricated using electrostatic microdroplet method for endodontic regeneration. Materials Science and Engineering: C 2021, 121, 111850. DOI: 10.1016/j.msec.2020.111850. [DOI] [PubMed] [Google Scholar]
- (37).Espona-Noguera A; Ciriza J; Cañibano-Hernández A; Fernandez L; Ochoa I; Saenz del Burgo L; Pedraz JL Tunable injectable alginate-based hydrogel for cell therapy in Type 1 Diabetes Mellitus. International Journal of Biological Macromolecules 2018, 107, 1261–1269. DOI: 10.1016/j.ijbiomac.2017.09.103. [DOI] [PubMed] [Google Scholar]
- (38).Gonzalez-Pujana A; Rementeria A; Blanco FJ; Igartua M; Pedraz JL; Santos-Vizcaino E; Hernandez RM The role of osmolarity adjusting agents in the regulation of encapsulated cell behavior to provide a safer and more predictable delivery of therapeutics. Drug Deliv. 2017, 24 (1), 1654–1666. DOI: 10.1080/10717544.2017.1391894. [DOI] [PMC free article] [PubMed] [Google Scholar]
- (39).Rao A; Gebauer D; Cölfen H Modulating Nucleation by Kosmotropes and Chaotropes: Testing the Waters. Crystals 2017, 7 (10), 302. [Google Scholar]
- (40).Crowe JH; Crowe LM; Chapman D Preservation of membranes in anhydrobiotic organisms: the role of trehalose. Science 1984, 223 (4637), 701–703. DOI: 10.1126/science.223.4637.701 From NLM. [DOI] [PubMed] [Google Scholar]
- (41).Aboagla EM; Terada T Trehalose-enhanced fluidity of the goat sperm membrane and its protection during freezing. Biol Reprod 2003, 69 (4), 1245–1250. DOI: 10.1095/biolreprod.103.017889. [DOI] [PubMed] [Google Scholar]
- (42).Pu LL; Cui X; Fink BF; Cibull ML; Gao D Cryopreservation of adipose tissues: The role of trehalose. Aesthetic surgery journal 2005, 25 (2), 126–131. [DOI] [PubMed] [Google Scholar]
- (43).Wang M; Karlsson JOM; Aksan A FTIR Analysis of Molecular Changes Associated with Warming Injury in Cryopreserved Leukocytes. Langmuir 2019, 35 (23), 7552–7559. DOI: 10.1021/acs.langmuir.8b02982. [DOI] [PMC free article] [PubMed] [Google Scholar]
- (44).Fu XT; Kim SM Agarase: review of major sources, categories, purification method, enzyme characteristics and applications. Mar Drugs 2010, 8 (1), 200–218. DOI: 10.3390/md8010200. [DOI] [PMC free article] [PubMed] [Google Scholar]
- (45).Wang Z; Pakoulev A; Pang Y; Dlott DD Vibrational substructure in the OH stretching transition of water and HOD. The Journal of Physical Chemistry A 2004, 108 (42), 9054–9063. [Google Scholar]
- (46).Malsam J; Aksan A Hydrogen Bonding and Kinetic/Thermodynamic Transitions of Aqueous Trehalose Solutions at Cryogenic Temperatures. The Journal of Physical Chemistry B 2009, 113 (19), 6792–6799. DOI: 10.1021/jp8099434. [DOI] [PubMed] [Google Scholar]
- (47).Kačuráková M; Mathlouthi M FTIR and laser-Raman spectra of oligosaccharides in water: characterization of the glycosidic bond. Carbohydrate research 1996, 284 (2), 145–157. [DOI] [PubMed] [Google Scholar]
- (48).Wolkers WF; Oliver AE; Tablin F; Crowe JH A Fourier-transform infrared spectroscopy study of sugar glasses. Carbohydrate research 2004, 339 (6), 1077–1085. [DOI] [PubMed] [Google Scholar]
- (49).Rennie GK; Clifford J Melting of ice in porous solids. Journal of the Chemical Society, Faraday Transactions 1: Physical Chemistry in Condensed Phases 1977, 73, 680–689. [Google Scholar]
- (50).ITO K Freeze drying of pharmaceuticals. Eutectic temperature and collapse temperature of solute matrix upon freeze drying of three-component systems. Chemical and Pharmaceutical Bulletin 1971, 19 (6), 1095–1102. [Google Scholar]
- (51).Thorat AA; Suryanarayanan R Characterization of Phosphate Buffered Saline (PBS) in Frozen State and after Freeze-Drying. Pharm Res 2019, 36 (7), 98. DOI: 10.1007/s11095-019-2619-2. [DOI] [PubMed] [Google Scholar]
- (52).Kratochvílová I; Golan M; Pomeisl K; Richter J; Sedláková S; Šebera J; Mičová J; Falk M; Falková I; Řeha D Theoretical and experimental study of the antifreeze protein AFP752, trehalose and dimethyl sulfoxide cryoprotection mechanism: correlation with cryopreserved cell viability. RSC advances 2017, 7 (1), 352–360. [DOI] [PMC free article] [PubMed] [Google Scholar]
- (53).Whelan AP; Regand A; Vega C; Kerry JP; Goff HD Effect of trehalose on the glass transition and ice crystal growth in ice cream. International journal of food science & technology 2008, 43 (3), 510–516. [Google Scholar]
- (54).Goff H; Verespej E; Jermann D Glass transitions in frozen sucrose solutions are influenced by solute inclusions within ice crystals. Thermochimica acta 2003, 399 (1–2), 43–55. [Google Scholar]
- (55).Roos Y; Karel M Phase transitions of mixtures of amorphous polysaccharides and sugars. Biotechnology progress 1991, 7 (1), 49–53. [Google Scholar]
- (56).Wang G; Haymet A Trehalose and other sugar solutions at low temperature: Modulated differential scanning calorimetry (MDSC). The Journal of Physical Chemistry B 1998, 102 (27), 5341–5347. [Google Scholar]
- (57).Zhang W; Yang G; Zhang A; Xu LX; He X Preferential vitrification of water in small alginate microcapsules significantly augments cell cryopreservation by vitrification. Biomed. Microdevices 2010, 12 (1), 89–96. DOI: 10.1007/s10544-009-9363-z. [DOI] [PubMed] [Google Scholar]
- (58).Pernodet N; Maaloum M; Tinland B Pore size of agarose gels by atomic force microscopy. Electrophoresis 1997, 18 (1), 55–58. [DOI] [PubMed] [Google Scholar]
- (59).Narayanan J; Xiong J-Y; Liu X-Y Determination of agarose gel pore size: Absorbance measurements vis a vis other techniques. In Journal of Physics: Conference Series, 2006; IOP Publishing: Vol. 28, p 83. [Google Scholar]
- (60).Zelent B; Vanderkooi J Infrared spectroscopy used to study ice formation: The effect of trehalose, maltose, and glucose on melting. Analytical biochemistry 2009, 390 (2), 215–217. [DOI] [PMC free article] [PubMed] [Google Scholar]
- (61).Avila G; Fernández J; Tejeda G; Montero S The Raman spectra and cross-sections of H2O, D2O, and HDO in the OH/OD stretching regions. Journal of Molecular Spectroscopy 2004, 228 (1), 38–65. [DOI] [PubMed] [Google Scholar]
- (62).Abalmassov V; Surovtsev N Frequencies of Stretching and Bending OH (OD) Vibrations in KDP (DKDP) Crystals, According to the Temperature Dependence of Their Raman Spectrum. Bulletin of the Russian Academy of Sciences: Physics 2018, 82 (3), 294–298. [Google Scholar]
- (63).Branca C; Magazu S; Maisano G; Migliardo P α, α-Trehalose− water solutions. 3. Vibrational dynamics studies by inelastic light scattering. The Journal of Physical Chemistry B 1999, 103 (8), 1347–1353. [Google Scholar]
- (64).Branca C; Magazù S; Maisano G; Migliardo P; Villari V; Sokolov A The fragile character and structure-breaker role of,-trehalose: viscosity and Raman scattering findings. Journal of Physics: Condensed Matter 1999, 11 (19), 3823. [Google Scholar]
- (65).Freda M; Piluso A; Santucci A; Sassi P Transmittance Fourier transform infrared spectra of liquid water in the whole mid-infrared region: temperature dependence and structural analysis. Applied spectroscopy 2005, 59 (9), 1155–1159. [DOI] [PubMed] [Google Scholar]
- (66).Jena S; Horn J; Suryanarayanan R; Friess W; Aksan A Effects of Excipient Interactions on the State of the Freeze-Concentrate and Protein Stability. Pharm Res 2017, 34 (2), 462–478. DOI: 10.1007/s11095-016-2078-y. [DOI] [PubMed] [Google Scholar]
- (67).Mitlin S; Leung K Film Growth of Ice by Vapor Deposition at 128− 185 K Studied by Fourier Transform Infrared Reflection− Absorption Spectroscopy: Evolution of the OH Stretch and the Dangling Bond with Film Thickness. The Journal of Physical Chemistry B 2002, 106 (24), 6234–6247. [Google Scholar]
- (68).Ragoonanan V; Aksan A Heterogeneity in desiccated solutions: implications for biostabilization. Biophysical journal 2008, 94 (6), 2212–2227. DOI: 10.1529/biophysj.107.110684. [DOI] [PMC free article] [PubMed] [Google Scholar]
- (69).Jena S; Suryanarayanan R; Aksan A Mutual Influence of Mannitol and Trehalose on Crystallization Behavior in Frozen Solutions. Pharm Res 2016, 33 (6), 1413–1425. DOI: 10.1007/s11095-016-1883-7. [DOI] [PubMed] [Google Scholar]
- (70).Mathlouthi M Food packaging and preservation; Springer Science & Business Media, 1994. [Google Scholar]
- (71).Sundaramurthi P; Suryanarayanan R Trehalose Crystallization During Freeze-Drying: Implications On Lyoprotection. Journal of Physical Chemistry Letters 2010, 1 (2), 510–514. DOI: 10.1021/jz900338m. [DOI] [Google Scholar]
- (72).Sundaramurthi P; Patapoff TW; Suryanarayanan R Crystallization of trehalose in frozen solutions and its phase behavior during drying. Pharmaceutical research 2010, 27 (11), 2374–2383. [DOI] [PubMed] [Google Scholar]
- (73).Miller JS; Rooney CM; Curtsinger J; McElmurry R; McCullar V; Verneris MR; Lapteva N; McKenna D; Wagner JE; Blazar BR; et al. Expansion and homing of adoptively transferred human natural killer cells in immunodeficient mice varies with product preparation and in vivo cytokine administration: implications for clinical therapy. Biol Blood Marrow Transplant 2014, 20 (8), 1252–1257. DOI: 10.1016/j.bbmt.2014.05.004 From NLM. [DOI] [PMC free article] [PubMed] [Google Scholar]
- (74).Lugthart G; van Ostaijen-ten Dam MM; van Tol MJD; Lankester AC; Schilham MW CD56dimCD16− NK cell phenotype can be induced by cryopreservation. Blood 2015, 125 (11), 1842–1843. DOI: 10.1182/blood-2014-11-610311 (acccessed 12/16/2022). [DOI] [PubMed] [Google Scholar]
- (75).Alessandrino P; Bernasconi P; Caldera D; Colombo A; Bonfichi M; Malcovati L; Klersy C; Martinelli G; Maiocchi M; Pagnucco G; et al. Adverse events occurring during bone marrow or peripheral blood progenitor cell infusion: analysis of 126 cases. Bone Marrow Transplant. 1999, 23 (6), 533–537. [DOI] [PubMed] [Google Scholar]
- (76).Windrum P; Morris TC; Drake MB; Niederwieser D; Ruutu T Variation in dimethyl sulfoxide use in stem cell transplantation: a survey of EBMT centres. Bone Marrow Transplant. 2005, 36 (7), 601–603. DOI: 10.1038/sj.bmt.1705100 From NLM. [DOI] [PubMed] [Google Scholar]
Associated Data
This section collects any data citations, data availability statements, or supplementary materials included in this article.
Supplementary Materials
Figure S1: SEM image showing the microstructure of the 1.5% agarose gel. Figure S2: Peak shift of the the ν-(OD) band during freeze/thaw. Table S1: Cell viability and extraction efficiency