



SUMMARY
Defining the mechanisms that govern heart development is essential for identifying the etiology of congenital heart disease. Here, quantitative proteomics was used to measure temporal changes in the proteome at critical stages of murine embryonic heart development. Global temporal profiles of the over 7,300 proteins uncovered signature cardiac protein interaction networks that linked protein dynamics with molecular pathways. Using this integrated dataset, we identified and demonstrated a functional role for the mevalonate pathway in regulating the cell cycle of embryonic cardiomyocytes. Overall, our proteomic datasets are a resource for studying events that regulate embryonic heart development and contribute to congenital heart disease.
Keywords: cardiac, heart, proteomics, mevalonate pathway, metabolism, congenital heart disease, heart development
eTOC Blurb
Defining the mechanisms that govern heart development is essential for identifying the etiology of congenital heart disease. Edwards et al. perform quantitative proteomic profiling at eight stages of murine embryonic heart development and provide insight into global changes in protein dynamics, networks, and pathways during cardiogenesis.
Graphical Abstract

INTRODUCTION
Congenital heart disease (CHD) is the most common type of birth defect, affecting approximately 1% of live births 1–3. The structural malformations that characterize CHD result from perturbations in the programs that regulate heart development; understanding the details of these mechanisms and how they go awry is critical for better understanding cardiac development and addressing CHDs.
The susceptibility of the heart to CHD reflects the highly complex developmental processes required for proper heart formation, which include precise coordination of cardiac cell specification and differentiation with morphogenic events that guide the development of essential heart structures. These processes occur over a surprisingly short period. The heart begins as a linear heart tube, which subsequently undergoes cardiac looping, a key morphogenic event critical for the orientation of the heart chambers. This developmental milestone is followed by maturation of the cardiac chambers, atrial and interventricular septation, development of heart valves, and formation of the cardiac conduction system 4–7. Overall, the transition from a linear heart tube to a 4-chambered heart that anatomically parallels the adult heart occurs within three weeks in humans and one week in mice 8.
Identifying the mechanisms that regulate mammalian heart development is essential for understanding the etiology of CHDs. Traditionally, genomics and transcriptomic approaches were used to identify key genes and networks that control crucial steps of cardiac development. Recent advances in single-cell RNA sequencing have enabled detailed analyses of cell-specific transcriptional profiles and lineage trajectories 9,10. These methodologies have enhanced knowledge of transcriptional dynamics; however, these dynamics likely do not accurately reflect protein expression dynamics. Most notably, RNA transcript levels often correlate poorly with protein abundance 11–13. Therefore, to understand the molecular mechanisms of heart development and CHD, it is essential to fully understand the protein dynamics of heart development.
In this study, we used multiplexed quantitative proteomics to quantify protein abundances and assemble proteome profiles across eight time points of murine embryonic heart development. We quantified the temporal expression of 7,313 cardiac proteins, of which 3,799 exhibited differential expression during development. Using our embryonic temporal proteome profiles, we linked protein dynamics with molecular pathways. In addition, we monitored the temporal protein expression of 185 CHD-associated proteins. Further, our analysis uncovered an unexpected overrepresentation of core components of the mevalonate (MVA) pathway during midgestation of heart development. Concordantly, our functional analyses demonstrated that the MVA pathway regulates embryonic cardiomyocyte cycling and signaling. Collectively, this comprehensive dataset represents a critical resource for analyzing protein expression, protein interaction networks, and regulatory pathways throughout embryonic heart development.
RESULTS
Quantification of temporal protein abundance during embryonic heart development.
Identifying embryonic cardiac proteins and delineating the temporal regulation of protein networks is critical for establishing the mechanisms that regulate normal heart development. Here, we used quantitative mass spectrometry with Tandem Mass Tag (TMT) labeling to investigate protein dynamics at critical stages of heart development. This quantitative multiplexing approach is ideal for studying the embryonic heart proteome because it enables high-throughput quantification of proteins from relatively low amounts of tissues while minimizing variability and missing values between samples, and supports detection of low-abundance proteins 14–16.
We collected hearts at eight stages, from embryonic day 9.5 (E9.5) to day 16.5 (E16.5) (n=3 biological replicates). These stages encompass essential cardiac morphogenetic events, including cardiac looping, chamber formation, atrial and ventricular septation, and valve development (Figure 1A). To obtain high-confidence candidates, we used stringent filtering parameters that resulted in the quantification of 7,313 proteins, of which 3,799 displayed significant changes in abundance between E9.5 and E16.5 (Figure 1B). Pearson correlation between the three biological replicates averaged 0.98; thus, protein identification and quantification were highly reproducible (Figure S1D).
Figure 1. Quantification of temporal protein expression during embryonic heart development.
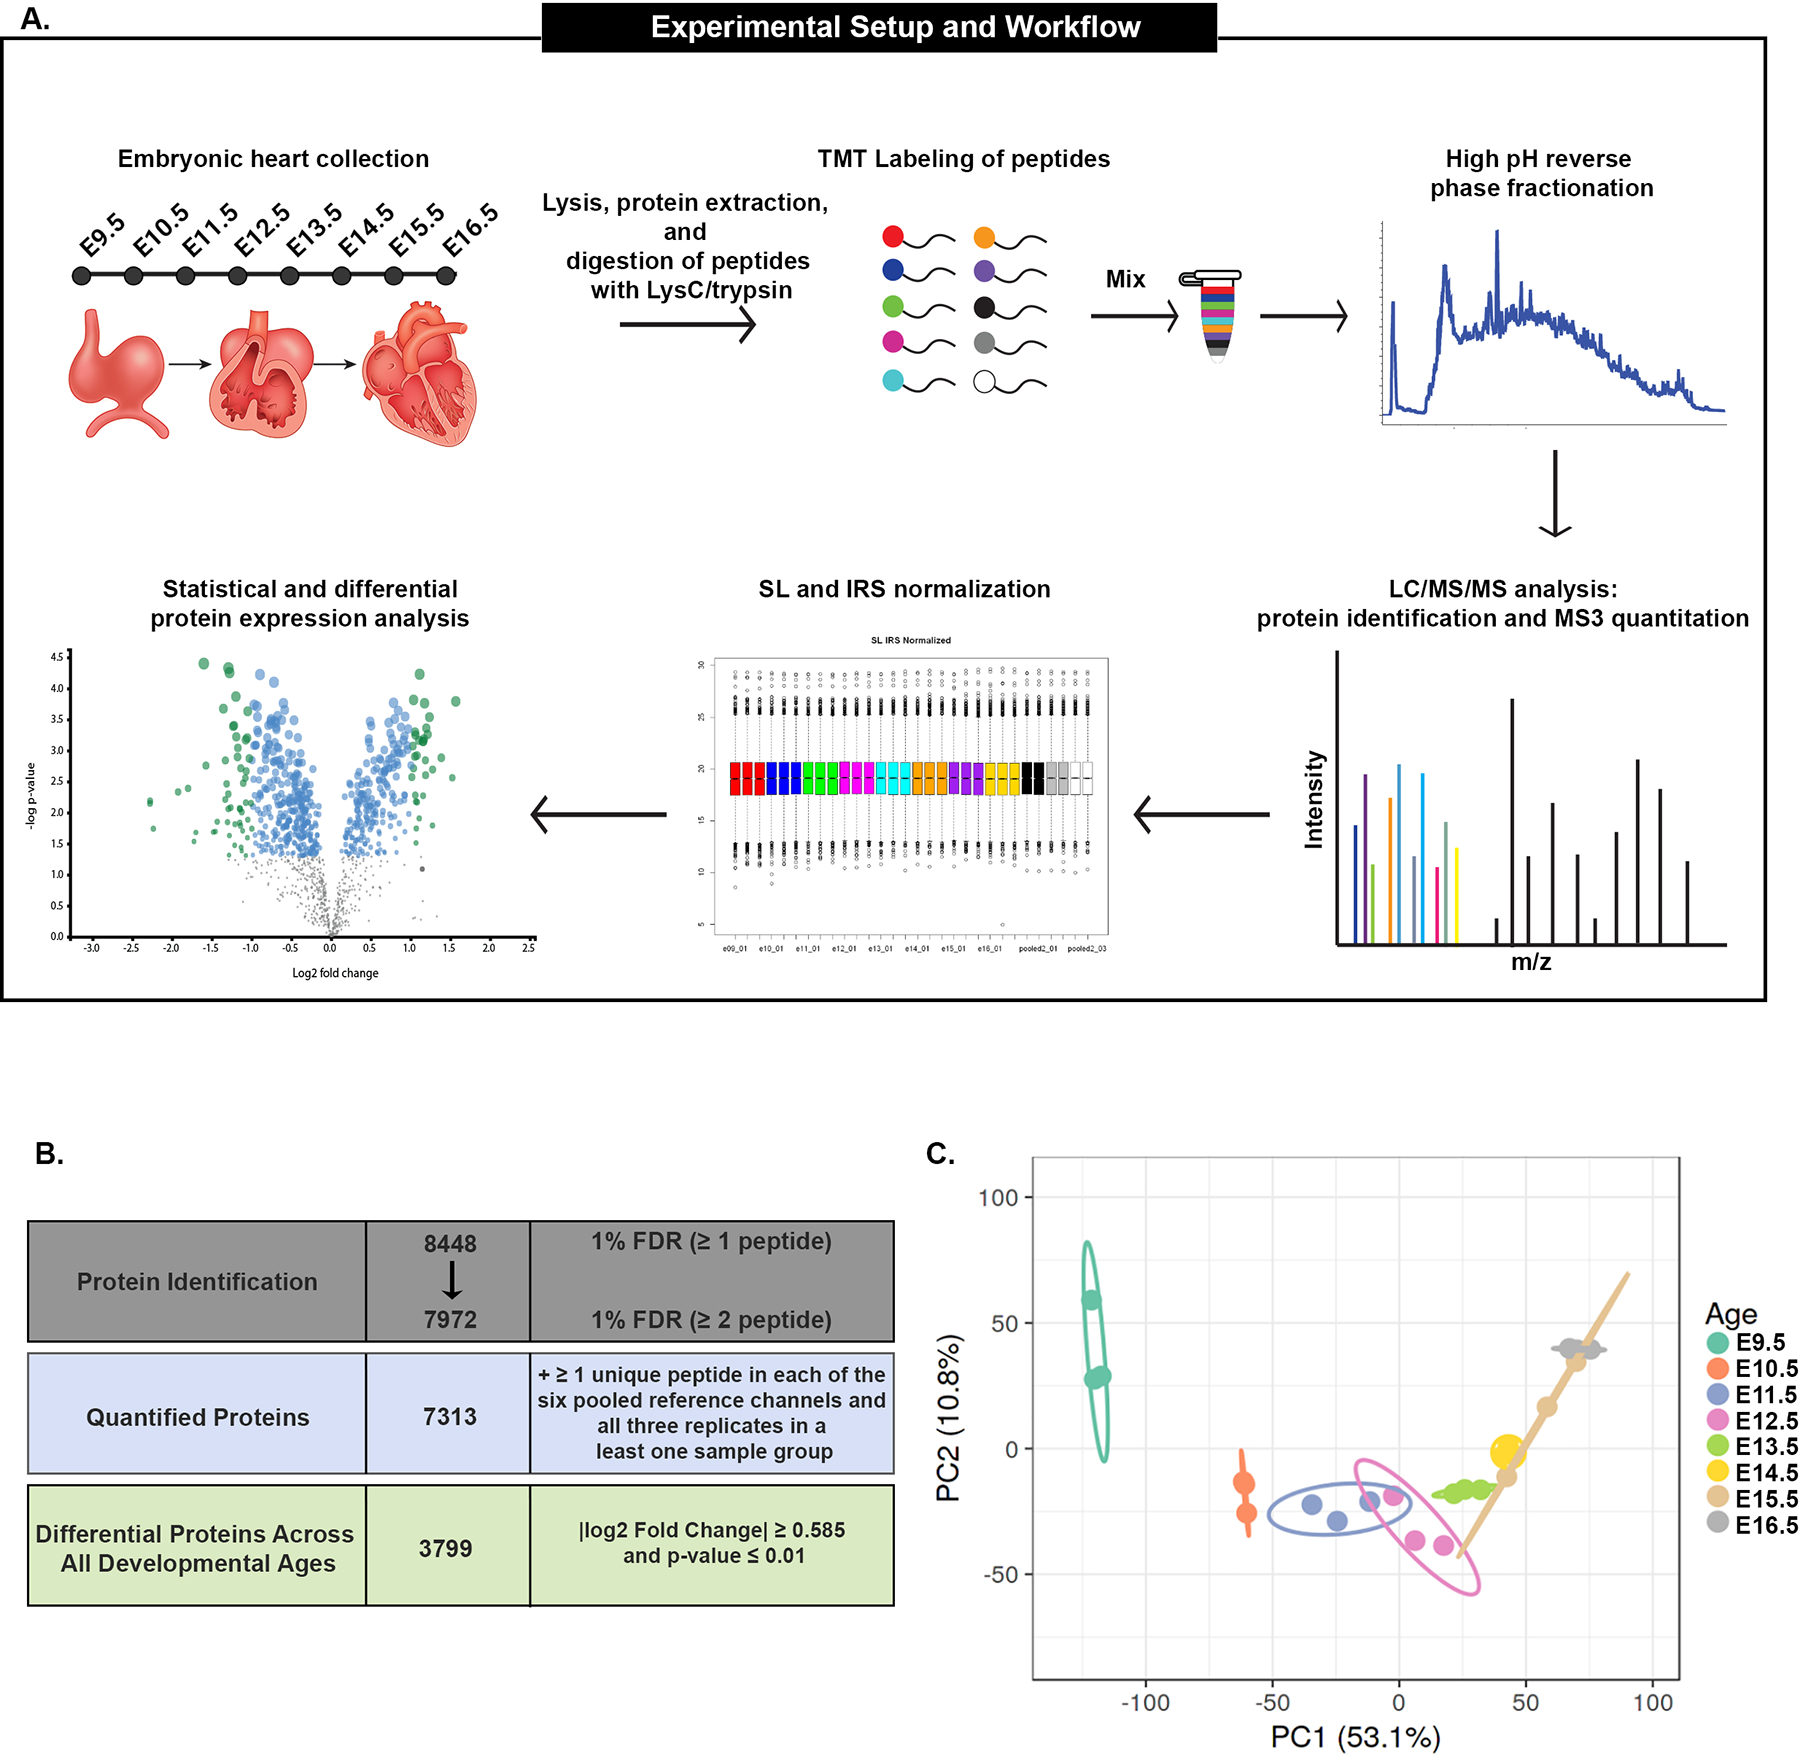
(A) Tandem mass tag (TMT) quantitative mass spectrometry (MS) experimental design and analysis used to profile protein abundance in the developing mouse heart. Three independent TMT-MS experiments were performed. Schematic created with Biorender.com.
(B) Filtering parameters used to generate the final list of quantified proteins (7,313), and statistical cutoffs used to determine differentially expressed proteins (3,799).
(C) Principal component analysis (PCA) of TMT-MS proteomic data from each of the developmental time points. Color indicates age. Ellipses represent 95% confidence intervals.
Principal component analysis (PCA) showed separation of embryonic stages, while biological replicates of the same age clustered closely together (Figure 1C). The PCA agrees with known differences in morphological/developmental events. For example, E9.5 differed most from other ages because, at this age, the heart has yet to undergo key developmental processes such as cardiac chamber maturation and valve formation. In addition, E15.5 replicates clustered closely with E14.5 and E16.5 samples, which suggested a strong similarity in protein expression at these ages when cardiac morphogenesis is nearly complete. Our dataset provides a comprehensive resource for assessing global protein dynamics and identifying regulatory mechanisms governing cardiogenesis.
Expression dynamics of cell-type-specific proteins in the developing heart.
Heart development and function rely on the coordinated maturation of many cardiac cell types, including cardiomyocytes, endocardial cells, and valve endothelial cells. We performed a targeted analysis to assess whether our proteomic dataset identified proteins associated with specific cardiac cell types and whether the data were consistent with demonstrated temporal protein dynamics.
First, we examined proteins associated with cardiomyocyte (CM) development and function. During embryogenesis, rapid increase in CM number is accompanied by the initiation of CM maturation. CM maturation coincides with significant structural changes and extensive reorganization of the cardiac contractile machinery 17–19. Concordantly, we observed a significant and steady increase in CM-specific proteins and cardiac contractile proteins between E9.5 and E16.5. Proteins included troponin complex proteins (TMP1, TNNT2), myofibril proteins (MYH7 and MYL2), and well-established cardiomyocyte-specific markers (NPPA, SMPX) (Figure 2A).
Figure 2. Expression dynamics of cell type-specific proteins in the developing heart.

Temporal expression profiles of proteins specific to cardiomyocytes (A), cardiac conduction system (B), endocardial cells (C, D), and valve endocardial cells (E, F).
For panels A-F, graphs represent average protein abundance (maximum average normalized) at each development point. Error bars represent SEM. Asterisk (*) indicates proteins that met statistical but not fold change cutoffs for differential expression.
We profiled proteins associated with maturation and function of the cardiac conduction system (CCS), a specialized group of CMs that generate and propagate electrical impulses through the heart. The CCS is a complex system of functionally distinct structures that include the sinoatrial node (SAN), atrioventricular node, atrioventricular bundle, bundle branches, and Purkinje fibers. Critical steps of CCS cell differentiation and maturation occur between E9.5-E16.5. Therefore, we used our dataset to identify and characterize expression dynamics of well-established CCS-associated proteins. For example, HCN4, which is required for cardiac pacemaker activity of the SAN, exhibits broad expression in the myocardium early in development and becomes progressively restricted to CCS by the end of embryogenesis 20–22. This expression pattern was mirrored in our datasets by a gradual decrease in HCN4 expression from E9.5-E16.5 (Figure 2B). In contrast, CX40 (GJA5), a gap junction protein associated with the ventricular portion of the mature CCS, showed a drastic increase in expression from E9.5-E10.5, maintaining a relatively steady expression level during midgestation (E11.5-E13.5), followed by a decrease in at later stages (Figure 2B). The protein expression pattern of CX40 is consistent with immunohistological (IHC) studies 23,24.
We next examined proteins associated with endocardial cells (EC), specialized endothelial cells that form the innermost layer of the heart. ECs contribute to critical processes during heart development, including formation of the valves and maturation of the trabecular layer of the myocardium. First, we analyzed protein expression dynamics of broad EC cell markers. Studies have demonstrated TIE2 (TEK), and NOTCH1 are expressed throughout the endocardium during development, and absence of either marker causes attenuated endocardial cell proliferation and impaired trabeculation, ultimately resulting in embryonic lethality by E10.5 25–29. Our analysis showed that NOTCH1 and TIE2 displayed relatively steady expression levels with only a minimal decrease observed at later stages (E14.5-E16.5) (Figure 2C). PECAM1 (CD31), another well-established broad EC marker, similarly showed minimal changes in expression between E9.5-E16.5. We further examined expression of two recently identified EC-specific proteins, LGALS9 and CD93. CD93 parallels expression of PECAM1, while LGALS9 shows a substantial increase in expression between E9.5-E13.5 30 (Figure 2D).
Valve endothelial cells (VEC) are a subset of EC cells that contribute to the formation of the cardiac cushions (primordial valves). Between E9.5 and E16.5, the cardiac cushions undergo extensive growth and remodeling as valves mature 31. We examined VEC markers that are required for initial steps of cardiac cushion formation. NFATC1, a transcription factor enriched in VECs, is associated with malformations of cardiac valves in mice and humans 32–35. We observed that NFATC1 displayed peak protein abundance at E9.5 and steadily decreased as heart development proceeded (Figure 2E). We also examined BMPR1A, a BMP receptor that has a well-established function in epithelial-to-mesenchymal (EMT) transition in the primordial valve 36,37. Our data showed that BMPR1A had the highest abundance at E9.5 and significantly decreased at later stages of embryogenesis (Figure 2E). In contrast, POSTN, an extracellular matrix protein required for valve maturation, showed a marked increase in abundance between E9.5-E16.5 (Figure 2F). These data agreed with IHC studies that showed POSTN expression enriched in cardiac valves during maturation38.
Collectively, we demonstrated that our dataset can be used to analyze time-resolved expression dynamics of cell-type-specific proteins in the developing heart. Furthermore, the accuracy and depth of our proteomic dataset are exemplified by its precise recapitulation of known protein expression patterns associated with critical cardiac developmental processes.
Chromatin organization and energy metabolism cardiac protein networks are modulated from early-to-mid gestation.
To determine pathways and protein networks differentially regulated during specific cardiac development windows, we performed pairwise comparisons of the cardiac proteomes at distinct embryonic stages. Progression of heart development from E9.5-E11.5 represents initiation of key developmental events, including chamber differentiation/growth and onset of valve formation and chamber septation. To define protein networks involved in these processes, we compared differences in protein abundance between E9.5 and E11.5. We identified 1,559 differentially expressed proteins, of which 515 showed significantly higher abundance at E9.5, while 1,044 displayed higher abundance at E11.5 (|Log2 fold change| ≥ 0.585 and false discovery rate (FDR) < 5%; Figure 3A).
Figure 3. Comparison of cardiac proteome at distinct embryonic stages.

(A) Volcano plot displaying protein abundance differences between E9.5 and E11.5.
(B) Representation of significantly enriched (p-value ≤ 0.001) GO terms (biological process) associated proteins that display greater abundance at E9.5 compared with E11.5.
(C) Representation of significantly enriched (p-value ≤ 0.001) GO terms (biological process) associated proteins that display greater abundance at E11.5 compared with E9.5.
(D) Volcano plot displaying protein abundance differences between E12.5 and E16.5.
(E) Representation of significantly enriched (p-value ≤ 0.001) GO terms (biological process) associated with proteins that display greater abundance at E12.5 compared with E16.5.
(F) Representation of significantly enriched (p-value ≤ 0.001) GO terms (biological process) associated with proteins that display greater abundance at E16.5 compared with E12.5.
For panels A and D: Plots are shown as Log2 fold change (x-axis) plotted against the −log10 of the p-value (y-axis). Red dots represent proteins that were considered significantly different based on fold change (|Log2 fold change| ≥ 0.58) and false discovery rate (FDR < 5%) parameters.
Gene ontology (GO) pathway analysis revealed that proteins highly expressed at E9.5 were primarily associated with chromosome organization/mitotic nuclear division, ribosome biogenesis, and RNA transcription/processing (Figure 3B). STRING was used to identify physical protein-protein interactions within defined pathways. Proteins involved in chromatin organization formed a network that contained components of chromatin-modifying complexes, including, Polycomb repressive complex I (PCGF6, RNF2, L3MBLT2, EHMT1), BAF complex (SMARCB1, SMARCC1, SMARCD1), and MOZ/MORF complex (KAT6A, ING5) (Figure S3A). These multi-subunit complexes are epigenetic modifiers that regulate cardiac gene expression programs. Genetic deletion of specific components in each of these complexes is associated with abnormalities in cardiac morphogenesis 39–47. Additionally, mutations in components of the BAF, PRC1, and MOZ/MORF complexes were recently identified as de novo damaging mutations in isolated CHD cases; these findings illustrated a critical function for these complexes in human heart development 48.
Our analyses identified a second large interaction network of proteins associated with cell cycle control, including Kinesin family members (KIF20A, KIFB20B, KIF23) and proteins that regulate mitotic spindle formation (AURKB, PLK1, SPDL1, INCENP) (Figure S3B). These findings are consistent with E9.5 hearts undergoing a period of rapid growth and division.
Interestingly, we observed a large network of ribosome biogenesis proteins upregulated at E9.5. This network included ribosomal subunits (RPS19, RPL11, RPL35A) and proteins involved in ribosomal RNA (rRNA) processing (WDR43, WDR75, UTP18) (Figure S3C). Although precise function of ribosome biogenesis in heart development is not well understood, mutations in proteins involved in ribosome biogenesis are associated with CHDs, referred to as ribosomopathies 49–52. The most well-studied ribosomopathy is Diamond-Blackfan anemia, a congenital syndrome caused by mutations in ribosomal subunit proteins that presents with a wide range of heart defects 53.
In contrast to our findings at E9.5, cardiac proteins highly expressed at E11.5 were associated with metabolic pathways including energy metabolism, fatty acid oxidation, and glycolysis (Figure 3C). Enriched proteins at E11.5 formed highly interconnected protein-protein interaction networks composed of proteins associated with nucleotide biosynthesis (AK1, NT5C, PDE4D), glycolysis (ALDOA, GAPDH, PGK1), fatty acid oxidation (ACAA2, ETFA, HADHA), and lipid peroxidation (GPX1, PRDX6, GSTM7) (Figures S3E and S3F). In addition, we observed increases in complexes associated with heart contraction, including the dystrophin-associated complex (DMD, SGCD, CAV3) and sarcomeric proteins (TNNI3, MYL2, TCAP) (Figure S3D). Increases in cardiac protein networks associated with metabolic pathways and muscle function reflect maturation, growth, and increased energy expenditure of the myocardium.
TGFB/WNT signaling, transcriptional repression, and cardiac muscle protein networks are modulated from mid-to-late gestation.
Heart development between E12.5 to E16.5 is the final phase of critical morphogenic events. During this developmental window, heart chambers are septated, primordial valves undergo extensive remodeling, and by E16.5 the heart morphologically reflects the postnatal heart. Our analyses of E12.5 versus E16.5 revealed enriched biological processes distinct from those identified in E9.5 versus E11.5 comparison. Overall, we identified 679 differentially expressed cardiac proteins, of which 397 had significantly higher abundance at E12.5, and 283 displayed higher abundance at E16.5 (Figure 3D).
Biological pathways enriched at E12.5 included epithelial morphogenesis, negative regulation of transcription, and rRNA metabolism (Figure 3E). Proteins in the epithelial morphogenesis category formed functional interaction networks that included members of the transforming growth factor beta (TGFB) (TGFB1, TGFBR1, TGFBR2) and WNT (WNT5A, FZD1, FZD7) signaling pathways (Figures S4A and S4B). The TGFB and WNT signaling pathways have multifaceted functions in cardiac development. Therefore, enriched expression of proteins associated with TGFB and WNT pathways at E12.5 may reflect functions in valve maturation, trabeculation, and/or septation. We further identified a large interaction network associated with transcriptional repression. Interestingly, similar to E9.5, we identified a subset of cardiac proteins associated with the Polycomb Repressive Complexes (SUZ12, EZH2, RYBP; Figure S4C). Notably, many of these proteins were distinct from those at E9.5, which suggested systematic temporal regulation of distinct Polycomb Repressive complex proteins during cardiac development (Figure S3A). In comparison, enriched pathways and protein interaction networks at E16.5 were associated predominantly with cardiac muscle function and included proteins involved in contraction (DMD, TNNI3, MYL2), fatty acid oxidation (ACAA2, HADHB, EFTA), and oxidative phosphorylation (COX5A, NDUFA4, UQCRH) (Figures 3F, S4D–4F).
In sum, quantitative proteomic analyses identified key proteins, biological pathways, and protein complexes differentially regulated during essential phases of mammalian heart development. Additionally, this work illustrates the utility of our dataset to conduct targeted analyses of age-specific changes in the embryonic cardiac proteome.
Analysis of global protein abundance reveals eight distinct cardiac protein expression profiles.
A unique advantage of our dataset is that it includes the cardiac proteomes of eight embryonic time points which encompass a wide range of developmental milestones. Therefore, we assessed global changes in protein abundance across the entire developmental spectrum. To this end, protein abundance ratios were calculated for each protein relative to E9.5. A total of 3,799 proteins displayed significant temporal changes in abundance at one or more developmental stages (|Log2 fold change| ≥ 0.585 and adjusted p-value ≤ 0.01; Figures 1B, S2). Hierarchical clustering uncovered eight distinct cardiac protein expression profiles (Clusters; Figure 4A).
Figure 4: Analysis of global protein abundance reveals eight distinct cardiac protein expression profiles.
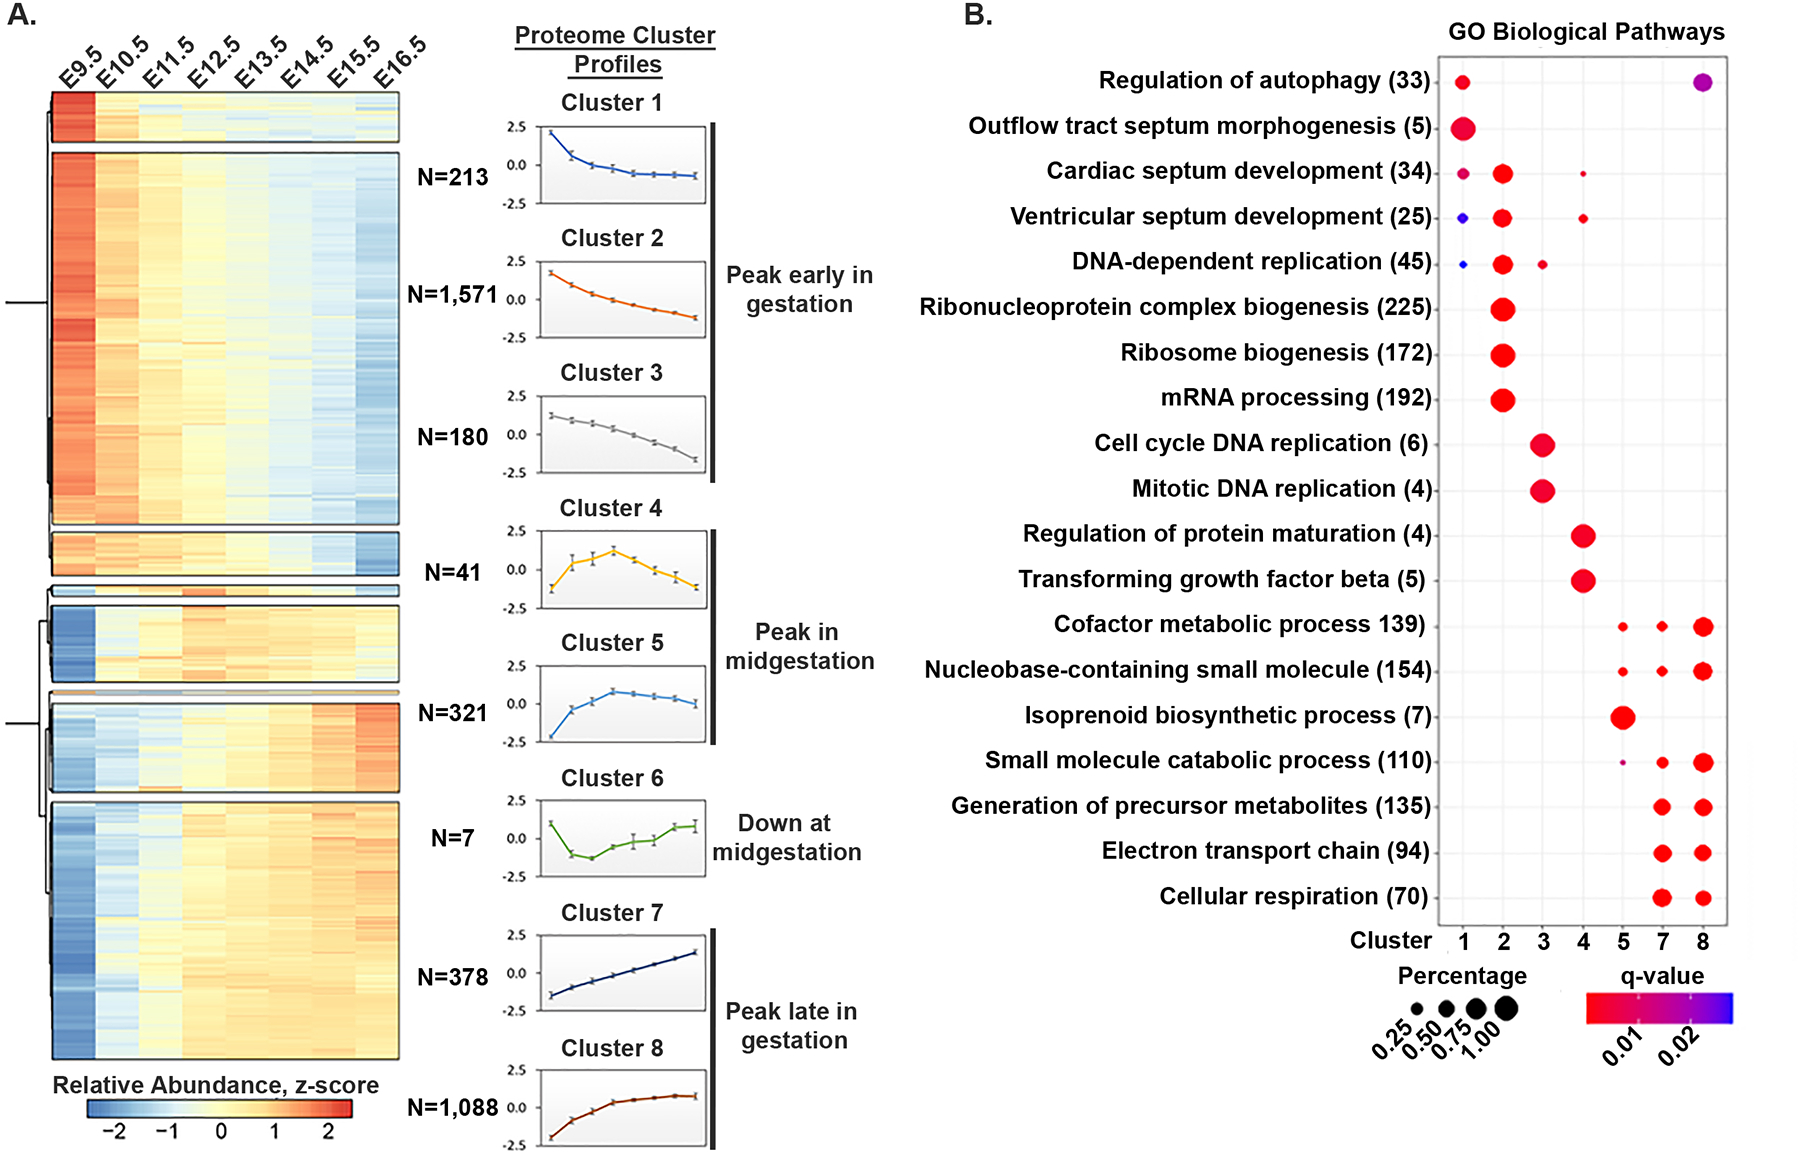
(A) Hierarchical clustering of 3,799 differentially expressed proteins revealed eight distinct temporal patterns of protein expression (Clusters 1–8). For each developmental time point, the median values of all the proteins within a cluster were calculated to generate the median cluster profile graphs.
(B) Dot plot of GO terms (biological processes) significantly enriched for each cluster. Color indicates q-value. Size of circles indicates the percent of input proteins in a given biological process term.
Clusters 1, 2, and 3 displayed peak protein abundance early in gestation (E9.5-E10.5). Notably, a majority (1,964/3,799; 51.7%) of the differentially expressed proteins we identified are found within clusters 1, 2, and 3. Cluster 1 proteins showed a rapid decrease at E11.5 and maintained steady expression at later stages in development. Cluster 1 (N=213) proteins were enriched for pathways involved in autophagy, outflow tract morphogenesis, and septum development (Figure 4B). In contrast, Clusters 2 and 3 proteins showed a steady decrease in abundance as development progressed. We note that Cluster 2 contained the largest number of proteins (N=1571), accounting for approximately 41% of all differential proteins. Pathways specifically associated with Cluster 2 included ribosome biogenesis and mRNA processing (Figure 4B). Cluster 3 proteins (N=180) were linked to pathways associated with DNA replication and cell cycle progression. These results paralleled pathways identified in the E9.5 versus E11.5 pairwise comparison (Figures 3A–C).
Clusters 4 (N=41) and 5 (N=321) included proteins that exhibited the highest expression during midgestation (E11.5-E13.5). Cluster 4 proteins displayed a sharp increase in expression between E9.5-E12.5 followed by a continuous decrease at later stages. This group was enriched for pathways in protein maturation and TGFB signaling. Cluster 5 proteins showed a similar pattern of expression and were specifically associated with metabolic pathways, including cofactor metabolic processes, small molecule metabolic processes, and isoprenoid biosynthesis.
In contrast to Cluster 4 and 5, proteins in Cluster 6 displayed the opposing expression pattern, with high abundance at E9.5, followed by a sharp and transient decrease by E11.5 and then a gradual increase during late gestation. Because of the small number of proteins in Cluster 6 (N=7), GO pathway analysis was unable to statistically correlate Cluster 6 with specific biological processes. However, we noted that several proteins were associated with the extracellular matrix (ITGA7, COL5A1, COL1A2).
Proteins in clusters 7 (N= 378) and 8 (N=1088) showed peak abundance in late gestation (E13.5-E16.5). Proteins in Cluster 7 and 8 were enriched for pathways associated with metabolism, the electron transport chain, and respiration.
Overall, our dataset enabled us to analyze global changes in cardiac protein expression during embryonic heart development. Our identification of eight distinct protein expression profiles suggested strict temporal regulation of protein abundance is essential for embryonic heart development. Further investigation of individual proteins and protein networks within each of these temporally regulated pathways will provide insights into stage-specific cardiac development.
Expression dynamics of congenital heart disease-associated proteins.
Clinical and genetic studies identified a large cohort of genes that are implicated in CHD. We used our datasets to investigate the temporal expression of cardiac proteins associated with isolated and syndromic CHDs. For these analyses, we curated a list of 185 proteins commonly implicated in CHDs in mice and humans 48,54–57. Most (100/185) CHD-associated proteins were differentially expressed during embryonic heart development (Figure S5). Strikingly, approximately 71% of differentially expressed proteins displayed peak abundances at early development time points (Clusters 1, 2, 3). These proteins were associated with signaling pathways (JAG1, SMAD4, TGFBR1), chromatin modification (CHD4, CHD7, JARID2), cardiac transcription factors (TBX5, GATA4, NKX2–5), and ribosomal proteins (RPS19, RPS17, RPL11). A smaller subset displayed peak abundance during mid (11/100; Cluster 4, 5) and late gestation (16/100; Cluster 7, 8). This included several structural (ELN, FBN1, MYH7) and intracellular signaling proteins (MAP2K1, PTEN, SOS2). Interestingly, included in Cluster 6 were two collagen proteins associated with CHDs (COL5A1 and COL1A2).
Overall, our dataset provided temporal protein dynamics for a large cohort of CHD-associated proteins. Furthermore, our analysis demonstrates that the majority of these proteins display peak protein abundance at early stages of heart development (E9.5-E10.5), indicating that this embryonic window is particularly sensitive to disruption in protein abundances.
Comparative analysis of the embryonic heart proteome and transcriptome.
To delineate if global proteome dynamics are coupled to transcriptional changes, we performed transcriptomic analysis (bulk RNA-sequencing) on embryonic hearts (E9.5, E10.5, E12.5, E14.5, and E16.5) and conducted a comparative analysis of our transcriptomic versus proteomic datasets. We quantified a total of 17,537 genes and identified 8,394 genes differentially expressed at one or more developmental timepoints (|Log2 fold change| ≥ 0.585 and adjusted p-value ≤ 0.01). A total of 7,227 genes were detected at the proteome level in our dataset (Figure S6A). Consistent with previous studies, we observe a moderate correlation between mRNA (TPM) and protein (copy number) (Pearson correlation coefficient r= 0.63 – 0.66), suggesting that the transcriptome does not serve as an accurate proxy for the proteome (Figure S6B).
Hierarchal clustering of differentially expressed genes (8,394) and analysis of global gene expression profiles revealed concordant expression profiles between the proteome and transcriptome. Specifically, gene expression profiles are subdivided into four primary categories, peak early in gestation (Clusters 5 and 6), peak at midgestation (Clusters 3, 4, and 7), peak late in gestation (Clusters 1 and 2), and down at midgestation (Cluster 7) (Figure 5A). To assess if genes and proteins that display similar patterns of expression during heart development are functionally related, we grouped transcriptome and proteome clusters with similar profiles and compared the top enriched pathways (Figure 5B). We find that pathways associated with genes/proteins that peak early in gestation are largely consistent (15/20), several pathways involved in ribosome biogenesis, DNA replication, and septum morphogenesis are significantly enriched in both proteomic and transcriptomic datasets. In contrast, genes/proteins that peak at mid- and late gestation have fewer shared biological pathways (6/19 and 11/20, respectively). In fact, we observed several functional pathways uniquely associated with either the transcriptome or proteome. For example, “extracellular matrix organization” was specifically identified at the transcriptome level, while “regulation of protein maturation” and “isoprenoid biosynthetic process” were proteome specific.
Figure 5: Comparative analysis of the embryonic heart proteome and transcriptome.

(A) Hierarchical clustering of 8,394 differentially expressed genes revealed eight distinct temporal expression patterns (Clusters 1–8). For each developmental time point, the median values of all the proteins within a cluster were calculated to generate the median cluster profile graphs.
(B) Dot plot comparing significantly enriched GO terms (biological processes) between RNAs (yellow) and proteins (blue) with similar cluster profiles. Color indicates q-value. Size of circles indicates the percent of input proteins in a given biological process term.
(C-F) UpSet plots displaying the intersection of genes and proteins that peak early in gestation (C), peak in midgestation (D), peak late in gestation (E), and are decreased at midgestation (F).
We additionally directly assessed the congruency between genes and proteins that display similar expression profiles. We analyzed only subsets of genes/proteins identified in both transcriptomic and proteomic datasets (7,227) and determined the number of genes and corresponding proteins that have analogous expression profiles. Our results show substantial differences in genes/proteins present in each category. While genes/proteins that peak early in gestation are associated with similar biological pathways, only ~56% (945/1,686) of genes have a corresponding protein in this category (Figure 5C). Analyses of additional expression profiles reveal a similar discordance. Approximately 33% (80/242) of genes that peak at midgestation and ~57% (715/1,243) of genes that peak late in gestations show complementary expression dynamics at the protein level (Figures 5D and 5E). Genes significantly decreased during midgestation showed the lowest degree of overlap between the proteome and transcriptome as we identified only one gene (AOC3) with a matching protein in this category (Figure 5F). Our results demonstrate that the proteome and transcriptome provide unique and distinct molecular information about heart development. The observed discordance in RNA and protein expression at the molecular and functional level implies that post-transcriptional/translational mechanisms are a critical consideration for assessing mechanisms of heart development. Finally, these studies highlight the importance of utilizing molecular information from both the transcriptome and proteome to elucidate mechanisms of cardiogenesis.
Mevalonate pathway proteins are abundantly expressed at midgestation.
One of the primary goals is to use our proteomic dataset to identify less well-studied proteins and pathways essential for heart development. As our dataset uniquely enables us to identify transient expression patterns, we were specifically interested in proteins that follow a non-monotonic expression pattern. Thus, we further investigated proteins represented in Clusters 4 and 5, proteins showing peak abundance at midgestation (Figures 4A and 4B). Intriguingly, most core enzymes of the mevalonate (MVA) pathway (AKA, isoprenoid biosynthesis pathway) were identified in Cluster 5. These MVA enzymes included MVK, PMVK, MVD, and FDPS (Figures 6A and 6B). The MVA pathway is an essential metabolic pathway that converts acetyl-CoA to either cholesterol or isoprenoids used for protein prenylation. The MVA pathway regulates a diverse set of cellular functions, including proliferation, apoptosis, and cell migration 58,59.
Figure 6: The mevalonate pathway proteins are abundantly expressed in midgestation.

(A) Schematic representation of the MVA pathway. Enzymes labeled in purple display peak abundance in midgestation (Cluster 5).
(B-D) Temporal protein expression profiles of MVA pathway-associated proteins that display peak abundance at midgestation (Cluster 5) (B), early gestation (Cluster 2) (C), and late gestation (Cluster 8) (D).
(E-G’) Immunohistochemical analysis of HMGCR (red) expression in E9.5 (E), E12.5 (F, F’), and E16.5 hearts (G, G’).
(H-J’) Immunohistochemical analysis of GGPS1 (red) expression in E9.5 (H), E12.5 (I, I’), and E16.5 hearts (J, J’).
For panels B, C, and D, graphs represent average protein abundance (maximum average normalized) at each development point. Error bars represent SEM. Asterisk (*) indicates proteins that met statistical but not fold change cutoffs for differential expression. Scale bar= 100 μm (E and H). Scale bar= 200 μm (F, F’, G, G’, I, I’, J, and J’). AT, atrium; CL, compact Layer; IVS, interventricular septum; LA, left atria; LV, left ventricle; RA, right atria; RV, right ventricle; TR, trabecular layer; V, ventricle. For panels, F and I, asterisk (*) represents the dorsal pericardial wall.
We queried other Clusters to determine expression patterns of additional MVA components (Figures 6C and 6D). SREBF2 (SREBP2), a transcription factor that directly regulates expression of MVA genes involved in cholesterol synthesis, was highly expressed at E9.5 and showed a steady decrease throughout development (Cluster 2). In addition, HMGCR1, FDFT1 (SQS), and LSS, transcriptional targets of SREBF2, all showed a similar decrease in expression (Figure 6C) 60. In contrast, MVA pathway components involved in terminal steps of protein prenylation (GGPS1, RABGGTA, FTNA, and FNTB) showed a marked increase in abundance, with peak abundance occurring at the end of gestation (Cluster 8) (Figure 6D). Of note, we observed opposing patterns of expression for MVA components directly involved in cholesterol biosynthesis (FDFT1, LSS, DHCR7) versus components that facilitate protein prenylation (GGPS1, FTNA, FNTB, RABGGTA).
To provide insight into cell-type and regional expression of key MVA pathway components, we performed an IHC analysis of HMGCR and GGPS1 at E9.5, E12.5, and E16.5. At E9.5, HMGCR, the rate-limiting MVA enzyme, is highly expressed in CMs, endothelial cells (arrow), cardiac progenitors located in the dorsal pericardial wall (asterisk), the developing atria (AT), ventricles (V) and outflow tract (OFT) (Figure 6E). At E12.5, HMGCR is expressed in CMs of the atria, compact layer (CL), and trabecular (TR) layers of the ventricles and the interventricular septum (IVS) (Figure 6F). Additionally, HMGCR was detected in the epithelial layer in the lumen of the heart chambers (Figures 6F and 6F’). Corroborating our proteomic analysis, HMGCR is downregulated at E16.5, and expression is primarily confined to the outer layer of the heart (Figures 6G and 6G’).
At E9.5 GGPS1, the enzyme that mediates the production of isoprenoids specifically used for geranylgeranylation, is detected in all major components (atria, ventricle, OFT) and in multiple cardiac cell-types (CMs, endothelial cells, cardiac progenitors) paralleling HMCGR expression (Figure 6H). At E12.5 and E16.5, GGPS1 is observed in CMs of the atria, ventricles, and the IVS (Figures 6I–6J’), consistent with previous studies 61. These data support a role for the MVA pathway in multiple cardiac cell-types during embryonic heart development.
Taken together, our dataset allowed us to examine protein expression patterns of MVA pathway components, providing a global overview of pathway dynamics. Our findings revealed that distinct branches of the MVA pathway are regulated in a temporally distinct manner. Furthermore, our studies demonstrate that MVA components are broadly expressed in multiple cardiac cell-types suggesting a multifaceted role for MVA in embryonic heart development.
The mevalonate pathway controls embryonic cardiomyocyte cell cycle and signaling.
Temporal analysis of MVA components showed that most of the MVA core enzymes displayed peak expression during midgestation (Cluster 5; Figures 4B, 6A, and 6B). Therefore, we sought to define a function for the MVA pathway during midgestation of heart development. Previous studies in a human cardiac organoid model demonstrated the MVA pathway regulates CM proliferation 62.
Here we used a primary culture system to determine whether alterations in the activity of the MVA pathway directly control the cell cycle in embryonic cardiomyocyte (eCMs). Statins are a large class of drugs that inhibit HMG-CoA reductase, the rate-limiting enzyme in the MVA pathway. Statins efficiently reduce cholesterol biosynthesis and production of isoprenoids used for protein prenylation. To measure the effects of MVA pathway inhibition on eCM cycling, we isolated and treated E12.5 cardiomyocytes in culture for 24 hours with 5 μM,10 μM and 25 μM simvastatin (Smv), a lipophilic statin shown to alter proliferation of human pluripotent stem cell-derived cardiomyocytes (Figure 7A) 62. Immunohistological analysis of cardiomyocyte cultures with the cell cycle marker Ki67 revealed an ~30–40% decrease in Ki67-positive cardiomyocytes versus control (Figures 7B and 7C). Studies suggest that the prenylation arm of the MVA pathway is critical for embryonic heart development 61,63,64. Therefore, we used geranylgeranylation (GGTI-298) and farnesylation (FTI-277) inhibitors to determine if impaired prenylation affects eCM cycling. Following the same culture paradigm, isolated eCMs were treated for 24 hours with 1 μM, 5 μM, and 10 μM GGTI-298 and FTI-277 (Figures 7D and 7E). eCM cycling was not affected with 1 μM and 5 μM GGTI-298 however, an ~55% decrease in Ki67-positive CMs was observed at the 10 μM GGTI-298 concentration (Figure 7D). In contrast, treatment with FTI-277 did not alter eCM cycling at any concentration (Figure 7E). These data suggest that MVA pathway regulation of eCM cell cycle is mediated, at least in part, through the protein geranylgeranylation branch of the MVA pathway.
Figure 7: The mevalonate pathway controls embryonic cardiomyocyte cell cycle and signaling.

(A) Schematic of embryonic cardiomyocyte isolation protocol and treatment paradigm.
(B) Immunohistochemical analysis of proliferating (red; Ki67) cardiomyocytes (green; Tropomyosin) following treatment in culture with 10 μM Smv for 24 hours. TMY= tropomyosin.
(C) Quantitation of percent of Ki67-positive cardiomyocytes following treatment in culture with 5 μM, 10 μM, or 25 μM Smv for 24 hours.
(D) Quantitation of percent of Ki67-positive cardiomyocytes following treatment in culture with 1 μM, 5 μM, or 10 μM GGTI-298 for 24 hours.
(E) Quantitation of percent of Ki67-positive cardiomyocytes following treatment in culture with 1 μM, 5 μM, or 10 μM FTI-277 for 24 hours.
(F) Volcano plot depicting genes determined to be differentially expressed genes between vehicle control and 10 μM Smv treated cardiomyocytes. Plots are shown as Log2 fold change (x-axis) plotted against the −log10 of the adjusted p-value (y-axis). Blue dots represent significantly downregulated genes (p-value adj. ≤ 0.05, Log2FC ≤ −0.585). Red dots represent significantly upregulated genes (p-value adj. ≤ 0.05, Log2FC ≥ 0.585).
(G, H) Significantly upregulated (G) or downregulated (H) (p-value adj. ≤ 0.05) GO terms (biological process) associated with differentially expressed genes between vehicle control and 10 μM Smv treated cardiomyocytes. Graphs are shown as GO terms (x-axis), −log10 of the adjusted p-value (left y-axis), and gene count (number of genes in each go term; right y-axis).
(I) Immunohistochemical analysis of nuclear YAP (red) accumulation in cardiomyocytes (green; Tropomyosin) following treatment in culture with 10 μM Smv for 24 hours.
(J) Quantitation of average nuclear YAP intensity in cardiomyocytes following treatment in culture with 10 μM Smv, 10 μM GGTI-298, or 10 μM FTI-277 for 24 hours.
(K) Quantitation of percent of Ki67-positive cardiomyocytes following treatment in culture with 10 μM Smv alone or co-treatment with 10 μM Smv and Lat1/2 inhibitor (Truli) for 24 hours.
For panels C, D, E, J, and K, graphs show values normalized to control. For panels C, D, E, and K, statistical significance is determined by the Kruskal-Wallis test. For panel J, statistical significance is determined by one-way ANOVA. Error bars represent SEM. Scale bars=20 μm.
To define downstream pathways regulated by MVA, we performed transcriptomic analysis (RNA-seq) of control and Smv treated eCMs. A total of 2,468 genes were differentially expressed (p-value adj. ≤ 0.05 and | Log2FC| ≥ 0.585), of which 1,387 are downregulated, and 1,081 are upregulated in 10 μM Smv treated eCMs compared to control (Figure 7F). GO analysis shows upregulated genes significantly associated with metabolic pathways, including “steroid metabolism” and “cholesterol biosynthesis.” Pathways that likely reflect cellular responses to impaired production of MVA pathway metabolites. In addition, a large subset of upregulated genes are associated with the “muscle system” pathway. This pathway includes several essential components of the cardiac sarcomere machinery, including Myh7, Myl2, Myom3, Myoz2, Tcap, and Cmya5 (Figure 7G). In contrast, downregulated genes are enriched for pathways involved in cell cycle regulation, such as “chromosome segregation,” “nuclear division,” and “DNA replication” (Figure 7H). Pathways include regulators of the cell cycle and cellular division, including Bub1, Ccnb1, Ccnb2, and Ccne1. In aggregate, these findings imply the MVA pathway regulates expression of contractile and cycle cell genes and further supports a role for the MVA pathway in eCM development and function.
Studies, primarily in the context of cancer, have demonstrated that the MVA pathway influences cell proliferation by regulating nuclear localization of YAP, a transcription factor that functions downstream of the Hippo pathway 58,59,65,66. While YAP is a well-established regulator of heart proliferation and growth, MVA pathway regulation of YAP has not been demonstrated in cardiomyocytes 67,68. To this end, we examined the effects of MVA pathway inhibition on YAP nuclear localization in eCMs. We find that 10 μM Smv treatment results in an ~25% decrease in YAP nuclear localization (Figures 7I and 7J). Consistently, a subset of YAP target genes were significantly downregulated in eCMs treated with Smv, including Ctgf, Cyr61, and Aurkb (Figure 7F). Although the mechanism by which the MVA pathway regulates YAP is not fully understood, it is proposed that Rho GTPases, which require geranylgeranylation for their activity, mediate alterations in YAP nuclear localization. Consistently, we show that inhibiting geranylgeranylation (10 μM GGTI-298) but not farnesylation (10 μM FTI-298) results in an ~20% decrease in YAP nuclear localization (Figure 7J). Together these findings suggest that the MVA pathway modulates YAP signaling in eCMs at least partly through a geranylgeranylation-dependent mechanism.
Based on our findings, we hypothesize that MVA controls eCM cell cycle in part by modulating YAP activity. We queried if restoring YAP activity can rescue the impaired eCM cycling in response to Smv treatment. Phosphorylation of YAP impairs its nuclear localization and, thus, transcriptional activity. Lats1/2 are the primary kinases that mediate YAP phosphorylation and its subsequent degradation. Therefore, to induce YAP nuclear localization in eCMs, we took advantage of a pharmacological inhibitor of Lats1/2 (Truli), which was demonstrated to increase nuclear YAP activity and proliferation in postnatal cardiomyocytes in vitro 69. eCMs were pretreated with control media or media containing 10 μM Smv for 6hrs to ensure inhibition of the MVA pathway. Following pretreatment, eCMs were treated with control media, 10 μM Smv, or co-treated with 10 μM Smv and 20 μM Truli for 24 hours. Results show that Smv treatment alone results in a decrease in Ki67-positive eCMs compared to control. In contrast, the percentage of Ki67-positive eCMs after Smv and Truli co-treatment is comparable to control (Figure 7K). These data suggest MVA pathway modulation of YAP activity as a potential mechanism by which this pathway regulates eCM cycling. Collectively, our dataset enabled us to identify temporal protein expression patterns of MVA pathway components during embryonic heart development. Using this information, we predicted a developmental timepoint in which MVA regulates the cell cycle and YAP signaling in eCMs. In summary, this study exemplifies how our proteomic dataset can be used to identify and investigate pathways essential for embryonic heart development.
DISCUSSION
Here we used high-throughput quantitative proteomics to measure temporal changes in cardiac proteomes at eight critical stages of development. We identified ~7,300 proteins, assessed global temporal changes in protein expression, identified cardiac protein interaction networks, and linked protein dynamics with molecular pathways. In addition, we examined the temporal protein expression patterns of 185 CHD-associated proteins. Finally, we provide evidence of a function for the mevalonate (MVA) pathway in embryonic cardiomyocytes (eCMs), a demonstration of how our dataset can be harnessed to investigate essential pathways that function in heart development.
Investigating the cardiac proteome at early stages of embryonic heart development.
Delineating the temporal expression of protein networks and cellular pathways during critical stages of heart development is essential to understand the mechanisms that drive cardiac morphogenesis. Our pairwise (E9.5 versus E11.5) and global temporal profiling analyses revealed unique biological pathways that are significantly upregulated early in cardiac development, including chromosome organization, cell-cycle, ribosome biogenesis, and septum development (Figures 3, 4, and S3); results broadly consistent with Gu et al. (2022) 70. Intriguingly, within the chromosome organization pathway, we identified a network of proteins associated with the BAF, MOZ/MORF, and Polycomb repressive chromatin-modifying complexes. These repressive complexes are known regulators of differentiation and maturation of the embryonic heart 39,40,46,47,71. The BAF complex regulates cardiac differentiation decisions by systematically altering the subunit composition of the complex 42. Changes in subunit protein abundance constitute a primary mechanism that drives alterations in BAF complex composition. In agreement with these findings, we found that the BAF components SMARCD1, SMARCB1, and SMARCA1 but not SMARCA4, SMARCA2, and SMARCD3 are significantly upregulated at E9.5 versus E11.5, demonstrating BAF complex subunits have distinct temporal expression profiles during embryonic cardiac development (Figure S4, Table S2). These findings highlight how our comprehensive proteomics dataset can be used to examine temporal protein expression dynamics of essential protein complexes during cardiac morphogenesis.
Interestingly, our data revealed that a large number of proteins involved in ribosome biogenesis had peak protein abundance at early time points, then decreased rapidly (Figures 3B, 4B, and S3C). Ribosome biogenesis is a key means to control total protein synthesis and thereby regulate functions such as cell growth, proliferation, and differentiation. Aberrant ribosome biogenesis is associated with many congenital disorders referred to as ribosomopathies, some of which present with congenital heart defects 50,51. Recent studies using embryonic stem cell-derived cardiomyocytes suggest that downregulation of ribosome biogenesis and global protein synthesis are required for cardiomyocyte maturation 72. Taken together, our data imply that strict regulation of ribosome biogenesis is essential for heart development. In addition, these data highlight our dataset as a resource for investigating the function of ribosome biogenesis during heart development and disease.
Investigating the cardiac proteome at late stages of embryonic heart development.
During embryogenesis, rapid growth and increased contractility of the heart are accompanied by drastic changes in cardiac metabolic activity. This metabolic change is best exemplified by the shift from glucose metabolism to oxidative phosphorylation that initiates during mid-to-late-gestation 73–75. Our data showed an overwhelming representation of proteins associated with metabolic pathways are upregulated at later stages of embryonic heart development (E13.5-E16.5), including energy metabolism, fatty acid oxidation, and oxidative phosphorylation (Figures 3C, 3F, 4B, S3, and S4). Interestingly, although we observed many metabolic proteins with peak abundances at late stages (i.e., E16.5) of heart development (Figure 4B), our data revealed a significant increase in proteins involved in glycolysis and fatty acid oxidation as early as E11.5 (Figures 3C and S3). Alterations in cardiac metabolism are not only important for increased energy demands as the heart grows; they also influence morphogenic processes, including heart looping, myocardium development, and chamber septation 73,76,77. Similarly, perturbations in oxidative phosphorylation are associated with severe cardiac defects and embryonic lethality 74,78. Although temporal changes in cardiac metabolism are essential for proper heart development, the mechanisms of this process are understudied. This dataset provides a foundation for further examining these processes.
Mevalonate pathway proteins are dynamically expressed during heart development.
Investigation of dynamically expressed proteins during midgestation (Cluster 4, 5, and 6) suggested a function for the MVA pathway in heart development. The MVA pathway is an essential metabolic pathway composed of two branches that regulate cholesterol biosynthesis and protein prenylation. Previous studies in Drosophila and zebrafish show the MVA pathway is essential for heart development 63,64. In addition, alterations in the MVA pathway are associated with a wide range of adult cardiovascular diseases, including cardiac hypertrophy, fibrosis, and endothelial cell dysfunction (Table 1) 79,80. Our work revealed insights into the temporal expression dynamics of key MVA proteins. We find core MVA enzymes display peak protein abundance between E11.5- E13.5 (Figures 6A, 6B), proteins involved in cholesterol biosynthesis are more abundant at early stages (Cluster 2), and proteins that mediate prenylation show peak abundance at later stages (Cluster 8) (Figures 6C, 6D, and 6E). This finding suggested that the two branches of the MVA pathway are temporally controlled, and each branch may contribute to specific developmental processes during cardiogenesis.
Table 1:
Mevalonate Pathway Proteins Associated with Cardiovascular Disease
| Protein | Cluster Number | Cardiovascular Disease | Reference |
|---|---|---|---|
| Mevalonate Pathway Proteins | |||
| HMGCR | 2 | Coronary heart disease, stroke, diastolic dysfunction, impaired heart formation | Yi et al.63, D’amico et al.64, Yeganeh et al.79, Zhang et al.80 |
| FDFT1 | 2 | Coronary heart disease | Engert et al.84, Soemedi et al.85 |
| FDPS (FPPS) | 5 | Cardiac hypertrophy, fibrosis, LV dysfunction | Yang et al.86 |
| MVK | 5 | Coronary heart disease, ischemic stroke | Wang et al.87, Miao et al. 88 |
| GGPS1 | 8 | Impaired ventricular chamber maturation, postnatal cardiac hypertrophy, | Chen et al.61, Xu et al.89 |
| Prenylated Proteins | |||
| HRAS | NSD | Costello syndrome phenotype, cardiac hypertrophy, valve defects, fibrosis | Aoki et al.90, Schuhmacher et al.91, Gelb et al.92 |
| KRAS | NSD | Noonan syndrome phenotype, cardiac hyperplasia, valve defects | Schubbert et al.93, Tartaglia et al.94, Razzaque et al.95, Hemändez-Porras et al.96 |
| RHOA | NSD | Coronary artery disease, ventricular hypertrophy, cardiac conduction system defects, atrial defects, ventricular dilation, cardiac looping defects | Wei et al.97, 98, Nelson et al.99 |
| RAP1B | NSD | Atherosclerosis, cardiac hypertrophy | Alonso-Orgaz et al.100, Lakshmikanthan et al.101 |
| STK11 | NSD | Coronary artery disease | Ma et al.102 |
| RAC1 | 8 | ASD, VSD, OFT defects, DORV defects, bifid apex, impaired ventricular chamber maturation | Leung et al.103–105 |
| CDC42 | 8 | VSD, impaired ventricular chamber maturation | Li et al.106, 107 |
| LMNA | 8 | Dilated cardiomyopathy, conduction system defects, fibrosis, Malouf syndrome | Arimura et al.108, Wang et al.109, Lu et al.110 |
AVSD = atrioventricular septal defect, VSD= ventricular septal defects, TOF= Tetralogy of Fallot, ASD= atrial septal defect, BAV= bicuspid aortic valve, OFT= outflow tract, DORV= double outlet right ventricle, Cluster number is related to figure 4. NSD= proteins identified in our dataset that do not display differential protein expression.
In our studies using isolated E12.5 cardiomyocytes, we demonstrate the MVA pathway regulates eCM cell cycle (Figures 7B–7E). These findings are supported by a recent study that identified the MVA pathway as a regulator of CM proliferation in human pluripotent stem cell-derived cardiac organoids 62. Additionally, Chen et al.61 reported that, in the embryonic heart, conditional loss of geranylgeranyl pyrophosphate synthase (GGPS1KO), an MVA pathway enzyme that regulates the production of isoprenoids used for protein prenylation, resulted in decreased CM proliferation, impaired ventricular maturation and embryonic lethality by E13.5. While it is unclear if the proliferation phenotype observed in the GGPS1KO is a consequence of altered geranylgeranylation in CMs alone or due to changes in other cardiac cell types, our data suggests geranylgeranylation of cardiac proteins has direct effects on eCM proliferation.
Previous research, primarily in cancer studies, showed that the MVA pathway regulates cell proliferation through modulation of YAP/TAZ signaling 58,59,65,66. More recently, Chong et al.81 showed that MVA pathway regulation of vascular endothelial proliferation was mediated by control of YAP signaling. This finding is of particular significance because YAP/TAZ signaling regulates cardiomyocyte proliferation, embryonic heart morphogenesis, and cardiac regeneration 67,68. Our studies show that inhibition of the MVA pathway impairs YAP nuclear localization in eCMs. Therefore, we suggest that YAP regulation is a mechanism by which the MVA pathway controls eCM proliferation.
A recent study of postnatal heart development demonstrated that expression of a subset of MVA pathway genes are downregulated during the first postnatal week. Interestingly, this study showed that treatment of postnatal rat cardiomyocytes with simvastatin did not affect proliferation 82. In contrast, Mills et al. showed long-term postnatal treatment (2 weeks) with simvastatin in vivo resulted in decreased cardiomyocyte proliferation at postnatal day 25. However, it is unclear if changes in cardiomyocyte proliferation were direct or the result of altered function of other cardiac cell types 62. Of note, the mechanisms controlling cell cycle regulation and proliferation are significantly different between embryonic and postnatal cardiomyocytes. Therefore, the function of the MVA pathway may depend on the age of the heart 83. In the future, it will be interesting to dissect differences in MVA pathway function in embryonic versus postnatal heart development.
Overall, we have generated a comprehensive proteomic dataset of the murine embryonic heart. Our temporal cardiac proteome profiling and functional studies of the MVA pathway exemplify how our quantitative proteomics dataset can identify pathways that are essential for embryonic heart development. This work provides a critical resource to study fundamental mechanisms of cardiac development and serves as a “blueprint” for investigating changes in the cardiac proteome associated with CHD.
Limitations of the study
Our study investigates global protein expression dynamics in whole embryonic hearts. In the future, with the advancement of proteomic technologies, it will be critical to delineate protein expression dynamics in a cell-type and region-specific manner.
METHODS
Resource availability:
Lead contact:
Further information and requests for resources should be directed to and will be fulfilled by the Lead Contact, Frank L. Conlon (frank_conlon@med.unc.edu).
Materials availability:
This study did not generate any new unique reagents.
Data and code availability:
The RNA-seq raw data has been deposited at the GEO repository and the accession numbers are listed in the key resources table. The MS Proteomics data, including the MS raw files, have been deposited at the ProteomeXchange Consortium repository, and the identifier is listed in the key resources table.
| REAGENT or RESOURCE | SOURCE | IDENTIFIER |
|---|---|---|
| Antibodies | ||
| Tropomyosin (CH1) | DSHB | CH1 |
| Ki67 | abcam | ab15580 |
| YAP | Cell Signaling | 49125 |
| GGPS1 | Proteintech | 14944–1-AP |
| HMGCR | ThermoFisher | MA5–31335 |
| Alexa Flour 488 Goat anti-Mouse | Invitrogen | A11001 |
| Alexa Flour 546 Goat anti-Rabbit | Invitrogen | A11035 |
| Chemicals, peptides, and recombinant proteins | ||
| TCEP | ThermoFisher | 77720 |
| Chloroacetamide | Sigma | 22790 |
| Protease inhibitor | Sigma | P8340 |
| Phosphatase inhibitor cocktail 2 | Sigma | P5726 |
| Phosphatase inhibitor cocktail 3 | Sigma | P0044 |
| BDM (2,3-Butanedione monoxime) | Sigma | B0753 |
| Collagenase/Dispase | Sigma | 1026963800 |
| 1x trypsin solution (0.25%) with EDTA | Gibco | 25300–054 |
| DMEM high glucose | Sigma | D6429 |
| M-199 | ThermoFisher | MT10060CV |
| Fetal bovine serum (FBS) | VWR | 97068–85 |
| Horse serum | Gibco | 16050–122 |
| Leibovitz L-155 | Corning | 10–045-CV |
| 0.1% collagen solution | Sigma | C8919 |
| Normal goat serum | Sigma | 526 |
| Simvastatin | Sigma | S6196 |
| GGTI-298 | Tocris | 24–301 |
| FTI-277 | Tocris | 24–071 |
| Truli | Axon MedChem | Axon 3276 |
| Critical commercial assays | ||
| TSA Cyanine 3 Kit | Akoya Biosciences | NEL704A001KT |
| BCA Assay | ThermoFisher | 23225 |
| RNAqueous-Micro Total RNA Isolation Kit | ThermoFisher | AM1931 |
| Deposited data | ||
| MS/MS Raw files and MaxQuant analysis files | This paper | PXD032312 |
| RNA-seq raw data for E9.5, E10.5, E12.5, E14.5 and E16.5 C57BL/6J hearts | This paper | GEO: GSE223239 |
| RNA-seq raw data for E12.5 isolated cardiomyocytes treated with simvastatin | This paper | GEO: GSE223239 |
| Experimental models: Organisms/strains | ||
| Mouse strain wild type C57BL/6J | The Jackson Laboratory | Stock No: 000664 |
| Software and algorithms | ||
| CellProfiler | Broad Institute | https://cellprofiler.org/ |
| BioRender | BioRender | https://biorender.com/ |
| GraphPad Prism | Prism | https://www.graphpad.com/ |
| Proteome Discover 2.4 | Thermo Scientific | N.A. |
| Cytoscape with ClueGO and STRING plugin | Cytoscape | https://cvtoscape.org/ |
This paper does not report original code.
Any additional information required to reanalyze the data reported in this paper is available from the Lead contact upon request.
Experimental model and subject details:
Mice:
The Institutional Animal Care and Use Committee of the University of North Carolina approved all animal procedures and protocols, conformed to the Guide for the Care and Use of Laboratory Animals. C57BL/6J male and female mice breed for timed-matings were obtained from The Jackson Laboratory (Stock No: 000664). For timed-matings, detection of vaginal plug in the morning is defined as embryonic day 0.5. Mice were housed in plastic cages at controlled temperatures of 25 ± 1C, on a 12-h light/12-h dark cycle, with lights on from 07:00– 19:00. Standard rodent chow and water were provided throughout the study period.
METHOD DETAILS:
Sample preparation for proteomics analysis:
Pregnant dams were sacrificed and subjected to transcardial perfusion with heparinized phosphate buffer saline to prevent blood coagulation. Embryonic hearts were dissected into HEPES buffer (20 mM HEPES, 1.2% PVP, pH 7.4) and snap-frozen in liquid nitrogen, and stored at −80°C. To perform the protein extraction, hearts were thawed on ice and resuspended in lysis buffer (50 mM Tris-HCl pH 8.0, 100 mM NaCl, 0.5 mM EDTA, 2% SDS) supplemented with protease inhibitor and phosphatase inhibitors 2 and 3 (Sigma). Samples were subjected to dounce homogenization. Subsequently, samples were heated at 95°C for 5 minutes, followed by sonication. Heating and sonication steps were repeated three times. Samples were centrifuged at 2000 x g for 5 minutes at room temperature to remove insoluble debris. Protein concentrations were determined by BCA assay. Fifty μg of protein was reduced and alkylated with 20 mM tris(2-carboxyethyl) phosphine and 20 mM chloroacetamide, respectively, for 20 minutes at 70°C. Samples were then precipitated using a methanol/chloroform protocol. Protein pellets were snap-frozen in liquid nitrogen and stored at −80°C. Three biological replicates were collected for each embryonic age.
Protein pellets were reconstituted with 2 M urea in 50 mM ammonium bicarbonate, reduced with 5 mM DTT at 56°C for 30 minutes, then alkylated with 15 mM iodoacetamide at room temperature in the dark for 45 minutes. The samples were subjected to digestion with LysC (Wako) for 2 h and trypsin (Promega) overnight at 37°C at a 1:50 enzyme: protein ratio. The resulting peptide samples were acidified, and desalted using Thermo desalting spin columns, then the eluates were dried via vacuum centrifugation. Peptide concentration was determined using Pierce Quantitative Colorimetric Peptide Assay. Fifteen μg of each sample was reconstituted with 50 mM HEPES pH 8.5, then individually labeled with 90 μg TMT 10plex reagent (Thermo Fisher) for 1 hour at room temperature. A pooled sample was created by combining a small amount of each sample and then split into two aliquots, which were each labeled with two different TMT tags and used in all three TMT sets. Prior to quenching, the labeling efficiency was evaluated by LC-MS/MS analysis of a pooled sample consisting of 1 ul of each sample. After confirming >98% efficiency, samples were quenched with 50% hydroxylamine to a final concentration of 0.4%. Labeled peptide samples were combined, desalted using Thermo desalting spin column, and dried via vacuum centrifugation. The dried TMT-labeled samples (three TMT sets total) were fractionated using high pH reversed phase HPLC 111. Briefly, the samples were offline fractionated over a 90 min run into 96 fractions by high pH reverse-phase HPLC (Agilent 1260) using an Agilent Zorbax 300 Extend-C18 column (3.5-μm, 4.6 × 250 mm) with mobile phase A containing 4.5 mM ammonium formate (pH 10) in 2% (vol/vol) LC-MS grade acetonitrile, and mobile phase B containing 4.5 mM ammonium formate (pH 10) in 90% (vol/vol) LC-MS grade acetonitrile. The 96 resulting fractions were concatenated in a noncontinuous manner into 24 fractions. The 24 fractions were dried via vacuum centrifugation.
LC/MS/MS:
Three sets of 24 fractions were analyzed by LC/MS/MS using an Easy nLC 1200 coupled to an Orbitrap Fusion Lumos Tribrid mass spectrometer (Thermo Scientific) using a multi-notch MS3 method 112 (reference: https://pubmed.ncbi.nlm.nih.gov/24927332/). Samples were injected onto an Easy Spray PepMap C18 column (75 μm id × 25 cm, 2 μm particle size) (Thermo Scientific) and separated over a 120 min method. The gradient for separation consisted of 5–42% mobile phase B at a 250 nl/min flow rate, where mobile phase A was 0.1% formic acid in water and mobile phase B consisted of 0.1% formic acid in 80% ACN. The Lumos was operated in SPS-MS3 mode with a cycle time of 3s. Resolution for the precursor scan (m/z 350–1600) was set to 120,000 with an AGC target set to standard and a maximum injection time of 50 ms. MS2 scans consisted of CID normalized collision energy (NCE) 30; AGC target set to standard; maximum injection time of 50 ms; isolation window of 0.7 Da. Following MS2 acquisition, MS3 spectra were collected in SPS mode (10 scans per outcome); HCD set to 65; resolution set to 50,000; scan range set to 100–500; AGC target set to 200% with a 105 ms maximum inject time.
Cardiomyocyte isolation and treatment:
Cardiomyocytes were isolated from E12.5 embryonic hearts according to a previously published protocol 113. Briefly, hearts were harvested and washed in 1X PBS supplemented with 20 mM BDM. Hearts were then minced and incubated in isolation medium (20 mM BDM, 0.0125% trypsin in HBSS (without Ca2+, Mg2+)) overnight at 4°C. The following day the predigested hearts were transferred to digestion medium (20 mM BDM, 1.5 mg/ml Roche Collagenase/Dispase enzyme mix in L15 medium) and were incubated at 37°C for 20 minutes with gentle shaking. Tissue fragments were triturated 20 times, and the cell suspension was strained. Cells were centrifugated at 800 x g for 5 minutes. The supernatant was removed, and cells were resuspended in 10 ml of plating medium (65% DMEM high glucose, 19% M-199, 10% horse serum, 5% fetal calf serum, 1% penicillin/streptomycin) and plated into a 10 cm cell culture dish. Cells were incubated at 37°C for 3 hours to allow adherence of non-cardiomyocyte cells. After incubation, the media containing the non-adherent cardiomyocytes was removed and transferred to a 15 ml conical Falcon tube. Cells were centrifuged at 800 x g for 10 minutes, and cells were resuspended in 2 ml of plating media. Cells were seeded onto collagen-coated 8-well chamber slides or 96-well glass bottom plates. The following day the cell media was replaced with maintenance media (78% DMEM high glucose, 17% M-199, 4% horse serum, and 1% penicillin/streptomycin). Cells were then treated with maintenance media containing vehicle (control) or the following compounds for 24 hours; 5μM, 10 μM, and 25μM simvastatin, or 1μM, 5μM, and 10μM GGTI-298, or 1μM, 5μM, and 10μM FTI-277. For Simvastatin and Lats1/2 inhibitor (Truli) co-treatment experiments, cells were pretreated with control or 10μM simvastatin for 6hrs. Following pretreatment, cells were treated with either control, 10μM Simvastatin alone, or 10μM Simvastatin and 20μM Truli.
Immunohistochemistry:
For immunochemical analysis of isolated cardiomyocytes, cells were fixed with 1% paraformaldehyde in 1X PBS for 15 minutes at room temperature, permeabilized with 0.2 % Triton X-100 in 1X PBS for 10 minutes at room temperature and incubated with blocking buffer (3% Normal Goat serum, 0.05% Triton X-100 in 1X PBS) for 1 hour at room temperature. Cells were then incubated with primary antibody in antibody buffer (1% Normal Goat serum, 0.05% Triton X-100 in 1X PBS) overnight at 4°C. The following day cells were incubated in secondary antibody diluted in IHC antibody buffer for 1 hour at room temperature and subsequently counterstained with 200 ng/ml 4′,6-diamidino-2-phenylindole (DAPI) for 10 minutes at room temperature.
For immunohistochemical analysis of HMGCR and GGPS1 embryonic heart tissue, embryos were harvested and fixed in 4% PFA overnight at 4°C, dehydrated though an increasing gradient of methanol/PBS, and paraffin-embedded. Paraffin sections (10 μm) were dewaxed and rehydrated. Immunohistological detection of HMGCR and GGPS1 was performed using tyramide signal amplification (TSA) kit according to the manufacturer’s protocol. Sections were counterstained with DAPI and mounted with ProLong Diamond Antifade Mountant.
RNA-sequencing analysis:
For transcriptomic analysis of embryonic day 9.5, E10.5, E12.5, E14.5, and E16.5 heart, whole hearts were dissected in ice-cold PBS and stored in RNAlater at −20°C until processing (N=3–4 biological replicates per age). Hearts were pooled for each biological replicate for E9.5 (6 hearts per replicate) and E10.5 (3 hearts per replicate). For transcriptomic analysis of isolated cardiomyocytes, treated cells were washed with 1X PBS and stored in RNAlater at 4°C until processed (N= 4 biological replicates). Total RNA was isolated using RNAqueous Micro Total RNA Isolation Kit. RNA-seq library preparation and sequencing reactions were conducted at AZENTA, LLC.
QUANTIFICATION AND STATISTICAL ANALYSIS
TMT-MS data processing:
Raw data files were processed using Proteome Discoverer version 2.4, set to ‘reporter ion MS3’ with ‘10plex TMT’. Peak lists were searched against a reviewed Uniprot mouse database (downloaded May 2019 containing 17,457 sequences), appended with a common contaminants database, using Sequest HT within Proteome Discoverer. All fractions were searched with up to two missed trypsin cleavage sites, fixed modifications: TMT6plex peptide N-terminus and Lys, carbamidomethylation Cys, dynamic modification: N-terminal protein acetyl, oxidation Met. Precursor mass tolerance of 5ppm and fragment mass tolerance of 0.4 Da. Peptide false discovery rate was set to 1%. Reporter abundance based on intensity, SPS mass matches threshold set to 50, and razor and unique peptides were used for quantitation. Data were further analyzed in R.
Protein identification, quantification, and statistical analysis:
Proteins selected for quantification were filtered based on the following criteria: 1) 1% False discovery rate, 2) greater than two unique peptides detected, 3) at least one unique peptide is present in each of the six pooled reference channels, and 4) the protein was detected in all three biological replicates in at least one sample group. Using the final list of filtered proteins (N = 7313), imputation was performed with the R function QRILC in the imputeLCMD package (https://rdrr.io/cran/imputeLCMD/).
Sample loading (SL) and internal reference scaling (IRS) normalization were performed as previously described 14. Briefly, to correct for SL differences, reporter ion intensities were normalized within each 10-plex experiment by multiplying a global scaling factor to adjust the total ion intensity for each channel. To normalize reporter ion intensities between each TMT 10-plex (3 total), an IRS factor was calculated. For each protein, three reference intensities are calculated using the pooled reference samples from each TMT 10-plex. The three reference intensities are then averaged, and an IRS factor is computed for each protein. The IRS factor was then used to adjust reporter ion intensities for each protein in each TMT experiment.
Bioinformatic and statistical analyses were performed in R environment v4.0.2/Bioconductor v3.11. To determine differential protein abundances across each age, pairwise statistical testing (versus E9.5) was performed using DEqMS (https://bioconductor.org/packages/release/bioc/html/DEqMS.html ). Proteins with a |Log2FC| ≥ 0.585 (FC, fold change) and spectral count adjusted (sca) p-value ≤ 0.01 at least one age were considered differentially expressed. Functional over-representation of biological processes analysis of differentially expressed proteins was performed using clusterProfiler package (https://bioconductor.org/packages/release/bioc/html/clusterProfiler.html). The principal component analysis (PCA) and heatmap generation were performed on the web-based version of ClustVis (https://biit.cs.ut.ee/clustvis_large/). Volcano plots were constructed using EnhancedVolcano (https://bioconductor.org/packages/release/bioc/html/EnhancedVolcano.html)
Protein interaction network diagrams incorporating known functional and physical protein interactions were generated using Cytoscape with the STRING database plugin (Kappa score ≥ 0.4). For functional analysis of proteins identified as differentially expressed from pairwise comparisons of E9.5 vs. E11.5 and E12.5 vs. E16.5, the ClueGo plugin in Cytoscape was used to generate pie charts of significantly enriched (p-value ≤ 0.001) gene ontology terms. Pie charts represent the percent of gene ontology terms per group.
For multiomic analysis of TMT-based proteome abundances, we calculated protein copy number per cell using the proteomic ruler technique, which performs a protein size and detectability correction, then scales values “per cell” based on the MS signal of histones 114. Since protein abundance data were previously normalized by SL-IRS approach, no additional normalization was performed prior to the proteomic ruler transformation.
RNA-sequencing analysis:
Sequence reads were trimmed to remove possible adapter sequences and nucleotides with poor quality using Trimmomatic v.0.36. The trimmed reads were mapped to the Mus musculus GRCm38 reference genome available on ENSEMBL using the STAR aligner v.2.5.2b. Unique gene hit counts were calculated by using featureCounts from the Subread package v.1.5.2. The hit counts were summarized and reported using the gene_id feature in the annotation file. Only unique reads that fell within exon regions were counted. If a strand-specific library preparation was performed, the reads were strand-specifically counted. DESeq2 was used to identify differentially expressed genes. The Wald test was used to generate p-values and log2 fold changes. Genes with an adjusted p-value < 0.05 and absolute log2 fold change > 0.585 are considered differentially expressed for each comparison.
Immunohistochemistry image quantitation:
For quantitation of the percent of Ki67-positive cardiomyocytes and YAP nuclear localization, cells were imaged at 20X magnification. At least three biological replicates were performed for each experiment, and at least 100 cells were analyzed for each replicate. CellProfiler was used for image processing and data analysis. Statistical significance was determined by the Kruskal-Wallis test for analysis of Ki67-positive cardiomyocytes. Statistical significance was determined by a one-way ANOVA test for analysis of YAP nuclear localization.
Supplementary Material
Supplementary Table 1: Master table of all identified and quantified proteins. Related to Figure 1.
Supplementary Table 2: Statistical analysis of differentially expressed proteins. Related to Figure 1.
Supplementary Table 3: Hierarchical clustering heatmap input and computed values. Related to Figures 4A and 4B.
Highlights.
Quantitative proteomic profiling of eight stages of murine embryonic heart development.
Comprehensive analysis of cardiac protein dynamics, networks, and pathways.
The mevalonate pathway enzymes are dynamically expressed during cardiogenesis.
The mevalonate pathway regulates embryonic cardiomyocyte cycling and YAP signaling.
ACKNOWLEDGEMENTS
We would like to acknowledge Olivia K. Bussey and Thidar Aye for their technical assistance. The Microscopy Services Laboratory, Department of Pathology and Laboratory Medicine, is supported in part by P30 CA016086 Cancer Center Core Support Grant to the UNC Lineberger Comprehensive Cancer Center. This work was supported by grants, R01HL156424 NIH /NHLBI and R01HD089275 NIH/NHLBI to F.L.C. and I.M.C., American Heart Association postdoctoral fellowship (829785) and K12GM000678 NIH/NIGMS funded to W.E., R35GM133460 funded to S.C., and F32GM136027 funded to G.E.M.
INCLUSION AND DIVERSITY
We support inclusive, diverse, and equitable conduct of research. One or more of the authors of this paper self-identifies as an underrepresented ethnic minority in science.
Footnotes
DECLARATION OF INTERESTS
The authors declare no competing interests.
Publisher's Disclaimer: This is a PDF file of an unedited manuscript that has been accepted for publication. As a service to our customers we are providing this early version of the manuscript. The manuscript will undergo copyediting, typesetting, and review of the resulting proof before it is published in its final form. Please note that during the production process errors may be discovered which could affect the content, and all legal disclaimers that apply to the journal pertain.
REFERENCES
- 1.Hoffman JIE, and Kaplan S (2002). The incidence of congenital heart disease. J. Am. Coll. Cardiol. 39, 1890–1900. 10.1016/S0735-1097(02)01886-7. [DOI] [PubMed] [Google Scholar]
- 2.Reller MD, Strickland MJ, Riehle-Colarusso T, Mahle WT, and Correa A (2008). Prevalence of congenital heart defects in metropolitan Atlanta, 1998–2005. J. Pediatr. 153, 807–813. 10.1016/J.JPEDS.2008.05.059. [DOI] [PMC free article] [PubMed] [Google Scholar]
- 3.Gilboa SM, Devine OJ, Kucik JE, Oster ME, Riehle-Colarusso T, Nembhard WN, Xu P, Correa A, Jenkins K, and Marelli AJ (2016). Congenital Heart Defects in the United States: Estimating the Magnitude of the Affected Population in 2010. Circulation 134, 101–109. 10.1161/CIRCULATIONAHA.115.019307. [DOI] [PMC free article] [PubMed] [Google Scholar]
- 4.Bruneau BG (2002). Transcriptional regulation of vertebrate cardiac morphogenesis. Circ. Res. 90, 509–519. 10.1161/01.RES.0000013072.51957.B7. [DOI] [PubMed] [Google Scholar]
- 5.Kirby ML, and Waldo KL (2002). Molecular embryogenesis of the heart. Pediatr. Dev. Pathol. 5, 516–543. 10.1007/S10024-002-0004-2. [DOI] [PubMed] [Google Scholar]
- 6.Savolainen SM, Foley JF, and Elmore SA (2009). Histology atlas of the developing mouse heart with emphasis on E11.5 to E18.5. Toxicol. Pathol. 37, 395–414. 10.1177/0192623309335060. [DOI] [PMC free article] [PubMed] [Google Scholar]
- 7.Kelly RG, Buckingham ME, and Moorman AF (2014). Heart fields and cardiac morphogenesis. Cold Spring Harb. Perspect. Med. 4. 10.1101/CSHPERSPECT.A015750. [DOI] [PMC free article] [PubMed] [Google Scholar]
- 8.Krishnan A, Samtani R, Dhanantwari P, Lee E, Yamada S, Shiota K, Donofrio MT, Leatherbury L, and Lo CW (2014). A detailed comparison of mouse and human cardiac development. Pediatr. Res. 76, 500–507. 10.1038/PR.2014.128. [DOI] [PMC free article] [PubMed] [Google Scholar]
- 9.Paik DT, Cho S, Tian L, Chang HY, and Wu JC (2020). Single-cell RNA sequencing in cardiovascular development, disease and medicine. Nat. Rev. Cardiol. 17, 457–473. 10.1038/S41569-020-0359-Y. [DOI] [PMC free article] [PubMed] [Google Scholar]
- 10.Samad T, and Wu SM (2021). Single cell RNA sequencing approaches to cardiac development and congenital heart disease. Semin. Cell Dev. Biol. 118, 129–135. 10.1016/J.SEMCDB.2021.04.023. [DOI] [PMC free article] [PubMed] [Google Scholar]
- 11.Nie L, Wu G, Culley DE, Scholten JCM, and Zhang W (2007). Integrative analysis of transcriptomic and proteomic data: challenges, solutions and applications. Crit. Rev. Biotechnol. 27, 63–75. 10.1080/07388550701334212. [DOI] [PubMed] [Google Scholar]
- 12.Chick JM, Munger SC, Simecek P, Huttlin EL, Choi K, Gatti DM, Raghupathy N, Svenson KL, Churchill GA, and Gygi SP (2016). Defining the consequences of genetic variation on a proteome-wide scale. Nat. 2016 5347608 534, 500–505. 10.1038/nature18270. [DOI] [PMC free article] [PubMed] [Google Scholar]
- 13.De Sousa Abreu R, Penalva LO, Marcotte EM, and Vogel C (2009). Global signatures of protein and mRNA expression levels. Mol. Biosyst. 5, 1512–1526. 10.1039/B908315D. [DOI] [PMC free article] [PubMed] [Google Scholar]
- 14.Plubell DL, Wilmarth PA, Zhao Y, Fenton AM, Minnier J, Reddy AP, Klimek J, Yang X, David LL, and Pamir N (2017). Extended Multiplexing of Tandem Mass Tags (TMT) Labeling Reveals Age and High Fat Diet Specific Proteome Changes in Mouse Epididymal Adipose Tissue. Mol. Cell. Proteomics 16, 873–890. 10.1074/MCP.M116.065524. [DOI] [PMC free article] [PubMed] [Google Scholar]
- 15.Zecha J, Satpathy S, Kanashova T, Avanessian SC, Kane MH, Clauser KR, Mertins P, Carr SA, and Kuster B (2019). TMT Labeling for the Masses: A Robust and Cost-efficient, In-solution Labeling Approach. Mol. Cell. Proteomics 18, 1468–1478. 10.1074/MCP.TIR119.001385. [DOI] [PMC free article] [PubMed] [Google Scholar]
- 16.Pappireddi N, Martin L, and Wühr M (2019). A Review on Quantitative Multiplexed Proteomics. Chembiochem 20, 1210–1224. 10.1002/CBIC.201800650. [DOI] [PMC free article] [PubMed] [Google Scholar]
- 17.Hirschy A, Schatzmann F, Ehler E, and Perriard JC (2006). Establishment of cardiac cytoarchitecture in the developing mouse heart. Dev. Biol. 289, 430–441. 10.1016/J.YDBIO.2005.10.046. [DOI] [PubMed] [Google Scholar]
- 18.de Boer BA, van den Berg G, de Boer PAJ, Moorman AFM, and Ruijter JM (2012). Growth of the developing mouse heart: An interactive qualitative and quantitative 3D atlas. Dev. Biol. 368, 203–213. 10.1016/J.YDBIO.2012.05.001. [DOI] [PubMed] [Google Scholar]
- 19.Guo Y, and Pu WT (2020). Cardiomyocyte Maturation. Circ. Res, 1086–1106. 10.1161/CIRCRESAHA.119.315862. [DOI] [PMC free article] [PubMed] [Google Scholar]
- 20.Liang X, Wang G, Lin L, Lowe J, Zhang Q, Bu L, Chen Y, Chen J, Sun Y, and Evans SM (2013). HCN4 dynamically marks the first heart field and conduction system precursors. Circ. Res. 113, 399–407. 10.1161/CIRCRESAHA.113.301588. [DOI] [PMC free article] [PubMed] [Google Scholar]
- 21.Wu M, Peng S, and Zhao Y (2014). Inducible gene deletion in the entire cardiac conduction system using Hcn4-CreERT2 BAC transgenic mice. Genesis 52, 134–140. 10.1002/dvg.22730. [DOI] [PMC free article] [PubMed] [Google Scholar]
- 22.Liang X, Evans SM, and Sun Y (2015). Insights into cardiac conduction system formation provided by HCN4 expression. Trends Cardiovasc. Med. 25, 1–9. 10.1016/j.tcm.2014.08.009. [DOI] [PMC free article] [PubMed] [Google Scholar]
- 23.Delorme B, Dahl E, Jarry-guichard T, Marics I, Briand J-P, Willecke K, Gros D, and Théveniau-Ruissy M (1995). Developmental regulation of connexin 40 gene expression in mouse heart correlates with the differentiation of the conduction system. Dev. Dyn. 204, 358–371. 10.1002/AJA.1002040403. [DOI] [PubMed] [Google Scholar]
- 24.Coppen SR, Kaba RA, Halliday D, Dupont E, Skepper JN, Elneil S, and Severs NJ (2003). Comparison of connexin expression patterns in the developing mouse heart and human foetal heart. Mol. Cell. Biochem. 2003 2421 242, 121–127. 10.1023/A:1021150014764. [DOI] [PubMed] [Google Scholar]
- 25.Dumont DJ, Gradwohl G, Fong GH, Puri MC, Gertsenstein M, Auerbach A, and Breitman ML (1994). Dominant-negative and targeted null mutations in the endothelial receptor tyrosine kinase, tek, reveal a critical role in vasculogenesis of the embryo. Genes Dev. 8, 1897–1909. 10.1101/GAD.8.16.1897. [DOI] [PubMed] [Google Scholar]
- 26.Sato TN, Tozawa Y, Deutsch U, Karen WB, Fujiwara Y, Maureen GM, Gridley T, Wolburg H, Risau W, and Qin Y (1995). Distinct roles of the receptor tyrosine kinases Tie-1 and Tie-2 in blood vessel formation. Nature 376, 70–74. 10.1038/376070A0. [DOI] [PubMed] [Google Scholar]
- 27.Timmerman LA, Grego-Bessa J, Raya A, Bertrán E, Pérez-Pomares JM, Díez J, Aranda S, Palomo S, McCormick F, Izpisúa-Belmonte JC, et al. (2004). Notch promotes epithelial-mesenchymal transition during cardiac development and oncogenic transformation. Genes Dev. 18, 99–115. 10.1101/GAD.276304. [DOI] [PMC free article] [PubMed] [Google Scholar]
- 28.Grego-Bessa J, Luna-Zurita L, del Monte G, Bolós V, Melgar P, Arandilla A, Garratt AN, Zang H, Mukouyama Y suke, Chen, H., et al. (2007). Notch signaling is essential for ventricular chamber development. Dev. Cell 12, 415–429. 10.1016/J.DEVCEL.2006.12.011. [DOI] [PMC free article] [PubMed] [Google Scholar]
- 29.Qu X, Harmelink C, Baldwin HS, and Scott Baldwin H (2019). Tie2 regulates endocardial sprouting and myocardial trabeculation. JCI Insight 4. 10.1172/JCI.INSIGHT.96002. [DOI] [PMC free article] [PubMed] [Google Scholar]
- 30.DeLaughter DM, Bick AG, Wakimoto H, McKean D, Gorham JM, Kathiriya IS, Hinson JT, Homsy J, Gray J, Pu W, et al. (2016). Single-Cell Resolution of Temporal Gene Expression during Heart Development. Dev. Cell 39, 480–490. 10.1016/J.DEVCEL.2016.10.001/ATTACHMENT/5E068F13-B91C-4D1D-BD5E-05E5B5E96122/MMC6.XLSX. [DOI] [PMC free article] [PubMed] [Google Scholar]
- 31.Tao G, Kotick JD, and Lincoln J (2012). Heart Valve Development, Maintenance, and Disease: The Role of Endothelial Cells. Curr. Top. Dev. Biol. 100, 203–232. 10.1016/B978-0-12-387786-4.00006-3. [DOI] [PubMed] [Google Scholar]
- 32.Ranger AM, Grusby MJ, Hodge MR, Gravallese EM, De La Brousse FC, Hoey T, Mickanin C, Baldwin HS, and Glimcher LH (1998). The transcription factor NF-ATc is essential for cardiac valve formation. Nature 392, 186–190. 10.1038/32426. [DOI] [PubMed] [Google Scholar]
- 33.Wu B, Wang Y, Lui W, Langworthy M, Tompkins KL, Hatzopoulos AK, Baldwin HS, and Zhou B (2011). Nfatc1 coordinates valve endocardial cell lineage development required for heart valve formation. Circ. Res. 109, 183–192. 10.1161/CIRCRESAHA.111.245035. [DOI] [PMC free article] [PubMed] [Google Scholar]
- 34.Abdul-Sater Z, Yehya A, Beresian J, Salem E, Kamar A, Baydoun S, Shibbani K, Soubra A, Bitar F, and Nemer G (2012). Two heterozygous mutations in NFATC1 in a patient with Tricuspid Atresia. PLoS One 7. 10.1371/JOURNAL.PONE.0049532. [DOI] [PMC free article] [PubMed] [Google Scholar]
- 35.Wu B, Baldwin HS, and Zhou B (2013). Nfatc1 directs the endocardial progenitor cells to make heart valve primordium. Trends Cardiovasc. Med. 23, 294–300. 10.1016/J.TCM.2013.04.003. [DOI] [PMC free article] [PubMed] [Google Scholar]
- 36.Gaussin V, Morley GE, Cox L, Zwijsen A, Vance KM, Emile L, Tian Y, Liu J, Hong C, Myers D, et al. (2005). Alk3/Bmpr1a receptor is required for development of the atrioventricular canal into valves and annulus fibrosus. Circ. Res. 97, 219–226. 10.1161/01.RES.0000177862.85474.63. [DOI] [PMC free article] [PubMed] [Google Scholar]
- 37.Ma L, Lu MF, Schwartz RJ, and Martin JF (2005). Bmp2 is essential for cardiac cushion epithelial-mesenchymal transition and myocardial patterning. Development 132, 5601–5611. 10.1242/DEV.02156. [DOI] [PubMed] [Google Scholar]
- 38.Norris RA, Moreno-Rodriguez RA, Sugi Y, Hoffman S, Amos J, Hart MM, Potts JD, Goodwin RL, and Markwald RR (2008). Periostin regulates atrioventricular valve maturation. Dev. Biol. 316, 200–213. 10.1016/J.YDBIO.2008.01.003. [DOI] [PMC free article] [PubMed] [Google Scholar]
- 39.Voss AK, Vanyai HK, Collin C, Dixon MP, McLennan TJ, Sheikh BN, Scambler P, and Thomas T (2012). MOZ Regulates the Tbx1 Locus, and Moz Mutation Partially Phenocopies DiGeorge Syndrome. Dev. Cell 23, 652–663. 10.1016/j.devcel.2012.07.010. [DOI] [PMC free article] [PubMed] [Google Scholar]
- 40.Vanyai HK, Thomas T, and Voss AK (2015). Mesodermal expression of Moz is necessary for cardiac septum development. Dev. Biol. 403, 22–29. 10.1016/J.YDBIO.2015.04.011. [DOI] [PubMed] [Google Scholar]
- 41.Lickert H, Takeuchi JK, Von Both I, Walls JR, McAuliffe F, Adamson SL, Henkelman RM, Wrana JL, Rossant J, and Bruneau BG (2004). Baf60c is essential for function of BAF chromatin remodelling complexes in heart development. Nature 432, 107–112. 10.1038/NATURE03071. [DOI] [PubMed] [Google Scholar]
- 42.Hota SK, Johnson JR, Verschueren E, Thomas R, Blotnick AM, Zhu Y, Sun X, Pennacchio LA, Krogan NJ, and Bruneau BG (2019). Dynamic BAF chromatin remodeling complex subunit inclusion promotes temporally distinct gene expression programs in cardiogenesis. Dev. 146. 10.1242/dev.174086. [DOI] [PMC free article] [PubMed] [Google Scholar]
- 43.Sun X, Hota SK, Zhou YQ, Novak S, Miguel-Perez D, Christodoulou D, Seidman CE, Seidman JG, Gregorio CC, Henkelman RM, et al. (2018). Cardiac-enriched BAF chromatin-remodeling complex subunit Baf60c regulates gene expression programs essential for heart development and function. Biol. Open 7. 10.1242/BIO.029512. [DOI] [PMC free article] [PubMed] [Google Scholar]
- 44.Shirai M, Osugi T, Koga H, Kaji Y, Takimoto E, Komuro I, Hara J, Miwa T, Yamauchi-Takihara K, and Takihara Y (2002). The Polycomb-group gene Rae28 sustains Nkx2.5/Csx expression and is essential for cardiac morphogenesis. J. Clin. Invest. 110, 177–184. 10.1172/JCI14839. [DOI] [PMC free article] [PubMed] [Google Scholar]
- 45.Takihara Y, Tomotsune D, Shirai M, Katoh-Fukui Y, Nishii K, Motaleb A, Nomura M, Tsuchiya R, Fujita Y, Shibata Y, et al. (1997). Targeted disruption of the mouse homologue of the Drosophila polyhomeotic gene leads to altered anteroposterior patterning and neural crest defects. Development 124, 3673–3682. 10.1242/DEV.124.19.3673. [DOI] [PubMed] [Google Scholar]
- 46.Hota SK, and Bruneau BG (2016). ATP-dependent chromatin remodeling during mammalian development. Development 143, 2882–2897. 10.1242/DEV.128892. [DOI] [PMC free article] [PubMed] [Google Scholar]
- 47.Shirai M, Takihara Y, and Morisaki T (2016). Pcgf5 Contributes to PRC1 (Polycomb Repressive Complex 1) in Developing Cardiac Cells. Etiol. Morphog. Congenit. Hear. Dis. From Gene Funct. Cell. Interact. to Morphol, 305–312. 10.1007/978-4-431-54628-3_43. [DOI] [PubMed] [Google Scholar]
- 48.Jin SC, Homsy J, Zaidi S, Lu Q, Morton S, Depalma SR, Zeng X, Qi H, Chang W, Sierant MC, et al. (2017). Contribution of rare inherited and de novo variants in 2,871 congenital heart disease probands. Nat. Genet. 2017 4911 49, 1593–1601. 10.1038/ng.3970. [DOI] [PMC free article] [PubMed] [Google Scholar]
- 49.Schroeder AM, Allahyari M, Vogler G, Missinato MA, Nielsen T, Yu MS, Theis JL, Larsen LA, Goyal P, Rosenfeld JA, et al. (2019). Model system identification of novel congenital heart disease gene candidates: focus on RPL13. Hum. Mol. Genet. 28, 3954–3969. 10.1093/hmg/ddz213. [DOI] [PMC free article] [PubMed] [Google Scholar]
- 50.Farley-Barnes KI, Ogawa LM, and Baserga SJ (2019). Ribosomopathies: old concepts, new controversies. Trends Genet. 35, 754. 10.1016/J.TIG.2019.07.004. [DOI] [PMC free article] [PubMed] [Google Scholar]
- 51.Venturi G, and Montanaro L (2020). How Altered Ribosome Production Can Cause or Contribute to Human Disease: The Spectrum of Ribosomopathies. Cells 9. 10.3390/CELLS9102300. [DOI] [PMC free article] [PubMed] [Google Scholar]
- 52.Schroeder AM, Nielsen T, Lynott M, Vogler G, Colas AR, and Bodmer R (2022). Nascent polypeptide-Associated Complex and Signal Recognition Particle have cardiac-specific roles in heart development and remodeling. PLoS Genet. 18, e1010448. 10.1371/journal.pgen.1010448. [DOI] [PMC free article] [PubMed] [Google Scholar]
- 53.Vlachos A, Osorio DS, Atsidaftos E, Kang J, Lababidi ML, Seiden HS, Gruber D, Glader BE, Onel K, Farrar JE, et al. (2018). Increased Prevalence of Congenital Heart Disease in Children With Diamond Blackfan Anemia Suggests Unrecognized Diamond Blackfan Anemia as a Cause of Congenital Heart Disease in the General Population. Circ. Genomic Precis. Med. 11, e002044. 10.1161/CIRCGENETICS.117.002044. [DOI] [PMC free article] [PubMed] [Google Scholar]
- 54.Fahed AC, Gelb BD, Seidman JG, and Seidman CE (2013). Genetics of congenital heart disease: the glass half empty. Circ. Res. 112, 707–720. 10.1161/CIRCRESAHA.112.300853. [DOI] [PMC free article] [PubMed] [Google Scholar]
- 55.Nees SN, and Chung WK (2020). The genetics of isolated congenital heart disease. Am. J. Med. Genet. Part C Semin. Med. Genet. 184, 97–106. 10.1002/AJMG.C.31763. [DOI] [PMC free article] [PubMed] [Google Scholar]
- 56.Williams K, Carson J, and Lo C (2019). Genetics of Congenital Heart Disease. Biomol. 2019, Vol. 9, Page 879 9, 879. 10.3390/BIOM9120879. [DOI] [PMC free article] [PubMed] [Google Scholar]
- 57.Zaidi S, and Brueckner M (2017). Genetics and Genomics of Congenital Heart Disease. Circ. Res. 120, 923–940. 10.1161/CIRCRESAHA.116.309140. [DOI] [PMC free article] [PubMed] [Google Scholar]
- 58.Gong L, Xiao Y, Xia F, Wu P, Zhao T, Xie S, Wang R, Wen Q, Zhou W, Xu H, et al. (2019). The mevalonate coordinates energy input and cell proliferation. Cell Death Dis. 2019 104 10, 1–14. 10.1038/s41419-019-1544-y. [DOI] [PMC free article] [PubMed] [Google Scholar]
- 59.Mullen PJ, Yu R, Longo J, Archer MC, and Penn LZ (2016). The interplay between cell signalling and the mevalonate pathway in cancer. Nat. Rev. Cancer 2016 1611 16, 718–731. 10.1038/nrc.2016.76. [DOI] [PubMed] [Google Scholar]
- 60.Sakakura Y, Shimano H, Sone H, Takahashi A, Inoue K, Toyoshima H, Suzuki S, and Yamada N (2001). Sterol regulatory element-binding proteins induce an entire pathway of cholesterol synthesis. Biochem. Biophys. Res. Commun. 286, 176–183. 10.1006/BBRC.2001.5375. [DOI] [PubMed] [Google Scholar]
- 61.Chen Z, Xu N, Chong D, Guan S, Jiang C, Yang Z, and Li C (2018). Geranylgeranyl pyrophosphate synthase facilitates the organization of cardiomyocytes during mid-gestation through modulating protein geranylgeranylation in mouse heart. Cardiovasc. Res. 114, 965–978. 10.1093/CVR/CVY042. [DOI] [PubMed] [Google Scholar]
- 62.Mills RJ, Parker BL, Quaife-Ryan GA, Voges HK, Needham EJ, Bornot A, Ding M, Andersson H, Polla M, Elliott DA, et al. (2019). Drug Screening in Human PSC-Cardiac Organoids Identifies Pro-proliferative Compounds Acting via the Mevalonate Pathway. Cell Stem Cell 24, 895--907.e6. 10.1016/J.STEM.2019.03.009. [DOI] [PubMed] [Google Scholar]
- 63.Yi P, Han Z, Li X, and Olson EH (2006). The mevalonate pathway controls heart formation in Drosophila by isoprenylation of Gγ1. Science (80-. ). 313, 1301–1303. 10.1126/SCIENCE.1127704/SUPPL_FILE/YI.SOM.PDF. [DOI] [PubMed] [Google Scholar]
- 64.D’Amico L, Scott IC, Jungblut B, and Stainier DYR (2007). A mutation in zebrafish hmgcr1b reveals a role for isoprenoids in vertebrate heart-tube formation. Curr. Biol. 17, 252–259. 10.1016/J.CUB.2006.12.023. [DOI] [PubMed] [Google Scholar]
- 65.Sorrentino G, Ruggeri N, Specchia V, Cordenonsi M, Mano M, Dupont S, Manfrin A, Ingallina E, Sommaggio R, Piazza S, et al. (2014). Metabolic control of YAP and TAZ by the mevalonate pathway. Nat. Cell Biol. 16, 357–366. 10.1038/NCB2936. [DOI] [PubMed] [Google Scholar]
- 66.Wang Z, Wu Y, Wang H, Zhang Y, Mei L, Fang X, Zhang X, Zhang F, Chen H, Liu Y, et al. (2014). Interplay of mevalonate and Hippo pathways regulates RHAMM transcription via YAP to modulate breast cancer cell motility. Proc. Natl. Acad. Sci. U. S. A. 111. 10.1073/PNAS.1319190110. [DOI] [PMC free article] [PubMed] [Google Scholar]
- 67.Moya IM, and Halder G (2019). Hippo-YAP/TAZ signalling in organ regeneration and regenerative medicine. Nat. Rev. Mol. Cell Biol. 20, 211–226. 10.1038/S41580-018-0086-Y. [DOI] [PubMed] [Google Scholar]
- 68.Chen X, Li Y, Luo J, and Hou N (2020). Molecular Mechanism of Hippo-YAP1/TAZ Pathway in Heart Development, Disease, and Regeneration. Front. Physiol. 11. 10.3389/FPHYS.2020.00389. [DOI] [PMC free article] [PubMed] [Google Scholar]
- 69.Kastan N, Gnedeva K, Alisch T, Petelski AA, Huggins DJ, Chiaravalli J, Aharanov A, Shakked A, Tzahor E, Nagiel A, et al. (2021). Small-molecule inhibition of Lats kinases may promote Yap-dependent proliferation in postmitotic mammalian tissues. Nat. Commun. 12. 10.1038/S41467-021-23395-3. [DOI] [PMC free article] [PubMed] [Google Scholar]
- 70.Gu Y, Zhou Y, Ju S, Liu X, Zhang Z, Guo J, Gao J, Zang J, Sun H, Chen Q, et al. (2022). Multi-omics profiling visualizes dynamics of cardiac development and functions. Cell Rep. 41, 111891. 10.1016/J.CELREP.2022.111891. [DOI] [PubMed] [Google Scholar]
- 71.He A, Ma Q, Cao J, Von Gise A, Zhou P, Xie H, Zhang B, Hsing M, Christodoulou DC, Cahan P, et al. (2012). Polycomb repressive complex 2 regulates normal development of the mouse heart. Circ. Res. 110, 406–415. 10.1161/CIRCRESAHA.111.252205. [DOI] [PMC free article] [PubMed] [Google Scholar]
- 72.Pereira IT, Spangenberg L, Robert AW, Amorín R, Stimamiglio MA, Naya H, and Dallagiovanna B (2019). Cardiomyogenic differentiation is fine-tuned by differential mRNA association with polysomes. BMC Genomics 20. 10.1186/S12864-019-5550-3. [DOI] [PMC free article] [PubMed] [Google Scholar]
- 73.Gibb AA, and Hill BG (2018). Metabolic Coordination of Physiological and Pathological Cardiac Remodeling. Circ. Res. 123, 107–128. 10.1161/CIRCRESAHA.118.312017. [DOI] [PMC free article] [PubMed] [Google Scholar]
- 74.Zhao Q, Sun Q, Zhou L, Liu K, and Jiao K (2019). Complex Regulation of Mitochondrial Function During Cardiac Development. J. Am. Heart Assoc. 8. 10.1161/JAHA.119.012731. [DOI] [PMC free article] [PubMed] [Google Scholar]
- 75.Baker CN, and Ebert SN (2013). Development of aerobic metabolism in utero: requirement for mitochondrial function during embryonic and foetal periods. OA Biotechnol. 2, 16. [Google Scholar]
- 76.Menendez-Montes I, Escobar B, Palacios B, Gómez MJ, Izquierdo-Garcia JL, Flores L, Jiménez-Borreguero LJ, Aragones J, Ruiz-Cabello J, Torres M, et al. (2016). Myocardial VHL-HIF Signaling Controls an Embryonic Metabolic Switch Essential for Cardiac Maturation. Dev. Cell 39, 724–739. 10.1016/J.DEVCEL.2016.11.012. [DOI] [PubMed] [Google Scholar]
- 77.Smoak IW (2002). Hypoglycemia and embryonic heart development. Front. Biosci. 7, 307–318. 10.2741/SMOAK. [DOI] [PubMed] [Google Scholar]
- 78.Kasahara A, Cipolat S, Chen Y, Dorn GW, and Scorrano L (2013). Mitochondrial fusion directs cardiomyocyte differentiation via calcineurin and Notch signaling. Science 342, 734–737. 10.1126/SCIENCE.1241359. [DOI] [PubMed] [Google Scholar]
- 79.Yeganeh B, Wiechec E, Ande SR, Sharma P, Moghadam AR, Post M, Freed DH, Hashemi M, Shojaei S, Zeki AA, et al. (2014). Targeting the mevalonate cascade as a new therapeutic approach in heart disease, cancer and pulmonary disease. Pharmacol. Ther. 143, 87–110. 10.1016/J.PHARMTHERA.2014.02.007. [DOI] [PMC free article] [PubMed] [Google Scholar]
- 80.Zhang C, Jin DD, Wang XY, Lou L, and Yang J (2021). Key Enzymes for the Mevalonate Pathway in the Cardiovascular System. J. Cardiovasc. Pharmacol. 77, 142–152. 10.1097/FJC.0000000000000952. [DOI] [PubMed] [Google Scholar]
- 81.Chong D, Chen Z, Guan S, Zhang T, Xu N, Zhao Y, and Li C (2021). Geranylgeranyl pyrophosphate-mediated protein geranylgeranylation regulates endothelial cell proliferation and apoptosis during vasculogenesis in mouse embryo. J. Genet. Genomics 48, 300–311. 10.1016/J.JGG.2021.03.009. [DOI] [PubMed] [Google Scholar]
- 82.Talman V, Teppo J, Pöhö P, Movahedi P, Vaikkinen A, Tuuli Karhu S, Trošt K, Suvitaival T, Heikkonen J, Pahikkala T, et al. (2018). Molecular Atlas of Postnatal Mouse Heart Development. J. Am. Hear. Assoc. Cardiovasc. Cerebrovasc. Dis. 7. 10.1161/JAHA.118.010378. [DOI] [PMC free article] [PubMed] [Google Scholar]
- 83.Bishop SP, Zhou Y, Nakada Y, and Zhang J (2021). Changes in Cardiomyocyte Cell Cycle and Hypertrophic Growth During Fetal to Adult in Mammals. J. Am. Heart Assoc. 10, 1–12. 10.1161/JAHA.120.017839. [DOI] [PMC free article] [PubMed] [Google Scholar]
- 84.Engert JC, Lemire M, Faith J, Brisson D, Fujiwara TM, Roslin NM, Brewer CG, Montpetit A, Darmond-Zwaig C, Renaud Y, et al. (2007). Identification of a chromosome 8p locus for early-onset coronary heart disease in a French Canadian population. Eur. J. Hum. Genet. 2008 161 16, 105–114. 10.1038/sj.ejhg.5201920. [DOI] [PubMed] [Google Scholar]
- 85.Soemedi R, Wilson IJ, Bentham J, Darlay R, Töpf A, Zelenika D, Cosgrove C, Setchfield K, Thornborough C, Granados-Riveron J, et al. (2012). Contribution of global rare copy-number variants to the risk of sporadic congenital heart disease. Am. J. Hum. Genet. 91, 489–501. 10.1016/J.AJHG.2012.08.003. [DOI] [PMC free article] [PubMed] [Google Scholar]
- 86.Yang J, Mou Y, Wu T, Ye Y, Jiang JC, Zhao CZ, Zhu HH, Du CQ, Zhou L, and Hu SJ (2013). Cardiac-specific overexpression of farnesyl pyrophosphate synthase induces cardiac hypertrophy and dysfunction in mice. Cardiovasc. Res. 97, 490–499. 10.1093/CVR/CVS347. [DOI] [PubMed] [Google Scholar]
- 87.Wang DS, Yin RX, Li KG, Lu L, Su Y, and Yan RQ (2018). Association between the MVK rs2287218 SNP and the risk of coronary heart disease and ischemic stroke: A case-control study. Biosci. Trends 12, 403–411. 10.5582/BST.2018.01146. [DOI] [PubMed] [Google Scholar]
- 88.Miao L, Yin RX, Huang F, Chen WX, Cao XL, and Wu JZ (2017). The effect of MVK-MMAB variants, their haplotypes and G×E interactions on serum lipid levels and the risk of coronary heart disease and ischemic stroke. Oncotarget 8, 72801. 10.18632/ONCOTARGET.20349. [DOI] [PMC free article] [PubMed] [Google Scholar]
- 89.Xu N, Guan S, Chen Z, Yu Y, Xie J, Pan F-Y, Zhao N-W, Liu L, Yang Z-Z, Gao X, et al. (2015). The alteration of protein prenylation induces cardiomyocyte hypertrophy through Rheb–mTORC1 signalling and leads to chronic heart failure. J. Pathol. 235, 672–685. 10.1002/PATH.4480. [DOI] [PubMed] [Google Scholar]
- 90.Aoki Y, Niihori T, Kawame H, Kurosawa K, Ohashi H, Tanaka Y, Filocamo M, Kato K, Suzuki Y, Kure S, et al. (2005). Germline mutations in HRAS proto-oncogene cause Costello syndrome. Nat. Genet. 37, 1038–1040. 10.1038/NG1641. [DOI] [PubMed] [Google Scholar]
- 91.Schuhmacher AJ, Guerra C, Sauzeau V, Cañamero M, Bustelo XR, and Barbacid M (2008). A mouse model for Costello syndrome reveals an Ang II–mediated hypertensive condition. J. Clin. Invest. 118, 2169–2179. 10.1172/JCI34385. [DOI] [PMC free article] [PubMed] [Google Scholar]
- 92.Gelb BD, Roberts AE, and Tartaglia M (2015). Cardiomyopathies in Noonan syndrome and the other RASopathies. Prog. Pediatr. Cardiol. 39, 13–19. 10.1016/J.PPEDCARD.2015.01.002. [DOI] [PMC free article] [PubMed] [Google Scholar]
- 93.Schubbert S, Zenker M, Rowe SL, Böll S, Klein C, Bollag G, Van Der Burgt I, Musante L, Kalscheuer V, Wehner LE, et al. (2006). Germline KRAS mutations cause Noonan syndrome. Nat. Genet. 38, 331–336. 10.1038/NG1748. [DOI] [PubMed] [Google Scholar]
- 94.Tartaglia M, Gelb BD, and Zenker M (2011). Noonan syndrome and clinically related disorders. Best Pract. Res. Clin. Endocrinol. Metab. 25, 161–179. 10.1016/J.BEEM.2010.09.002. [DOI] [PMC free article] [PubMed] [Google Scholar]
- 95.Razzaque MA, Komoike Y, Nishizawa T, Inai K, Furutani M, Higashinakagawa T, and Matsuoka R (2012). Characterization of a novel KRAS mutation identified in Noonan syndrome. Am. J. Med. Genet. A 158A, 524–532. 10.1002/AJMG.A.34419. [DOI] [PubMed] [Google Scholar]
- 96.Hernández-Porras I, Fabbiano S, Schuhmacher AJ, Aicher A, Cañamero M, Cámara JA, Cussó L, Desco M, Heeschen C, Mulero F, et al. (2014). K-RasV14I recapitulates noonan syndrome in mice. Proc. Natl. Acad. Sci. U. S. A. 111, 16395–16400. 10.1073/PNAS.1418126111/-/DCSUPPLEMENTAL. [DOI] [PMC free article] [PubMed] [Google Scholar]
- 97.Wei L, Imanaka-Yoshida K, Wang L, Zhan S, Schneider MD, DeMayo FJ, and Schwartz RJ (2002). Inhibition of Rho family GTPases by Rho GDP dissociation inhibitor disrupts cardiac morphogenesis and inhibits cardiomyocyte proliferation. Development 129, 1705–1714. 10.1242/DEV.129.7.1705. [DOI] [PubMed] [Google Scholar]
- 98.Wei L, Taffet GE, Khoury DS, Bo J, Li Y, Yatani A, Delaughter MC, Klevitsky R, Hewett TE, Robbins J, et al. (2004). Disruption of Rho signaling results in progressive atrioventricular conduction defects while ventricular function remains preserved. FASEB J. 18, 857–859. 10.1096/FJ.03-0664FJE. [DOI] [PubMed] [Google Scholar]
- 99.Nelson CP, Goel A, Butterworth AS, Kanoni S, Webb TR, Marouli E, Zeng L, Ntalla I, Lai FY, Hopewell JC, et al. (2017). Association analyses based on false discovery rate implicate new loci for coronary artery disease. Nat. Genet. 2017 499 49, 1385–1391. 10.1038/ng.3913. [DOI] [PubMed] [Google Scholar]
- 100.Alonso-Orgaz S, Moreno-Luna R, López JA, Gil-Dones F, Padial LR, Moreu J, De la Cuesta F, and Barderas MG (2014). Proteomic characterization of human coronary thrombus in patients with ST-segment elevation acute myocardial infarction. J. Proteomics 109, 368–381. 10.1016/J.JPROT.2014.07.016. [DOI] [PubMed] [Google Scholar]
- 101.Lakshmikanthan S, Zieba BJ, Ge ZD, Momotani K, Zheng X, Lund H, Artamonov MV, Maas JE, Szabo A, Zhang DX, et al. (2014). Rap1b in smooth muscle and endothelium is required for maintenance of vascular tone and normal blood pressure. Arterioscler. Thromb. Vasc. Biol. 34, 1486–1494. 10.1161/ATVBAHA.114.303678. [DOI] [PMC free article] [PubMed] [Google Scholar]
- 102.Ma X, Bai G, Lu D, Huang L, Zhang J, Deng R, Ding S, Gu N, and Guo X (2017). Association between STK11 Gene Polymorphisms and Coronary Artery Disease in Type 2 Diabetes in Han Population in China. J. Diabetes Res. 2017. 10.1155/2017/6297087. [DOI] [PMC free article] [PubMed] [Google Scholar]
- 103.Leung C, Lu X, Liu M, and Feng Q (2014). Rac1 Signaling Is Critical to Cardiomyocyte Polarity and Embryonic Heart Development. J. Am. Hear. Assoc. Cardiovasc. Cerebrovasc. Dis. 3. 10.1161/JAHA.114.001271. [DOI] [PMC free article] [PubMed] [Google Scholar]
- 104.Leung C, Liu Y, Lu X, Kim M, Drysdale TA, and Feng Q (2016). Rac1 Signaling Is Required for Anterior Second Heart Field Cellular Organization and Cardiac Outflow Tract Development. J. Am. Hear. Assoc. Cardiovasc. Cerebrovasc. Dis. 5. 10.1161/JAHA.115.002508. [DOI] [PMC free article] [PubMed] [Google Scholar]
- 105.Leung C, Engineer A, Kim MY, Lu X, and Feng Q (2021). Myocardium-Specific Deletion of Rac1 Causes Ventricular Noncompaction and Outflow Tract Defects. J. Cardiovasc. Dev. Dis. 8. 10.3390/JCDD8030029. [DOI] [PMC free article] [PubMed] [Google Scholar]
- 106.Li J, Liu Y, Jin Y, Wang R, Wang J, Lu S, VanBuren V, Dostal DE, Zhang SL, and Peng X (2017). Essential role of Cdc42 in cardiomyocyte proliferation and cell-cell adhesion during heart development. Dev. Biol. 421, 271–283. 10.1016/J.YDBIO.2016.12.012. [DOI] [PubMed] [Google Scholar]
- 107.Li J, Miao L, Zhao C, Qureshi WMS, Shieh D, Guo H, Lu Y, Hu S, Huang A, Zhang L, et al. (2017). CDC42 is required for epicardial and pro-epicardial development by mediating FGF receptor trafficking to the plasma membrane. Dev. 144, 1635–1647. 10.1242/DEV.147173/VIDEO-12. [DOI] [PMC free article] [PubMed] [Google Scholar]
- 108.Arimura T, Helbling-Leclerc A, Massart C, Varnous S, Niel F, Lacène E, Fromes Y, Toussaint M, Mura AM, Kelle DI, et al. (2005). Mouse model carrying H222P-Lmna mutation develops muscular dystrophy and dilated cardiomyopathy similar to human striated muscle laminopathies. Hum. Mol. Genet. 14, 155–169. 10.1093/HMG/DDI017. [DOI] [PubMed] [Google Scholar]
- 109.Wang H, Wang J, Zheng W, Wang X, Wang S, Song L, Zou Y, Yao Y, and Hui R (2006). Mutation Glu82Lys in lamin A/C gene is associated with cardiomyopathy and conduction defect. Biochem. Biophys. Res. Commun. 344, 17–24. 10.1016/J.BBRC.2006.03.149. [DOI] [PubMed] [Google Scholar]
- 110.Lu D, Lian H, Zhang X, Shao H, Huang L, Qin C, and Zhang L (2010). LMNA E82K Mutation Activates FAS and Mitochondrial Pathways of Apoptosis in Heart Tissue Specific Transgenic Mice. PLoS One 5. 10.1371/JOURNAL.PONE.0015167. [DOI] [PMC free article] [PubMed] [Google Scholar]
- 111.Mertins P, Tang LC, Krug K, Clark DJ, Gritsenko MA, Chen L, Clauser KR, Clauss TR, Shah P, Gillette MA, et al. (2018). Reproducible workflow for multiplexed deep-scale proteome and phosphoproteome analysis of tumor tissues by liquid chromatography–mass spectrometry. Nat. Protoc. 2018 137 13, 1632–1661. 10.1038/s41596-018-0006-9. [DOI] [PMC free article] [PubMed] [Google Scholar]
- 112.McAlister GC, Nusinow DP, Jedrychowski MP, Wühr M, Huttlin EL, Erickson BK, Rad R, Haas W, and Gygi SP (2014). MultiNotch MS3 enables accurate, sensitive, and multiplexed detection of differential expression across cancer cell line proteomes. Anal. Chem. 86, 7150–7158. 10.1021/AC502040V. [DOI] [PMC free article] [PubMed] [Google Scholar]
- 113.Ehler E, Moore-Morris T, Lange S, Divisions C, and London C (2013). Isolation and Culture of Neonatal Mouse Cardiomyocytes. JoVE (Journal Vis. Exp, e50154. 10.3791/50154. [DOI] [PMC free article] [PubMed] [Google Scholar]
- 114.Wiśniewski JR, Hein MY, Cox J, and Mann M (2014). A “proteomic ruler” for protein copy number and concentration estimation without spike-in standards. Mol. Cell. Proteomics 13, 3497–3506. 10.1074/MCP.M113.037309. [DOI] [PMC free article] [PubMed] [Google Scholar]
Associated Data
This section collects any data citations, data availability statements, or supplementary materials included in this article.
Supplementary Materials
Supplementary Table 1: Master table of all identified and quantified proteins. Related to Figure 1.
Supplementary Table 2: Statistical analysis of differentially expressed proteins. Related to Figure 1.
Supplementary Table 3: Hierarchical clustering heatmap input and computed values. Related to Figures 4A and 4B.
Data Availability Statement
The RNA-seq raw data has been deposited at the GEO repository and the accession numbers are listed in the key resources table. The MS Proteomics data, including the MS raw files, have been deposited at the ProteomeXchange Consortium repository, and the identifier is listed in the key resources table.
| REAGENT or RESOURCE | SOURCE | IDENTIFIER |
|---|---|---|
| Antibodies | ||
| Tropomyosin (CH1) | DSHB | CH1 |
| Ki67 | abcam | ab15580 |
| YAP | Cell Signaling | 49125 |
| GGPS1 | Proteintech | 14944–1-AP |
| HMGCR | ThermoFisher | MA5–31335 |
| Alexa Flour 488 Goat anti-Mouse | Invitrogen | A11001 |
| Alexa Flour 546 Goat anti-Rabbit | Invitrogen | A11035 |
| Chemicals, peptides, and recombinant proteins | ||
| TCEP | ThermoFisher | 77720 |
| Chloroacetamide | Sigma | 22790 |
| Protease inhibitor | Sigma | P8340 |
| Phosphatase inhibitor cocktail 2 | Sigma | P5726 |
| Phosphatase inhibitor cocktail 3 | Sigma | P0044 |
| BDM (2,3-Butanedione monoxime) | Sigma | B0753 |
| Collagenase/Dispase | Sigma | 1026963800 |
| 1x trypsin solution (0.25%) with EDTA | Gibco | 25300–054 |
| DMEM high glucose | Sigma | D6429 |
| M-199 | ThermoFisher | MT10060CV |
| Fetal bovine serum (FBS) | VWR | 97068–85 |
| Horse serum | Gibco | 16050–122 |
| Leibovitz L-155 | Corning | 10–045-CV |
| 0.1% collagen solution | Sigma | C8919 |
| Normal goat serum | Sigma | 526 |
| Simvastatin | Sigma | S6196 |
| GGTI-298 | Tocris | 24–301 |
| FTI-277 | Tocris | 24–071 |
| Truli | Axon MedChem | Axon 3276 |
| Critical commercial assays | ||
| TSA Cyanine 3 Kit | Akoya Biosciences | NEL704A001KT |
| BCA Assay | ThermoFisher | 23225 |
| RNAqueous-Micro Total RNA Isolation Kit | ThermoFisher | AM1931 |
| Deposited data | ||
| MS/MS Raw files and MaxQuant analysis files | This paper | PXD032312 |
| RNA-seq raw data for E9.5, E10.5, E12.5, E14.5 and E16.5 C57BL/6J hearts | This paper | GEO: GSE223239 |
| RNA-seq raw data for E12.5 isolated cardiomyocytes treated with simvastatin | This paper | GEO: GSE223239 |
| Experimental models: Organisms/strains | ||
| Mouse strain wild type C57BL/6J | The Jackson Laboratory | Stock No: 000664 |
| Software and algorithms | ||
| CellProfiler | Broad Institute | https://cellprofiler.org/ |
| BioRender | BioRender | https://biorender.com/ |
| GraphPad Prism | Prism | https://www.graphpad.com/ |
| Proteome Discover 2.4 | Thermo Scientific | N.A. |
| Cytoscape with ClueGO and STRING plugin | Cytoscape | https://cvtoscape.org/ |
This paper does not report original code.
Any additional information required to reanalyze the data reported in this paper is available from the Lead contact upon request.