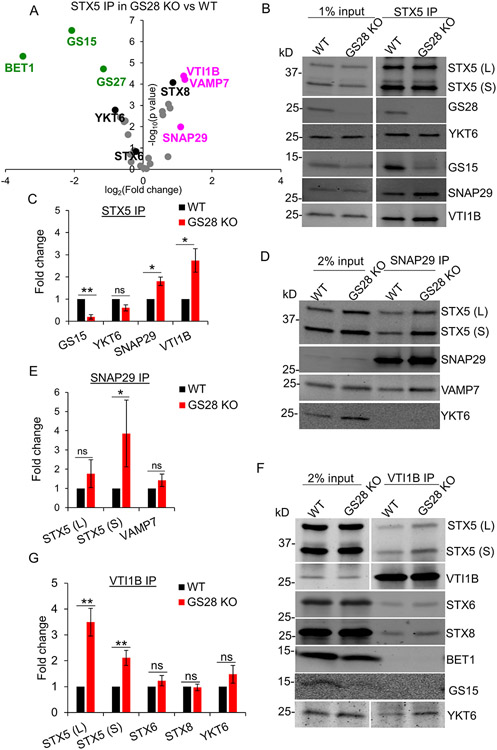
Figure 5: Label-free mass spectrometry (DIA MS) analysis of STX5 binding proteins reveals an increase in non-canonical STX5 SNARE partners.
(A) Volcano plot showing fold changes in SNAREs coimmunoprecipitated (coIPed) with STX5 in GS28 KO vs WT based on DIA MS of four biological replicates. Magenta and green dots indicate SNARE proteins whose fold changes increased or decreased significantly in the STX5 IP in GS28 KO vs WT. The volcano plot for identified SNARE proteins was obtained from 4 biological replicates. A fold-change >2 and p<0.05 was considered statistically significant. (B) WB analysis of endogenous STX5 IP in WT and GS28 KO cells. (C) Bar graph represents fold changes of SNAREs coIPed with STX5 in GS28 KO vs WT. (D) WB analysis of endogenous SNAP29 IP in WT and GS28 KO cells. (E) Bar graph represents fold changes of coIPed SNAREs with SNAP29 in GS28 KO vs WT. (F) WB analysis of endogenous VTIB IP in WT and GS28 KO cells. Note an appreciable increase in the amount of STX5 and YKT6 coIPed with VTI1B and SNAP29 in the GS28 KO compared to WT. (G) Bar graph represents fold changes of coIPed SNAREs with SNAP29 in GS28 KO vs WT. n=3, *p<0.05, **p<0.001, ***p<0.0001

