

Abstract
Preeclampsia and gestational hypertension are common pregnancy complications associated with adverse maternal and child outcomes. Current tools for prediction, prevention and treatment are limited. Here we tested the association of maternal DNA sequence variants with preeclampsia in 20,064 cases and 703,117 control individuals and with gestational hypertension in 11,027 cases and 412,788 control individuals across discovery and follow-up cohorts using multi-ancestry meta-analysis. Altogether, we identified 18 independent loci associated with preeclampsia/eclampsia and/or gestational hypertension, 12 of which are new (for example, MTHFR–CLCN6, WNT3A, NPR3, PGR and RGL3), including two loci (PLCE1 and FURIN) identified in the multitrait analysis. Identified loci highlight the role of natriuretic peptide signaling, angiogenesis, renal glomerular function, trophoblast development and immune dysregulation. We derived genome-wide polygenic risk scores that predicted preeclampsia/eclampsia and gestational hypertension in external cohorts, independent of clinical risk factors, and reclassified eligibility for low-dose aspirin to prevent preeclampsia. Collectively, these findings provide mechanistic insights into the hypertensive disorders of pregnancy and have the potential to advance pregnancy risk stratification.
The hypertensive disorders of pregnancy (HDPs) represent a leading cause of maternal and neonatal morbidity and mortality and account for ~14% of maternal deaths worldwide1,2. Up to 15% of child-bearing women experience an HDP in at least one pregnancy3. The HDPs include preeclampsia, defined as new-onset hypertension or worsening hypertension after 20-week gestation plus proteinuria or other evidence of end-organ dysfunction; gestational hypertension, defined as new-onset hypertension without accompanying features of preeclampsia and eclampsia, defined as progression of preeclampsia to maternal seizures4,5. In addition to short-term risks of end-organ failure and death in the absence of prompt recognition and treatment, individuals who develop HDPs have a roughly twofold long-term risk of cardiovascular disease compared with those who experience only normotensive pregnancies for reasons that remain incompletely understood6.
The pathophysiology of the HDPs is increasingly recognized to be heterogeneous with maternal and fetal contributions. In the contemporary model of preeclampsia pathophysiology, defective trophoblast invasion in early placental development and incomplete remodeling of the maternal spiral arteries lead to placental ischemia later in gestation1,7. The distressed placenta secretes an excess of circulating anti-angiogenic proteins (for example, soluble fms-like tyrosine kinase-1 (sFlt-1) and soluble endoglin) that induce the systemic maternal endothelial dysfunction and vasoconstriction that drive the clinical manifestations of preeclampsia (hypertension and proteinuria)8. In addition, maternal cardiometabolic risk factors (for example, prepregnancy chronic hypertension, diabetes and obesity) and prepregnancy kidney and autoimmune disease strongly predict preeclampsia1,9 and influence early placentation as well as maternal vascular adaptation to pregnancy7.
Genetic analysis may yield new mechanistic insights into the pathophysiology of HDPs. An estimated 31–35% of preeclampsia predisposition has been attributed to maternal genetics using familial aggregation-based approaches10,11. However, few genetic loci linked to preeclampsia have been identified and robustly validated to date. Several fetal variants near the FLT1 gene, which encodes placenta-derived sFlt-1, have been reported to associate with preeclampsia12,13. Recently, in a study discussed in ref. 13, the largest maternal GWAS of preeclampsia to date identified associations near FTO (the first reported obesity-associated locus), ZNF831 and several other blood pressure (BP)-associated genes (MECOM, FGF5 and SH2B3) in a combined meta-analysis of 12,150 cases and 164,098 controls. In addition, increased maternal hypertension polygenic risk is associated with the risk of HDPs13–17.
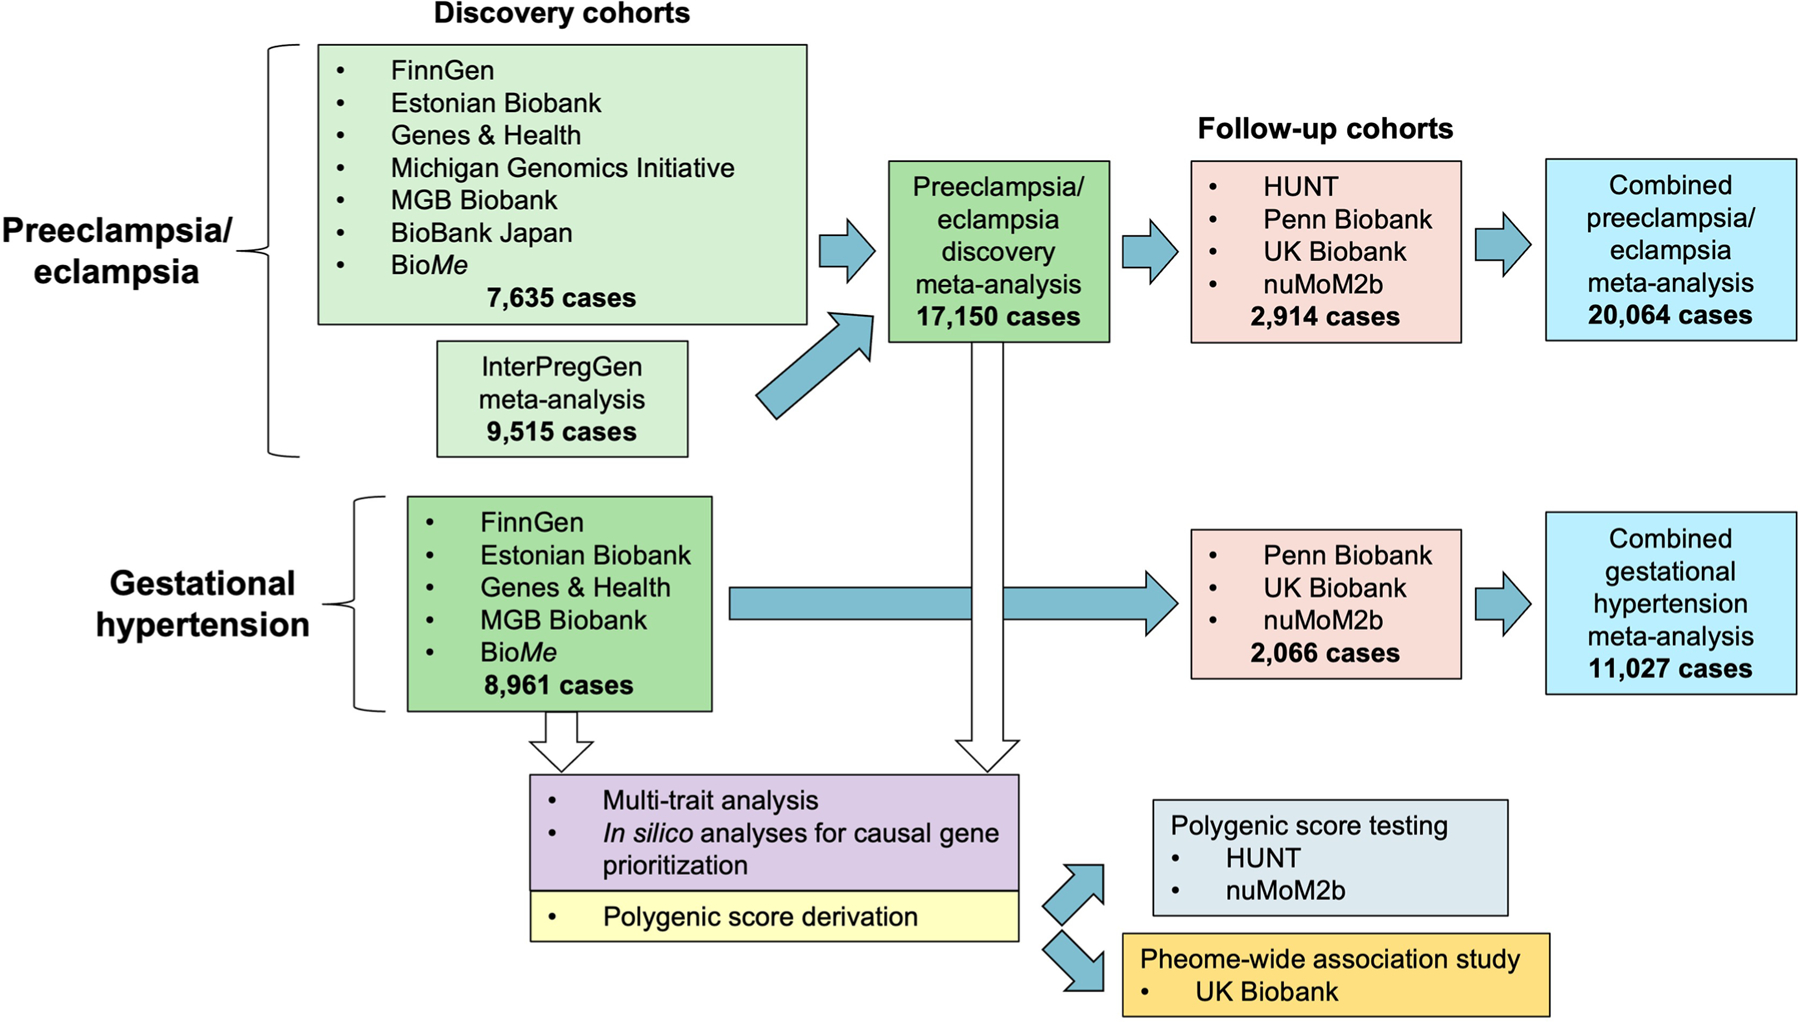
In this work, we performed an expanded multi-ancestry GWAS meta-analysis for preeclampsia/eclampsia and separately performed GWAS for gestational hypertension. We then used these results to train and test polygenic risk scores (PRS) for each outcome in independent datasets (Extended Data Fig. 1).
Results
Associations with preeclampsia and gestational hypertension
We tested the association of common variants (minor allele frequency (MAF) ≥1%) with preeclampsia/eclampsia among 17,150 cases and 451,241 control individuals in discovery analysis (78.0% European, 21.2% Asian, 0.5% admixed American and 0.3% African ancestry; Supplementary Table 1) using multi-ancestry fixed-effects meta-analysis in METAL18. Female individuals with preeclampsia were identified principally using International Classification of Diseases (ICD) codes and phecodes corresponding to preeclampsia and, where available, eclampsia (Supplementary Tables 1–3); control individuals were generally either those with exclusively normotensive pregnancies or all female participants without codes corresponding to hypertension in pregnancy13. In discovery analysis, we identified 12 independent loci at the commonly used statistical significance threshold of P < 5 × 10⁻⁸, including six previously nominated in ref. 13 in maternal or fetal GWAS (MECOM (3q26), FGF5 (4q21), SH2B3 (12q22), FLT1 (13q12), FTO (16q12) and ZNF831 (20q13)) and six additional loci (MTHFR–CLCN6 (1p36), WNT3A (1q42), MICA (6p21), LINC00484 (9q22), PGR (11q22), and RGL3 (19p13); Table 1; Extended Data Fig. 2a and Supplementary Table 4).
Table 1 |. Maternal sequence variants associated with preeclampsia/eclampsia.
| Discovery analysis (17,150 cases/451,241 controls) | Follow-up analysis (2,914 cases/251,876 controls) | Combined discovery and follow-up meta-analysis (20,064 cases/703,117 controls) | ||||||||||
|---|---|---|---|---|---|---|---|---|---|---|---|---|
| Nearest gene | Lead variant | CHR | POS | Effect allele/other allele | Weighted average EAF | OR | P value | P(het)a | OR | P value | OR | P value |
| Loci with genome-wide significance in the discovery analysis | ||||||||||||
| MTHFR–CLCN6 | rs149764880 | 1 | 11820674 | G/T | 0.85 | 1.11 | 1.8 × 10⁻⁸ | 0.30 | 1.17 | 6.8 × 10⁻⁴ | 1.12 | 8.8 × 10⁻¹¹ |
| WNT3A | rs708119 | 1 | 228015567 | C/G | 0.67 | 1.08 | 2.3 × 10⁻⁸ | 0.92 | 1.05 | 0.10 | 1.08 | 7.8 × 10⁻⁹ |
| MECOM | rs9855086 | 3 | 169413542 | A/T | 0.53 | 1.08 | 5.7 × 10⁻¹⁰ | 0.21 | 1.08 | 8.3 × 10⁻³ | 1.08 | 1.6 × 10⁻¹¹ |
| FGF5 | rs16998073 | 4 | 80263187 | T/A | 0.32 | 1.11 | 3.1 × 10⁻¹⁴ | 0.15 | 1.08 | 1.6 × 10⁻² | 1.11 | 2.3 × 10⁻¹⁵ |
| MICA | rs2442752 | 6 | 31383987 | C/T | 0.36 | 1.08 | 2.3 × 10⁻⁹ | 0.57 | 0.99 | 0.84 | 1.07 | 3.8 × 10⁻⁸ |
| LINC00484 | rs5899121 | 9 | 91145498 | TG/T | 0.85 | 1.12 | 4.6 × 10⁻⁸ | 0.31 | 0.86 | 0.31 | 1.12 | 1.4 × 10⁻⁷ |
| PGR | rs2508372 | 11 | 101397592 | A/G | 0.79 | 1.10 | 1.3 × 10⁻⁹ | 0.14 | 1.11 | 7.5 × 10⁻³ | 1.11 | 3.4 × 10⁻¹¹ |
| SH2B3 | rs10774624 | 12 | 111395984 | G/A | 0.47 | 1.10 | 2.9 × 10⁻¹² | 0.40 | 1.03 | 0.29 | 1.09 | 1.0 × 10⁻¹¹ |
| FLT1 | rs7318880 | 13 | 28564148 | T/C | 0.48 | 1.09 | 6.7 × 10⁻¹² | 0.79 | 1.06 | 5.8 × 10⁻² | 1.09 | 1.6 × 10⁻¹² |
| FTO | rs1421085 | 16 | 53767042 | C/T | 0.40 | 1.10 | 4.7 × 10⁻¹² | 0.61 | 1.07 | 1.8 × 10⁻² | 1.09 | 3.3 × 10⁻¹³ |
| RGL3 | rs167479 | 19 | 11416089 | G/T | 0.55 | 1.10 | 7.6 × 10⁻¹⁰ | 0.20 | 1.09 | 6.8 × 10⁻³ | 1.10 | 1.8 × 10⁻¹¹ |
| ZNF831 | rs259983 | 20 | 59160402 | C/A | 0.16 | 1.13 | 1.0 × 10⁻¹² | 0.40 | 1.15 | 2.8 × 10⁻⁴ | 1.14 | 1.3 × 10⁻¹⁵ |
| Additional loci identified in combined discovery and follow-up meta-analysis | ||||||||||||
| FGL1 | rs2653414 | 8 | 17868560 | A/C | 0.02 | 1.27 | 1.0 × 10⁻⁶ | 0.44 | 2.18 | 4.4 × 10⁻⁹ | 1.36 | 3.4 × 10⁻¹¹ |
| UPB1 | rs17572606 | 22 | 24472204 | T/C | 0.02 | 1.45 | 1.9 × 10⁻⁷ | 0.33 | 1.28 | 6.0 × 10⁻² | 1.41 | 4.6 × 10⁻⁸ |
Two-sided P values (not adjusted for multiple comparisons) are from z scores from a fixed-effect inverse-variance-weighted meta-analysis.
P(het) indicates P value for heterogeneity across discovery cohorts. CHR, chromosome; EAF, effect allele frequency; OR, odds ratio; POS, position (genome build 38).
We pursued replication of these GWAS results in four follow-up cohorts that collectively included 2,914 female individuals with preeclampsia/eclampsia and 251,876 female controls (96.7% European, 3.1% African and 0.3% admixed American ancestry). We replicated 7 of 12 associations from discovery analysis with P < 0.05 and consistent direction of effect, including the new associations at MTHFR–CLCN6, PGR and RGL3 (Table 1). Ten associations had a consistent direction of effect in follow-up cohorts, and 11 of 12 associated loci retained genome-wide significance in a combined meta-analysis of preeclampsia/eclampsia discovery and follow-up cohorts. In a combined meta-analysis, two additional loci attained genome-wide significance (FGL1 (8p22) and UPB1 (22q11)), yielding a total of 13 loci associated with preeclampsia/eclampsia with genome-wide significance (Fig. 1a). We did not observe inflation in test statistics (lambda genomic inflation factor, 1.038; Supplementary Fig. 1a). There was no discernible heterogeneity of these associations across ancestries (Supplementary Table 5). Conditional analysis in genome-wide complex trait analysis (GCTA)-conditional and joint analysis (COJO)19 identified a second independent association on chromosome 20 near ZBTB46 (lead variant rs4809370; odds ratio (OR), 1.08; P = 1.4 × 10⁻⁸).
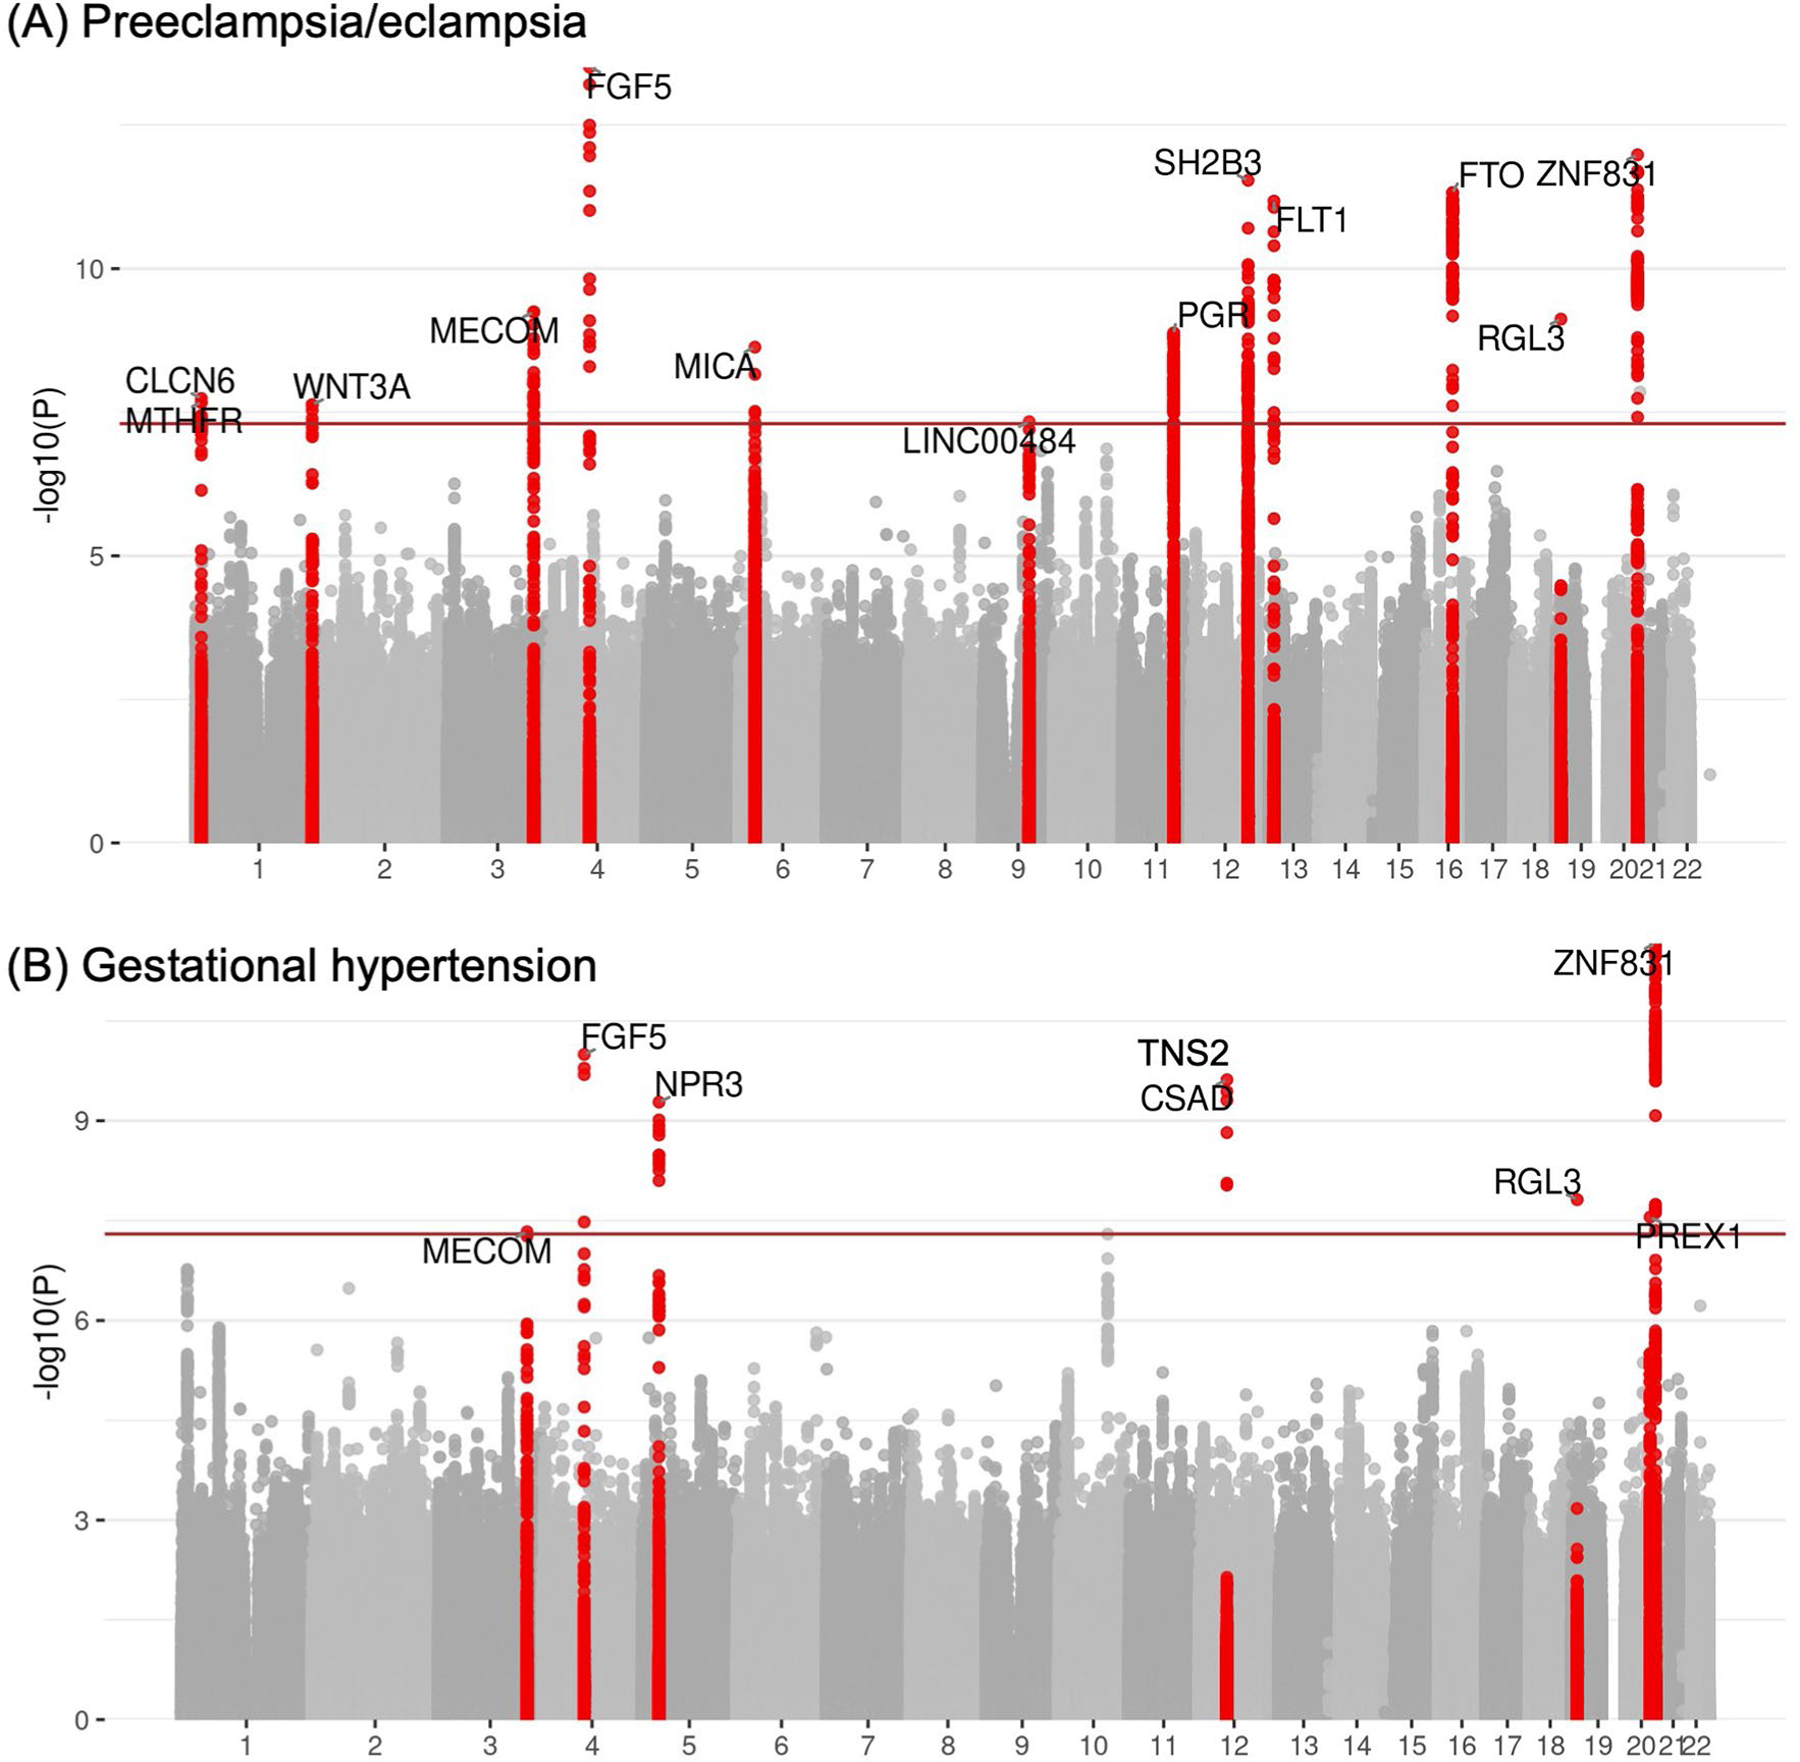
Fig. 1 |. Manhattan plots of preeclampsia/eclampsia and gestational hypertension in combined discovery and follow-up meta-analysis.
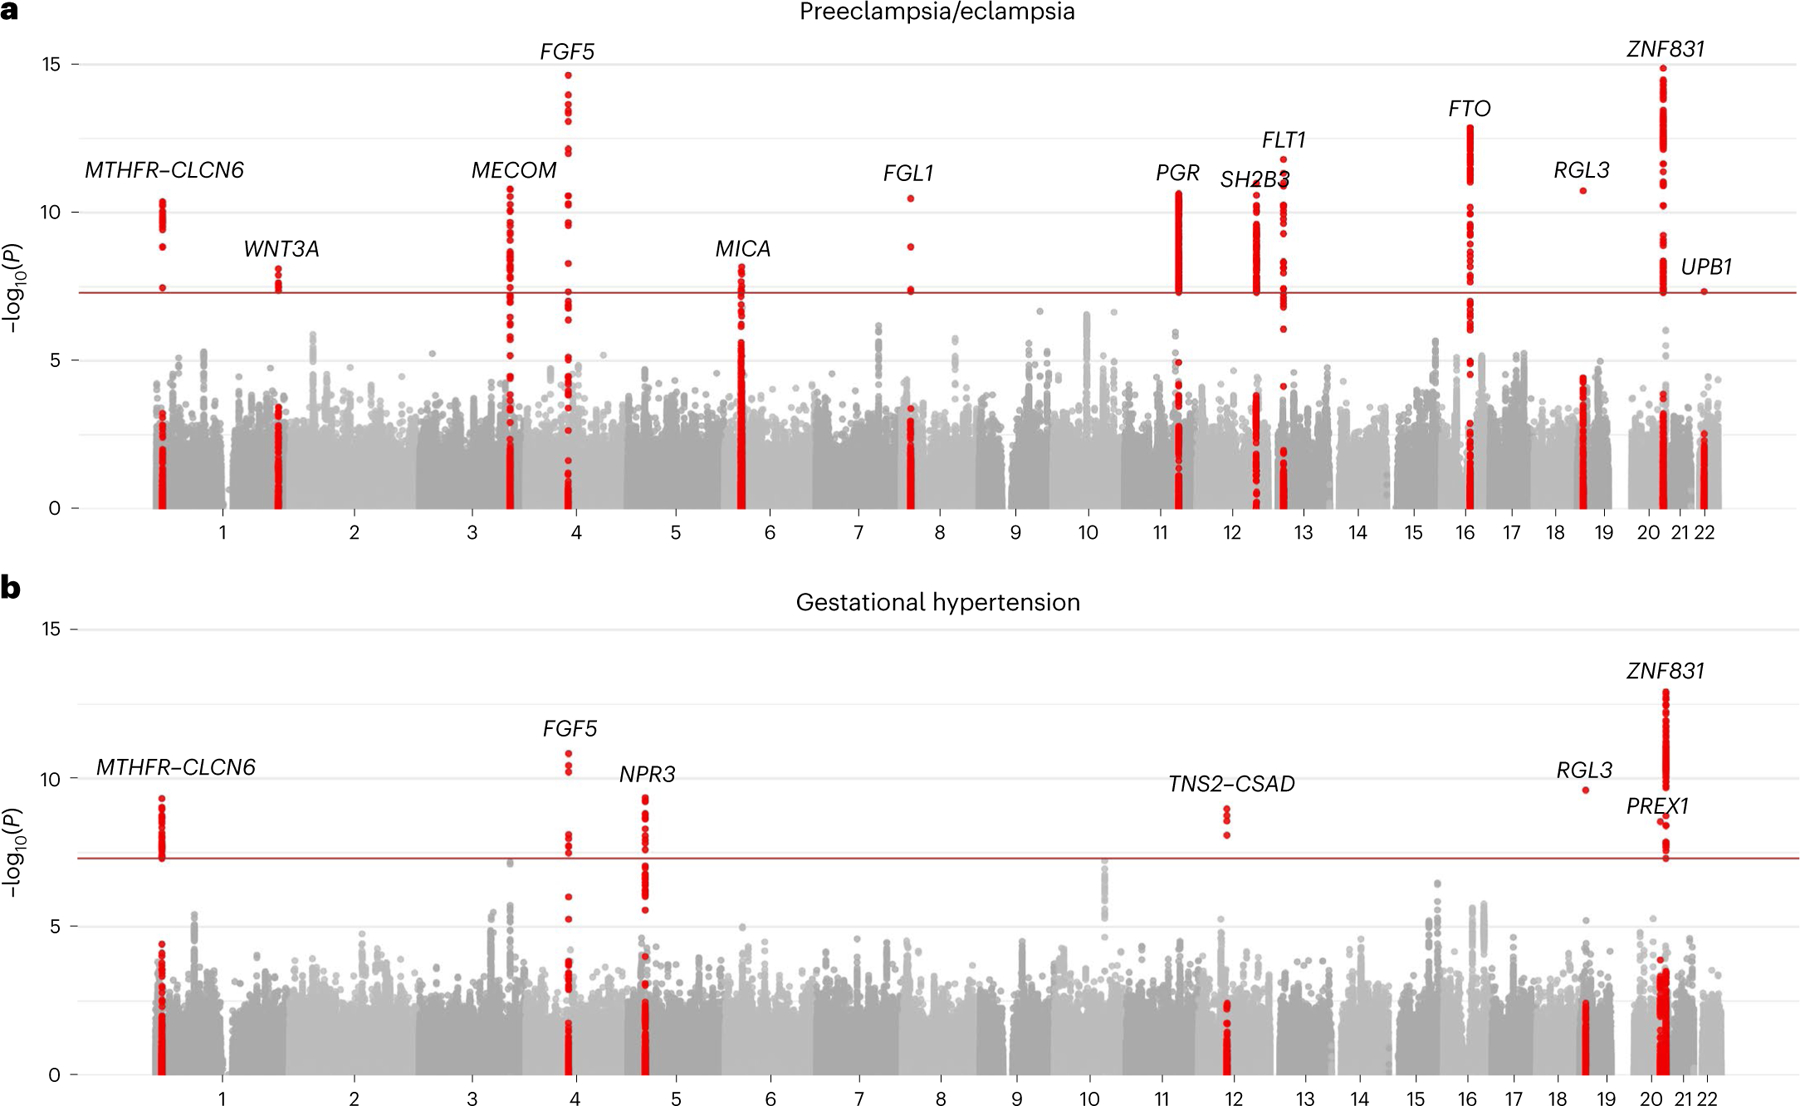
a,b, Manhattan plots (chromosomal position on the x axis and −log10 of the P value on the y axis) are displayed for (a) preeclampsia/eclampsia in 20,064 cases and 703,117 controls and (b) gestational hypertension in 11,027 cases and 412,788 controls. Analyses included a multi-ancestry meta-analysis of common variants (minor allele frequency ≥1%). Loci are labeled by the gene nearest to the lead variant. Two-sided P values (not adjusted for multiple comparisons) are from z scores from a fixed-effect inverse-variance-weighted meta-analysis.
We next tested the association of common variants with gestational hypertension among 8,961 cases and 184,925 control individuals in discovery analysis (91.3% European, 6.7% Asian, 0.7% African and 1.3% admixed American) and among 2,066 cases and 227,863 controls in follow-up cohorts (96.3% European, 3.4% African, and 0.3% admixed American; Supplementary Tables 1 and 2). Female individuals with gestational hypertension were identified primarily based on qualifying ICD codes for gestational hypertension and an absence of qualifying codes for preeclampsia/eclampsia. In discovery analysis, we identified seven independent genome-wide significant loci associated with gestational hypertension, including four also associated with preeclampsia/eclampsia (MECOM, FGF5, RGL3 and ZNF831) and three additional associations (NPR3 (5p13), TNS2–CSAD (12q13) and PREX1 (20q13); Table 2 and Extended Data Fig. 2b). Four of seven significant associations replicated with P < 0.05 in follow-up cohorts (FGF5, RGL3, PREX1 and ZNF831), and all seven loci had consistent direction of effect in follow-up cohorts. In a combined meta-analysis of discovery and follow-up cohorts, six of seven loci retained genome-wide significance and the MTHFR–CLCN6 locus (1p36) additionally reached genome-wide significance, yielding a total of seven loci associated with gestational hypertension in the combined meta-analysis (Fig. 1b). As with preeclampsia/eclampsia, we did not observe inflation in test statistics (lambda genomic inflation factor, 0.976; Supplementary Fig. 1b). Stratified analyses suggested potential heterogeneity of association by ancestry (Pheterogeneity = 0.001) at the MECOM locus, with an inverse association with the lead risk variant observed among those with admixed American ancestry (Supplementary Table 5).
Table 2 |. Maternal sequence variants associated with gestational hypertension.
| Discovery analysis (8,961 cases/184,925 controls) | Follow-up analysis (2,066 cases/227,863 controls) | Combined discovery and follow-up meta-analysis (11,027 cases/412,788 controls) | ||||||||||
|---|---|---|---|---|---|---|---|---|---|---|---|---|
| Nearest gene | Lead variant | CHR | POS | Effect allele/other allele | Weighted average EAF | OR | P value | P(het)a | OR | P value | OR | P value |
| Loci with genome-wide significance in the discovery analysis | ||||||||||||
| MECOM | rs9855086 | 3 | 169413542 | A/T | 0.54 | 1.10 | 4.6 × 10⁻⁸ | 0.54 | 1.04 | 0.28 | 1.08 | 6.6 × 10⁻⁸ |
| FGF5 | rs16998073 | 4 | 80263187 | T/A | 0.32 | 1.12 | 1.0 × 10⁻¹⁰ | 0.43 | 1.09 | 4.0 × 10⁻² | 1.12 | 1.5 × 10⁻¹¹ |
| NPR3 | rs13154066 | 5 | 32831564 | C/T | 0.58 | 1.11 | 5.2 × 10⁻¹⁰ | 0.37 | 1.05 | 0.14 | 1.10 | 4.5 × 10⁻¹⁰ |
| TNS2–CSAD | rs7139122 | 12 | 53173006 | A/G | 0.02 | 1.49 | 2.4 × 10⁻¹⁰ | 0.27 | 1.05 | 0.65 | 1.37 | 8.3 × 10⁻⁹ |
| RGL3 | rs167479 | 19 | 11416089 | G/T | 0.56 | 1.11 | 1.5 × 10⁻⁸ | 0.57 | 1.12 | 4.6 × 10⁻³ | 1.11 | 2.5 × 10⁻¹⁰ |
| PREX1 | rs2208589 | 20 | 48791877 | G/A | 0.84 | 1.15 | 2.8 × 10⁻⁸ | 0.22 | 1.11 | 2.8 × 10⁻² | 1.14 | 2.9 × 10⁻⁹ |
| ZNF831 | rs260017 | 20 | 59141918 | A/G | 0.18 | 1.17 | 2.6 × 10⁻¹² | 0.38 | 1.14 | 5.4 × 10⁻³ | 1.16 | 1.2 × 10⁻¹³ |
| Additional loci identified in combined discovery and follow-up meta-analysis | ||||||||||||
| MTHFR–CLCN6 | rs17367504 | 1 | 11802721 | A/G | 0.85 | 1.13 | 1.7 × 10⁻⁷ | 0.63 | 1.19 | 4.6 × 10⁻⁴ | 1.14 | 4.9 × 10⁻¹⁰ |
Two-sided P values (not adjusted for multiple comparisons) are from z scores from a fixed-effect inverse-variance-weighted meta-analysis.
P(het) indicates P value for heterogeneity across discovery cohorts. CHR, chromosome; EAF, effect allele frequency; OR, odds ratio; POS, position (genome build 38).
Genetic correlation across hypertension-related phenotypes
We used cross-trait linkage disequilibrium (LD) score regression20 to assess genetic correlations among preeclampsia/eclampsia, gestational hypertension, systolic BP (SBP) and diastolic BP (DBP)21. Preeclampsia/eclampsia and gestational hypertension were strongly genetically correlated (rg = 0.71, s.e. = 0.08). SBP demonstrated a stronger genetic correlation with gestational hypertension (rg = 0.73, s.e. = 0.06) versus preeclampsia/eclampsia (rg = 0.52, s.e. = 0.05). Of note, the correlation of SBP with gestational hypertension (rg = 0.73) was larger than that of SBP with DBP (rg = 0.62, s.e. = 0.03, in the Million Veteran Program21, with the similar genetic correlation between SBP and DBP observed previously in the UK Biobank22). Genetic correlations with the HDPs were stronger for SBP versus DBP (Extended Data Table 1).
Extended Data Table 1 |. Genetic correlation among preeclampsia, gestational hypertension, systolic blood pressure, and diastolic blood pressure.
| Preeclampsia/eclampsia | Gestational hypertension | Systolic blood pressure | |
|---|---|---|---|
| Preeclampsia/eclampsia | |||
| Gestational hypertension | 0.71 (0.08) | ||
| Systolic blood pressure | 0.52 (0.05) | 0.73 (0.06) | |
| Diastolic blood pressure | 0.49 (0.06) | 0.60 (0.06) | 0.62 (0.03) |
Correlation was calculated using summary statistics from discovery cohorts for preeclampsia and gestational hypertension and using summary statistics for systolic and diastolic blood pressure from the Million Veteran Program21. Genetic correlation (standard error) is displayed for each pairwise comparison.
Multitrait analysis of GWAS (MTAG)
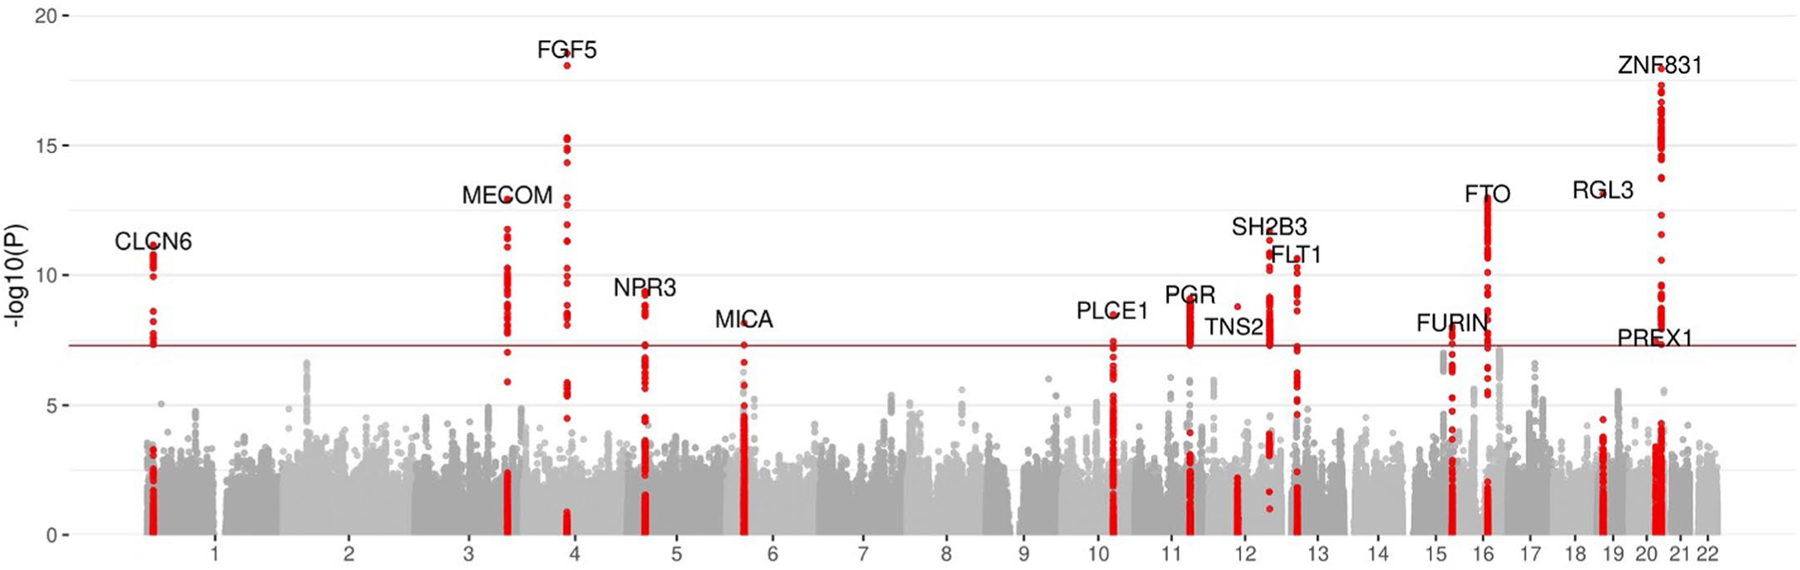
Given the high degree of genetic correlation observed between preeclampsia/eclampsia and gestational hypertension, we used MTAG summary statistics23 to boost power to identify additional associated variants. Consistent with this high degree of correlation, MTAG yielded very similar results for each trait (displayed for preeclampsia/eclampsia in Extended Data Fig. 3). MTAG identified the following two additional loci with genome-wide significance (Supplementary Table 6): PLCE1 (10q23), which is a BP-associated gene that encodes a phospholipase involved in glomerular podocyte development24 and that narrowly missed statistical significance in combined gestational hypertension meta-analysis (P = 6.0 × 10⁻⁸), and FURIN (15q26), which encodes a protein convertase involved in processing pronatriuretic peptides25 and whose expression is decreased in preeclamptic placentas26.
Gene prioritization at risk loci
To prioritize causal genes, we performed colocalization analysis with expression quantitative trait loci (eQTLs) within ±500 kb of lead variants across 52 tissues in the Genotype-Tissue Expression (GTEx) project (Supplementary Tables 7 and 8) (ref. 27). Colocalization implicated FGF5 and NPR3 as causal genes at their respective loci. The lead variant at the MTHFR–CLCN6 locus colocalized with CLCN6 eQTLs as well as expression of NPPA, which encodes the precursor to an atrial natriuretic peptide (ANP). The lead preeclampsia/eclampsia variant at the ZNF831 locus colocalized with multiple genes but most strongly with ZBTB46 expression, including in arterial tissue. We also observed multiple colocalizations with WNT3A (WNT3A, GJC2 and mitochondrial proteins IBA57 and MPRL55), MICA (CLIC1 and psoriasis-associated genes TCF19, CCHCR1 and PSORS1C1) and RGL3 (ZNF627 and EPOR). We observed no strong colocalizations with lead variants at LINC00484, PGR, SH2B3, FLT1, FTO or TNS2–CSAD.
Next, we queried variant-to-gene evidence in Open Targets Genetics v7 (Supplementary Tables 9 and 10) (ref. 28) and generated polygenic priority scores (PoPS; Supplementary Table 11) (ref. 29) for lead variants. Both approaches nominated MECOM, FGF5, SH2B3, FTO and NPR3 as the most likely causal gene and their respective loci. PoPS prioritized NPPA as the most likely causal gene at the MTHFR–CLCN6 locus and TRPC6 as the most likely causal gene at the PGR locus.
To further understand how identified genes might influence HDP risk, we queried lead maternal variants in the fetal GWAS for maternal preeclampsia discussed in ref. 13 (Supplementary Table 12). As published previously12,13, the lead FLT1 variant was strongly associated with preeclampsia (P = 3.9 × 10⁻¹¹); all other lead variants had P > 10−4 in the fetal GWAS. In addition, we queried the nearest genes and those prioritized by colocalization, variant-to-gene scores and/or PoPS in a publicly available database of the human placental transcriptome including preeclampsia cases and controls (Supplementary Table 13) (ref. 30). Consistent with the correlation of increased circulating placental sFlt-1 with preeclampsia incidence8,31, FLT1 gene expression was increased in preeclamptic placentas (log2(fold change) = 0.39, false discovery rate-adjusted P = 0.003). Expression of WNT3A, which occurs almost exclusively in the placenta32, was increased in preeclamptic placentas versus healthy controls (log2(fold change) = 0.21, adjusted P = 0.029). OBSCN, which was most strongly prioritized by PoPS at the WNT3A locus, was also overexpressed in preeclamptic versus control placentas (log2(fold change) = 0.18; adjusted P = 0.037). Furthermore, preeclamptic placentas demonstrated lower expression of ARHGAP42—which sits adjacent to PGR and encodes Rho GTPase activating protein 42, a known regulator of vascular tone and BP expressed selectively in smooth muscle cells33—compared with controls (log2(fold change) = −0.18, adjusted P = 0.004).
We analyzed the expression of prioritized genes in a dataset of single-nuclei RNA sequencing (snRNA-seq) from nonatherosclerotic human aortic tissue. SnRNA-seq identified subpopulations of vascular smooth muscle cells, fibromyocytes, fibroblasts, endothelial cells (ECs), macrophages, natural killer T cells and neuronal cells. The greatest enrichment was seen in the two EC populations and in macrophages (Extended Data Fig. 4). The EC1 subpopulation is enriched for genes in angiogenesis and lipoprotein assembly and clearance, while the EC2 subpopulation is enriched for genes in extracellular matrix production and integrin expression34. Relative expression in ECs versus other cell types was strongest for FLT1 (EC1/EC2), ZBTB46 (EC1) and MECOM (EC2).
Training and testing PRS
We used PRS–CS35 to construct genome-wide PRS for preeclampsia/eclampsia (PRSpreeclampsia) and gestational hypertension (PRSGH) from our corresponding discovery GWAS summary statistics. In addition, because BP polygenic risk has previously been associated with HDPs13–15, we used PRS–CS to derive a PRS for SBP (PRSSBP) using the SBP GWAS from the Million Veteran Program21 to compare prediction across scores and determine whether a linear combination of each HDP PRS and PRSSBP improves performance.
We tuned polygenic scores among female individuals with and without a history of HDPs in the UK Biobank. The global shrinkage parameter of 1 × 10⁻⁴ was chosen for PRSpreeclampsia and PRSSBP and of 1 × 10⁻⁶ for PRSGH as these values generated the highest R2 (Supplementary Table 14). A linear combination of PRSpreeclampsia and PRSSBP (PRSpreeclampsia+SBP) improved performance versus each score individually for the outcome of preeclampsia (Supplementary Table 15).
The polygenic scores tuned in the UK Biobank were carried forward for external validation in the following two complementary datasets: a Norwegian population-based cohort linked to the Medical Birth Register of Norway (Trøndelag Health Study (HUNT), preeclampsia/eclampsia only) and a prospective US pregnancy cohort (nuMoM2b). Among 25,582 Norwegian female participants in HUNT (1,569 (6.1%) with preeclampsia/eclampsia), the prevalence of preeclampsia/eclampsia ranged from ~4% among those in the bottom decile of PRSpreeclampsia+SBP to ~10% among the top decile of PRSpreeclampsia+SBP (Fig. 2a). After adjustment for age, age2 and the first 10 principal components (PC) of ancestry, the OR corresponding to the top 10% versus bottom 90% of PRSpreeclampsia+SBP was 1.85 (95% confidence interval (CI) = 1.61–2.13, P = 6.3 × 10⁻¹⁸; Extended Data Table 2). PRSpreeclampsia+SBP increased Nagelkerke’s R2 by 28.5% compared with the PRSpreeclampsia alone and by 79.3% compared with PRSSBP alone (Supplementary Table 16).
Fig. 2 |. Polygenic prediction of preeclampsia/eclampsia and gestational hypertension in test cohorts.
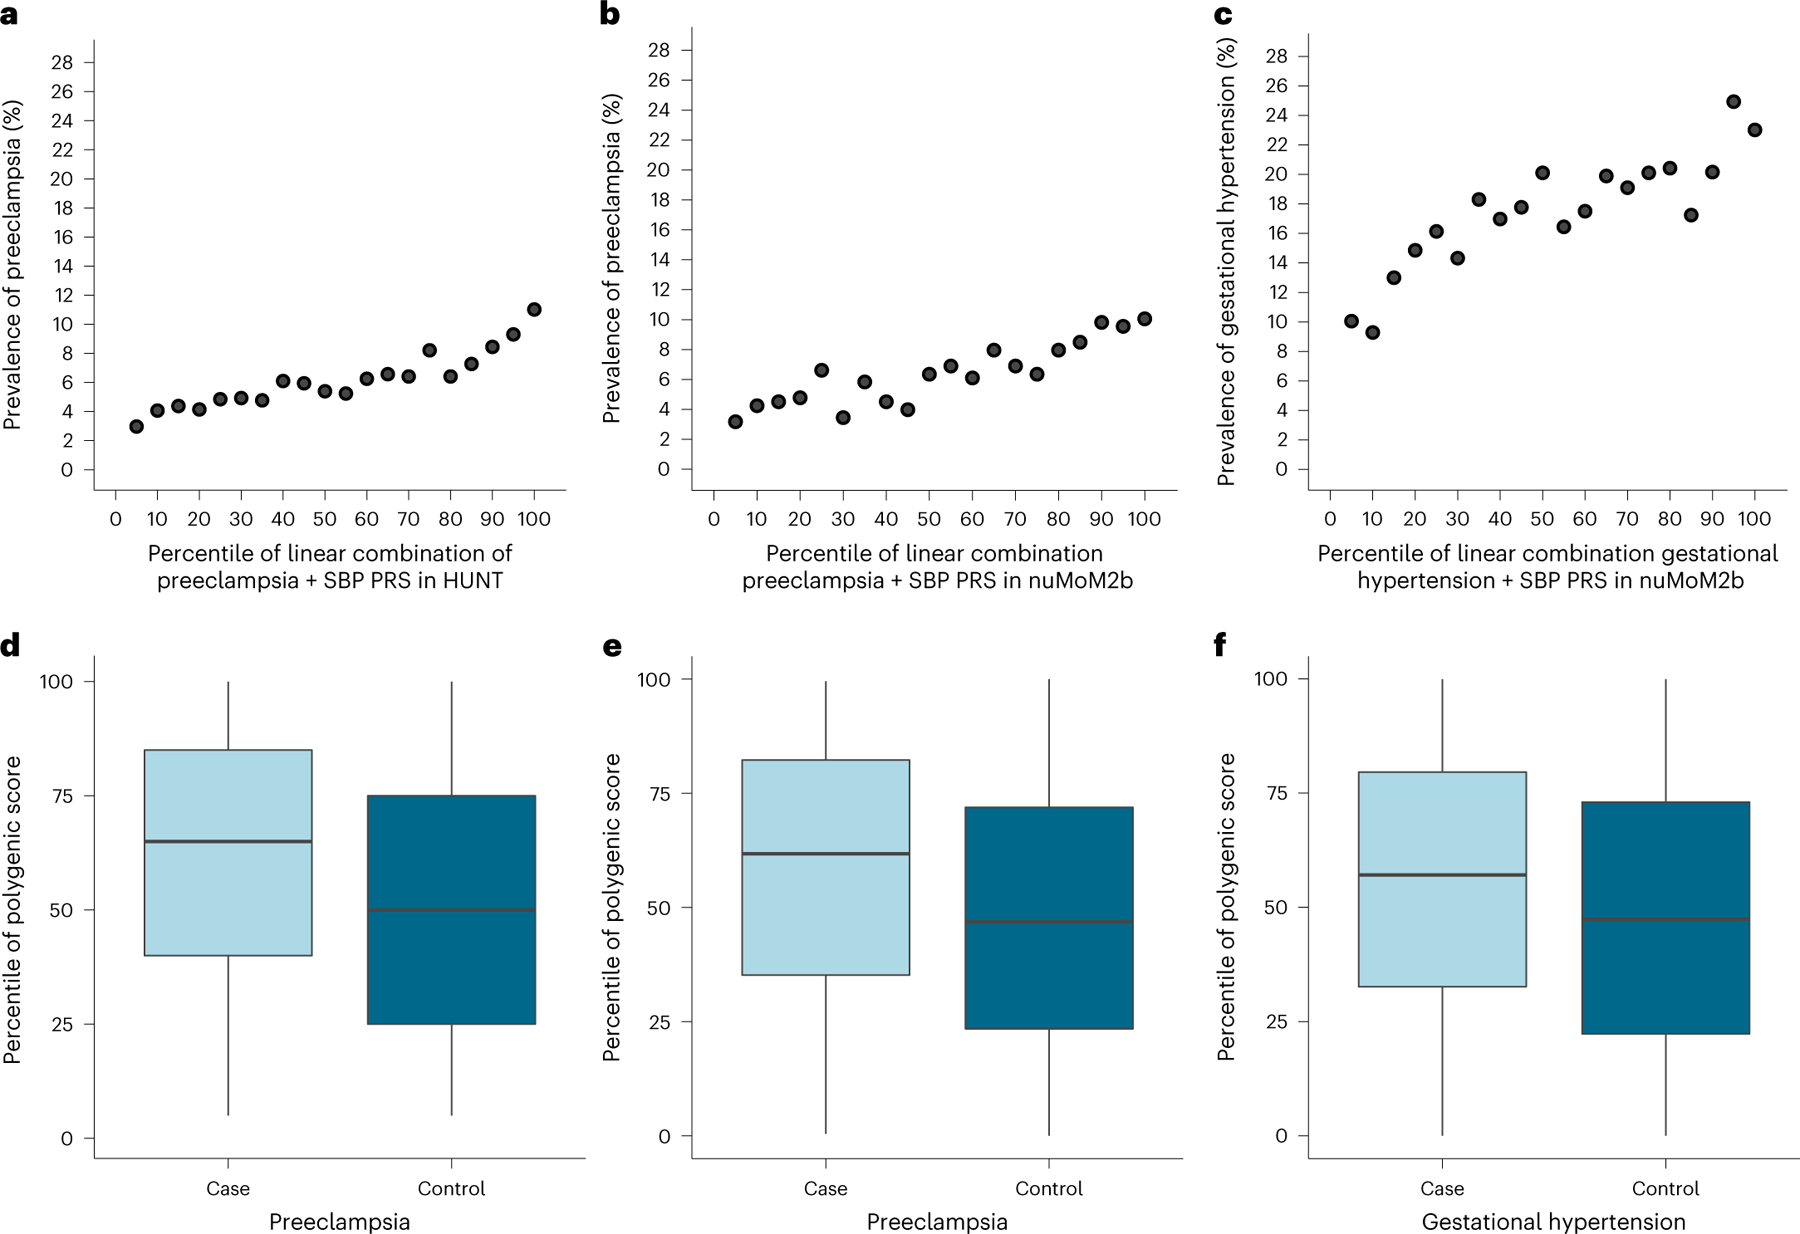
PRS for preeclampsia/eclampsia and gestational hypertension were derived from our discovery genome-wide meta-analyses, tuned in the UK Biobank, and carried forward for testing in independent cohorts (HUNT and nuMoM2b). Prevalence of preeclampsia/eclampsia versus percentile of PRSpreeclampsia+SBP in (a) HUNT and (b) nuMoM2b. c, Prevalence of gestational hypertension vs. percentile of PRSGH+SBP in nuMoM2b. Distribution of PRSpreeclampsia+SBP percentile by preeclampsia/eclampsia status in (d) HUNT (n = 25,582; 1,569 with preeclampsia/eclampsia and 24,013 control participants) and (e) nuMoM2b (n = 6,225; 481 with preeclampsia/eclampsia and 5,744 control participants). f, Distribution of PRSGH+SBP percentile by gestational hypertension status in nuMoM2b (n = 7,063; 1,319 with gestational hypertension and 5,744 control participants). Within each boxplot, horizontal lines reflect the median, top and bottom of the box reflect the interquartile range and whiskers reflect the maximum and minimum PRS percentile within each grouping.
Extended Data Table 2 |. Polygenic score performance for predicting preeclampsia/eclampsia in the HUNT study.
| Per standard deviation of polygenic risk | Top 10% vs. bottom 90% of polycienic risk | |||
|---|---|---|---|---|
| Polygenic score | Odds ratio (95% confidence interval) | P value | Odds ratio (95% confidence interval) | P value |
| Preeclampsia/eclampsia | 1.31 (1.24–1.38) | 1.7×10⁻²⁴ | 1.53 (1.32–1.77) | 2.3×10⁻⁸ |
| SBP | 1.24 (1.17–1.30) | 7.7×10⁻¹⁶ | 1.66.(1.43–1.92) | 7.0×10⁻¹² |
| Linear combination of preeclampsia/eclampsia + SBP | 1.37 (1.30–1.44) | 3.9×10⁻³³ | 1.85 (1.61–2.13) | 6.3×10⁻¹⁸ |
| Gestational hypertension | 1.20 (1.14–1.26) | 3.4×10⁻¹² | 1.23 (1.05–1.44) | 1.0×10⁻² |
| Linear combination of gestational hypertension + SBP | 1.29 (1.22–1.36) | 6.7×10⁻²² | 1.62 (1.40–1.87) | 1.1×10⁻¹⁰ |
Models tested the associations of polygenic scores with preeclampsia/eclampsia in 1,569 individuals with preeclampsia/eclampsia and 24,013 female control individuals. Two-sided P values (not adjusted for multiple comparisons) are from logistic regression adjusted for maternal age at delivery, age2, and the first ten principal components of genetic ancestry. SBP, systolic blood pressure.
We next tested PRS performance in the prospective, multi-ancestry nuMoM2b cohort of US female individuals recruited in the first trimester of their first pregnancy, including 481 (6.4%) who developed preeclampsia, 1,319 (17.5%) who developed gestational hypertension and 5,744 with normotensive pregnancies (overall 73.6% European, 16.5% African and 1.0% admixed American ancestry). Rates of preeclampsia/eclampsia ranged from ~4% among those in the bottom decile of PRSpreeclampsia+SBP to ~10% among the top decile of PRSpreeclampsia+SBP (Fig. 2b). Rates of gestational hypertension ranged from ~9% among those in the bottom decile of PRSGH+SBP to ~24% among the top decile of PRSGH+SBP (Fig. 2c). As in HUNT, incorporating SBP PRS in linear combination boosted PRS performance for HDPs, especially for gestational hypertension, although PRS performance was better in female participants with European versus other ancestries (Supplementary Table 17). After adjustment for age, PC 1–10 and self-reported race/ethnicity, PRSpreeclampsia+SBP and PRSGH+SBP each predicted their respective outcomes (preeclampsia/eclampsia: OR = 1.78, 95% CI = 1.35–2.31, for top 10% versus bottom 90% PRSpreeclampsia+SBP, P = 2.6 × 10⁻⁵; gestational hypertension: OR = 1.52, 95% CI = 1.26–1.84, for top 10% versus bottom 90% PRSGH+ SBP, P = 1.0 × 10⁻⁵). As prepregnancy hypertension and obesity are established clinical predictors of HDPs, we performed further adjustments for first-trimester SBP, antihypertensive medication use (as a marker of chronic hypertension) and body mass index (BMI). After this additional adjustment, the scores both remained predictive (preeclampsia/eclampsia: OR = 1.64, 95% CI = 1.23–2.15, for top 10% versus bottom 90% PRSpreeclampsia+SBP, P = 5.1 × 10⁻⁴; gestational hypertension: OR = 1.53, 95% CI = 1.26–1.85, for top 10% versus bottom 90% PRSGH+SBP, P = 1.0 × 10⁻⁵). Compared with a model including age, PC 1–10, self-reported race/ethnicity, first-trimester SBP, antihypertensive medication use and first-trimester BMI, addition of PRSpreeclampsia+SBP improved the C-statistic for preeclampsia/eclampsia from 0.690 to 0.701 (+0.011, 95% CI = 0.001–0.021, Delong’s P = 3.7 × 10⁻²). Similarly, addition of PRSGH+SBP improved the C-statistic for gestational hypertension from 0.649 to 0.659 (+0.010, 95% CI = 0.003–0.018, Delong’s P = 5.7 × 10⁻³).
Low-dose aspirin startign after 12 weeks’ gestation represents an evidence-based but underused strategy to reduce risk of preeclampsia. To probe the potential clinical impact of incorporating PRS to guide aspirin allocation, we examined aspirin eligibility according to current US Preventive Service Task Force major criteria36 with and without addition of PRSpreeclampsia+SBP as an additional eligibility criterion in the nuMoM2b cohort. Among singleton, nulliparous female individuals (that is, the population enrolled in nuMoM2b), major criteria for aspirin eligibility are chronic prepregnancy hypertension, pregestational diabetes, kidney disease and autoimmune disease36. The sensitivity of major risk factors for preeclampsia/eclampsia was only 17.5% with a corresponding positive predictive value of 12.8% (Table 3). Incorporating the top 10% of PRSpreeclampsia+SBP increased identification of the aspirin-eligible proportion to 30.4% of those with preeclampsia/eclampsia (that is, sensitivity 30.4% (95% CI = 26.2–34.5%)) with the specificity of 83.3% (95% CI = 82.5–84.2%), positive predictive value of 11.0% (95% CI = 9.3–12.7%) and negative predictive value of 94.6% (95% CI = 94.1–95.2%; Table 3). Expanding aspirin eligibility further to include the top 25% of PRSpreeclampsia+SBP captured nearly half (47.0%) of those who developed preeclampsia/eclampsia. The addition of high PRSpreeclampsia+SBP to major risk factors to up-classify the risk of preeclampsia/eclampsia yielded net reclassification of +1.8% (95% CI = −0.3% to +4.0%) for top 5% PRSpreeclampsia+SBP, +4.3% (95% = CI 1.3–7.3%) for top 10% PRSpreeclampsia+SBP, and +8.3% (95% CI = 3.9–12.6%) for top 25% PRSpreeclampsia+SBP (Table 3).
Table 3 |. Aspirin eligibility to prevent preeclampsia using major clinical risk factors and polygenic risk.
| Total N = 7,544 | Outcome | Net reclassification, HDPs versus normotensive pregnancy (95% CI) | Net reclassification, preeclampsia versus other pregnancy (95% CI) | Preeclampsia versus other pregnancy | |||||
|---|---|---|---|---|---|---|---|---|---|
| Normotensive pregnancy (n = 5,744) | Gestational hypertension (n = 1,319) | Preeclampsia/eclampsia (n = 481) | |||||||
| Sensitivity (95% CI) | Specificity (95% CI) | Positive predictive value (95% CI) | Negative predictive value (95% CI) | ||||||
| Major risk factors only (n = 656(8.7%)) | 476 (8.3%) | 96 (7.3%) | 84 (17.5%) | Reference group | Reference group | 17.5% (14.1–20.9%) | 91.9% (91.3–92.5%) | 12.8% (10.2–15.4%) | 94.2% (93.7–94.8%) |
| Major risk factors or top 5% PRS (n = 997(13.2%)) | 699 (12.2%) | 184 (13.9%) | 114 (23.7%) | +2.7% (1.4–4.0%) | +1.8% (−0.3% to 4.0%) | 23.7% (19.9–27.5%) | 87.5% (86.7–88.3%) | 11.4% (9.5–13.4%) | 94.4% (93.8–95.0%) |
| Major risk factors or top 10% PRS (n = 1,324(17.6%)) | 928 (16.2%) | 250 (19.0%) | 146 (30.4%) | +4.1% (2.5–5.8%) | +4.3% (1.3–7.3%) | 30.4% (26.2–34.5%) | 83.3% (82.5–84.2%) | 11.0% (9.3–12.7%) | 94.6% (94.1–95.2%) |
| Major risk factors or top 25% PRS (n = 2,298(30.5%)) | 1,612 (28.1%) | 460 (34.9%) | 226 (47.0%) | +8.3% (6.0–10.7%) | +8.3% (3.9–12.6%) | 47.0% (42.5–51.4%) | 70.7% (69.6–71.7%) | 9.8% (8.6–11.1%) | 95.1% (94.6–95.7%) |
This Table reports the proportion of participants in nuMoM2b (nulliparous female participants with singleton gestations recruited in the first trimester of pregnancy) who experienced each pregnancy outcome in the index pregnancy (normotensive pregnancy, gestational hypertension or preeclampsia/eclampsia) who would have been identified as candidates for low-dose aspirin to prevent preeclampsia according to US Preventive Services Task Force major criteria, with or without addition of preeclampsia/eclampsia and SBP combination polygenic risk score (PRSpreeclampsia+SBP) as an additional criterion for aspirin eligibility. Net reclassification analyses reflect the use of PRSpreeclampsia+SBP to up-classify risk for composite HDPs versus normotensive pregnancy and for preeclampsia/eclampsia versus other pregnancies when added to major risk factors.
Phenome-wide associations with polygenic risk
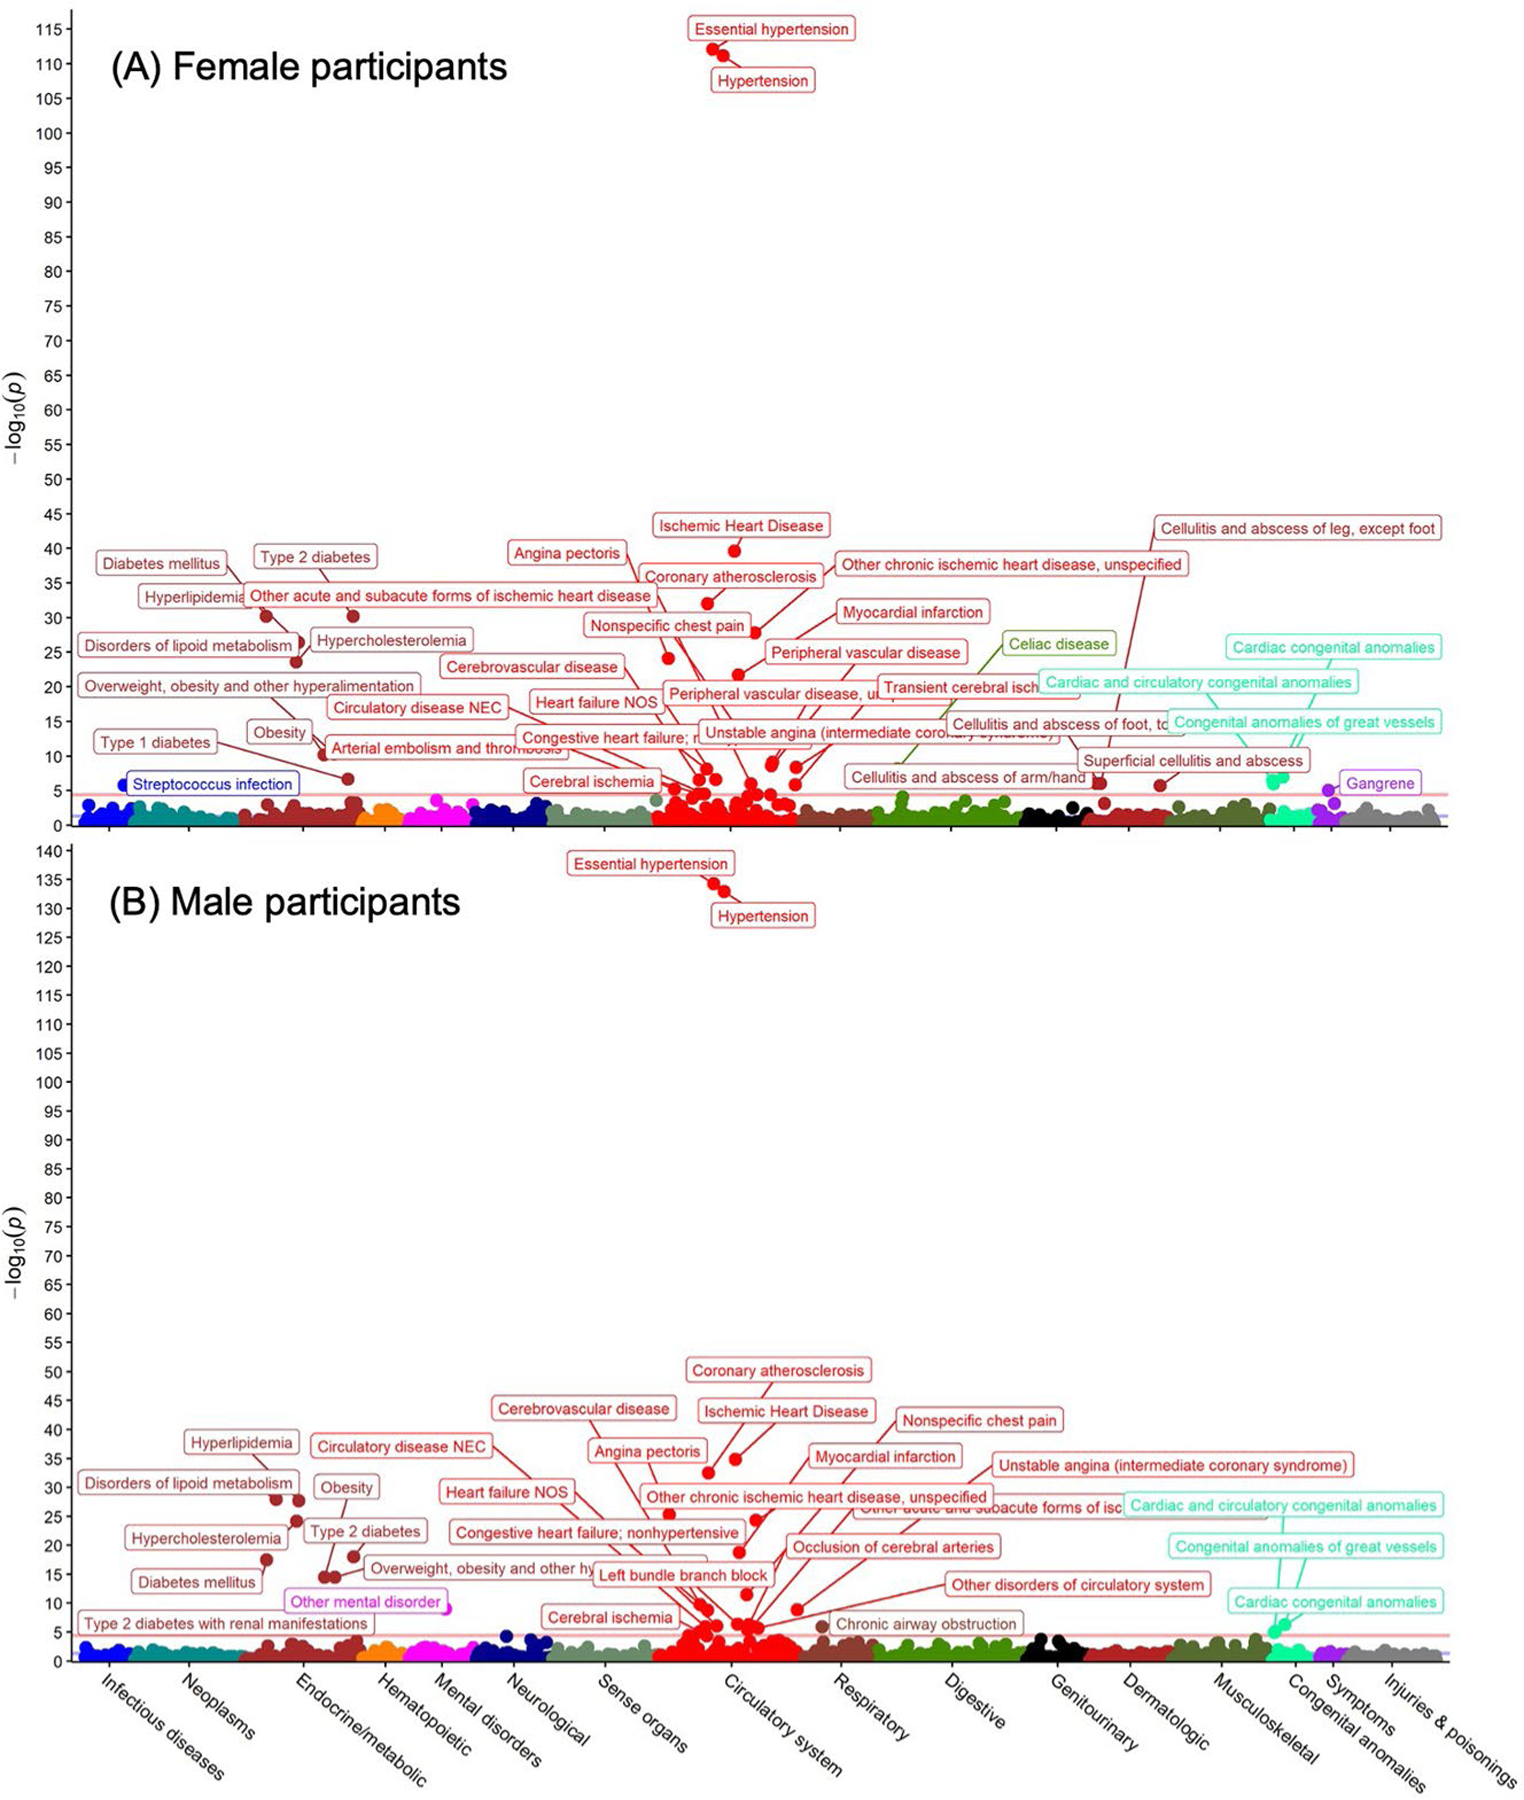
We performed sex-stratified phenome-wide association analysis for PRSpreeclampsia and PRSGH across 1,445 phecode-based phenotypes in the UK Biobank. PRSpreeclampsia was associated with 36 phenotypes in female participants and 37 phenotypes in male participants with Bonferroni-corrected statistical significance (P < 0.05/1,445 = 3.5 × 10⁻⁵; Fig. 3); PRSGH was significantly associated with 25 and 32 phenotypes in female and male participants, respectively (Extended Data Fig. 5). PRSpreeclampsia and PRSGH were most strongly associated with hypertension in both sexes (PRSpreeclampsia: ORfemale = 1.15 per s.d., 95% CI = 1.14–1.16, P = 1.4 × 10−175; ORmale = 1.12 per s.d., 95% CI = 1.11–1.13, P = 7.5 × 10−112; PRSGH: ORfemale = 1.15 per s.d., 95% CI = 1.14–1.16, P = 5.1 × 10−184; ORmale = 1.13 per s.d., 95% CI = 1.11–1.14, P = 1.3 × 10−133). Other strong phenotypic associations included hypercholesterolemia, type 2 diabetes, obesity and atherosclerotic cardiovascular disease (Supplementary Tables 18 and 19). PRSpreeclampsia predicted ischemic heart disease in female (OR = 1.09 per s.d., 95% CI = 1.07–1.11, P = 4.4 × 10⁻²⁷) and male participants (OR = 1.09 per s.d., 95% CI = 1.07–1.10, P = 2.6 × 10−40), as did PRSGH (ORfemale = 1.07 per s.d., 95% CI = 1.05–1.08, P = 4.4 × 10⁻¹⁶; ORmale = 1.08 per s.d., 95% CI = 1.07–1.09, P = 1.4 × 10⁻³⁵). These similar associations between sexes suggest that most genes identified are not pregnancy-specific, but rather that pregnancy likely unmasks underlying risk. PRSpreeclampsia was also associated with several autoimmune phenotypes, including celiac disease, type 1 diabetes, hypothyroidism (in female participants) and a suggestive association with rheumatoid arthritis in females (P = 5.7 × 10⁻⁶), whereas type 1 diabetes and celiac disease were not significantly associated with PRSGH in either sex.
Fig. 3 |. Sex-stratified phenome-wide association study of preeclampsia/eclampsia polygenic risk in the UK Biobank.
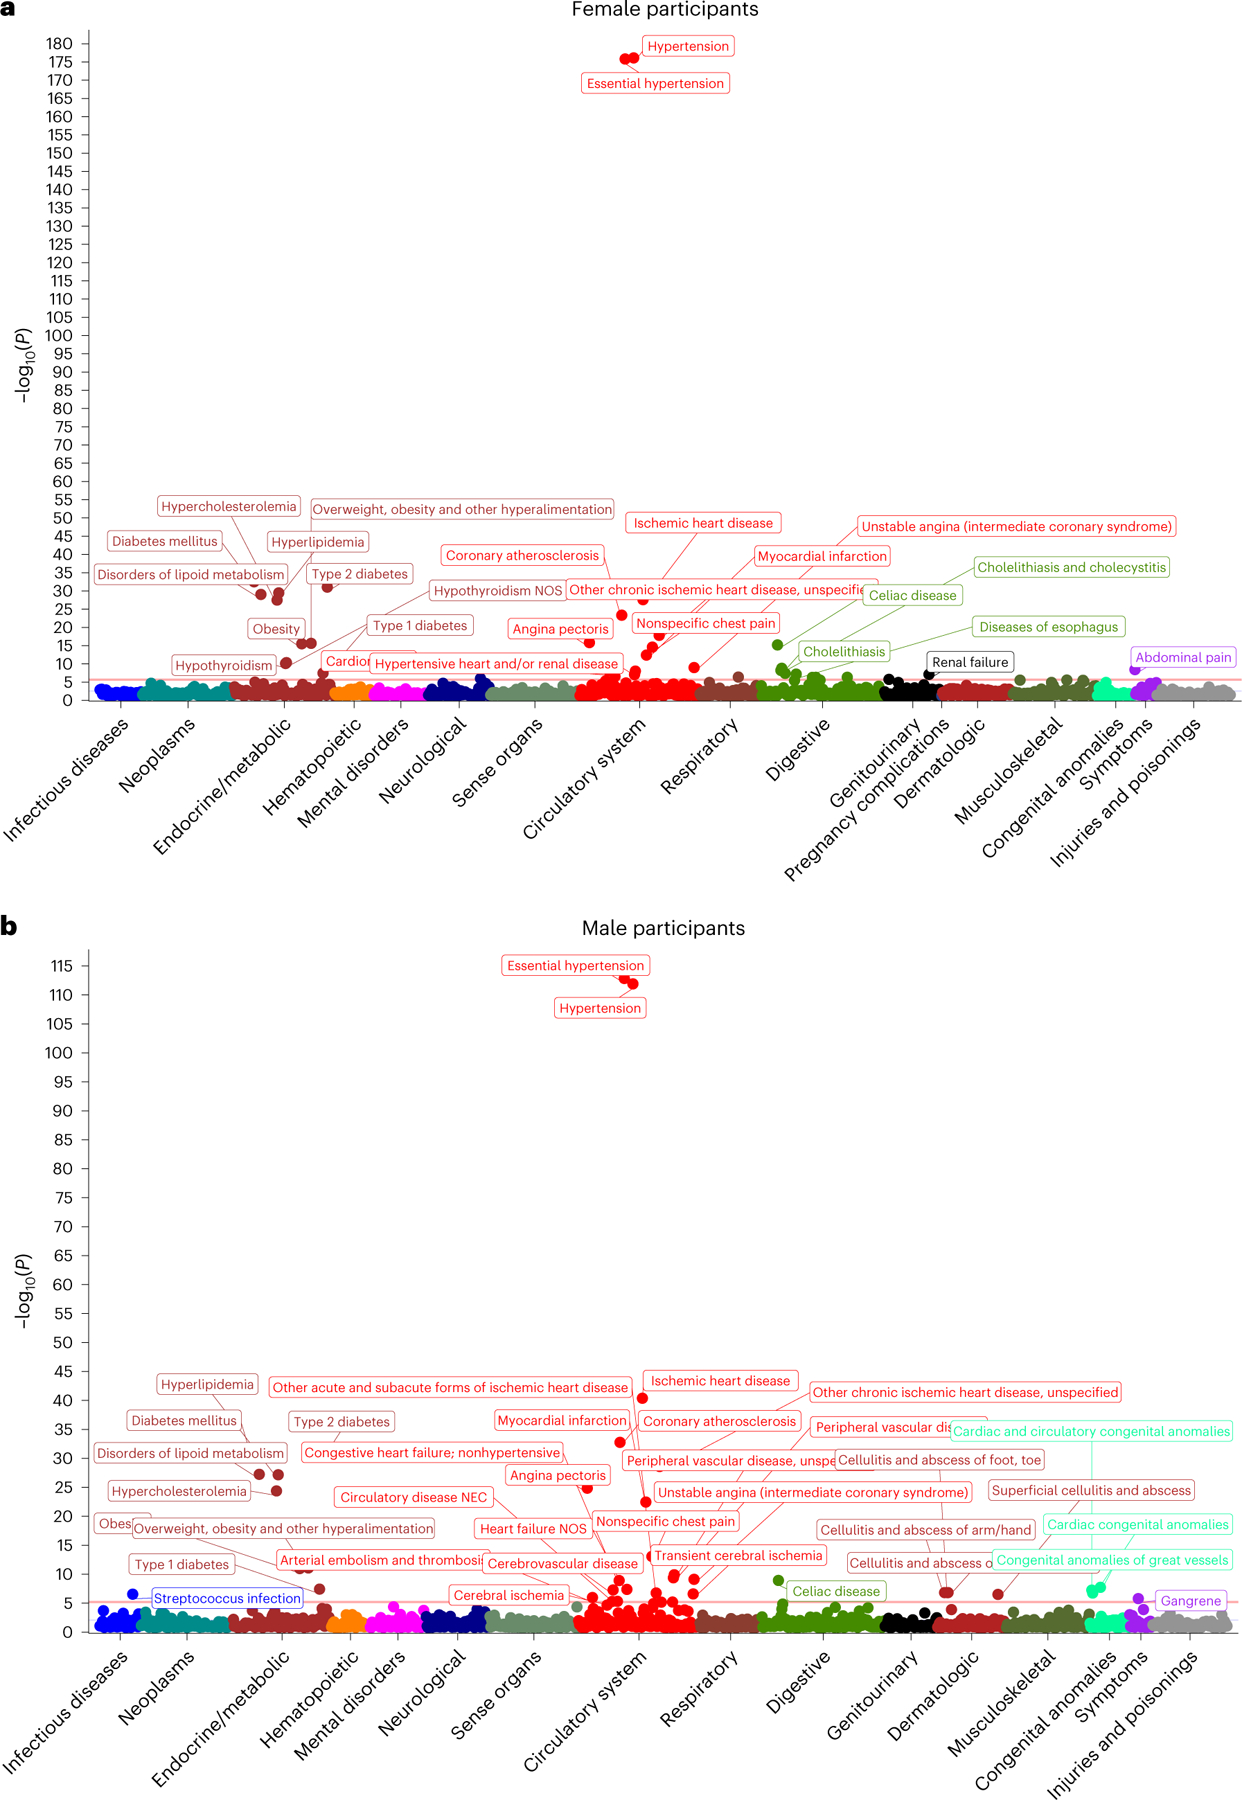
Preeclampsia/eclampsia polygenic risk was associated with 1,445 phenotypes among (a) female and (b) male participants in the UK Biobank. Two-sided P values (not adjusted for multiple comparisons) are from logistic regression models adjusted for age and the first five principal components of genetic ancestry.
Discussion
We present an expanded multi-ancestry maternal GWAS of preeclampsia/eclampsia and a distinct maternal GWAS of gestational hypertension. Altogether, we identified 18 independent genomic loci associated with preeclampsia/eclampsia and/or gestational hypertension. Identified loci highlight the role of angiogenesis and EC function (FLT1 and ZBTB46), natriuretic peptide signaling (NPPA, NPR3 and FURIN), renal glomerular function (TRPC6, TNS2 and PLCE1) and immune dysregulation (MICA and SH2B3) in the pathogenesis of these conditions, with some loci (FLT1 (refs. 12,13,31) and WNT3A (refs. 37,38)) previously described to influence risk via the fetal genome. Furthermore, we found that PRS predicted HDP risk among nulliparous female individuals independent of first-trimester risk factors, indicating the potential clinical utility of these scores’ risk for pregnancy risk stratification. Collectively, these findings may have implications for advancing HDP prediction, prevention and treatment.
First, our findings provide insights into the mechanisms of HDP pathogenesis and underscore the causal role of BP. High genetic correlation between BP and the HDPs aligns with prior work demonstrating heightened polygenic BP risk in those with HDPs13–15. The recently published randomized Chronic Hypertension and Pregnancy (CHAP) trial of treatment for mild chronic hypertension in pregnancy demonstrated that lowering BP pharmacologically reduced the risk of progression to preeclampsia39, supporting the notion that elevated BP is not merely a clinical manifestation of the HDPs but also has a causal role in disease pathogenesis.
Second, our GWAS findings implicate natriuretic peptide signaling in the pathogenesis of the HDPs. The natriuretic peptides (for example, ANP and B-type natriuretic peptide (BNP)) promote renal sodium excretion and counteract renin-angiotensin and sympathetic nervous system activation. ANP also has a role in uterine decidualization and spiral artery remodeling40, a process known to be impaired in the early pathogenesis of preeclampsia1,7. Furthermore, ANP is cleared from the circulation by the protein product of NPR3 (ref. 41), and human data support accelerated ANP clearance in preeclampsia42. Notably, our lead risk variant at the MTHFR–CLCN6 locus is associated with reduced levels of circulating N-terminal pro-BNP43. A recent analysis found that first-trimester levels of N-terminal pro-BNP were unexpectedly lower among female individuals who subsequently developed HDPs later in pregnancy after adjustment for race and BMI44. Collectively, these findings suggest that a relative deficiency in endogenous natriuretic peptide signaling may predispose to HDPs. Synthetic natriuretic peptides have been developed previously (for example, nesiritide), and the natriuretic peptides may represent a future therapeutic target for direct or indirect modulation toward HDP prevention and/or treatment.
Third, our findings suggest other potential new mechanisms underlying HDPs and implicate ZBTB46 in risk associated with the ZNF831 locus45. ZBTB46 is a transcription factor expressed in dendritic cells and vascular ECs, and ZBTB46 overexpression suppresses EC proliferation and angiogenesis in vitro46. Furthermore, ZBTB46 is sensitive to shear stress46, which may have relevance to the hyperdynamic hemodynamic state of pregnancy. In addition, the association in the intergenic region between PGR and TRPC6 has several plausible mechanistic links to the HDPs. Along with other newly identified HDP-associated loci (TNS2 and PLCE1 (ref. 24)), TRPC6 is linked to glomerular function. It has been implicated in focal segmental glomerulosclerosis and diabetic nephropathy47 and mediates proteinuria and renal dysfunction induced by exposure to hypertension and diabetes48. In addition, ARHGAP42 (adjacent to PGR) was found to have reduced expression in preeclamptic placentas and regulates vascular tone33. Further research is necessary to clarify which mechanisms primarily mediate the preeclampsia/eclampsia risk associated with the PGR/TRPC6 locus.
Fourth, associations at MICA and SH2B3 highlight the role of immune function in preeclampsia, potentially reflecting the importance of maternal immune tolerance of fetal cells at the maternal–fetal interface7. Differences in T-cell phenotypes and circulating proinflammatory and anti-inflammatory cytokines in preeclampsia are well-described7,49. SH2B3 (also known as LNK) is expressed primarily in endothelial and hematopoietic cells and negatively regulates cytokine signaling; reduced SH2B3 function has been linked to atherosclerosis as well as several autoimmune diseases50. The lead variant in our preeclampsia/eclampsia GWAS at SH2B3 is in LD (D′ = 0.96, R2 = 0.91) (ref. 51) with the well-described coronary artery disease risk allele at this locus (rs3184504) (ref. 52). Our lead SH2B3 variant was also previously associated with heightened levels of vascular cell adhesion protein 1, interleukin-2 receptor and other immune-related proteins43. Furthermore, recent data indicate that reduced SH2B3 function promotes neutrophil extracellular trap formation, a process implicated in preeclampsia pathogenesis53, and arterial thrombosis54.
Fifth, polygenic risk may inform pregnancy risk stratification. The predictive accuracy of clinical risk factors for HDPs is modest55. Among established risk factors for preeclampsia, nulliparity carries the largest population-attributable risk (approximately one-third)9, and most affected individuals lack any overt prepregnancy risk factors other than nulliparity5. Low-dose aspirin after 12 weeks’ gestation represents one evidence-based strategy to mitigate the risk of preeclampsia and preterm birth36. Improving pregnancy risk prediction, therefore, remains a pressing clinical need to optimize HDP prevention. First-trimester screening algorithms have been developed, with the UK Fetal Medicine Foundation combined prediction model56 incorporating clinical factors, mean arterial pressure, uterine artery pulsatility index and maternal serum pregnancy-associated plasma protein A and placental growth factor being most extensively validated to date, although not currently endorsed by the UK or US care guidelines36. Future studies are required to ascertain whether PRS may augment existing risk algorithms. In contrast with markers measured during pregnancy, PRS can be calculated anytime from birth, including preconception, and may therefore also inform preconception counseling and health optimization.
Although our GWAS included substantially more individuals of African, Asian and admixed American ancestries than prior GWAS, >80% of individuals were of European ancestry, and as such, the preeclampsia/eclampsia and gestational hypertension PRS generally performed better in individuals of European ancestry versus others, consistent with many prior published PRS and a well-recognized challenge in contemporary genetics57. Ongoing efforts to include accurate, detailed pregnancy and reproductive history phenotypes in diverse genetic datasets and increase representation of individuals of diverse ancestries will be critical to improve genetic discovery and cross-ancestry polygenic prediction and achieve genomic equity57.
This study should be considered in the context of other limitations. The prevalence of HDPs is substantially lower than expected in the UK Biobank and Penn Medicine Biobank (PMBB). Furthermore, due to HDP phenotyping limitations in large datasets using ICD code-based ascertainment, some participants may have had preeclampsia superimposed on chronic hypertension rather than de novo preeclampsia, which may enrich genetic associations for hypertension predilection. In a subset of cohorts, however, the control group included individuals with chronic hypertension in pregnancy. Validation studies of ICD codes and registry diagnoses demonstrate that these approaches have modest sensitivity but high specificity and positive predictive value (>80%) in comparison with adjudicated HDP diagnoses58–60. We were unable to examine more granular HDP subtypes, such as preeclampsia with severe features, hemolysis, elevated liver enzymes and low platelets (HELLP) syndrome, preterm versus term versus postpartum onset or HDP with versus without accompanying fetal growth restriction. The underlying pathophysiology of the HDPs is heterogeneous and may vary across these subtypes; future adequately powered studies should examine these subtypes separately as implications for pregnancy care and long-term maternal health risk may differ. In addition, we lacked paired maternal–fetal samples to condition maternal risk variants on fetal genotype, although other complementary analyses such as placental transcriptomics indicated variants more likely to be influencing risk via the fetal genome. Finally, snRNA-seq analyses were performed in male aortic tissue. Although findings are consistent with the current understanding of HDPs, future work is needed to verify that these results are consistent and determine whether additional insights may be apparent in female individuals.
Overall, multi-ancestry genome-wide meta-analysis of preeclampsia/eclampsia and gestational hypertension revealed distinct and overlapping risk loci and enabled polygenic prediction of the HDPs, with implications for HDP prediction, prevention and treatment.
Methods
Ethics approval
This research complies with all relevant ethical regulations. All participants in all studies contributing data for this study signed informed consent for participation and the use of data in research. FinnGen was approved by the Coordinating Ethics Committee of the Helsinki and Uusimaa Hospital District. The Estonian Committee on Bioethics gave ethical approval for the work conducted in the Estonian Biobank. The South East Research Ethics Committee gave ethical approval for the work conducted in Genes & Health. The University of Michigan Medical School Institutional Review Board gave ethical approval for the analyses conducted in the Michigan Genomics Initiative. The Mass General Brigham Institutional Review Board gave ethical approval for the work conducted in the Mass General Brigham Biobank. Biobank Japan received ethics approval from the Institute of Medical Science, the University of Tokyo, the RIKEN Yokohama Institute, and all participating hospitals. BioMe received ethics approval from the Icahn School of Medicine at Mt. Sinai Institutional Review Board. We used publicly available summary statistics for the discovery of GWAS from the InterPregGen consortium; all contributing studies received ethics approval as reported previously13. The work conducted in HUNT was approved by the Regional Committee for Ethics in Medical Research, Norway (2018/2488). The PMBB received ethics approval from the University of Pennsylvania Institutional Review Board. The North West Multi-centre Research Ethics Committee approved the UK Biobank; the Mass General Brigham Institutional Review Board approved secondary data analyses of the UK Biobank (application, 7089). The nuMoM2b study was approved by the institutional review boards of each participating site (Case Western Reserve University, Columbia University, Indiana University, University of Pittsburgh, Northwestern University, University of Pennsylvania, University of California at Irvine and University of Utah). The biorepository contributing aortic tissue for snRNA-seq received ethics approval from the Mass General Brigham Institutional Review Board.
Study cohorts, genotyping and association analysis
Preeclampsia/eclampsia and gestational hypertension case and control counts and definitions for each cohort are summarized in Supplementary Tables 1–3. If an individual had qualifying codes for both preeclampsia/eclampsia and gestational hypertension, she was designated as having preeclampsia/eclampsia. In multi-ancestry cohorts, association analyses were performed within each ancestry group separately and subsequently meta-analyzed. Sex was confirmed genetically.
FinnGen.
Sample genotyping in FinnGen was performed using Illumina (Illumina) and Affymetrix (Thermo Fisher Scientific) arrays. Genotype calls were made using GenCall or zCall for Illumina and AxiomGT1 algorithm for Affymetrix data61,62. Individuals were removed for ambiguous sex, genotype missingness >5%, heterozygosity >±4 s.d. and non-Finnish ancestry. Variants were removed for missingness >2%, Hardy–Weinberg equilibrium (HWE) P < 1 × 10⁻⁶ and minor allele count (MAC) <3. Prephasing was performed with Eagle v2.3.5 using 20,000 conditioning haplotypes. Genotypes were imputed with Beagle 4.1 using the population-specific Sequencing Initiative Suomi v3 imputation reference panel. Association analyses were performed using SAIGE v0.39.1 (ref. 63) with adjustment for age, genotyping batch and PC 1–10.
Estonian Biobank.
The Estonian Biobank is a population-based biobank with over 200,000 participants64. All Estonian Biobank participants have been genotyped at the Core Genotyping Lab of the Institute of Genomics, University of Tartu, using the Illumina Global Screening Array v1.0, v2.0 and v2.0_EST arrays. Samples were genotyped, and PLINK format files were created using Illumina GenomeStudio v2.0.4. Individuals were excluded from the analysis if their call rate was <95% or if the sex defined based on heterozygosity of the X chromosome did not match the sex in phenotype data. Before imputation, variants were filtered by call rate <95%, HWE P < 1 × 10⁻⁴ and MAF < 1%. We also used the MAC filter --minMAC=5. Variant positions were updated to genome build 37, and all variants were changed to be from the TOP strand using GSAMD-24v1-0_20011747_A1-b37.strand.RefAlt.zip files from https://www.well.ox.ac.uk/~wrayner/strand/. Prephasing was performed with Eagle v2.3 software using 20,000 conditioning haplotypes, and imputation was done using Beagle v.28Sep18.793 with effective population size ne = 20,000. Population-specific imputation reference of 2297 whole-genome sequencing (WGS) samples was used. Analyses were carried out with SAIGE63, adjusting for year of birth and PC 1–10.
Genes & Health.
Genes & Health is a cohort of British Pakistani and Bangladeshi individuals recruited primarily in East London, England65. Cases and parous controls were identified using qualifying ICD-10 and SNOMED codes (Supplementary Tables 1 and 2). Genotyping was performed using the Illumina Infinium Global Screening Array v3.0, and quality control was performed using Illumina GenomeStudio and PLINK v1.9. Individuals who did not have Pakistani or Bangladeshi ancestry, defined as >±3 s.d. from the mean of PC 1, and those who self-reported another ethnicity were removed. Variants with call rate <0.99, MAF < 1% and HWE P < 1 × 10⁻⁶ were removed. Imputation was performed using the Michigan Imputation Server with the GenomeAsia reference panel. Association analyses were performed using SAIGE63 with adjustment for age, age2 and PC 1–10.
Michigan Genomics Initiative.
The Michigan Genomics Initiative enrolls participants receiving care at Michigan Medicine and links biospecimen data to electronic health record (EHR) data. Preeclampsia cases were identified in the freeze 3 dataset using phecode 642.1 (ref. 66). Genotyping was performed using one of two versions of the Illumina Infinium CoreExome-24 bead array platform. Relatedness within the cohort was estimated using KING v2.1.3. Individuals were removed for discordant, missing or ambiguous sex; kinship coefficient >0.45 with another participant; call rate <99%, estimated contamination >2.5% or missingness on any chromosome >5%. Variants were excluded with poor intensity separation based on metrics from GenomeStudio (GenTrain score <0.15 or Cluster Separation score <0.3), overall call rate <99% or HWE P < 1 × 10⁻⁴. Genotypes were phased using EAGLE v2.4.1 and imputed using the TOPMed reference panel. Association analysis was conducted using SAIGE63 with adjustment for age, genotype array and PC 1–10.
Mass General Brigham Biobank.
The Mass General Brigham Biobank is a health system-based biobank linking genomic data to EHR data. Variants with MAF < 1%, missingness per variant >1% and HWE P < 10−6 were removed. Imputation was performed using the TOPMed reference panel. Association analysis was performed with variants filtered by MAC ≥ 50 and INFO score ≥0.6 using REGENIE v3.0.3 (ref. 67), adjusted for age, genotype batch and PC 1–10.
Biobank Japan.
Biobank Japan is a biobank of approximately 200,000 Japanese adults. Preeclampsia cases were identified using phecode 642 (ref. 68). Genotyping was performed using the Illumina HumanOmni-ExpressExome BeadChip or a combination of the Illumina HumanOm-niExpress and HumanExome BeadChip. Individuals with call rates <98% or closely related individuals (PI_HAT > 0.175 in PLINK) were excluded. Variants with call rate <99%, HWE P < 1.0 × 10⁻⁶ and number of heterozygotes <5 were excluded. Genotype data were imputed with 1000 Genomes Project Phase 3 v5 genotype data and Japanese WGS data. Association analysis was performed using SAIGE63 with adjustment for age, age2 and PC 1–20.
BioMe.
BioMe is a health system-based biobank at the Icahn School of Medicine at Mount Sinai in New York, NY, USA. Genotyping was performed using the Illumina Global Screening Array. Individuals with ethnicity-specific heterozygosity rate that surpassed ±3 s.d. of the population-specific mean, those with a call rate of ≤95% and those with discordance between EHR-recorded and genetic sex were removed. For variant-level quality control, sites with a call rate below 95% and sites with HWE P < 1 × 10⁻⁸ were excluded. Imputation of variants was then performed with the Michigan Imputation Server pipeline using the TOPMed reference panel. Association analysis was performed separately in African, admixed American and European ancestry female participants using SAIGE63 with adjustment for age, age2 and PC 1–10.
InterPregGen consortium.
We incorporated summary statistics for preeclampsia from the discovery GWAS meta-analyses of European cohorts and Central Asian cohorts from the InterPregGen consortium13. European-ancestry discovery cohorts included GOPEC (United Kingdom), deCODE (Iceland), the Avon Longitudinal Study of Parents and Children (United Kingdom), MoBa (Norway), SSI (Denmark) and FINRISK (Finland; 7,219 cases and 155,620 controls). Central Asian cohorts included two Kazakh cohorts and one Uzbek cohort (2,296 cases and 2,059 controls). Cohort-specific preeclampsia and control definitions are summarized in Supplementary Table 3 (ref. 13). Fixed-effects inverse-variance-weighted meta-analysis was performed in METAL18.
HUNT.
The HUNT study is a population-based cohort study in Nord-Trøndelag County, Norway. Genotyped, parous, European-ancestry female participants were included in the present analysis. Preeclampsia/eclampsia was ascertained by linkage to the Medical Birth Registry of Norway, which defines preeclampsia as SBP ≥ 140 mmHg and/or DBP ≥ 90 mmHg accompanied by proteinuria >0.3 g per 24 h or >1+ on urine dipstick69. The current analysis includes genetic data from approximately 90% of participants from HUNT2 (1995–1997) and HUNT3 (2006–2008) who were genotyped by genome-wide SNP arrays in 2015 (refs. 70,71). Genotyping, quality control metrics and imputation have been described previously70. Briefly, one of three different Illumina HumanCoreExome arrays (HumanCoreExome12 v1.0, HumanCoreExome12 v1.1 and UM HUNT Biobank v1.0) were used for genotyping the HUNT2 and HUNT3 samples70. Samples and variants with call rate <99% were excluded. Imputation was performed using 2,201 HUNT samples with WGS, the Haplotype Reference Consortium and TOPMed imputation panel (MAC > 10). Association analysis was performed using SAIGE63 with adjustment for age, age2 and PC 1–10.
UK Biobank.
The UK Biobank is a population-based cohort study of adult residents of the UK aged 40–69 years at the time of recruitment between 2006 and 2010. Genotyping was performed using the UK BiLEVE Axiom Array or the UK Biobank Axiom Array (both Affymetrix). Individuals with single nucleotide variant missingness ≥10% were excluded. Imputation was performed centrally using the Haplotype Reference Consortium, UK10K and 1000 Genome reference panels72. Variants were required to pass the following quality control filters: MAF ≥ 1%, single nucleotide variant missingness <10% and HWE P ≥ 10−15, MAC ≥ 50 and INFO score ≥0.6. Association analysis was performed in European-ancestry participants using REGENIE67 with adjustment for age, genotyping array and PC 1–10.
PMBB.
PMBB is a health system-based biobank at the University of Pennsylvania, Philadelphia, PA, USA. Gestational hypertension cases were identified using ICD-10 code O13. Controls were other female participants in PMBB. Genotyping was performed using the Illumina Global Sequencing Array v2.0; genotype data were imputed to the TOPMed reference panel using the Michigan Imputation Server. Variants with MAF < 1%, missing rate >10% and HWE P < 10−8 were filtered from the GWAS. Association analysis was performed in REGENIE separately for African-ancestry and European-ancestry participants with adjustment for age, age2 and PC 1–5.
nuMoM2b.
The nuMoM2b study is a prospective US pregnancy cohort of nulliparous female individuals enrolled in the first trimester of pregnancy between 2012 and 2015. HDPs were determined by chart abstraction and adjudication according to published definitions73. Gestational hypertension was defined as SBP ≥ 140 mmHg or DBP ≥ 90 mmHg on two occasions ≥6 h apart or one occasion with subsequent antihypertensive therapy after 20 weeks gestation, excluding BPs recorded during the second stage of labor, without other qualifying features for preeclampsia or eclampsia. Preeclampsia was defined according to the same BP criteria plus proteinuria or other findings meeting criteria for severe features, including HELLP syndrome73. Participants documented as meeting these same BP criteria before 20 weeks’ gestation were designated as having chronic hypertension. All participants were at risk for the development of preeclampsia/eclampsia; only those without chronic hypertension were at risk for the outcome of gestational hypertension. BP and BMI were recorded at the first-trimester study visit, which occurred at a mean (s.d.) of 11.6 (1.5) weeks gestation. Genotyping was performed using the Illumina Infinium Multi-Ethnic Global D2 BeadChip. Individuals related within two degrees by the KING algorithm were removed. Variants with MAF < 1%, genotyping rate <95% and HWE P < 5 × 10⁻⁶ were removed74. After phasing with EAGLE, imputation was performed for participants of European, African and admixed American ancestries using the TOPMed reference panel via the TOPMed Imputation Server. Association analysis was performed in REGENIE separately by ancestry group (European, African and admixed American) with adjustment for age and PC 1–10. The same participants in nuMoM2b with imputed genotypes were used for external testing of optimized PRS (see ‘Derivation and testing of genome-wide PRS‘).
Genome-wide meta-analysis and replication
Variants from GWAS summary statistics were matched by genome build 38 position and alleles. GWAS summary statistics that were in genome build 37 were lifted to genome build 38 using UCSC liftOver (https://genome.ucsc.edu/cgi-bin/hgLiftOver). We used METAL (release May 2020, https://github.com/statgen/METAL)18 to perform a fixed-effect inverse-variance-weighted meta-analysis. Correction for genomic inflation factor was carried out before meta-analysis. Meta-analyses were conducted among discovery cohorts, among follow-up cohorts and across all cohorts. Given the potential overlap of 400 preeclampsia/eclampsia cases from FINRISK between the InterPregGen meta-analysis and FinnGen (8.4% of FinnGen cases and 2.3% of overall discovery cases) and 7,805 controls (5.7% of FinnGen controls and 1.7% of overall discovery controls), we conducted a sensitivity analysis excluding FinnGen (Supplementary Table 4).
Lead variants for preeclampsia/eclampsia and gestational hypertension were interrogated in multi-ancestry meta-analysis of follow-up cohorts using METAL—HUNT (preeclampsia/eclampsia only), UK Biobank, PMBB and nuMoM2b. P < 0.05 in follow-up cohorts, consistent direction of effect in follow-up cohorts and genome-wide significance (P < 5 × 10⁻⁸) in combined meta-analysis of discovery and follow-up cohorts indicated replication. Manhattan plots were generated using the ‘ggplot2’ package.
Conditional and joint analysis
We conducted a conditional analysis using GCTA-COJO v1.94.0 (ref. 19) on the multi-ancestry meta-analyses of preeclampsia/eclampsia and gestational hypertension to identify additional association signals at the genome-wide significant loci. We used the European LD reference from a randomly selected set of 10,000 unrelated individuals. The LD panel included variants with MAF > 1% and INFO score ≥0.3. The analysis was restricted to variants within ±1 Mb from lead variants (P < 5 × 10⁻⁸). In COJO, the lead variants were conditioned from each chromosome and independent variants were iteratively included. All variants were then simultaneously fitted in the joint analysis. Variants with P < 2 × 10⁻⁷ were considered genome-wide significant. One additional variant with conditional P < 2 × 10⁻⁷ for association with preeclampsia/eclampsia was identified on chromosome 20 (P = 1.4 × 10⁻⁸).
Genetic correlation
We used LD score regression (LDSC v1.0.1, https://github.com/bulik/ldsc)20 with precomputed LD scores for 1.2 million HapMap3 variants after excluding the major histocompatibility complex (MHC) region in the European population (https://data.broadinstitute.org/alkesgroup/LDSCORE/eur_w_ld_chr.tar.bz2) to calculate the genetic correlation between preeclampsia/eclampsia and gestational hypertension and correlation of each HDP with SBP and DBP. In addition, the LDSC intercept indicates potential confounding due to potential population stratification and cryptic relatedness. In a combined meta-analysis of discovery and follow-up cohorts, we observed intercepts of 1.03 for preeclampsia/eclampsia and 0.95 for gestational hypertension.
Colocalization analysis
We obtained the tissue-specific gene expression from the GTEx data portal for 52 tissues27. We used marginal effect sizes, standard errors and MAF for all SNPs within ±500 of lead variants from discovery analysis (P < 5 × 10⁻⁸) as the input. We performed colocalization using the coloc.abf() function in R package ‘coloc’ v4. The H4 test statistic estimates the posterior probability of a shared causal variant between preeclampsia/eclampsia or gestational hypertension and expression of a particular gene. H4 > 0.7 indicated strong evidence of colocalization, H4 0.5–<0.7 indicated weak evidence of colocalization and H4 < 0.5 indicated no colocalization.
Polygenic prioritization of causal genes
We performed additional causal gene prioritization using the PoPS method (v0.2) (ref. 29). Briefly, PoPS integrates GWAS summary statistics with gene expression, biology pathways, and predicted protein–protein interaction data to identify likely causal genes at genome-wide significant loci. A linear model was trained to predict gene-level association scores and estimate Z scores indicating the confidence of the causal role at a given locus. In total, PoPS scores were calculated for 18,000 genes. The top five available prioritized genes within 500 kb of lead preeclampsia/eclampsia and gestational hypertension variants were extracted and compared with the results of other in silico analyses.
Placental transcriptome data
Genes nearest to lead variants, colocalization hits, and genes prioritized within the top five by either Open Targets variant-to-gene score or PoPS score were queried in a publicly available database of placental gene expression (https://www.obgyn.cam.ac.uk/placentome/)30. Samples were obtained from a prospective cohort of nulliparous female individuals in Cambridge, United Kingdom. Differential expression analysis for preeclampsia included 82 preeclampsia cases and 82 control samples matched on the presence of labor, cesarean section, gestational age, fetal sex, smoking status, maternal BMI and maternal age. RNA sequencing was performed on placental biopsy specimens with a median sequencing depth of 101 million reads per sample. Differential expression (in log2(fold change)) and corresponding P values were generated using DESeq2; P values were then adjusted for multiple comparisons using the Benjamini–Hochberg method. We report differentially expressed prioritized genes with adjusted P < 0.05 (Supplementary Table 13).
Gene expression in human aortic tissue
We queried the expression of prioritized genes in a dataset of snRNA-seq from human aortic tissue. In total, 1,114 unique molecular identifiers were obtained per cell. Prioritized genes were nearest genes, genes with strong colocalization, genes with weak colocalization plus prioritization by another method (top five Open Targets variant-to-gene score or PoPS) and genes prioritized by another method plus statistically significant differential placental transcription in the human placental transcriptome browser30; of these genes, 24 were available in the snRNA-seq dataset (Extended Data Fig. 4). snRNA-seq was performed on nonatherosclerotic aortic root tissue from two individuals obtained during coronary artery bypass graft surgery. Aortic samples were collected with approval from the Mass General Brigham Institutional Review Board (protocol, 2018P002674). All individuals were consented for the open sharing of data. Both individuals contributing aortic tissue specimens were men of European ancestry, aged 49 and 51 years, with hypertension, hypercholesterolemia, and coronary artery disease. Both were using aspirin and a statin preoperatively. A total of 4,537 nuclei were obtained for downstream analysis. Cell types and subtypes were defined using top marker genes and pathway enrichment scores. Raw Cellranger output data were filtered for removal of ambient RNA using CellBender in ‘full’ running mode. The resultant filtered cell–gene matrix was used for quality control and downstream analysis. All preliminary quality control and clustering were performed using Scanpy. Any cells with fewer than 300 genes captured or greater than 0.1% mitochondrial reads were excluded from the analysis. Each sample was processed with Scrublet to exclude doublets. The top 10,000 variable genes were used for analysis. Relative expression of queried genes in each cell type against other cell types in normal aortic tissue was quantified as z scores.
Derivation and testing of genome-wide PRS
We used PRS-CS v1.0.0 to derive genome-wide PRS for preeclampsia/eclampsia and gestational hypertension from the corresponding discovery GWAS summary statistics and for SBP from the Million Veteran Program GWAS summary statistics21. The preeclampsia/eclampsia PRS included 1,087,033 HapMap3 variants, the gestational hypertension PRS included 1,087,916 HapMap3 variants and the SBP PRS included 1,064,898 HapMap3 variants. PRS were trained on the UK Biobank European LD panel. Individual-level polygenic scores were generated in the tuning and test datasets as the sum of genotypes × weights using PLINK. We used logistic regression to test the association of each PRS with preeclampsia/eclampsia and gestational hypertension with adjustment for age, age2 and PC 1–10. PRS were tuned in the UK Biobank. Specifically, we used a small-scale grid search of global shrinkage parameter ϕ values (1, 1 × 10⁻², 1 × 10⁻⁴ and 1 × 10⁻⁶) for each PRS as recommended to identify the ϕ that produced the best predictive performance as measured by R2 in the tuning dataset. We then fitted a linear combination of optimized preeclampsia/eclampsia PRS and SBP PRS for the outcome of preeclampsia/eclampsia and a linear combination of gestational hypertension PRS and SBP PRS for the outcome of gestational hypertension. The optimal linear combination derived for preeclampsia/eclampsia was 0.1889 × Zpreeclampsia/eclampsia + 0.1864 × ZSBP, and the linear combination derived for gestational hypertension was 0.1662 × Zgestational_hypertension + 0.3050 × ZSBP. We carried these weighed linear combination scores forward for final testing in nuMoM2b (European, African and admixed American ancestry) and HUNT (European ancestry). PRS performance was evaluated using the OR for top decile versus bottom 90% of PRS, the OR per s.d. of PRS and Nagelkerke’s R2.
We tested whether PRS correctly reclassified nuMoM2b participants with HDPs as aspirin-eligible in comparison with the major criteria endorsed by the US Preventive Services Task Force36. Major criteria include history of preeclampsia, which does not apply in nuMoM2b as all participants were nulliparous; multifetal gestation, which does not apply in nuMoM2b as all participants had singleton pregnancies; chronic hypertension, defined as a diagnosis of hypertension before pregnancy or BP ≥ 140/90 mmHg on two occasions at least 6 h apart before 20 weeks gestation; pregestational diabetes type 1 or type 2; any prepregnancy kidney disease and autoimmune disease, defined here as antiphospholipid antibody syndrome, systemic lupus erythematosus, rheumatoid arthritis, inflammatory bowel disease (Crohn’s disease or ulcerative colitis) or ‘other collagen vascular or autoimmune disease.’ We calculated sensitivity, specificity, positive predictive value and negative predictive value for major risk factors with or without different thresholds for PRSpreeclampsia+SBP for the prediction of preeclampsia/eclampsia, as well as net reclassification for composite HDPs versus normotensive pregnancy and for preeclampsia/eclampsia versus all other pregnancies. CIs for sensitivity, specificity, positive predictive value and negative predictive value were calculated using the normal approximation. Given the use of PRS to up-classify risk, net reclassification was calculated as P(up|case) − P(up|non-case). Bootstrap resampling performed 1,000 times was used to estimate 95% CIs for net reclassification.
Phenome-wide association analysis
We tested the association of preeclampsia/eclampsia PRS and gestational hypertension PRS with 1,445 phecode-based combined prevalent and incident phenotypes75 in sex-stratified fashion among genotyped UK Biobank participants with adjustment for age and PC 1-–5 using the ‘PheWAS’ v1.0 package76 in R 3.6.0 (https://github.com/PheWAS/PheWAS). Bonferroni-corrected P < 0.05/1,445 = 3.5 × 10⁻⁵ indicated statistical significance.
Extended Data
Extended Data Fig. 1 |. Flow chart summarizing the study design and contributing cohorts.
Extended Data Fig. 2 |. Manhattan plots of preeclampsia/eclampsia and gestational hypertension in discovery cohorts.
Manhattan plots (chromosomal position on the X-axis and -log(10) of the P value on the Y-axis) are displayed for (a) preeclampsia/eclampsia in 17,150 cases and 451,241 controls and (b) gestational hypertension in 8,961 cases and 184,925 controls. Analyses included multi-ancestry meta-analysis of common variants (minor allele frequency ≥1%). Loci are labeled by the gene nearest to the lead variant. Two-sided P values (not adjusted for multiple comparisons) are from Z scores from fixed-effect inverse-variance weighted meta-analysis.
Extended Data Fig. 3 |. Results of multi-trait analysis of genome-wide summary statistics (MTAG) for preeclampsia/eclampsia.
Results are from joint analysis of summary statistics for preeclampsia/eclampsia and gestational hypertension in discovery cohorts. The plot displays chromosomal position on the X-axis and -log(10) of the P value on the Y-axis. Two-sided P values (not adjusted for multiple comparisons) are from Z scores from MTAG.
Extended Data Fig. 4 |. Relative expression of prioritized genes in human aortic cells with single-nuclei RNA sequencing.
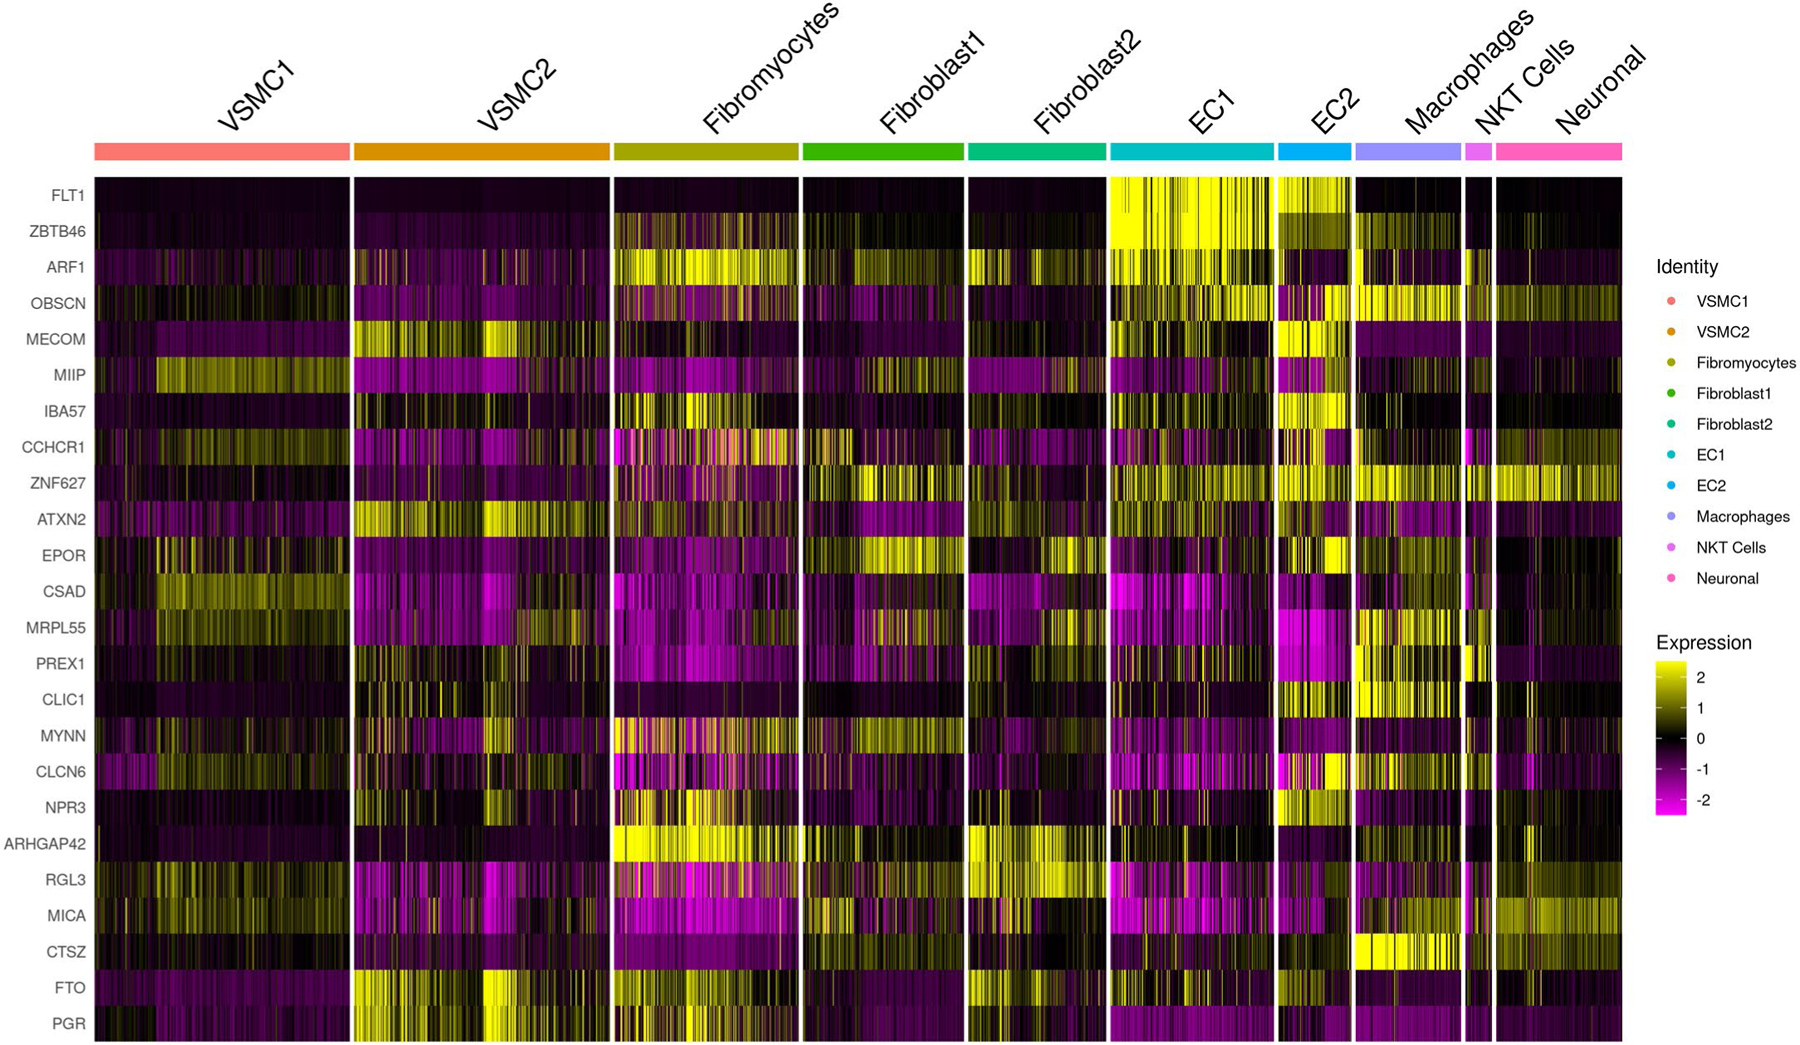
We analyzed expression of genes prioritized by genome-wide meta-analysis of preeclampsia/eclampsia and gestational hypertension and secondary in silico analyses in a dataset of single-nuclei RNA sequencing from two normal human flash-frozen aortic specimens. Most prioritized genes were enriched in endothelial cell populations and/or macrophages.
Extended Data Fig. 5 |. Sex-stratified phenome-wide association study of gestational hypertension polygenic risk in the UK Biobank.
Gestational hypertension polygenic risk was associated with 1,445 phenotypes among (a) female and (b) male participants in the UK Biobank. Associations with phenotypes were tested using logistic regression with adjustment for age and the first five principal components of genetic ancestry. Two-sided P values (not adjusted for multiple comparisons) are from logistic regression models adjusted for age and the first five principal components of genetic ancestry.
Supplementary Material
Acknowledgements
This work was supported by grants from the US National Heart Lung and Blood Institute (K08HL166687 to M.C.H., K08HL146963 to K.J.G., R01 HL163234 to R.S. and K.J.G., R01HL139865 to R.D., R01HL155915 to R.D., DP2HL152423 to R.M.G., U01HL166060 to R.M.G., R03HL148483 to R.M.G., R01HL142711 to P.N., R01HL127564 to P.N., R01HL148050 to P.N., R01HL151283 to P.N., R01HL148565 to P.N., R01HL135242 to P.N. and R01HL151152 to P.N.); the American Heart Association (940166 to M.C.H. and 979465 to M.C.H.); the Korea Health Industry Development Institute (HI19C1330 to S.M.J.C.); Harvard Catalyst Medical Research Investigator Training Program (to A.P.P.); National Human Genome Research Institute (U01HG011719 to A.P.P. and P.N.); the Belgian American Educational Foundation (to A.S.); the US National Institute of General Medical Sciences (R35GM147197 to R.F.G. and R35GM124836 to R.D.); National Institute of Diabetes and Digestive and Kidney Diseases (R01DK125782 to P.N.); National Institute of Child Health and Human Development (R01HD101246 to D.M.H.); Preeclampsia Foundation (to K.J.G. and R.S.); Fondation Leducq (TNE-18CVD04 to P.N.) and the Massachusetts General Hospital Paul and Phyllis Fireman Endowed Chair in Vascular Medicine (to P.N.). We thank the participants and investigators from the InterPregGen consortium, FinnGen, Estonian Biobank, Genes & Health, Michigan Genomics Initiative, Mass General Brigham Biobank, BioBank Japan, BioMe, HUNT, PMBB, UK Biobank and nuMoM2b; additional acknowledgements appear in the Supplementary Note.
Footnotes
Online content
Any methods, additional references, Nature Portfolio reporting summaries, source data, extended data, supplementary information, acknowledgements, peer review information; details of author contributions and competing interests; and statements of data and code availability are available at https://doi.org/10.1038/s41591-023-02374-9.
Springer Nature or its licensor (e.g. a society or other partner) holds exclusive rights to this article under a publishing agreement with the author(s) or other rightsholder(s); author self-archiving of the accepted manuscript version of this article is solely governed by the terms of such publishing agreement and applicable law.
Reporting summary
Further information on research design is available in the Nature Portfolio Reporting Summary linked to this article.
Code availability
The code used to conduct these analyses is available at https://github.com/buutrg/HDP.
Competing interests
M.C.H. reports consulting fees from CRISPR Therapeutics, advisory board service for Miga Health, and grant support from Genentech, all unrelated to this work. K.J.G. has served as a consultant for BillionToOne, Aetion and Roche for projects unrelated to this work. R.S. is a cofounder of Magnet Biomedicine, unrelated to this work. R.D. reports receiving grants from AstraZeneca and grants and nonfinancial support from Goldfinch Bio, being a scientific cofounder, consultant and equity holder for Pensieve Health (pending) and being a consultant for Variant Bio, all unrelated to this work. P.N. reports grant support from Amgen, Apple, AstraZeneca, Boston Scientific and Novartis; spousal employment and equity at Vertex; consulting income from Apple, AstraZeneca, Novartis, Genentech/Roche, Blackstone Life Sciences, Foresite Labs and TenSixteen Bio and is a scientific advisor board member and shareholder of TenSixteen Bio and geneXwell, all unrelated to this work. All remaining authors report no competing interests.
Additional information
Extended data is available for this paper at https://doi.org/10.1038/s41591-023-02374-9.
Supplementary information The online version contains supplementary material available at https://doi.org/10.1038/s41591-023-02374-9.
Correspondence and requests for materials should be addressed to Michael C. Honigberg or Pradeep Natarajan.
Peer review information Nature Medicine thanks Lucy Chappell, Tu’uhevaha Kaituu-Lino and the other, anonymous, reviewer(s) for their contribution to the peer review of this work. Primary Handling editor: Anna Maria Ranzoni, in collaboration with the Nature Medicine team.
Reprints and permissions information is available at www.nature.com/reprints.
Data availability
GWAS summary statistics for preeclampsia/eclampsia and gestational hypertension and genome-wide polygenic scores for preeclampsia/eclampsia, gestational hypertension and systolic blood pressure are available for download at https://doi.org/10.6084/m9.figshare.22680904.v1. Polygenic scores are also available in the PGS Catalog (https://www.pgscatalog.org/publication/PGP000462/). Summary statistics used in this meta-analysis are publicly available for FinnGen r6 (https://www.finngen.fi/en/access_results) and for BioBank Japan (https://pheweb.jp/pheno/PreEclampsia). Preeclampsia GWAS summary statistics from the InterPregGen consortium are available at https://ega-archive.org (dataset IDs EGAD00010001984 (European maternal meta-analysis), EGAD00010001985 (Central Asian maternal meta-analysis) and EGAD00010001983 (European and Central Asian fetal meta-analysis)). Placental transcriptome data are publicly available at https://www.obgyn.cam.ac.uk/placentome/.
References
- 1.Burton GJ, Redman CW, Roberts JM & Moffett A Pre-eclampsia: pathophysiology and clinical implications. BMJ 366, l2381 (2019). [DOI] [PubMed] [Google Scholar]
- 2.Jiang L et al. A global view of hypertensive disorders and diabetes mellitus during pregnancy. Nat. Rev. Endocrinol 18, 760–775 (2022). [DOI] [PMC free article] [PubMed] [Google Scholar]
- 3.Garovic VD et al. Incidence and long-term outcomes of hypertensive disorders of pregnancy. J. Am. Coll. Cardiol 75, 2323–2334 (2020). [DOI] [PMC free article] [PubMed] [Google Scholar]
- 4.Magee LA et al. The 2021 International Society for the Study of Hypertension in pregnancy classification, diagnosis & management recommendations for international practice. Pregnancy Hypertens 27, 148–169 (2022). [DOI] [PubMed] [Google Scholar]
- 5.ACOG practice bulletin no. 202: gestational hypertension and preeclampsia. Obstet. Gynecol 133, 1 (2019). [DOI] [PubMed] [Google Scholar]
- 6.Honigberg MC et al. Long-term cardiovascular risk in women with hypertension during pregnancy. J. Am. Coll. Cardiol 74, 2743–2754 (2019). [DOI] [PMC free article] [PubMed] [Google Scholar]
- 7.Rana S, Lemoine E, Granger J & Karumanchi SA Preeclampsia: pathophysiology, challenges, and perspectives. Circ. Res 124, 1094–1112 (2019). [DOI] [PubMed] [Google Scholar]
- 8.Levine RJ et al. Circulating angiogenic factors and the risk of preeclampsia. N. Engl. J. Med 350, 672–683 (2004). [DOI] [PubMed] [Google Scholar]
- 9.Bartsch E, Medcalf KE, Park AL & Ray JG Clinical risk factors for pre-eclampsia determined in early pregnancy: systematic review and meta-analysis of large cohort studies. BMJ 353, I1753 (2016). [DOI] [PMC free article] [PubMed] [Google Scholar]
- 10.Cnattingius S, Reilly M, Pawitan Y & Lichtenstein P Maternal and fetal genetic factors account for most of familial aggregation of preeclampsia: a population-based Swedish cohort study. Am. J. Med. Genet. A 130, 365–371 (2004). [DOI] [PubMed] [Google Scholar]
- 11.Nilsson E, Salonen Ros H, Cnattingius S & Lichtenstein P The importance of genetic and environmental effects for pre-eclampsia and gestational hypertension: a family study. BJOG 111, 200–206 (2004). [DOI] [PubMed] [Google Scholar]
- 12.McGinnis R et al. Variants in the fetal genome near FLT1 are associated with risk of preeclampsia. Nat. Genet 49, 1255–1260 (2017). [DOI] [PubMed] [Google Scholar]
- 13.Steinthorsdottir V et al. Genetic predisposition to hypertension is associated with preeclampsia in European and Central Asian women. Nat. Commun 11, 5976 (2020). [DOI] [PMC free article] [PubMed] [Google Scholar]
- 14.Honigberg MC et al. Genetic variation in cardiometabolic traits and medication targets and the risk of hypertensive disorders of pregnancy. Circulation 142, 711–713 (2020). [DOI] [PMC free article] [PubMed] [Google Scholar]
- 15.Gray KJ et al. Risk of pre-eclampsia in patients with a maternal genetic predisposition to common medical conditions: a case-control study. BJOG 128, 55–65 (2021). [DOI] [PMC free article] [PubMed] [Google Scholar]
- 16.O’Kelly AC et al. Pregnancy and reproductive risk factors for cardiovascular disease in women. Circ. Res 130, 652–672 (2022). [DOI] [PMC free article] [PubMed] [Google Scholar]
- 17.Kivioja A et al. Increased risk of preeclampsia in women with a genetic predisposition to elevated blood pressure. Hypertension 79, 2008–2015 (2022). [DOI] [PMC free article] [PubMed] [Google Scholar]
- 18.Willer CJ, Li Y & Abecasis GR METAL: fast and efficient meta-analysis of genomewide association scans. Bioinformatics 26, 2190–2191 (2010). [DOI] [PMC free article] [PubMed] [Google Scholar]
- 19.Yang J, Lee SH, Goddard ME & Visscher PM GCTA: a tool for genome-wide complex trait analysis. Am. J. Hum. Genet 88, 76–82 (2011). [DOI] [PMC free article] [PubMed] [Google Scholar]
- 20.Bulik-Sullivan BK et al. LD score regression distinguishes confounding from polygenicity in genome-wide association studies. Nat. Genet 47, 291–295 (2015). [DOI] [PMC free article] [PubMed] [Google Scholar]
- 21.Giri A et al. Trans-ethnic association study of blood pressure determinants in over 750,000 individuals. Nat. Genet 51, 51–62 (2019). [DOI] [PMC free article] [PubMed] [Google Scholar]
- 22.Bulik-Sullivan B et al. An atlas of genetic correlations across human diseases and traits. Nat. Genet 47, 1236–1241 (2015). [DOI] [PMC free article] [PubMed] [Google Scholar]
- 23.Turley P et al. Multi-trait analysis of genome-wide association summary statistics using MTAG. Nat. Genet 50, 229–237 (2018). [DOI] [PMC free article] [PubMed] [Google Scholar]
- 24.Padmanabhan S, Caulfield M & Dominiczak AF Genetic and molecular aspects of hypertension. Circ. Res 116, 937–959 (2015). [DOI] [PubMed] [Google Scholar]
- 25.Rubattu S, Forte M, Marchitti S & Volpe M Molecular implications of natriuretic peptides in the protection from hypertension and target organ damage development. Int. J. Mol. Sci 20, 798 (2019). [DOI] [PMC free article] [PubMed] [Google Scholar]
- 26.Ohwaki A et al. Altered serum soluble furin and prorenin receptor levels in pregnancies with pre-eclampsia and fetal growth restriction. J. Gynecol. Obstet. Hum. Reprod 50, 102198 (2021). [DOI] [PubMed] [Google Scholar]
- 27.Battle A et al. Genetic effects on gene expression across human tissues. Nature 550, 204–213 (2017). [DOI] [PMC free article] [PubMed] [Google Scholar]
- 28.Ghoussaini M et al. Open targets genetics: systematic identification of trait-associated genes using large-scale genetics and functional genomics. Nucleic Acids Res 49, D1311–D1320 (2021). [DOI] [PMC free article] [PubMed] [Google Scholar]
- 29.Weeks EM et al. Leveraging polygenic enrichments of gene features to predict genes underlying complex traits and diseases. Preprint at medRxiv 10.1101/2020.09.08.20190561 (2020). [DOI] [PMC free article] [PubMed]
- 30.Gong S et al. The RNA landscape of the human placenta in health and disease. Nat. Commun 12, 2639 (2021). [DOI] [PMC free article] [PubMed] [Google Scholar]
- 31.Maynard SE et al. Excess placental soluble fms-like tyrosine kinase 1 (sFlt1) may contribute to endothelial dysfunction, hypertension, and proteinuria in preeclampsia. J. Clin. Invest 111, 649–658 (2003). [DOI] [PMC free article] [PubMed] [Google Scholar]
- 32.Tekola-Ayele F et al. Placental multi-omics integration identifies candidate functional genes for birthweight. Nat. Commun 13, 2384 (2022). [DOI] [PMC free article] [PubMed] [Google Scholar]
- 33.Bai X et al. The smooth muscle-selective RhoGAP GRAF3 is a critical regulator of vascular tone and hypertension. Nat. Commun 4, 2910 (2013). [DOI] [PMC free article] [PubMed] [Google Scholar]
- 34.Kalluri AS et al. Single-cell analysis of the normal mouse aorta reveals functionally distinct endothelial cell populations. Circulation 140, 147–163 (2019). [DOI] [PMC free article] [PubMed] [Google Scholar]
- 35.Ge T, Chen CY, Ni Y, Feng YA & Smoller JW Polygenic prediction via Bayesian regression and continuous shrinkage priors. Nat. Commun 10, 1776 (2019). [DOI] [PMC free article] [PubMed] [Google Scholar]
- 36.Davidson KW et al. Aspirin use to prevent preeclampsia and related morbidity and mortality: US preventive services task force recommendation statement. JAMA 326, 1186–1191 (2021). [DOI] [PubMed] [Google Scholar]
- 37.Pollheimer J et al. Activation of the canonical wingless/T-cell factor signaling pathway promotes invasive differentiation of human trophoblast. Am. J. Pathol 168, 1134–1147 (2006). [DOI] [PMC free article] [PubMed] [Google Scholar]
- 38.Zhang Z et al. Wnt/β-catenin signaling pathway in trophoblasts and abnormal activation in preeclampsia (review). Mol. Med. Rep 16, 1007–1013 (2017). [DOI] [PubMed] [Google Scholar]
- 39.Tita AT et al. Treatment for mild chronic hypertension during pregnancy. N. Engl. J. Med 386, 1781–1792 (2022). [DOI] [PMC free article] [PubMed] [Google Scholar]
- 40.Zhang W et al. Atrial natriuretic peptide promotes uterine decidualization and a TRAIL-dependent mechanism in spiral artery remodeling. J. Clin. Invest 131, e151053 (2021). [DOI] [PMC free article] [PubMed] [Google Scholar]
- 41.Maack T et al. Physiological role of silent receptors of atrial natriuretic factor. Science 238, 675–678 (1987). [DOI] [PubMed] [Google Scholar]
- 42.Gu Y et al. Aberrant pro-atrial natriuretic peptide/corin/natriuretic peptide receptor signaling is present in maternal vascular endothelium in preeclampsia. Pregnancy Hypertens 11, 1–6 (2018). [DOI] [PMC free article] [PubMed] [Google Scholar]
- 43.Sun BB et al. Genomic atlas of the human plasma proteome. Nature 558, 73–79 (2018). [DOI] [PMC free article] [PubMed] [Google Scholar]
- 44.Hauspurg A et al. Association of N-terminal pro-brain natriuretic peptide concentration in early pregnancy with development of hypertensive disorders of pregnancy and future hypertension. JAMA Cardiol 7, 268–276 (2022). [DOI] [PMC free article] [PubMed] [Google Scholar]
- 45.Satpathy AT et al. Zbtb46 expression distinguishes classical dendritic cells and their committed progenitors from other immune lineages. J. Exp. Med 209, 1135–1152 (2012). [DOI] [PMC free article] [PubMed] [Google Scholar]
- 46.Wang Y et al. ZBTB46 is a shear-sensitive transcription factor inhibiting endothelial cell proliferation via gene expression regulation of cell cycle proteins. Lab. Invest 99, 305–318 (2019). [DOI] [PMC free article] [PubMed] [Google Scholar]
- 47.Hall G, Wang L & Spurney RF TRPC channels in proteinuric kidney diseases. Cells 9, 44 (2019). [DOI] [PMC free article] [PubMed] [Google Scholar]
- 48.Wang Z et al. Transient receptor potential cation channel 6 contributes to kidney injury induced by diabetes and hypertension. Am. J. Physiol. Renal Physiol 322, F76–F88 (2022). [DOI] [PMC free article] [PubMed] [Google Scholar]
- 49.Ives CW, Sinkey R, Rajapreyar I, Tita ATN & Oparil S Preeclampsia-pathophysiology and clinical presentations: JACC state-of-the-art review. J. Am. Coll. Cardiol 76, 1690–1702 (2020). [DOI] [PubMed] [Google Scholar]
- 50.Wang W et al. LNK/SH2B3 loss of function promotes atherosclerosis and thrombosis. Circ. Res 119, e91–e103 (2016). [DOI] [PMC free article] [PubMed] [Google Scholar]
- 51.Machiela MJ & Chanock SJ LDlink: a web-based application for exploring population-specific haplotype structure and linking correlated alleles of possible functional variants. Bioinformatics 31, 3555–3557 (2015). [DOI] [PMC free article] [PubMed] [Google Scholar]
- 52.Deloukas P et al. Large-scale association analysis identifies new risk loci for coronary artery disease. Nat. Genet 45, 25–33 (2013). [DOI] [PMC free article] [PubMed] [Google Scholar]
- 53.Gupta AK, Hasler P, Holzgreve W & Hahn S Neutrophil NETs: a novel contributor to preeclampsia-associated placental hypoxia? Semin. Immunopathol 29, 163–167 (2007). [DOI] [PubMed] [Google Scholar]
- 54.Dou H et al. Oxidized phospholipids promote netosis and arterial thrombosis in LNK(SH2B3) deficiency. Circulation 144, 1940–1954 (2021). [DOI] [PMC free article] [PubMed] [Google Scholar]
- 55.Wright D, Syngelaki A, Akolekar R, Poon LC & Nicolaides KH Competing risks model in screening for preeclampsia by maternal characteristics and medical history. Am. J. Obstet. Gynecol 213, e1–e10 (2015). [DOI] [PubMed] [Google Scholar]
- 56.Akolekar R, Syngelaki A, Poon L, Wright D & Nicolaides KH Competing risks model in early screening for preeclampsia by biophysical and biochemical markers. Fetal Diagn. Ther 33, 8–15 (2013). [DOI] [PubMed] [Google Scholar]
- 57.Martin AR et al. Clinical use of current polygenic risk scores may exacerbate health disparities. Nat. Genet 51, 584–591 (2019). [DOI] [PMC free article] [PubMed] [Google Scholar]
- 58.Angras K et al. Retrospective application of algorithms to improve identification of pregnancy outcomes from the electronic health record. J. Perinatol 43, 10–14 (2023). [DOI] [PubMed] [Google Scholar]
- 59.Klungsøyr K et al. Validity of pre-eclampsia registration in the medical birth registry of Norway for women participating in the Norwegian mother and child cohort study, 1999–2010. Paediatr. Perinat. Epidemiol 28, 362–371 (2014). [DOI] [PMC free article] [PubMed] [Google Scholar]
- 60.Klemmensen AK, Olsen SF, Osterdal ML & Tabor A Validity of preeclampsia-related diagnoses recorded in a national hospital registry and in a postpartum interview of the women. Am. J. Epidemiol 166, 117–124 (2007). [DOI] [PubMed] [Google Scholar]
- 61.Kurki MI et al. FinnGen provide genetic insights from a well-phenotyped isolated population. Nature 613, 508–518 (2023). [DOI] [PMC free article] [PubMed] [Google Scholar]
- 62.Sun BB et al. Genetic associations of protein-coding variants in human disease. Nature 603, 95–102 (2022). [DOI] [PMC free article] [PubMed] [Google Scholar]
- 63.Zhou W et al. Efficiently controlling for case-control imbalance and sample relatedness in large-scale genetic association studies. Nat. Genet 50, 1335–1341 (2018). [DOI] [PMC free article] [PubMed] [Google Scholar]
- 64.Leitsalu L et al. Cohort profile: Estonian Biobank of the Estonian Genome Center, University of Tartu. Int. J. Epidemiol 44, 1137–1147 (2015). [DOI] [PubMed] [Google Scholar]
- 65.Finer S et al. Cohort profile: East London Genes & Health (ELGH), a community-based population genomics and health study in British Bangladeshi and British Pakistani people. Int. J. Epidemiol 49, 20–21 (2020). [DOI] [PMC free article] [PubMed] [Google Scholar]
- 66.Wei WQ et al. Evaluating phecodes, clinical classification software, and ICD-9-CM codes for phenome-wide association studies in the electronic health record. PLoS ONE 12, e0175508 (2017). [DOI] [PMC free article] [PubMed] [Google Scholar]
- 67.Mbatchou J et al. Computationally efficient whole-genome regression for quantitative and binary traits. Nat. Genet 53, 1097–1103 (2021). [DOI] [PubMed] [Google Scholar]
- 68.Sakaue S et al. A cross-population atlas of genetic associations for 220 human phenotypes. Nat. Genet 53, 1415–1424 (2021). [DOI] [PubMed] [Google Scholar]
- 69.Honigberg MC et al. Heart failure in women with hypertensive disorders of pregnancy: insights from the cardiovascular disease in Norway project. Hypertension 76, 1506–1513 (2020). [DOI] [PMC free article] [PubMed] [Google Scholar]
- 70.Brumpton BM et al. The HUNT study: a population-based cohort for genetic research. Cell Genom 2, 100193 (2022). [DOI] [PMC free article] [PubMed] [Google Scholar]
- 71.Åsvold BO et al. Cohort profile update: the HUNT study, Norway. Int. J. Epidemiol 52, e80–e91 (2023). [DOI] [PMC free article] [PubMed] [Google Scholar]
- 72.Bycroft C et al. The UK Biobank resource with deep phenotyping and genomic data. Nature 562, 203–209 (2018). [DOI] [PMC free article] [PubMed] [Google Scholar]
- 73.Facco FL et al. Association between sleep-disordered breathing and hypertensive disorders of pregnancy and gestational diabetes Mellitus. Obstet. Gynecol 129, 31–41 (2017). [DOI] [PMC free article] [PubMed] [Google Scholar]
- 74.Guerrero RF et al. Genetic polymorphisms associated with adverse pregnancy outcomes in nulliparas. Preprint at medRxiv 10.1101/2022.02.28.22271641 (2020). [DOI] [PMC free article] [PubMed]
- 75.Denny JC et al. PheWAS: demonstrating the feasibility of a phenome-wide scan to discover gene-disease associations. Bioinformatics 26, 1205–1210 (2010). [DOI] [PMC free article] [PubMed] [Google Scholar]
- 76.Carroll RJ, Bastarache L & Denny JCR PheWAS: data analysis and plotting tools for phenome-wide association studies in the R environment. Bioinformatics 30, 2375–2376 (2014). [DOI] [PMC free article] [PubMed] [Google Scholar]
Associated Data
This section collects any data citations, data availability statements, or supplementary materials included in this article.
Supplementary Materials
Data Availability Statement
GWAS summary statistics for preeclampsia/eclampsia and gestational hypertension and genome-wide polygenic scores for preeclampsia/eclampsia, gestational hypertension and systolic blood pressure are available for download at https://doi.org/10.6084/m9.figshare.22680904.v1. Polygenic scores are also available in the PGS Catalog (https://www.pgscatalog.org/publication/PGP000462/). Summary statistics used in this meta-analysis are publicly available for FinnGen r6 (https://www.finngen.fi/en/access_results) and for BioBank Japan (https://pheweb.jp/pheno/PreEclampsia). Preeclampsia GWAS summary statistics from the InterPregGen consortium are available at https://ega-archive.org (dataset IDs EGAD00010001984 (European maternal meta-analysis), EGAD00010001985 (Central Asian maternal meta-analysis) and EGAD00010001983 (European and Central Asian fetal meta-analysis)). Placental transcriptome data are publicly available at https://www.obgyn.cam.ac.uk/placentome/.