

Summary
Calmodulin (CaM) is a ubiquitous, calcium-sensing protein that regulates a multitude of processes throughout the body. In response to changes in [Ca2+], CaM modifies, activates, and deactivates enzymes and ion channels, as well as many other cellular processes. The importance of CaM is highlighted by the conservation of an identical amino acid sequence in all mammals. Alterations to CaM amino acid sequence were once thought to be incompatible with life. During the last decade modifications to the CaM protein sequence have been observed in patients suffering from life-threatening heart disease (calmodulinopathy). Thus far, inadequate or untimely interaction between mutant CaM and several proteins (LTCC, RyR2, and CaMKII) have been identified as mechanisms underlying calmodulinopathy. Given the extensive number of CaM interactions in the body, there are likely many consequences for altering CaM protein sequence. Here, we demonstrate that disease-associated CaM mutations alter the sensitivity and activity of the Ca2+-CaM-enhanced serine/threonine phosphatase calcineurin (CaN). Biophysical characterization by circular dichroism, solution NMR spectroscopy, stopped-flow kinetic measurements, and MD simulations provide mechanistic insight into mutation dysfunction as well as highlight important aspects of CaM Ca2+ signal transduction. We find that individual CaM point mutations (N53I, F89L, D129G, and F141L) impair CaN function, however, the mechanisms are not the same. Specifically, individual point mutations can influence or modify the following properties: CaM binding, Ca2+ binding, and/or Ca2+ kinetics. Moreover, structural aspects of the CaN-CaM complex can be altered in manners that indicate changes to allosteric transmission of CaM binding to the enzyme active site. Given that loss of CaN function can be fatal, as well as evidence that CaN modifies ion channels already associated with calmodulinopathy, our results raise the possibility that altered CaN function contributes to calmodulinopathy.
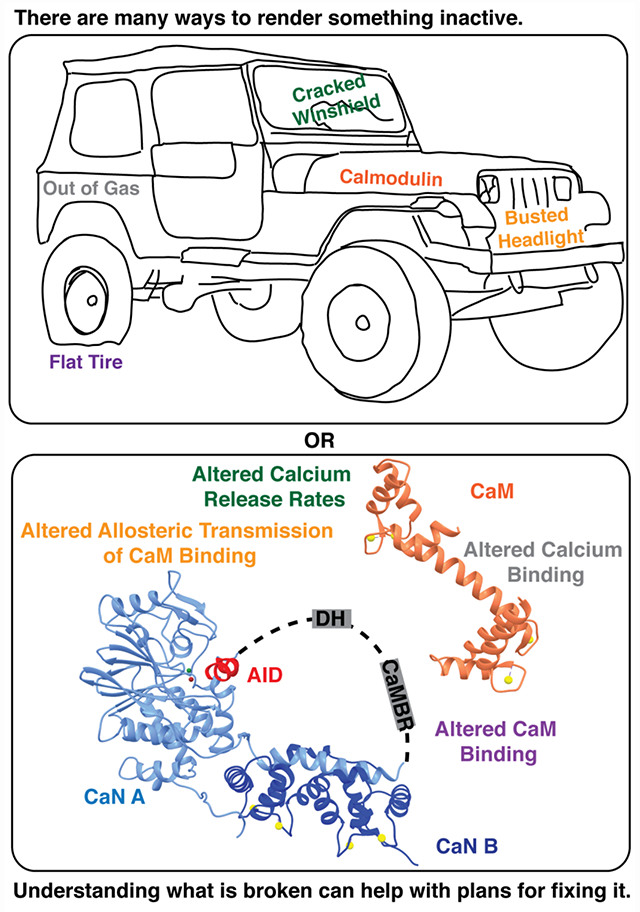
Graphical_Abstract
INTRODUCTION
Calmodulin (CaM) is a Ca2+-binding protein that relays Ca2+ signals to a plethora of targets (1). During the past decade, mutations that alter the amino acid sequence of CaM were discovered in living probands (2–7). A myriad of consequences to the electrical currents on the surface of the heart have been observed for these patients. T-wave alternans and other moderate conditions have devolved into life-threatening tachycardias and fibrillations (3,8–11). Thus far, alterations to Ryanodine Receptor type 2 (RyR2) function and impaired L-Type Calcium Channel (LTCC) inactivation have been identified as primary mechanisms responsible for these arrhythmic events. Additionally, disease-associated CaM mutations have been demonstrated to alter ion channel post-translational modification via calmodulin-dependent kinase type II (CaMKII) activity (12,13). Considering these results, we have investigated the effects of disease-associated CaM mutations on the activity of the Ca2+-CaM-enhanced serine/threonine phosphatase calcineurin (CaN).
CaM contains four EF-hand motifs, each of which bind a single Ca2+ ion, yielding a 4:1 stoichiometric ratio (Ca2+: CaM). As CaM achieves Ca2+ binding, it undergoes a conformational change in which core hydrophobic residues are exposed to solvent (14,15). This energetically unfavorable conformation (hydrophobic residues in polar solvent) facilitates CaM interaction with a myriad of proteins. Historically, x-ray crystallography has captured CaM bound to targets in a wrap-around configuration. More recently, solution-based techniques have revealed that CaM interactions can be more complex, as the individual CaM domains can occupy unique binding sites (16–18). The dynamic nature of CaM interactions and how they modify target protein structure to alter function can be nuanced and complicated (19). Interactions between CaM and a target protein or enzyme do not have to impart the same type of modification to function (20–23). Much of the complexity arises from the timing of Ca2+ sensing, cooperative Ca2+ binding (Ca2+ binding in one EF-hand reduces the energetic barrier of Ca2+ binding in the adjacent EF-hand (24)), and the structural versatility CaM utilizes for protein interactions. With CaM-Ca2+ binding and protein interaction being intricately coupled, in silico modeling has historically been insufficient for describing the effect(s) of a point mutation to a CaM-modified target (25). Nevertheless, recent efforts demonstrate progress for in silico prediction capabilities (26).
To date, more than 25 individual point mutations in CaM have been identified in patients suffering from life-threatening heart disease (3,5,8–11,27–29). Point mutations leading to alterations in side chain identity in the CaM-N and CaM-C domains can occur in parts of CaM that are used for protein interaction as well as Ca2+ sensing (3,8,9,11,28–31). Mutations have been identified in all three CaM genes (CALM1, CALM2, and CALMS). Analysis of protein mutation (side chain location and identity) and genetic alterations are insufficient for understanding and/or predicting the consequences to human health (4). Here we have selected four of the reported CaM point mutations based on their role in CaM Ca2+ signal transduction. Specifically, we have investigated the N53I mutation as it occurs on a helix in the CaM-N domain that is used for interactions with numerous cellular targets (18). The F89L and F141L mutations were selected based on their posited role in stabilizing the apo CaM structure (32), as well as their ability to influence the nearby Glu side chains that are used for Ca2+ chelation (3,4). The D129G mutation was selected because it directly removes the oxygen from position one in the third EF-hand loop, which is known to be critical for EF-hand Ca2+ binding (33).
CaN is a phosphatase that plays a role in the regulation of several processes in cardiomyocytes (34–38). As implied by the name, CaN activity is modulated by interactions with Ca2+ and CaM. The CaN enzyme is composed of two subunits (CaN A and CaN B) (39,40). The A subunit contains the active site for dephosphorylation of substrates, and the B subunit is comprised of four EF-hand motifs that bind Ca2+. Saturation of CaN B with Ca2+ yields 10% of maximal activity; subsequent interaction between CaN and Ca2+-CaM allows CaN to achieve 100% activity (23). For this process, Ca2+-CaM interacts with a disordered region of CaN. This disordered region serves as a tether between an autoinhibitory domain and the rest of CaN. CaM binding enriches the alpha helical content of the disordered tether, resulting in displacement of the autoinhibitory domain. This allows substrates access to the CaN active site (41–43). Given the numerous components required for appropriate CaN activity, we questioned if different point mutations in CaM could alter enzyme function through different processes. Here, we have used a wide range of biophysical techniques to describe how different disease-associated point mutations in CaM are able to alter different aspects of CaM Ca2+ signal transduction, leading to altered CaN activity.
RESULTS
Effect of CaM mutation on CaN activity depends on [Ca2+].
To test if human disease-associated mutations disrupt CaM’s ability to enhance CaN activity, we titrated CaM into CaN in the presence of saturating Ca2+. We monitored 4-Methylumbelliferyl Phosphate (MUP) fluorescence (a CaN substrate (44)) as a function of [CaM] (Figure S1), and then repeated this experiment at a variety of [Ca2+], Based on literature (23), we assumed that 100 μM free [Ca2+] (pCa2+ 4) would be saturating for the CaN-CaM interaction. Similar to the high affinity reported by Hubbard and Klee in 1987 (45), our fluorescence data yielded an EC50 of 39 nM for Wild Type (WT) CaM under saturating Ca2+ conditions (Figures 1a and 1b). Also consistent with other reports (46), CaM saturation of the CaN enzyme was observed at ~100 nM (pCaM 7). At 100 μM [Ca2+], all of the disease-associated CaM mutations that were investigated displayed similar [CaM] EC50 values compared to WT. Reducing [Ca2+] to 1 μM resulted in incomplete CaM-CaN activity enhancement. This data could not be fit to a four-parameter dose-response curve as it did not achieve saturation (Figure S2). Investigation at 10 μM [Ca2+] yielded fittable data, and our analysis revealed the F89L, D129G, and F141L samples required elevated [CaM] to achieve half-maximal CaN activity relative to WT (WT = 39.7 ± 3.2 nM, N53I = 38.2 ± 1.7 nM, F89L = 60.9 ± 4.4 nM, D129G = 67.7 ± 10.8 nM, F141L 45.9 ± 2.1 nM) (Figure 1c and 1d).
Figure 1. CaM enhancement of CaN activity at various [Ca2+].
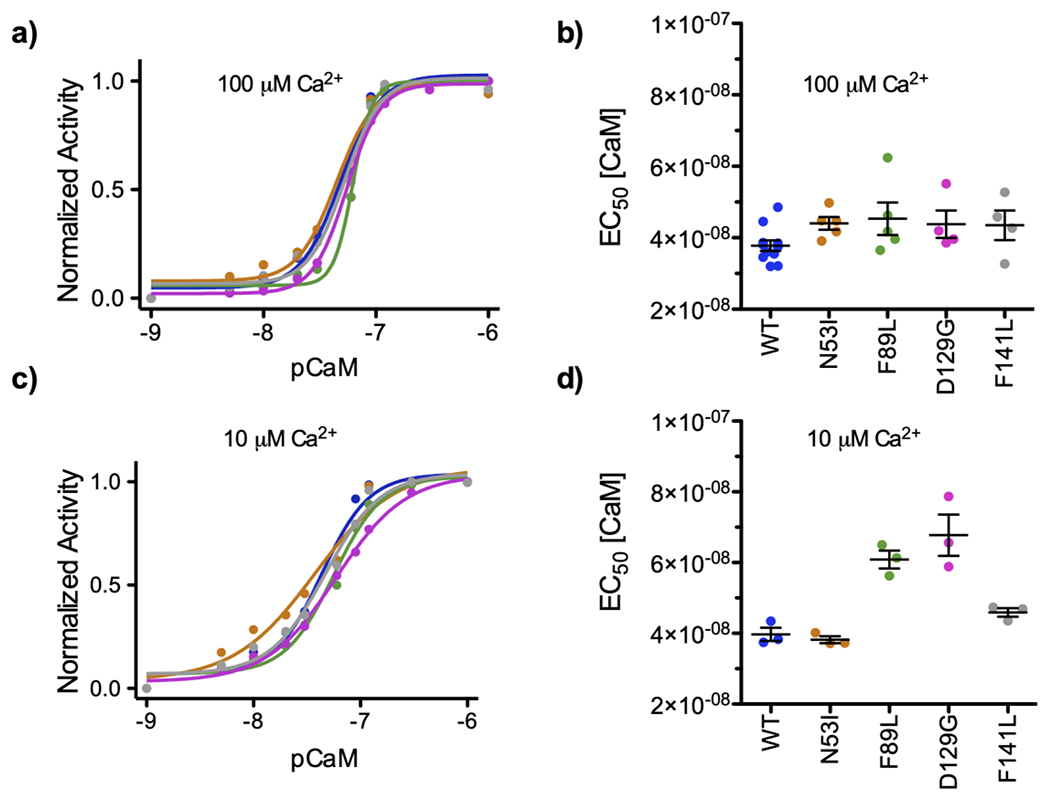
Data color-coded by CaM sample identify: WT, N53I, F89L, D129G, and F141L. a) Representative data set of normalized CaN activity as a function of [CaM] under saturating [Ca2+]. b) Concentration of CaM required to obtain half maximal CaN activity (EC50) at 100 μM [Ca2+]. No significant differences relative to WT were calculated for the mutations c) Representative data set of normalized CaN activity as a function of [CaM] at 10 μM [Ca2+]]. d) CaM EC50 values at 10 μM [Ca2+]. One way ANOVA indicated N53I ns, F89L **, D129G ***, F141L ns, relative to WT. Average value ± standard error of measurement shown on top of dot plots of EC50 values. CaM EC50 values obtained at saturating [Ca2+] can be interpreted as apparent affinity of CaM for the CaN enzyme.
Disease-associated CaM mutations change the amount of Ca2+ required to enhance CaN activity.
To quantify the impact of these CaM mutations on Ca2+-CaM-CaN activity, we titrated Ca2+ into each CaM-CaN complex under saturating CaM conditions. Based on our CaM titrations, we calculated that all the samples would be saturated at 1 μM CaM (Figure 1, pCaM 6). We found that in the presence of 1 μM CaM, all investigated samples achieved Ca2+ saturation at 100 μM (pCa2+ 4) (Figure 2a). This agrees with Stewart et al. (23), who reports Ca2+ saturation at 100 μM in the presence of saturating WT CaM. Our results also demonstrate that CaM mutations can impact the CaN activity EC50 [Ca2+], as we observed up to a five-fold change between the groups (Figure 2b). Specifically, F141L, F89L, and D129G required a higher [Ca2+] to achieve a similar level of CaN-enhanced activity compared to WT or N53I (WT = 0.67 ± 0.10 μM, N53I = 0.98 ± 0.12 μM, F89L = 1.97 ± 0.37 μM, D129G 3.95 ± 0.52 μM, F141L = 1.63 ± 0.11 μM) . The 5-fold [Ca2+] required to achieve half-maximal activity for D129G is consistent with disruption of EF-hand Ca2+ coordination, as the aspartic acid at position 1 of the loop is a strong determinant of Ca2+ binding (33,47). The 2-fold increase in Ca2+ EC50 for F89L and F141L is also not overly surprising. While not directly involved in Ca2+ coordination, molecular modeling has indicated that the F89 and F141 residues are important for the energetics of transitioning CaM between the open and closed states (32). Moreover, both the F89 and F141 residues are located adjacent to a glutamic acid (position 12 of the loop) that is critical for Ca2+ coordination (33,48). Solution NMR spectra indicate these mutations exert an influence on other amino acids in the Ca2+ binding loop and CaM structure that extend beyond the local side-chain environment (3). Lastly, we find that the N53I mutation does not alter CaN’s apparent Ca2+ sensitivity at the conditions investigated.
Figure 2. Ca2+ enhancement of CaN activity at saturated CaM.
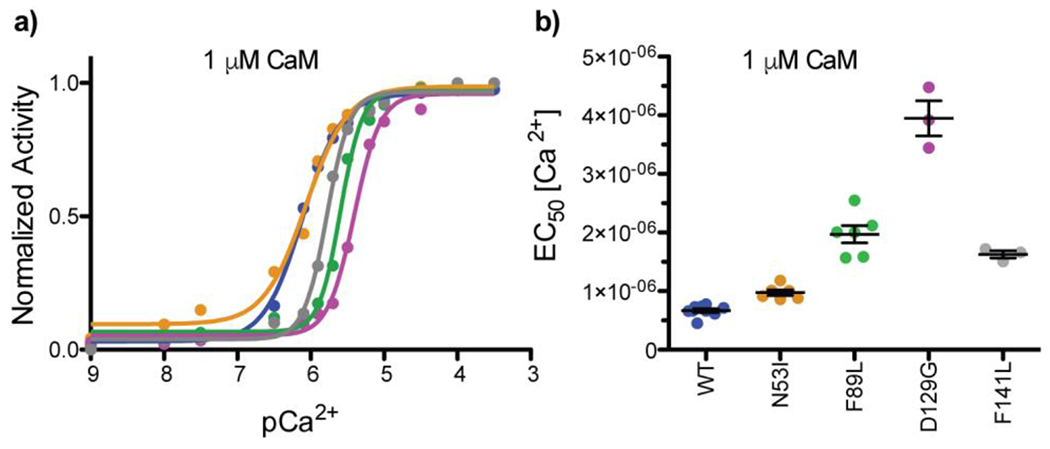
Data color-coded by CaM sample identify WT, N53I, F89L, D129G, and F141L. a) Normalized CaN activity vs. [Ca2+] in the presence of 1 μM [CaM]. b) Ca2+ EC50 of the CaM-CaN complexes. One way ANOVA indicated N53I ns, F89L ***, D129G ***, F141L *** relative to WT. Ca2+ EC50 values obtained at saturating [CaM] can be interpreted as apparent affinity of Ca2+ for the CaM-CaN enzyme complex.
The N53I CaM mutation hinders maximal CaN activity enhancement despite saturating Ca2+ and CaM.
Having quantified [Ca2+] (Figure 1) and [CaM] (Figure 2) sensitivities, we then sought to investigate maximal enzyme activation. For this, we monitored substrate fluorescence under saturating [CaM] and [Ca2+] (Figure 3a and 3b). Consistent with literature (49), our WT fluorescence data yielded a ~4.5-fold increase in activity. Despite similar [Ca2+] and [CaM] EC50 values, the N53I mutation was unique as it imparted approximately half of the activity enhancement (~ 220% compared to ~420%) (Figure 3b). To probe maximal activity in Ca2+ conditions similar to those in a cardiomyocyte, we investigated CaN activity in the presence of reduced [Ca2+], Decreasing [Ca2+] from 100 μM to 10 μM did not drastically alter the maximal activity for the mutants (Figure 3b and 3c).
Figure 3. N53I-CaM decreases maximum achievable CaN activity.
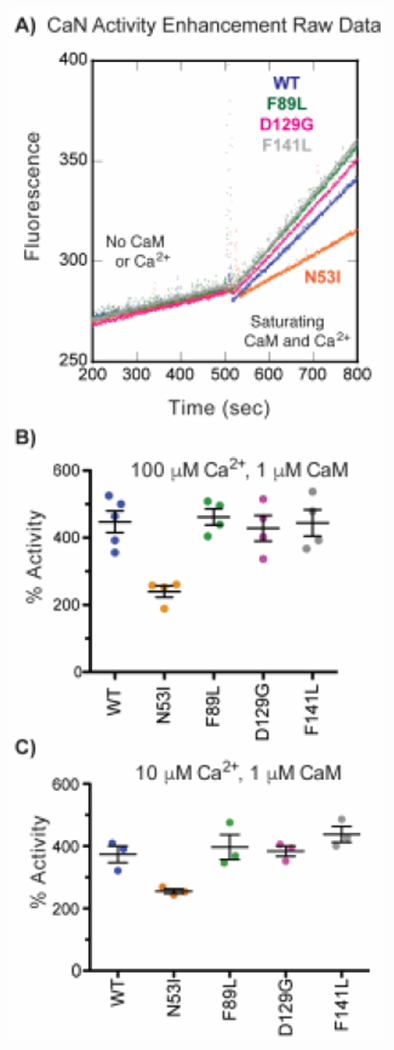
a) Representative MUP fluorescence at 150 nM CaN in the absence and presence of Ca2+-CaM. CaN activity enhancement by Ca2+-CaM at b) 100 μM [Ca2+]. One way ANOVA with Tukey multiple comparison test yielded N53I *, F89L ns, D129G ns, F141L ns, relative to WT. c) 10 μM [Ca2+]. One way ANOVA with Dunnett’s multiple comparison test yielded N53I *, F89L ns, D129G ns, F141L ns, relative to WT. We note that MUP fluorescence was linear in the absence and presence of Ca2+-CaM confirming that data was obtained at steady-state conditions.
The N53I mutation does not alter the stability of Ca2+ saturated CaM-CaN peptide complex.
To gain insight into the mechanism of N53I altered activity, we mapped the amino acid onto a structure of the Ca2+ -CaM-CaN complex. Intriguingly the N53 residue does not localize or appear to contribute to the traditional CaM-CaN binding interface (Figure 4) (43,50). To us, this indicated that either (i) the N53I mutation allosterically modified the CaM-CaN binding interface or (ii) there could be an additional CaM-CaN interaction that is not captured or reported by the CaM-CaN peptide complex. To empirically determine if the N53I mutation altered the stability of the CaM-CaN peptide complex, we collected circular dichroism (CD) spectra coupled with temperature titration. CD is an efficient technique that has been well-established for monitoring secondary structural features such as alpha helical content (50–52). Increases in temperature will destabilize or reduce alpha helical content, and this can be monitored over time. If the N53I mutation allosterically disrupted the CaM-CaN peptide binding interface, we anticipated this would be reported by a change in CD signals (208 or 222 nm). As seen in Figure 5 the N53I CaM mutation did not alter the stability of CaM-CaN peptide complex across the temperatures that we investigated (20 - 90 ° C).
Figure 4. Structure of CaM bound to a peptide corresponding to the CaM binding region of CaN.
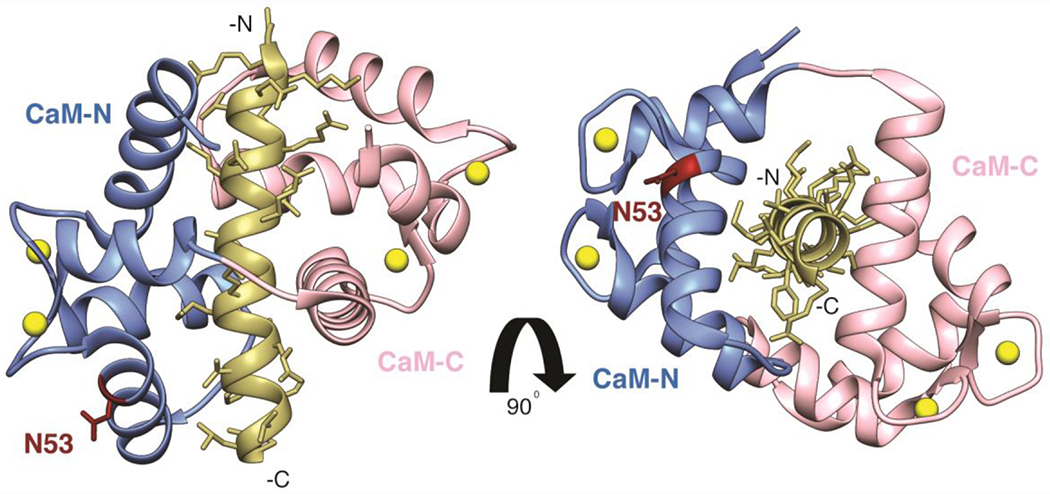
Adapted from PDB ID: 4Q5U. The N-domain of CaM (residues 1-74) is shown in grey, the C-domain of CaM (residues 75-148) shown in salmon, Ca2+ ions bound to EF-hand motifs are shown in yellow, and the CaN peptide is shown in tan. CaM N53 is highlighted and labeled in maroon.
Figure 5. Secondary structural content of Ca2+-CaM-CaN peptide complexes as a function of temperature.
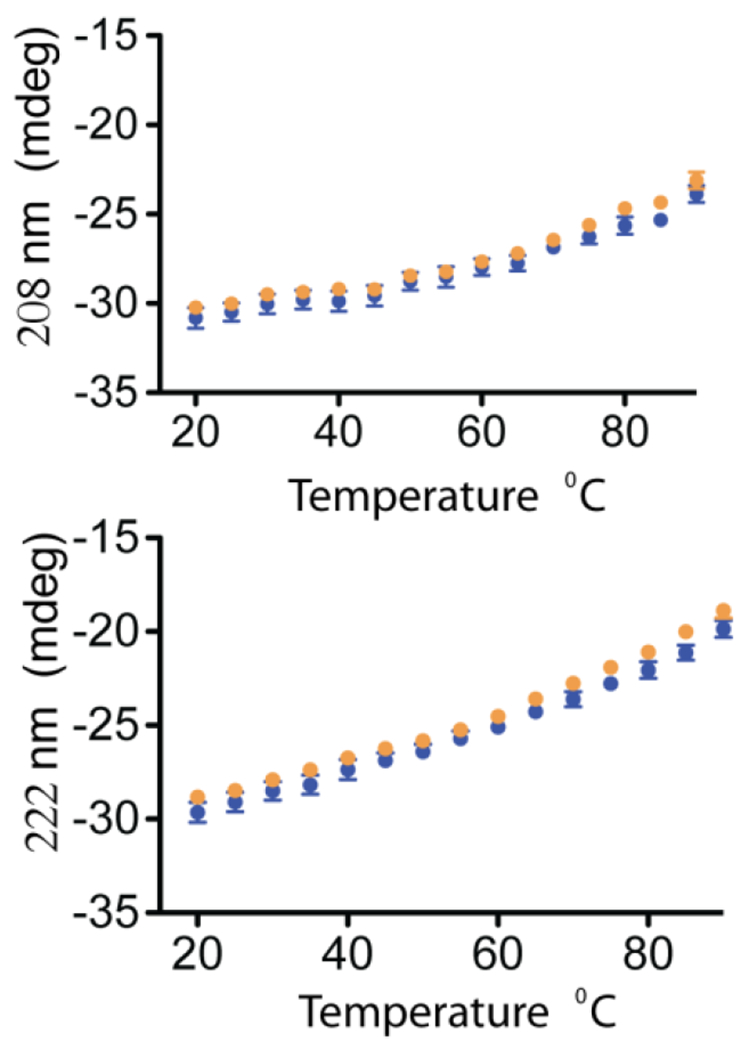
CD signal at 208 nm and 222 nm plotted against temperature for WT and N53I Ca2+-CaM-CaN peptide complexes. Data is the average of 3 independent runs and error bars are shown as the standard error of measurement.
Solution NMR spectroscopy interrogates effect of mutation on CaM-CaN peptide complex formation.
To quantify the structural impact of each mutation, we leveraged solution NMR spectroscopy and characterized complex formation at a series of [Ca2+]. Isotopically enriched 15N CaM with unlabeled CaN peptide samples were prepared in the absence of Ca2+ (see methods section for detailed protocol). Briefly, 2D 1H -15N HSQC spectra were recorded for a series of Ca2+ additions to each sample. Backbone CaM-CaN cross-peak assignments were initially transferred (50), and then assignments were validated at our experimental conditions using traditional 3D NMR experiments for isotopically enriched 15N-13C WT CaM in the absence and presence of the CaN peptide (Figure S3). The 1H-15N HSQC NMR spectra were analyzed to determine if the amide resonance frequencies matched that of the WT CaM-CaN peptide complex in the presence of saturating Ca2+ (Figure S3 and S4). As anticipated at a 5:1 [Ca2+] : [protein] ratio, the WT 15N CaM-CaN peptide displayed a majority of cross-peaks that matched the 80:1 WT Ca2+ CaM-CaN complex spectra (Figure 6a right, Figure S5). A few cross-peaks corresponding to amino acids located at the edges of alpha helices or Ca2+ binding loops were missing in this spectrum. This was consistent with a small population of CaM containing these amino acids in a different conformation. Further addition of Ca2+ (20:1 and 80:1 molar ratios) resulted in the appearance of these missing signals (Figure 6a center and left). This result agrees with Le Chatelier’s principle, as the addition of Ca2+ increases the steady-state population of the Ca2+-CaM-CaN complex. Our WT CaM-CaN complex data and results are in agreement with literature (23,45) and our CaN activity data where we observed high- CaM and Ca2+ affinity (Figures 1 and 2).
Figure 6. CaM-CaN peptide complex formation as a function of [Ca2+] at steady state conditions.
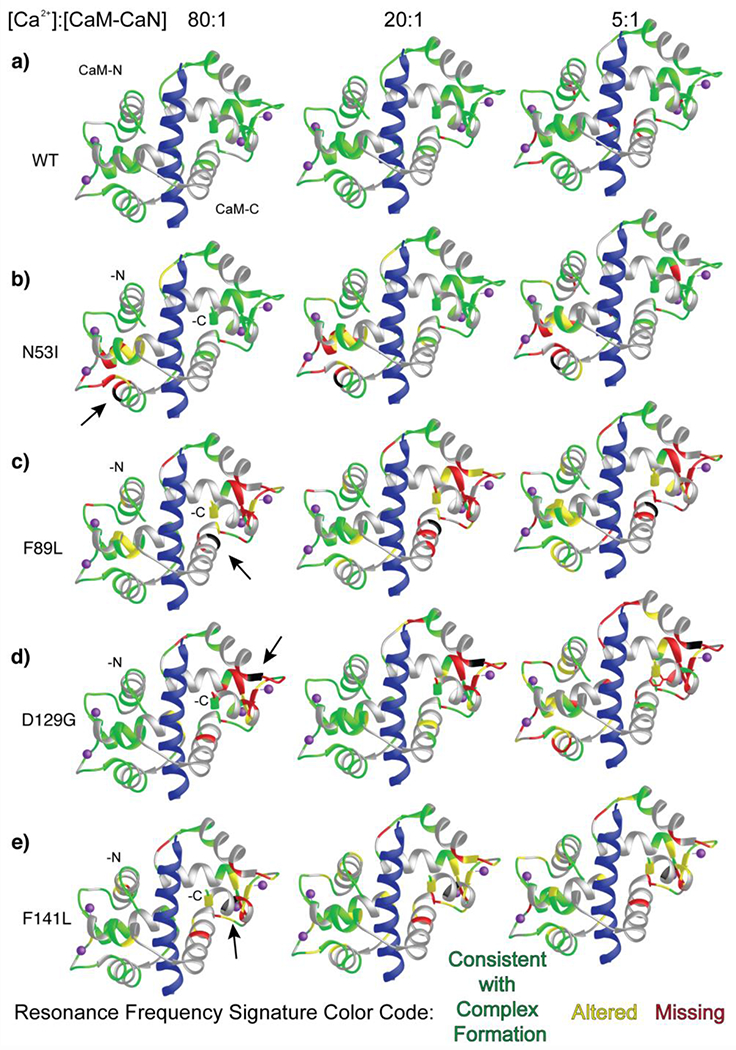
CaM-CaN complexes color-coded by 1H-15N HSQC NMR spectra analysis. Disease-associated mutation location highlighted in black and identified by an arrow. CaN peptide shown in blue. Cross-peaks that match those corresponding to WT-Ca2+-CaM-CaN peptide complex are mapped onto the ribbon structure in green, cross-peaks that are moderately altered (< 1 peak width) are shown in yellow, and cross-peaks that disappear or shift > 1 peak width are highlighted in red. Overlapped cross-peaks that could not be clearly attributed to a specific amino acid are shown in grey.
The N53I CaM-CaN complex spectra displayed some alterations to the CaM-N domain resonance frequencies which agreed with the location of the mutation (Figure 6b). Additionally, similar to the WT CaM sample a few cross peaks corresponding to amino acids at the edge of the Ca2+ binding loops and/or ends of alpha helices were missing at 5:1 Ca2+. These cross-peaks appear and/or shift to a value consistent with complex formation with further addition of Ca2+. Notably, the N53I CaM-C domain displayed minimal alterations to resonance frequencies compared to the WT CaM-C domain. Moreover, the CaM-N domain cross-peaks that were altered or missing corresponded predominantly to amino acids located outside of the CaN-CaM binding interface (Figures 4 and 6b). This agreed with our CD temperature data, where the stability of the N53I and WT Ca2+-CaM-CaN peptide complexes were indistinguishable within the precision of our measurement Figure 5).
The F89L, D129G, and F141L data reveal more substantial alterations to cross-peaks corresponding to CaM-N and -C domain amino acids at 5:1 Ca2+. This was not overly surprising given our CaN activity data where elevated CaM (Figure 1) and/or Ca2+ (Figure 2) EC50’s were observed. Similar to WT and N53I, with the addition of Ca2+ these spectra more closely resemble that of WT-CaM -CaN peptide complex. However, many of the signals corresponding to CaM-C domain amino acids retain perturbations or missing cross-peaks. Somewhat surprisingly, the D129G CaM-N domain cross-peaks provide a nearly complete positive signature for appropriate complex formation at 80:1 Ca2+, despite this mutation imparting the greatest extent of perturbation across all samples at 5:1 Ca2+. It is worth noting, that this impaired CaM-N domain -CaN peptide complex formation could be interpreted as the D129G mutation imparting a reduction to the CaM-N domain Ca2+ affinity in the presence of the CaN peptide, that can be overcome by excess Ca2+ (Figure 6d). This is in contrast to the F89L, and F141L CaM-C domain data where the 80:1 molar ratio of Ca2+ was insufficient to establish a stable endogenously structured CaM-CaN peptide interaction (Figure 6c-e).
To validate our interpretation and confirm that the mutations (N53I, F89L, D129G, and F141L) do not impair the interaction to an extent where a part of CaM or a domain no longer interacted with the CaN peptide, we overlaid each of our Ca2+ titration spectra with a fully assigned HSQC spectrum of Ca2+ CaM collected at similar salt, temperature, and buffer conditions (Figure S3). At best, we observed three to six cross peaks that matched frequencies corresponding to Ca2+ CaM in isolation (T5, F65, and G134 observed in all spectra). Considering (i) these amino acids are not at the CaM-CaN binding interface (Figure 5), and (ii) the number of cross-peaks that severe as a positive signature for complex formation (Figure 6, Figure S5), we conclude that each of the F89L, D129G, and F141L CaM point mutations perturb, but do not abolish either of the CaM domain CaN interactions.
Lastly, to understand if the individual CaM point mutations promoted CaM-CaN interaction in the absence of Ca2+, we compared NMR spectra of each mutant CaM with CaN peptide in the absence of Ca2+ to WT complex in the presence of Ca2+ (Figure S6). The N53I , F89L and F141L spectra did not yield cross-peaks consistent with complex formation in the absence of Ca2+. The D129G peptide spectra did display a moderate degree of similarity to the WT Ca2+-CaM-CaN spectra, however, analysis revealed the majority of these peaks did not correspond to amino acids at the CaM-CaN binding interface (Figure S7).
In summary, our NMR investigation provides insight into Ca2+-CaM-CaN interaction as they reveal alterations to amino acids used for Ca2+ binding and complex formation. While this data support our enzymatic mechanisms of impaired Ca2+ binding and impaired CaM binding for the F89L, D129G, and F141L mutations, it does not reveal the mechanism by which the N53I mutation fails to elicit maximal enzyme activity at saturating Ca2+ and CaM conditions.
Probing the timing of CaM Ca2+ release and conformational change.
Given our biophysical data thus far had not captured a mechanism for N53I CaN modification (structural modeling places the N53I mutation outside of the CaM-CaN binding interface (Figure 4), CD coupled temperature data displayed similar complex stability (Figure 5), and solution NMR validated appropriate complex formation around the CaN peptide binding interface (Figure 6)), we turned our attention to kinetic measurements as a means of understanding a mechanism of dysfunction. To date, the majority of biophysical data describing CaM interaction is collected at steady-state Ca2+ conditions. To gain insight into CaM as a Ca2+ sensor, we used stopped-flow to quantify (i) Ca2+ release rates and (ii) the time required for conformational change (Figure 7). Briefly, purified Ca2+-CaM samples were rapidly mixed with a Ca2+ chelator and a fluorescence signal was recorded over time. Data were collected for each Ca2+-CaM sample, and then again in the presence of 3-fold molar excess CaN peptide. Plotting the fluorescence intensity against time, data were fit to a single or double exponent binding equation (see methods section for detailed protocol).
Figure 7. Ca2+ release rates of CaM and CaM-CaN peptide complex.
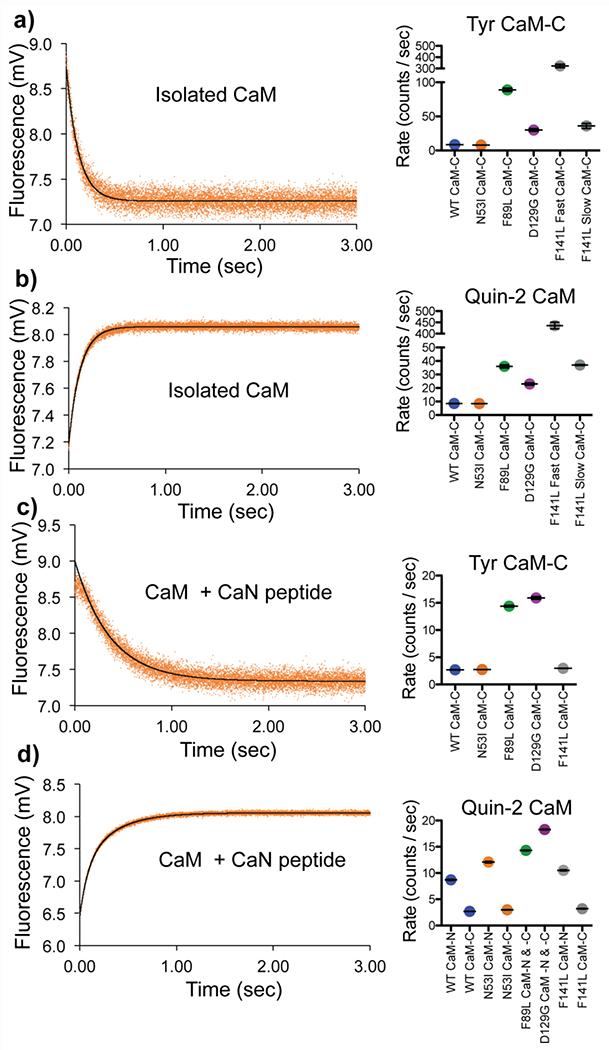
Fluorescence intensity of a) isolated Ca2+ CaM (Tyr) rapidly mixing with EGTA b) isolated Ca2+ CaM-rapidly mixed with fluorescent Ca2+ chelator Quin-2 c) Ca2+ CaM (Tyr) + CaN peptide rapidly mixed with EGTA d) Ca2+ CaM + CaN peptide rapidly mixed with fluorescent Ca2+ chelator Quin-2. Data for N53I CaM shown on left, summary of fitting color-coded by CaM sample identify, WT, N53I, F89L, D129G, and F141L shown on right.
Intrinsic Tyr fluorescence can be used to report the conformational status of Ca2+ binding in the CaM -C domain (53,54). Upon rapid mixing with EGTA Ca2+ is removed from CaM and the ensuing conformational change decreases Tyr fluorescence (Figure 7a). WT and N53I CaM samples yielded similar data (8.5 ± 0.2 s−1 , 7.9 ± 0.2 s−1). The F89L and D129G mutation accelerated Ca2+ release (89 ± 6 s−1, 30 ± 5 s−1), with F89L displaying the fastest rate. The F141L data was best fit by a double exponential equation resulting in two rates (~ 10x different between the fast and slow rate (320 ± 30 s−1, 36 ± 9 s−1)). This is consistent with a disruption to the cooperativity between EF hand III-IV yielding Ca2+ release at different rates.
To gain further insight into Ca2+ release from both the -N and -C domains we repeated the isolated CaM experiments using the fluorescent Ca2+ chelator Quin-2 in place of EGTA. As anticipated, the majority of the isolated Ca2+-CaM data contained a fast and slow component. We attributed the fast, unquantifiable components to the CaM-N domain (> 800 counts/sec) (Figure 7b). For data that was captured in a measurable time scale (< 800 counts/sec), we calculated a similar trend in rates as the CaM- Tyr data. N53I was similar to WT (8.4 ±0.1 s−1 and 8.8 ± 0.1 s−1). F89L and D129G were accelerated (36 ± 3 s−1 and 23 ± 2 s−1). F141L was best fit by a double exponent equitation (440 ± 40 s−1 and 37 ± 1 s−1). Calibrating our fluorescence data to a series of controls allowed for an estimation of Ca2+ content released from each sample. For the WT and N53I samples we calculated ~ 1.6 mols of Ca2+ / mol of CaM, which corresponded roughly to the expected 2 molecules of Ca2+ / molecule of CaM of the -C domain. For F89L, D129G, and F141L the Ca2+ content was reduced (0.6 F89L, 0.2 D129G, 0.5 F141L fast, and 0.3 F141L slow, mols Ca2+ / mol CaM). This indicated that the CaM-C domain EF hands were not fully populated or bound to Ca2+ under these conditions, which is consistent with our previously observed steady state affinity measurements (4). We also note that the accelerated F89L, D129G, and F141L Ca2+ release rates, are consistent with the elevated EC50 [Ca2+] values observed in our CaN activity data (Figure 2).
It has been well-established that interactions between CaM and a binding partner can alter the kinetic on and off rates of Ca2+ (55–57). As expected, addition of the CaN peptide reduced the Ca2+ release rates for all CaM-CaN samples investigated (Figure 7c). For all five samples, Tyr data were best fit to a single component yielding an average rate, indicating that in the presence of the CaN peptide, EF hands III-IV retain cooperativity. The N53I (2.74 ± 0.03 s−1) and F141L (2.96 ± 0.06 s−1) mutations displayed a rate that was identical or similar to WT (2.7 ± 0.1 s−1), whereas the F89L and D129G rates were ~ 5-fold faster (14.4 ± 0.4 s−1, and 15.9 ± 0.6 s−1).
Repeating the Ca2+ CaM-CaN peptide experiment with Quin-2 provided additional insight into the Ca2+ kinetics. For WT, N53I and F141L, the data were best fit by double exponential models. The slow components closely resembled rates of the Tyr data allowing them to be attributed to the CaM-C domain (Figure 7d). The fast components were consistent with stabilized CaM-N Ca2+ release rates in a measurable range (< 800 counts/sec). Interestingly the F89L and D129G data were still best fit by a single exponent equation. Estimating the mols of Ca2+ released from each sample revealed ~ 3:1 Ca2+/CaM ratio. Similar to the isolated CaM this was also consistent with incomplete saturation of the CaM EF hands at our experimental conditions. Lastly, we note that our data indicated a slight but significant elevation to the N53I CaM-N rate (12.1 ± 0.4 s−1) in the presence of the CaN peptide compared to WT (8.8 ± 0.1 s−1) and F141L (10.5 ± 0.3 s−1).
Molecular modeling suggest N53I mutation impairs other aspects of CaN-CaM interaction.
Our extensive biophysical characterization only revealed a small elevation in one of the N53I CaM-CaN Ca2+ release rates. To us, this finding appeared insufficient as the complete mechanism for the observed 50% N53I reduction to maximal CaN activity (Figure 3). We next considered the non-canonical CaM-distal helix interaction as a mechanism. We recently posited this interaction as a component for optimal activation of CaN by Ca2+-CaM (26,58). To explore this hypothesis, we performed molecular dynamics (MD) simulations of both WT and N53I CaM in complex with a CaN construct containing the conical CaM Binding Region (CaMBR) connected to the distal helix. Previously, we identified four sites on CaM that could accommodate the binding of CaN’s distal helix (Figure 8) (58).
Figure 8.
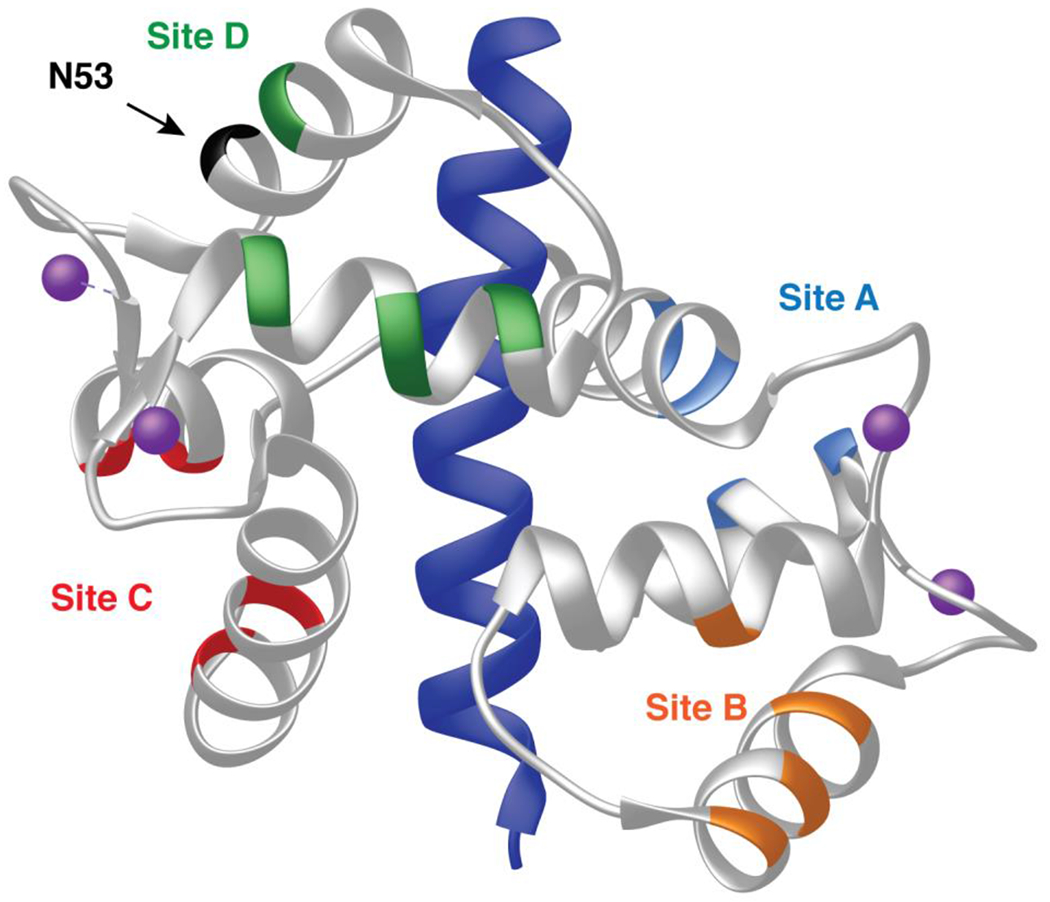
Posited sites of CaM interaction with CaN distal helix (58) mapped onto structure of CaM CaN-complex (PDB ID 4Q5U). Sites are color coded to match MD simulation data shown in Figure 9.
Root mean square deviations (RMSD) of the CaM sites in the presence of the distal helix provide an indirect measurement of the sites’ mobility. The results for WT and N53I are similar and unremarkable (Figure S8a). Root mean square fluctuations (RMSFs) similarly provide insight into the mobility of individual amino acids. RMSFs for CaM and the CaMBR also display similar WT and N53I data (Figure S8b). Both of these results are consistent with our biophysical data that described similar properties for WT and N53I CaM in the absence and presence of the CaN peptide (Figures 5-7). RMSFs were also calculated for part of CaN’s disordered linker that bridges the CaMBR and CaN’s autoinhibitory domain (Figure 9a). For the WT system sites A, B, and C predominantly displayed values at or below 5 Å, while site D was above 5 Å RMSF. Repeating this for a system containing the N53I mutation yielded different results. For N53I, the disordered linker (residues on left of dashed line) site A gained mobility, while site D decreased mobility. We note that repeating these calculations for the other mutations (F89L, D129G and F141L) did not reveal remarkable features (Figure S9). We note that site D is located in close proximity to the N53 CaM amino acid which provides a logical rationale for the in silico data (Figure 8).
Figure 9.
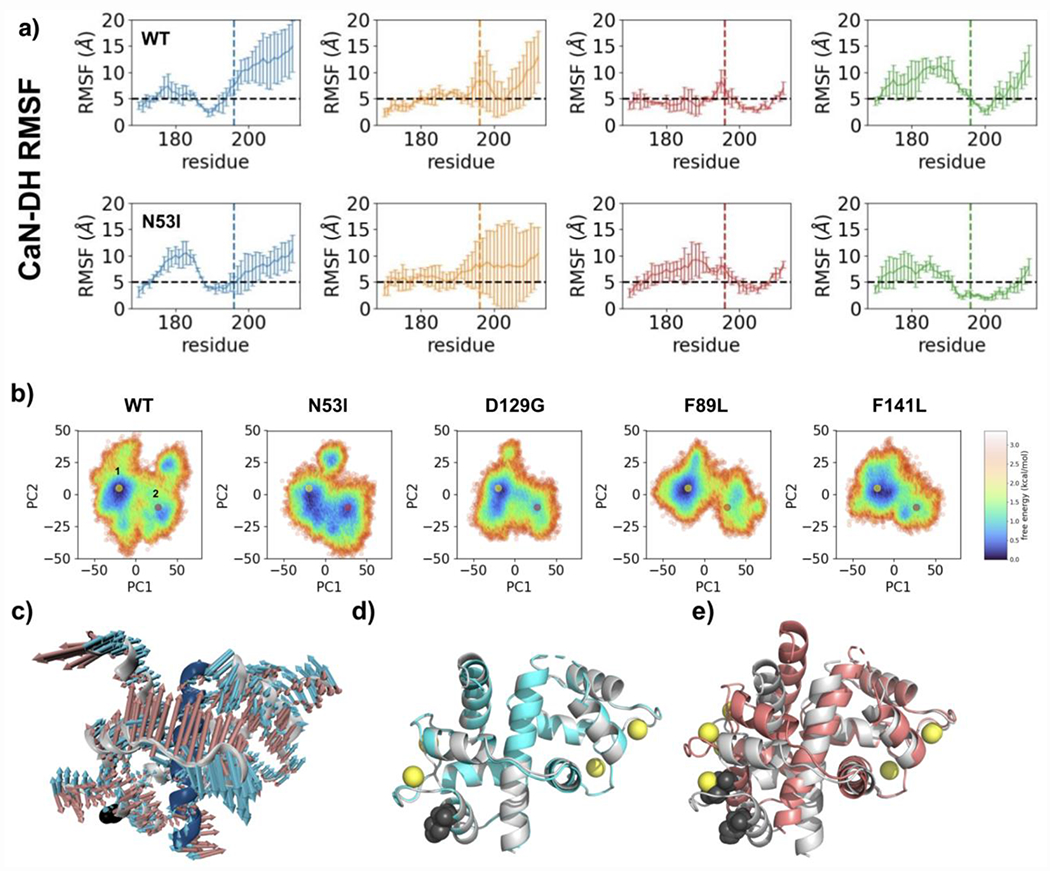
Molecular dynamic simulation and principal component analysis indicate N53I alters motility and facilitates a second CaM binding conformation. a) RMSF analysis of CaN distal helix CaM interaction. Data are color coded by posited CaM binding sites as shown in Figure 8. The black dashed line denotes a 5 Å cutoff under which residues are deemed stable during the simulations. Amino acids from linker that connects the CaN distal helix to the CaM binding region are on the left of the dashed line (below residue 195). b) PCA plots of CaM-CaN system containing CaN distal helix and CaM binding region. Simulations were performed for each disease associated CaM mutation and results were color coded according to free energy calculations. c) Overlay of models corresponding to two lowest energy minimum identified for N53I CaM-CaN system. d) Overlay of models corresponding to WT (grey) vs N53I (cyan) lowest energy minimum (yellow dots). e) Overlay of models corresponding to WT (grey) and N53I (salmon) second energy minimums (pink dots).
To understand how these predicted changes in mobility could alter the CaM-CaN interaction at the CaM binding region we turned to principal component analysis (Figure 9b). This analysis yields a heat map of the energies for the CaM-CaN system. A yellow and pink dot highlight the lowest energy minimums for each simulation. For the WT, F89L, D129G, and F141L systems the data is consistent with a single energy minimum. For the N53I system the analysis indicates a broader minimum that comprises two regions in the plot. This data indicates that there is more than one low energy conformation for the N53I CaM-CaN system. Examining the two structural models corresponding to the lowest energy conformations reveals subtle differences in structural features (Figure 9c). The second N53I energy minimum model (pink dot) contains distortions in the form of bends to the CaM structure relative to the dominant WT CaM-CaN model. We note that these types of structural changes are inherently difficult to detect by NMR for two reasons (i) bending of a protein is the aggregate sum of small variations occurring across a series of amino acid (i.e. small changes in local environment across many resonance frequencies) (ii) NMR signals are dominated by population, and the bent structure comprises a minor population for the interaction.
Lastly, we computed and compared binding energies between CaM and the CaN distal helix at each of the four CaM sites. The N53I mutation data suggests enhanced binding at sites A and C, with a decrease at site D (Figure S10). This is consistent with the alterations predicted in the CaN linker that connects the distal helix and autoinhibitory domain.
Direct interrogation of Ca2+ CaM CaN affinity.
Our enzymology (impaired maximal activation of CaN by N53I, Figure 3) and modeling data (Figure 9) support a multi-facetted mechanism of CaM activation of CaN that involves (i) CaM binding to a traditional hydrophobic binding region, and (ii) CaM interaction with a distal helix component. This compelled us to directly establish binding affinities, as the [Ca2+] and/or [CaM] required to achieve half maximal CaN activation could be different from the [Ca2+] and/or [CaM] necessary for CaM interaction with the traditional hydrophobic region of CaN.
To directly interrogate the effect of the N53I mutation on Ca2+-CaM-CaN binding affinity, we monitored the intrinsic fluorescence of CaM (Tyr and Phe) during a series of calcium titrations. This was performed in both the absence and presence of a peptide corresponding to CaN binding region. Because CaM binding to the CaN peptide enhances Ca2+ binding affinity (57), modification of CaM-CaN affinity (reduction or enhancement) would be visible in the Ca2+ binding data.
In the absence of the CaN peptide, our data yielded affinities for CaM-Ca2+ binding that were consistent with our previously published data (Figure 10a, and 10b) (3,4,8). Repeating these measurements in the presence of the CaN peptide enhanced both the CaM-N and -C domain Ca2+ binding affinities (Figure 10c, and 10d). Importantly, we could not detect a difference between the WT CaM and N53I Ca2+ binding affinities in the presence of the CaN peptide (CaM-C domain: WT = 354 ± 68 nM , N53I = 388 ± 30 nM, CaM -N domain: WT = 299 ± 144 nM , N53I = 461 ± 125 nM). We note a subtle trend in the Phe data (yielding a slightly reduced affinity corresponding to the CaM-N domain), however, similar to our kinetic data (Figure 8), this appeared insufficient as a complete mechanism of N53I dysfunction (Figure 3). The other CaM mutations impair Ca2+ binding affinity in a similar manner to our enzymology data (Figures 1 and 2).
Figure 10.
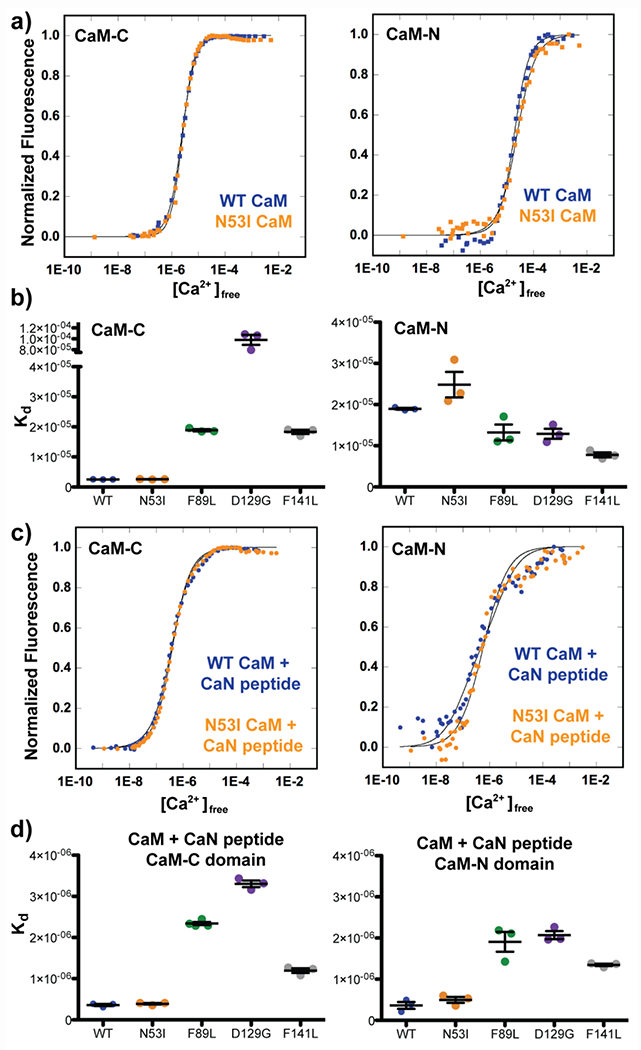
CaM Ca2+ binding affinities in the absence and presence of CaN peptide. a) Normalized intrinsic fluorescence of Tyr (CaM-C) and Phe (CaM-N) plotted against free [Ca2+] determined by fluorescence of F5N Ca2+ dye in the absence of CaN peptide. b) Summary of CaM-C and −N Ca2+ Kd values. Error bars indicate stand error of measurement. One way ANOVA analysis with Tukey posthoc test indicated N53I ns, F89L ns, D129G ***, F141L ns relative to WT. c) Normalized intrinsic fluorescence of Tyr (CaM-C) and Phe (CaM-N) plotted against free [Ca2+] determined by fluorescence of F5F Ca2+ dye in the presence of CaN peptide. d) Summary of CaM-C and −N Ca2+ Kd values in the presence of CaN peptide. Error bars indicate standard error of measurement. One way ANOVA analysis with Tukey posthoc test indicated N53I ns, F89L ***, D129G ***, F141L ** relative to WT.
DISCUSSION
CaM interactions are complicated.
This work explores four potential mechanisms for how disease-associated CaM mutations can alter CaN function in vitro. First, the effective [Ca2+] required to elicit half of the maximal enzyme activity (EC50) can be altered. Several of the disease-associated mutations (F89L, D129G, and F141L) required elevated [Ca2+] to reach the EC50. We speculate that this type of modification would reduce CaN activity in a cardiomyocyte. Second, at 10 μM [Ca2+], we find that the [CaM] required to obtain the EC50 can be altered. The F89L and D129G mutations required a higher [CaM] to reach half-maximal CaN activity. We speculate that this modification would also reduce CaN activity in a cardiomyocyte, as CaM is not abundantly available due to its many high-affinity protein interactions (1,59,60). Third, the ability of the CaM interaction to elicit enhancement of CaN enzymatic activity may be impaired. For the N53I mutation we observe unaltered EC50 values for [Ca2+] and [CaM]; yet under saturating Ca2+-CaM conditions, the maximal activity of CaN is reduced. We speculate that this would also lead to a reduction in observed CaN dephosphorylation events. Lastly, the rates of Ca2+ and/or CaM complex formation and/or conformational change could be altered. We find that some of the mutations enhance the Ca2+ release rate from the enzyme complex. We speculate this would also lead to a reduction in CaN activity over time. Intriguingly all four of these effects could result in an enrichment of phosphorylated protein, which intriguingly, is a hallmark of many cardiac diseased-states. Further investigation will be required to understand if compensatory mechanisms arise and prevent elevated phosphorylation in vivo.
CaM N53I mutation supports CaM-CaN interaction outside of canonical binding interface.
Our data revealed that the N53I CaM mutation did not alter CaN-CaM or CaN Ca2+ sensitivity (Figures 1, 2 and 10), however a diminished activity enhancement was observed compared to the other CaM samples in the presence of saturating Ca2+ and CaM (Figure 3). In 2014, Dunlap et al. reported a crystal structure of Ca2+-CaM bound to a peptide corresponding to the CaM binding region of CaN. In this structure both the N- and C- domains of CaM orient their hydrophobic pockets on the surface of the peptide so that CaM adopts a wrap-around configuration. This CaM-CaN peptide complex has a 1:1 stoichiometry and is strikingly similar to the structure of CaM bound to the myosin light chain kinase peptide (43,61). Interestingly, CaM-N53 is not located at or near the CaM-CaN binding interface reported in this structure (Figure 4), which raises the question of how the N53I mutation alters CaN maximal activity. (Figure 3).
Our biophysical characterization revealed a small but significant increase in one of the Ca2+ release rates from the N53I CaM-CaN peptide complex. We speculate this could hinder CaM-CaN complex lifetime thereby impairing CaM’s ability to dislodge the CaN Autoinhibitory domain, however, this was not satisfying as a singular explanation. Notably, our CD temperature data (collected with CaM and a peptide corresponding solely to the CaN-CaM binding region) indicated that N53I did not appreciably alter the stability of the complex. This suggested that the N53I mutation communicated to the CaN enzyme through another mechanism outside of the conical CaM binding region. Therefore, we also considered the non-canonical CaM-CaN distal helix interaction. In 2019 Sun et al. presented in silico evidence for an additional point of contact for the CaM interaction. In this model, the backside of CaM contacts a section of the tether that connects the autoinhibitory domain with the enzyme (distal helix) (58). The presence of this interaction is consistent with and supports a possible mechanism for the N53I mutation to modify maximal CaN activity. Our modeling suggests that the N53I mutation could enhance interaction between CaM and CaN (such as those at Sites A and C) in a manner that detracts from proper complex formation (such as site D), which could impair CaM’s ability to allosterically dislodge the autoinhibitory domain from the CaN active sites.
We note that CaM Ca2+ signal transduction is a complex process that likely involves more than CaM interaction with a conical hydrophobic binding interface. In 2002 our work demonstrated that mutations to the backside of CaM were able to inhibit activation of myosin light chain kinase (MLCK), without impairing CaM binding affinity to MLCK (62). Here our findings suggest that alterations to the distal-helix CaM interaction and altered tether mobility could impair CaM’s ability to dislodge the autoinhibitory domain from the CaN active site. This would sterically hinder substrate access and reduce maximal enzymatic activity. It will be of interest to empirically validate the mechanistic details of this interaction and understand if the CaM-site D surface is utilized for interaction with specific cellular targets.
Roles of CaN in a cardiomyocyte prompt speculation of the cellular and physiological implications of modified CaN activity.
The most widely recognized CaN pathway involves the activation and modification of gene transcription. CaN regulates four isoforms of the transcription factor known as Nuclear Factor of Activated T-cells (NFAT). In the heart, overactivation of the NFAT pathway can lead to a hypertrophic response (63–67). Briefly, the binding of Ca2+-CaM to CaN releases CaN autoinhibition which enhances phosphatase activity. Upon activity enhancement, CaN docks to and dephosphorylates NFAT. Subsequently, the CaN-NFAT complex migrates to the nucleus where it upregulates pro-hypertrophic genes (63). CaN’s role in the development of cardiac hypertrophy via the CaN-NFAT signaling pathway has been well-established (63,65,68). Based on our findings, it would be of interest to investigate if patients harboring mutant CaM develop cardiac hypertrophy.
There are also several lines of evidence that suggest CaN regulates or modifies key Ca2+ cycling proteins in a cardiomyocyte. In 2000, Bandyopadhyay et al. proposed that CaN contributes to RyR2 inactivation. Specifically, they demonstrated that inhibition of CaN with cyclosporin A or FK506 increased the frequency of Ca2+ release from the sarcoplasmic reticulum in cardiomyocyte cultures (36). In 2006, Martinez-Martinez et al. demonstrated that CaN engages LxVP motifs. Analysis of the RyR2 sequence reveals that each subunit contains five LxVP motifs. This yields a total of 20 sites, and mapping them onto the recent CryoEM structure (17) reveals that many are located on the cytosolic surface of RyR2. These lines of evidence suggest that reduced CaN function by CaM mutations could modify and/or create aberrant Ca2+ release from RyR2.
CaN regulation of the LTCC has been the subject of controversy. In 1997 Schuhmann et al. demonstrated that CaN inhibits LTCC via direct dephosphorylation in smooth muscle cells (69). For a review of CaN interactions with Ca2+ channels, see Wang et al. (2014) (70). It is worth noting that modification of RyR2 and LTCC function have been identified as mechanisms of calmodulinopathy. It remains to be determined if modified CaN function could further exacerbate CaM-impaired RyR2 or LTCC function.
Materials and Methods
Protein production:
CaN plasmid that encoded both the A and B subunits was transformed into E. Coli. BL21-RIL CodonPlus competent cells. Cells were amplified in Lysogeny Broth (LB) and protein expression was induced by addition of 1 mM (IPTG) at an OD600 of 0.6. Cells were harvested by centrifugation and pellets were resuspended (50 mM Tris, 200 mM NaCl, pH 7.5, with PMSF and Roche™ tablets) and lysed using sonification. Cell lysate was clarified by centrifugation (48000 x g) for 20 min and the supernatant was syringe filtered (0.45 μm). The CaN protein fraction was enriched by Ni2+ chromatography and further purified using a CaM-sepharose column. Fractions were pooled and dialyzed twice against 4L of buffer containing 5 mM EGTA followed by two more rounds of dialysis (4L of 10 mM MOPS, 150 mM KCl, 1 mM TCEP, pH 7.0). Enzyme purity was verified by SDS-PAGE electrophoresis (>95%) and stock concentration was determined by UV-Vis spectroscopy (16 μM). Stock samples were aliquoted (only allowed to freeze-thaw once) and stored at −20°C. Data was collected within three weeks of enzyme purification. Three batches of enzyme were produced and characterized to confirm enzyme activity reproducibility.
Unlabeled and isotopically enriched CaM (15N and 15N13C) were produced as described previously (3,71). Briefly, CaM was overexpressed in E. coli and purified using phenyl sepharose chromatography at 4°C. Purity and molecular weight were confirmed using SDS-GEL electrophoresis and electrospray-mass spectroscopy. Mutations were produced using QuikChange site directed mutagenesis and verified by Sanger Sequencing. All CaM stocks were apofied (stripped of Ca2+) by dialyzing stocks in buffer containing 5 mM EGTA (2 x 4L, > 4 hours each bucket) and 50 μM EGTA (2 x 4L, > 4 hours each bucket). [CaM] were determined by UV-VIS spectroscopy (Cary 3500) at 276 nm using CaM ε = 3006 M−1 cm−1 (72). Peptide corresponding to the CaN-CaM binding region (“ARKEVIRNKIRAIGKMARVFSVLR” structurally characterized by NMR PDB ID: 1JZI (50)) was purchased from Innopep (4 x 5 mg) and used for CD, NMR, Stopped-Flow, and CaM Ca2+ binding affinity measurements. Peptide was hydrated in respective buffer for each experiment and concentration was calculated assuming 75% of synthesized sample weight corresponded to protein.
CaN activity sample preparation:
Samples were prepared from stock CaN by diluting to 150 nM CaN in 200 mM MOPS, 150 M KCl, 3 mM MgCl2, and 2 mM EGTA. Ca2+/EGTA solutions were calibrated using a dose-response fit of CaM-C domain tyrosine fluorescence to match published values (49). 10 μM MUP (working concentration) was added to each 2.000 mL sample immediately before data collection.
CaN activity fluorescence measurements and data analysis:
Fluorescence intensity of 10 μM 4-Methylumbelliferyl Phosphate (MUP) substrate (Excitation = 365 nm, emission = 445 nm, and data sampling 0.2 s) was monitored over time under steady-state conditions at 22 °C using a PerkinElmer fluorimeter. Samples were temperature equilibrated for 6 min prior to titrations. Ca2+ or CaM were titrated into each sample every three minutes. The data for each titration condition were fit to a linear line (Kalidograph v4) and the slope corresponded to CaN activity. Plotting the slopes against the titration conditions yielded sigmoidal curves. These results were fit to a four-parameter dose-response curve (Prism-GraphPad (Y = Bottom + (Top-Bottom)/(1+10^((LogEC50-X)*HillSlope) ) and EC50 values were plotted for each CaM sample. A minimum of three replicates of each experiment were collected for each CaM sample using a minimum of two batches of CaN enzyme. Resulting EC50 values were compared using an ANOVA with Tukey Multiple Comparison Test. Statistical differences from WT CaM were identified by P values < 0.05.
NMR spectroscopy resonance frequency assignments:
CaN peptide was hydrated in buffer from the final round of CaM dialysis (50 mM HEPES, 100 mM KCl, 2 mM CaCl2 , pH= 7.4). CaN peptide was added to isotopically enriched 15N-13C CaM to form 750 μM complex with a 500 μl sample volume. Three % D2O was added for a lock reference. NMR assignments for WT Ca2+-CaM-CaN peptide complex were transferred from published values (PDB ID 2JZI) (50) and then corrected and validated for our experimental conditions using our 3D HNCACB, CBCACONH, HNCO data. Spectra were collected on our 600 MHz Bruker Avance III spectrometer equipped with a QCI cryoprobe at 298K using non uniform sparse sampling at 33%. Data were collected and processed using topspin 3.4 and spectra were manually analyzed using POKY (73). 1H frequencies were referenced to water at 298K and 13C and 15N frequencies were aliased. Amino acid resonance frequency connectivity (Cβ and Cβ ) was established for all individual peaks (i to i-1) that were not spectrally overlapped at these experimental conditions. 3D NMR HNCACB, CBCACONH, HNCO data was collected and assigned for Ca2+ CaM in the absence and presence of the CaN peptide.
NMR spectroscopy Ca2+ titrations:
500 μL of 75 μM CaM-CaN complex samples were prepared for WT, N53I, F89L, D129G, and F141L CaM. An elevated concentration of buffer (50 mM HEPES) was used to ensure the addition of Ca2+ to EGTA did not alter the pH. 1H-15N HSQC spectra were recorded for samples at 5:1, 20:1 and 80:1 molar ratio of CaM-CaN complex : [Ca2+]. Chemical Shift Perturbations were calculated using Williamson et. al. 2013 using a 20% scaling factor for nitrogen frequencies (0.5 (δ2H + 0.2 * (δ2N))) ^ 0.5 (74).
CD sample preparation and data acquisition:
For CD CaM was dialyzed into 10 mM TRIS, 100 mM KCl, 1 mM CaCl2 pH = 7.4 and the peptide was hydrated with buffer from the final round of dialysis. CD data were collected on Jasco J-1500 CD spectrometer equipped with temperature control using a 0.1 mm pathlength demountable cuvette. Temperature was ramped at 5 degrees/min in 5-degree increments (20 °C to 90 °C). Spectra were recorded (260 - 185 nm). Sample temperature was held for 3 minutes prior to data collection at each temperature to ensure equilibration. Signals at 208 and 222 nm were plotted against temperature using Prism GraphPad. Three independent data sets were collected for three samples of WT and N53I CaM-CaN peptide complex. Average data values with standard deviations at each temperature were compared using Students T-test. P < 0.05 were considered significant.
Stopped-flow measurements:
Ca2+ dissociation kinetics and conformational change rates were measured using an Applied Photophysics Ltd. (Leatherhead, UK) model SX.18MV stopped-flow instrument with a dead time of 1.4 ms at 20 °C. Direct Ca2+ dissociation rates were measured from unlabeled CaM-CaN peptide complex by rapidly mixing with 10 mM EGTA or 150 μM of the fluorescent Ca2+ chelator Quin-2. Solution conditions were 3.0 μM CaM in the presence of 9.0 μM CaN peptide, 10 mM MOPS pH = 7.0, 150 mM KCl, 30 μM CaCl2 and data was collected at 20 °C. Conformational change was described by intrinsic Tyr fluorescence (λex = 275 nm, λem = broad spectrum UG1 Oriel filter, includes 320 nm). Quin-2 data was excited at 330 nm with its emission monitored through a 510-nm broad band-pass interference filter (Oriel, Stratford, CT, USA). Each Ca2+ dissociation event or conformational change rate represents an average of at least three traces with three independent replicates. The kinetic traces were fit with either a single exponential equation of the form a·exp(−k·x)+c, or a double exponential equation of the form a1·exp(−k1·x)+ (a2·exp(−k2·x)+c using a program written by P. J. King, Applied Photophysics Ltd. that utilizes the nonlinear Levenberg-Marquardt algorithm. There is a clear deviation from linearity for the residual when a single exponential fit is applied to a multi-exponential kinetic trace.
Intrinsic fluorescence Ca2+ binding affinity measurements:
Data were acquired on a Horiba Fluoromax plus instrument equipped with temperature control and stirring capabilities. The intrinsic fluorescence of Tyr (Excitation = 277 nm, emission = 320 nm), Phe (Excitation = 250 nm, emission = 280 nm), and Ca2+ dye (Fluo F5N or F5F , excitation = 494 nm, emission = 517 nm) were monitored using single point measurements (integration time = 1.0 sec) with excitation and emission slit widths of 5.0 and 5.5 nm. Samples were 3 μM CaM, 50 mM HEPES (pH 7.40), 100 mM KCl, 5 mM NTA, 1 mM MgCl2, 50 μM EGTA. Data were recorded at 22 °C in the absence and presence of 3 μM CaN peptide. Samples were manually titrated by additions of Ca2+ from a series of four Ca2+ stocks that were prepared by 1/10 serial dilution of a master stock of 0.486 M. This minimized the volume addition (0.5, 1.0 and 2.0 μl additions from each stock) while titrating across four orders of magnitude (total Ca2+ ranged from pM to μM across 60 additions). In our buffer, we calculated dissociation constants for F5N of 85 μM and F5F of 2.3 μM. Measured signals were divided by the reference power of the lamp, and corrected for volume dilution prior to normalization. Plotting the free [Ca2+] against the normalized Tyr and Phe signals yielded sigmoidal curves which were fit to the Adair equation using Kalidograph v4 as previously described (3). A minimum of 3 replicates were collected for each sample in the absence and presence of the CaN peptide. One way ANOVA analysis with a Tukey posthoc test (P < 0.05%) were used to determine statistical significance.
Molecular Dynamic Simulations and Analysis:
MD simulations were performed following a similar protocol as previously reported (75). AMBER SB (76) force field was used for the parameterization of protein atoms. Each system was then solvated in a TIP3P (77) water box with a 12 °Å distance between protein and the water box wall. 0.15 M K+ and Cl− ions were added to simulate the ionic strength found in physiological environment. Energy minimizations were performed with a non-bonded interactions cutoff value of 10 A, and a 2 fs time-step, SHAKE constraints were applied to the bonds involving hydrogen atoms, and a restraint of 10 kcal mol−1 Å 2 imposed on the protein backbone. Each system was then heated from 0 to 300 K in two heating stages. During the first stage, system was heated from 0 to 300 K under a NVT ensemble with a restraint of 10 kcal mol−1 Å 2 imposed on the protein backbone to immobilize these atoms. In the next stage, the system was heated from 0 to 300 K with a NPT ensemble with a reduced restraint of 3 kcal mol−1 Å 2 imposed on the protein backbone to allow for slight relaxation. Following that, system was subject to a 1 ns equilibration at 300 K with a further reduced restraint of 1 kcal mol1 A2 imposed on the protein backbone. A Langevin thermostat was used during the simulation. Finally, starting from the equilibrated configuration, 1 μs production MD with no restraints was performed in triplicates.
Clustering analysis, root mean square deviation (RMSD)/root mean square fluctuation (RMSF) calculations, and hydrogen bonds were performed using CPPTRAJ (78). To estimate the binding free energy between CaM and DH, MM/GBSA calculations were performed using down sampled production MD trajectories with a salt concentration of 0.15 M and a Generalized Born method (igb =5) via MMPBSA.py (79).
Supplementary Material
Highlights.
Ca2+ signal transduction by Calmodulin (CaM) is complex.
Disease associated mutations can alter CaM function by many mechanisms.
Proper CaM function requires conserved amino acid sequence for regions both within and outside of Ca2+ binding loops and hydrophobic pockets.
Interdisciplinary investigation provides enriched understanding of Ca2+ CaM function.
Acknowledgements:
This work was supported in part by American Heart Association [20CDA35310757] and National Institutes of Health [ GM142868-01] (C.N.J.) HL138579 (J.P.D.) and funding provided by The Ohio State University College of Medicine Office of Research Dean’s Bridge Funding Program (J.P.D.).
Footnotes
Publisher's Disclaimer: This is a PDF file of an unedited manuscript that has been accepted for publication. As a service to our customers we are providing this early version of the manuscript. The manuscript will undergo copyediting, typesetting, and review of the resulting proof before it is published in its final form. Please note that during the production process errors may be discovered which could affect the content, and all legal disclaimers that apply to the journal pertain.
References
- 1.Sharma RK, Parameswaran S. Calmodulin-binding proteins: A journey of 40 years. Cell Calcium. 2018;75(August):89–100. [DOI] [PubMed] [Google Scholar]
- 2.Nyegaard M, Overgaard MT, Søndergaard MT, Vranas M, Behr ER, Hildebrandt LL, et al. Mutations in calmodulin cause ventricular tachycardia and sudden cardiac death. Am J Hum Genet [Internet], 2012. Oct 5 [cited 2014 Mar 23];91(4):703–12. [DOI] [PMC free article] [PubMed] [Google Scholar]
- 3.Crotti L, Johnson CN, Graf E, De Ferrari GM, Cuneo BF, Ovadia M, et al. Calmodulin mutations associated with recurrent cardiac arrest in infants. Circulation. 2013;127(9):1009–17. [DOI] [PMC free article] [PubMed] [Google Scholar]
- 4.Chazin WJ, Johnson CN. Calmodulin mutations associated with heart arrhythmia: A status report. Int J Mol Sci. 2020;21(4):1–12. [DOI] [PMC free article] [PubMed] [Google Scholar]
- 5.Hussey JW, Limpitikul WB, Dick IE. Calmodulin Mutations in Human Disease. Channels (Austin) [Internet]. 2023;17(1):2165278. [DOI] [PMC free article] [PubMed] [Google Scholar]
- 6.Kotta MC, Sala L, Ghidoni A, Badone B, Ronchi C, Parati G, et al. Calmodulinopathy: A Novel, Life-Threatening Clinical Entity Affecting the Young. Front Cardiovasc Med. 2018;5(December): 1–10. [DOI] [PMC free article] [PubMed] [Google Scholar]
- 7.Nyegaard M, Overgaard MT. The International Calmodulinopathy Registry: recording the diverse phenotypic spectrum of un-CALM hearts. Eur Heart J. 2019;40(35):2976–8. [DOI] [PMC free article] [PubMed] [Google Scholar]
- 8.Hwang HS, Nitu FR, Yang Y, Walweel K, Pereira L, Johnson CN, et al. Divergent regulation of ryanodine receptor 2 calcium release channels by arrhythmogenic human calmodulin missense mutants. Circ Res. 2014;114(7):1114—24. [DOI] [PMC free article] [PubMed] [Google Scholar]
- 9.Limpitikul WB, Dick IE, Tester DJ, Boczek NJ, Limphong P, Yang W, et al. A Precision Medicine Approach to the Rescue of Function on Malignant Calmodulinopathic Long-QT Syndrome. Circ Res. 2017;120(1):39–48. [DOI] [PMC free article] [PubMed] [Google Scholar]
- 10.Marsman RF, Barc J, Beekman L, Alders M, Dooijes D, van den Wijngaard A, et al. A Mutation in CALM1 Encoding Calmodulin in Familial Idiopathic Ventricular Fibrillation in Childhood and Adolescence. J Am Coll Cardiol [Internet]. 2014. Jan [cited 2015 Sep 23];63(3):259–66. [DOI] [PubMed] [Google Scholar]
- 11.Nyegaard M, Overgaard MT, Sondergaard MT, Vranas M, Behr ER, Hildebrandt LL, et al. Mutations in calmodulin cause ventricular tachycardia and sudden cardiac death. Am J Hum Genet. 2012;91(4):703–12. [DOI] [PMC free article] [PubMed] [Google Scholar]
- 12.Berchtold MW, Munk M, Kulej K, Porth I, Lorentzen L, Panina S, et al. The heart arrhythmia-linked D130G calmodulin mutation causes premature inhibitory autophosphorylation of CaMKII. Biochim Biophys Acta - Mol Cell Res. 2021;1868(12):119119. [DOI] [PubMed] [Google Scholar]
- 13.Berchtold MW, Zacharias T, Kulej K, Wang K, Torggler R, Jespersen T, et al. The arrhythmogenic calmodulin mutation D129G dysregulates cell growth, calmodulin-dependent kinase II activity, and cardiac function in zebrafish. J Biol Chem. 2016;291(52):26636–46. [DOI] [PMC free article] [PubMed] [Google Scholar]
- 14.Zhang M, Tanaka T, Ikura M. Calcium-induced conformational transition revealed by the solution structure of apo calmoudlin. Nature Structure & Mol. Bio 1995; 2, 758–767. [DOI] [PubMed] [Google Scholar]
- 15.Babu YS, Bugg CE, Cook WJ. Structure of calmodulin refined at 2.2 Å resolution. J Mol Biol. 1988;204(1): 191–204. [DOI] [PubMed] [Google Scholar]
- 16.Johnson CN, Potet F, Thompson MK, Kroncke BM, Glazer AM, Voehler MW, et al. A Mechanism of Calmodulin Modulation of the Human Cardiac Sodium Channel. Structure [Internet], 2018;26(5):683–694.e3. [DOI] [PMC free article] [PubMed] [Google Scholar]
- 17.Gong D, Chi X, Wei J, Zhou G, Huang G, Zhang L, et al. Modulation of cardiac ryanodine receptor 2 by calmodulin. Nature. 2019; 572 (7769) 347–351. [DOI] [PubMed] [Google Scholar]
- 18.Kursula P The many structural faces of calmodulin: a multitasking molecular jackknife. Amino Acids. 2014. Oct;46(10):2295–304. [DOI] [PubMed] [Google Scholar]
- 19.Villalobo A, González-Muñoz M, Berchtold MW. Proteins with calmodulin-like domains: structures and functional roles. Cell Mol Life Sci [Internet]. 2019;76(12):2299–328. [DOI] [PMC free article] [PubMed] [Google Scholar]
- 20.Blumenthal DK, Stull JT. Activation of Skeletal Muscle Myosin Light Chain Kinase by Calcium(2+) and Calmodulin. Biochemistry. 1980;19(24):5608–14. [DOI] [PubMed] [Google Scholar]
- 21.Peterson BZ, Demaria CD, Adelman JP, Yue DT. Erratum: Calmodulin is the Ca2+ sensor for Ca2+-dependent inactivation of L-type calcium channels (Neuron (March 1999)). Neuron. 1999;22(4):844. [DOI] [PubMed] [Google Scholar]
- 22.Payne ME, Fong YL, Ono T, Colbran RJ, Kemp BE, Soderling TR, et al. Calcium/calmodulin-dependent protein kinase II. Characterization of distinct calmodulin binding and inhibitory domains. J Biol Chem. 1988;263(15):7190–5. [PubMed] [Google Scholar]
- 23.Stewart AA, Ingebritsen TS, Manalan A, Klee CB, Cohen P. Discovery of A Ca2+-and calmodulin-dependent protein phosphatase. FEBS Lett. 1982;137(1):80–4. [DOI] [PubMed] [Google Scholar]
- 24.Crouchl TH, Klee CB. Positive Cooperative Binding of Calcium to Bovine Brain Calmodulin. Biochemistry. 1980;19(16):3692–8. [DOI] [PubMed] [Google Scholar]
- 25.Valeyev NV, Bates DG, Heslop-Harrison P, Postlethwaite I, Kotov NV. Elucidating the mechanisms of cooperative calcium-calmodulin interactions: A structural systems biology approach. BMC Syst Biol. 2008;2:1–17. [DOI] [PMC free article] [PubMed] [Google Scholar]
- 26.Sun B, Fang X, Johnson CN, Hauck G, Kou Y, Davis JP, et al. Non-Canonical Interaction between Calmodulin and Calcineurin Contributes to the Differential Regulation of Plant-Derived Calmodulins on Calcineurin. J Chem Inf Model. 2021;61(10):5223–33. [DOI] [PMC free article] [PubMed] [Google Scholar]
- 27.Nomikos M, Thanassoulas A, Beck K, Vassilakopoulou V, Hu H, Calver BL, et al. Altered RyR2 regulation by the calmodulin F90L mutation associated with idiopathic ventricular fibrillation and early sudden cardiac death. FEBS Lett [Internet], 2014;588(17):2898–902. [DOI] [PubMed] [Google Scholar]
- 28.Vassilakopoulou V, Calver BL, Thanassoulas A, Beck K, Hu H, Buntwal L, et al. Distinctive malfunctions of calmodulin mutations associated with heart RyR2-mediated arrhythmic disease. Biochim Biophys Acta - Gen Subj [Internet]. 2015;1850(11):2168–76. [DOI] [PubMed] [Google Scholar]
- 29.Limpitikul WB, Dick IE, Joshi-Mukherjee R, Overgaard MT, George AL, Yue DT. Calmodulin mutations associated with long QT syndrome prevent inactivation of cardiac L-type Ca2+ currents and promote proarrhythmic behavior in ventricular myocytes. J Mol Cell Cardiol [Internet]. 2014;74:115–24. [DOI] [PMC free article] [PubMed] [Google Scholar]
- 30.Jia W, Liu J, Yu Z, Zhang X, Xu X, Wang Y, et al. Properties of Calmodulin Binding to NaV1.2 IQ Motif and Its Autism-Associated Mutation R1902C. Neurochem Res. 2021;46(3):523–34. [DOI] [PubMed] [Google Scholar]
- 31.Mahling R, Hovey L, Isbell HM, Marx DC, Miller MS, Kilpatrick AM, et al. Nav1.2 EFL domain allosterically enhances Ca2+ binding to sites I and II of WT and pathogenic calmodulin mutants bound to the channel CTD. Structure. 2021. Dec;29(12):1339–1356.e7. [DOI] [PMC free article] [PubMed] [Google Scholar]
- 32.Shukla D, Peck A, Pande VS. Conformational heterogeneity of the calmodulin binding interface. Nat Commun [Internet]. 2016;7:10910. [DOI] [PMC free article] [PubMed] [Google Scholar]
- 33.Strynadka NCJ, James MNG. Crystal Structures of the helix-loop-helix calcium-binding proteins. Annu Rev Biochem. 1989;58:1880–97. [DOI] [PubMed] [Google Scholar]
- 34.Lim HW, New L, Han J, Molkentin JD. Calcineurin enhances MAPK phosphatase-1 expression and p38 MAPK inactivation in cardiac myocytes. J Biol Chem. 2001May;276(19):15913–9. [DOI] [PubMed] [Google Scholar]
- 35.Liu Q, Wilkins BJ, Lee YJ, Ichijo H, Molkentin JD. Direct interaction and reciprocal regulation between ASK1 and calcineurin-NFAT control cardiomyocyte death and growth. Mol Cell Biol. 2006. May;26(10):3785–97. [DOI] [PMC free article] [PubMed] [Google Scholar]
- 36.Bandyopadhyay A, Shin DW, Ahn JO, Kim DH. Calcineurin regulates ryanodine receptor / Ca 2 + -release channels in rat heart. Biochem J. 2000;70:61–70. [PMC free article] [PubMed] [Google Scholar]
- 37.Saito S, Hiroi Y, Zou Y, Aikawa R, Toko H, Shibasaki F, et al. NLAdrenergic Pathway Induces Apoptosis through Calcineurin Activation in Cardiac Myocytes *. J Biol Chem. 2000;275(44):34528–33. [DOI] [PubMed] [Google Scholar]
- 38.Hisamitsu T, Nakamura TY, Wakabayashi S. Na+/H+ Exchanger 1 Directly Binds to Calcineurin A and Activates Downstream NFAT Signaling , Leading to Cardiomyocyte Hypertrophy. Am Soc Microbiol. 2012;32(16):3265–80. [DOI] [PMC free article] [PubMed] [Google Scholar]
- 39.Kissinger CR, Parge HE, Knighton DR, Lewis CT, Pelletier LA, Tempczyk A, et al. Crystal structures of human calcineurin and the human FKBP12–FK506–calcineurin complex. Nature. 1995;378(6557):641–4. [DOI] [PubMed] [Google Scholar]
- 40.Griffith JP, Kim JL, Kim EE, Sintchak MD, Thomson JA, Fitzgibbon MJ, et al. X-Ray Structure of Calcineurin Inhibited by the Immunophilin-lmmunosuppressant FKBP12-FK506 Complex. Cell. 1995;82:507–22. [DOI] [PubMed] [Google Scholar]
- 41.Yadav DK, Tata SR, Hunt J, Cook EC, Creamer TP, Fitzkee NC. (1)H, (15)N, and (13)C chemical shift assignments of the regulatory domain of human calcineurin. Biomol NMR Assign. 2017/08/12. 2017. Oct;11(2):215–9. [DOI] [PMC free article] [PubMed] [Google Scholar]
- 42.Dunlap TB, Cook EC, Rumi-Masante J, Arvin HG, Lester TE, Creamer TP. The distal helix in the regulatory domain of calcineurin is important for domain stability and enzyme function. Biochemistry. 2013;52(48):8643–51. [DOI] [PubMed] [Google Scholar]
- 43.Dunlap TB, Guo HF, Cook EC, Holbrook E, Rumi-Masante J, Lester TE, et al. Stoichiometry of the Calcineurin Regulatory Domain-Calmodulin Complex. Biochemistry. 2014;53(36):5779–90. [DOI] [PubMed] [Google Scholar]
- 44.Shalev A, Greenberg AH, Mcalpine PJ. Detection of attograms of antigen by a high-sensitivity enzyme-linked immunoabsorbent assay (HS-ELISA) using a fluorogenic substrate. J Immunol Methods. 1980;38:168–70. [DOI] [PubMed] [Google Scholar]
- 45.Hubbard MJ, Klee CB. Calmodulin binding by calcineurin. J Biol Chem. 1987;262(31):15062–70. [PubMed] [Google Scholar]
- 46.Stemmer PM, Klee CB. Dual Calcium Ion Regulation of Calcineurin by Calmodulin and Calcineurin B. Biochemistry. 1994;33(22):6859–66. [DOI] [PubMed] [Google Scholar]
- 47.Kretsinger RH, Nockolds CE. Carp muscle calcium-binding protein. II. Structure determination and general description. J Biol Chem. 1973;248:3313–26. [PubMed] [Google Scholar]
- 48.Starovasnik MA, Klevit RE, Su D, Beckingham K, Klevit RE. A series of point mutations reveal interactions between the calcium-binding sites of calmodulin. Protein Sci. 1992; 1(2):245–53. [DOI] [PMC free article] [PubMed] [Google Scholar]
- 49.Cho MJ, Vaghy PL, Kondo R, Lee SH, Davis JP, Rehl R, et al. Reciprocal regulation of mammalian nitric oxide synthase and calcineurin by plant calmodulin isoforms. Biochemistry. 1998;37(45):15593–7. [DOI] [PubMed] [Google Scholar]
- 50.Chyan CL, Irene D, Lin SM. The recognition of calmodulin to the target sequence of calcineurin—a novel binding mode. Molecules. 2017;22(10). [DOI] [PMC free article] [PubMed] [Google Scholar]
- 51.Kelly SM, Jess TJ, Price NC. How to study proteins by circular dichroism. Biochim Biophys Acta - Proteins Proteomics. 2005;1751(2):119–39. [DOI] [PubMed] [Google Scholar]
- 52.Kelly S, Price N. The Use of Circular Dichroism in the Investigation of Protein Structure and Function. Curr Protein Pept Sci. 2005;1(4):349–84. [DOI] [PubMed] [Google Scholar]
- 53.Sorensen BR, Shea MA. Interactions between Domains of Apo Calmodulin Alter Calcium Binding and. 1998;2960(97):4244–53. [DOI] [PubMed] [Google Scholar]
- 54.Davis JP, Tikunova SB, Walsh MP, Johnson JD. Characterizing the response of calcium signal transducers to generated calcium transients. Biochemistry. 1999;38(13):4235–44. [DOI] [PubMed] [Google Scholar]
- 55.MARTIN SR, ANDERSSON TELEMAN A, BAYLEY PM, DRAKENBERG T, FORSEN S. Kinetics of calcium dissociation from calmodulin and its tryptic fragments: A stopped-flow fluorescence study using Quin 2 reveals a two-domain structure. Eur J Biochem. 1985;151(3):543–50. [DOI] [PubMed] [Google Scholar]
- 56.Manceva S, Lin T, Pham H, Lewis JH, Goldman YE, Ostap EM. Calcium regulation of calmodulin binding to and dissociation from the Myo1c regulatory domain. Biochemistry. 2007;46(42):11718–26. [DOI] [PMC free article] [PubMed] [Google Scholar]
- 57.Johnson CN, Pattanayek R, Potet F, Rebbeck RT, Blackwell DJ, Nikolaienko R, et al. The CaMKII inhibitor KN93-calmodulin interaction and implications for calmodulin tuning of NaV1.5 and RyR2 function. Cell Calcium. 2019;82(July):102063. [DOI] [PMC free article] [PubMed] [Google Scholar]
- 58.Sun B, Vaughan D, Tikunova S, Creamer TP, Davis JP, Kekenes-Huskey PM. Calmodulin-Calcineurin Interaction beyond the Calmodulin-Binding Region Contributes to Calcineurin Activation. Biochemistry. 2019;58(39):4070–85. [DOI] [PMC free article] [PubMed] [Google Scholar]
- 59.Black DJ, Tran QK, Keightley A, Chinawalkar A, McMullin C, Persechini A. Evaluating Calmodulin-Protein Interactions by Rapid Photoactivated Cross-Linking in Live Cells Metabolically Labeled with Photo-Methionine. J Proteome Res. 2019;18(10):3780–91. [DOI] [PubMed] [Google Scholar]
- 60.Wu X, Bers DM. Free and Bound Intracellular Calmodulin Measurements in Cardiac Myocytes. Cell Calcium. 2007;41(4):353–64. [DOI] [PMC free article] [PubMed] [Google Scholar]
- 61.Meador WE, Means AR, Quiocho FA. Target enzyme recognition by calmodulin: 2.4 Å structure of a calmodulin-peptide complex. Science (80- ). 1992;257(5074):1251–5. [DOI] [PubMed] [Google Scholar]
- 62.Van Lierop JE, Wilson DP, Davis JP, Tikunova S, Sutherland C, Walsh MP, et al. Activation of smooth muscle myosin light chain kinase by calmodulin. Role of LYS30 and GLY40. J Biol Chem. 2002;277(8):6550–8. [DOI] [PubMed] [Google Scholar]
- 63.Molkentin JD, Lu J, Antos CL, Markham B, Richardson J, Robbins J, et al. A Calcineurin-Dependent Transcriptional Pathway for Cardiac Hypertrophy. Cell. 1998;93:215–28. [DOI] [PMC free article] [PubMed] [Google Scholar]
- 64.De Windt LJ, Lim HW, Bueno OF, Liang Q, Delling U, Braz JC, et al. Targeted inhibition of calcineurin attenuates cardiac hypertrophy in vivo. Proc Natl Acad Sci U S A. 2001. Mar;98(6):3322–7. [DOI] [PMC free article] [PubMed] [Google Scholar]
- 65.Yatani A, Honda R, Tymitz KM, Lalli MJ, Molkentin JD. Enhanced Ca2+ channel currents in cardiac hypertrophy induced by activation of calcineurin-dependent pathway. J Mol Cell Cardiol. 2001. Feb;33(2):249–59. [DOI] [PubMed] [Google Scholar]
- 66.Wilkins BJ, De Windt LJ, Bueno OF, Braz JC, Glascock BJ, Kimball TF, et al. Targeted disruption of NFATc3, but not NFATc4, reveals an intrinsic defect in calcineurin-mediated cardiac hypertrophic growth. Mol Cell Biol. 2002. Nov;22(21):7603–13. [DOI] [PMC free article] [PubMed] [Google Scholar]
- 67.Liang Q, Bueno OF, Wilkins BJ, Kuan C-Y, Xia Y, Molkentin JD. c-Jun N-terminal kinases (JNK) antagonize cardiac growth through cross-talk with calcineurin-NFAT signaling. EMBO J. 2003. Oct;22(19):5079–89. [DOI] [PMC free article] [PubMed] [Google Scholar]
- 68.Taigen T, De Windt LJ, Lim HW, Molkentin JD. Targeted inhibition of calcineurin prevents agonist-induced cardiomyocyte hypertrophy. Proc Natl Acad Sci U S A. 2000. Feb;97(3): 1196–201. [DOI] [PMC free article] [PubMed] [Google Scholar]
- 69.Schuhmann K, Romanin C, Baumgartner W, Groschner K. Intracellular Ca 2 + Inhibits Smooth Muscle L-Type Ca 2 + Channels by Activation of Protein Phosphatase Type 2B and by Direct Interaction with the Channel. J Gen Physiol. 1997;110(November). [DOI] [PMC free article] [PubMed] [Google Scholar]
- 70.Wang Y, Tandan S, Hill JA. Calcineurin-dependent ion channel regulation in heart. Trends Cardiovasc Med. 2014;24(1):14–22. [DOI] [PMC free article] [PubMed] [Google Scholar]
- 71.Johnson CN, Potet F, Thompson MK, Kroncke BM, Glazer AM, Voehler MW, et al. A Mechanism of Calmodulin Modulation of the Human Cardiac Sodium Channel. Structure [Internet]. 2018;26(5):683–694.e3. [DOI] [PMC free article] [PubMed] [Google Scholar]
- 72.Srikanth S, Gwack Y. Calcium-Binding Proteins and RAGE. Measurement of Intracellular Ca 2+ Concentration in Single Cells Using Ratiometric Calcium Dyes [Internet]. Vol. 963, Calcium-Binding Proteins and RAGE: From Structural Basics to Clinical Applications, Methods in Molecular Biology, vol. 963. 2013. 3–14 p. [DOI] [PubMed] [Google Scholar]
- 73.Lee W, Rahimi M, Lee Y, Chiu A. POKY: a software suite for multidimensional NMR and 3D structure calculation of biomolecules. Bioinformatics. 2021;37(18):3041–2. [DOI] [PMC free article] [PubMed] [Google Scholar]
- 74.Williamson MP. Using chemical shift perturbation to characterise ligand binding. Prog Nucl Magn Reson Spectrosc [Internet]. 2013. Aug [cited 2015 May 30];73:1–16. [DOI] [PubMed] [Google Scholar]
- 75.Sun B, Vaughan D, Tikunova S, Creamer TP, Davis JP, Kekenes-Huskey PM. Calmodulin–Calcineurin Interaction beyond the Calmodulin-Binding Region Contributes to Calcineurin Activation. Biochemistry. 2019;58(39):4070–85. [DOI] [PMC free article] [PubMed] [Google Scholar]
- 76.Maier JA, Martinez C, Kasavajhala K, Wickstrom L, Hauser KE, Simmerling C. ff14SB: Improving the Accuracy of Protein Side Chain and Backbone Parameters from ff99SB. J Chem Theory Comput. 2015;11(8):3696–713. [DOI] [PMC free article] [PubMed] [Google Scholar]
- 77.Jorgensen WL, Chandrasekhar J, Madura JD, Impey RW, Klein ML. Comparison of simple potential functions for simulating liquid water. J Chem Phys. 1983;79(2):926–35. [Google Scholar]
- 78.Roe DR, Cheatham TE. PTRAJ and CPPTRAJ: Software for processing and analysis of molecular dynamics trajectory data. J Chem Theory Comput. 2013;9(7):3084–95. [DOI] [PubMed] [Google Scholar]
- 79.Miller BR, Mcgee TD, Swails JM, Homeyer N, Gohlke H, Roitberg AE. MMPBSA . py : An Efficient Program for End-State Free Energy Calculations. 2012 [DOI] [PubMed] [Google Scholar]
Associated Data
This section collects any data citations, data availability statements, or supplementary materials included in this article.