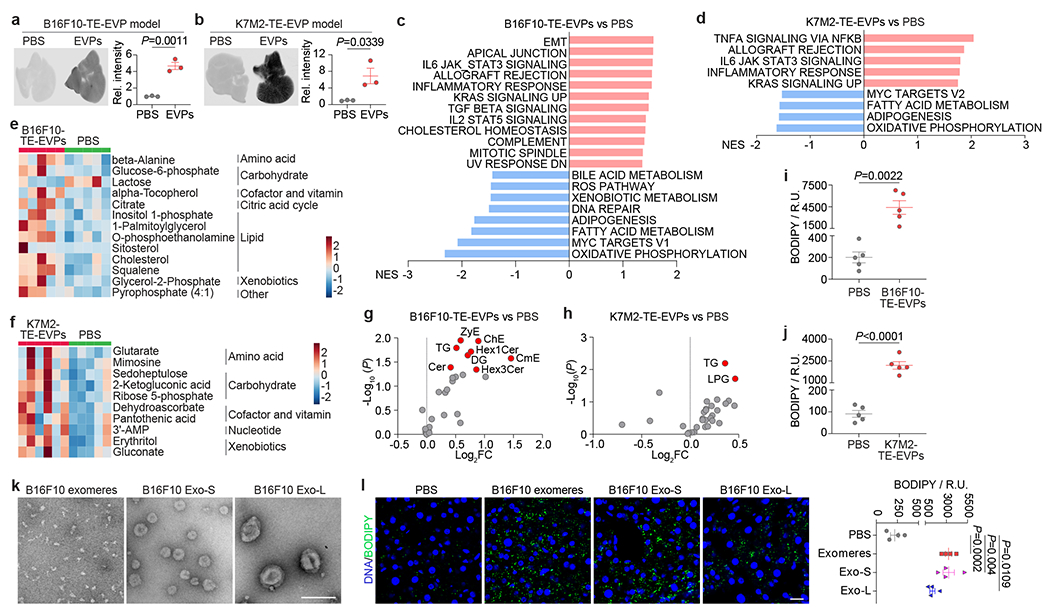
Figure 2. Tumor-derived EVPs induce liver metabolic dysfunction.

a,b, Representative LI-COR Odyssey images (left) and associated quantification of relative signal intensity (right) of the livers from mice 24 h post intravenously injection of 10 μg of CellVue NIR815-labeled B16F10-TE-EVPs (a) and K7M2-TE-EVPs (b), and PBS controls. n=3 each. c,d, GSEA of gene expression profiles, which were ranked based on the sign of log2FC*(−log10P value), in livers from mice educated for 4 weeks with B16F10-TE-EVPs (n=5) (c), or K7M2-TE-EVPs (n=3) (d), compared with PBS-educated controls, using hallmark gene sets, and the significantly changed signaling pathways with FDR<0.05 are shown. Gene lists for signaling pathways are shown in Supplementary Tables 12 and 13. e,f, Heatmaps showing the metabolites significantly changed in the livers from B16F10-TE-EVP- (e) and K7M2-TE-EVP- (f) educated mice, compared to PBS-educated controls. n=5 B16F10-TE-EVP-educated mice and controls; n=6 K7M2-TE-EVP-educated mice, and n=5 controls. g,h, Volcano plots showing the significantly enriched lipid classes (labeled in red, P<0.05) in the livers from B16F10-TE-EVP- (g) and K7M2-TE-EVP- (h) educated mice, compared to PBS-educated controls. n=7 B16F10-TE-EVP-educated mice, and n=5 controls; n=5 K7M2-TE-EVP-educated mice and controls. i,j, Quantification of BODIPY staining of the livers from B16F10-TE-EVP- (i) and K7M2-TE-EVP- (j) educated mice, and PBS-educated controls. n=5 each. k, Representative TEM images of B16F10 exomeres, Exo-S and Exo-L. This experiment was repeated three times independently with similar results. l, Representative images (left) and associated quantification (right) of BODIPY staining of the livers from mice educated with PBS, B16F10 exomeres, B16F10 Exo-S, or B16F10 Exo-L for 4 weeks. n=4 each. Scale bar, 200 nm for (k) and 20 μm for (l). P values were determined by the two-tailed, unpaired Student’s t-test (a,b,g-j,l). Data are mean ± s.e.m. EMT, epithelial mesenchymal transition. ROS, reactive oxygene species.
