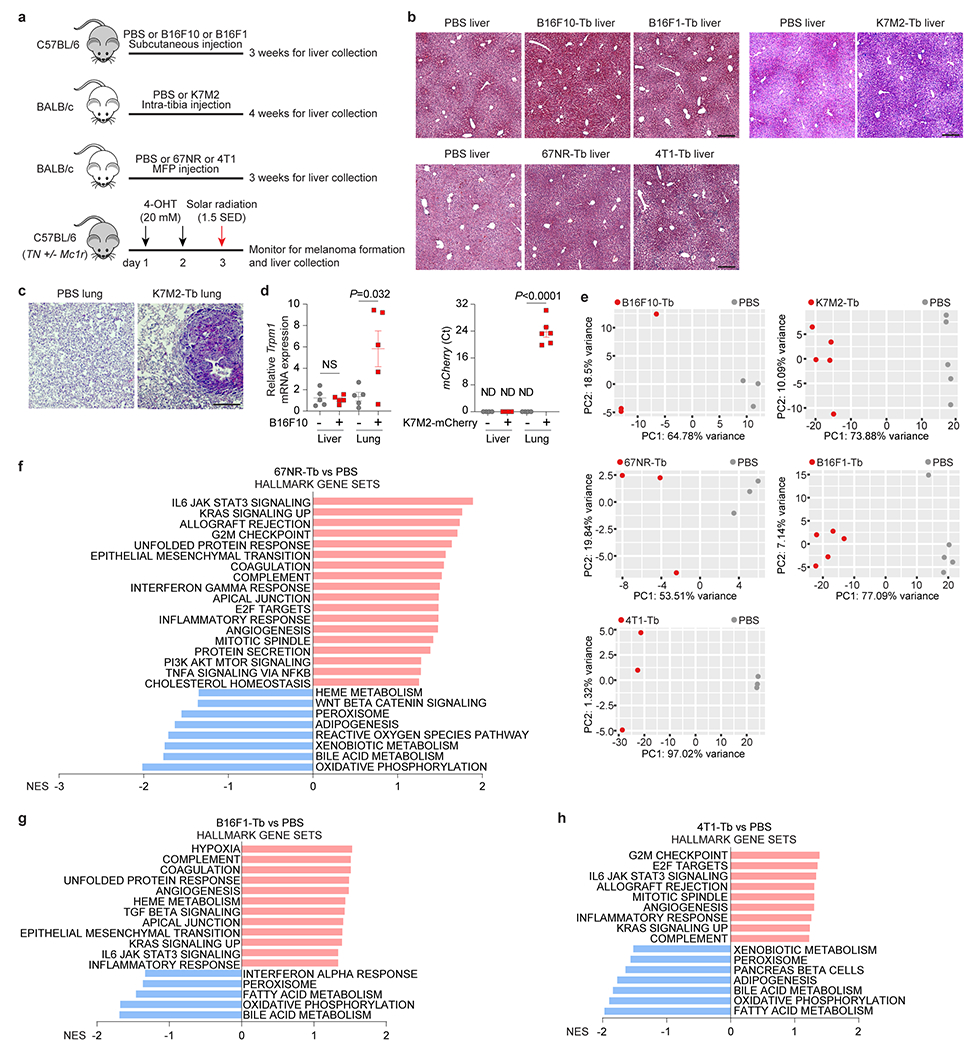
Extended Data Figure 1. Primary tumors dysregulate the metabolism of metastasis-free livers.

a, Schematic representation of murine tumor models utilized in this study. B16F10, K7M2, 67NR, B16F1 and 4T1 cells, were orthotopically injected into syngeneic mice. Age and sex-matching mice injected with PBS were used as controls of these experimental murine models. C57BL/6 TN mice carrying a Cre-inducible NrasQ61R oncogene were employed for generating spontaneous melanoma. Non-tumor bearing control mice carried the NrasQ61R, p16fl/fl and Tyr-CRE-ER(T2) alleles but were not treated to induce CRE activity or tumor formation. Functionally null Mc1r increased melanoma susceptibility. b, Representative H&E staining images of the livers from B16F10-Tb and B16F1-Tb mice (top, left), K7M2-Tb mice (top, right), 67NR-Tb and 4T1-Tb mice (bottom), and their respective controls. This experiment was repeated three times independently with similar results. c, Representative H&E staining images of lung metastases in the PBS control mice and K7M2-Tb mice. This experiment was repeated three times independently with similar results. d, qRT-PCR analysis of Trpm1 and mCherry expression in livers and lungs of mice implanted with B16F10 and mCherry-expressing K7M2 cells, respectively, compared to their controls. n=5 per group for B16F10-Tb model, n=4 control and n=6 K7M2-mCherry-Tb mice. NS, not significant; ND, not detected. e, Principal component analysis (PCA) of gene expression in the livers from mice implanted with B16F10, or K7M2, or 67NR, or B16F1, or 4T1 tumor cells, compared to their respective PBS-injected controls. Results showed that the gene expression profiles of livers from tumor-bearing mice independently segregated from their respective controls. n=3 mice per group for B16F10-Tb, 67NR-Tb and 4T1-Tb models; n=5 mice per group for K7M2-Tb and B16F1-Tb models. f-h, GSEA of the gene expression profiles, which were ranked based on the sign of log2FC*(−log10P value), in the livers from 67NR-Tb mice (f), B16F1-Tb mice (g), or 4T1-Tb mice (h), compared to their respective PBS-injected controls, using hallmark gene sets, and the significantly changed signaling pathways with FDR<0.2 are shown. n=3 mice per group for 67NR-Tb and 4T1-Tb models; n=5 mice per group for B16F1-Tb model. Gene lists for signaling pathways are shown in Supplementary Tables 19–21. Scale bars for (b,c), 200 μm. P values were determined by two-tailed, unpaired Student’s t-test (d).
