


Abstract
The specificity of nucleases for nicked and un-nicked double-stranded DNA has been characterized using atomic force microscopy (AFM). We have found that AFM has advantages over the usual macroscopic analyses, such as sucrose gradient centrifugation or electrophoresis, in characterizing nuclease digestion. In particular, short DNA fragments resulting from non-specific digestion were detected and, thus, the true length distribution of digested DNA was revealed. A simple numerical method is proposed to estimate the number of nicked sites per DNA molecule based on AFM images.
INTRODUCTION
Atomic force microscopy (AFM) imaging is typically carried out not in a vacuum but in air and in aqueous solution without staining, shadowing or labeling and, therefore, is particularly attractive for studying biological samples (see for example 1–5). One unique advantage of microscopical techniques such as AFM is the ability to directly observe individual molecules (6). In contrast to AFM, electrophoresis or chromatography provides averaged information over a population of a sample. For example, electrophoresis of a solution containing DNA of varied length will give smeared bands losing information on the DNA fragments of quite short length.
It is well known that S1 nuclease digests single-stranded but not double-stranded DNA (7,8). However, when a high concentration of S1 is employed, double-stranded DNA is also cut by the nuclease at sites opposite nicks (9–12). In contrast, mung bean nuclease does not have the ability to cleave double-stranded DNA at nicked sites (13,14). These properties were established by sucrose gradient centrifugation and electrophoresis experiments.
We have examined double-stranded linear DNA treated with either S1 or mung bean nuclease by AFM. In the case of circular DNA, nicked and supercoiled DNA are easily distinguished by both electrophoresis and microscopy, although nicked and relaxed closed circular forms cannot be discriminated. However, in the case of linear DNA, nicked and un-nicked forms give similar results with both methods. By comparing the intensity of DNA bands in gel electrophoresis before and after S1 treatment, one can estimate the amount of un-nicked DNA in the sample. However, detailed length information on S1-treated nicked DNA cannot be obtained from the smeared bands on the gel. We have shown that AFM provides this information, as the technique is particularly powerful in observing individual DNA molecules including minor components resulting from non-specific reactions.
MATERIALS AND METHODS
S1 and mung bean nucleases and ScaI endonuclease were purchased from Takara Shuzo Co. (Tokyo, Japan). Nicked and un-nicked linear DNA were prepared as follows. Using non-fresh pBR322 DNA (4361 bp) containing a fair amount of nicked closed circular form, supercoiled and nicked/relaxed DNA were separated by low melting point agarose gel electrophoresis and isolated by excising the corresponding bands from the gel. Supercoiled and nicked/relaxed DNA samples were treated separately during the course of experiments and compared. Linear DNA was obtained by low melting point gel electrophoresis following ScaI digestion.
For digestion with S1 nuclease, 0.6, 1.8, 3.6, 18 or 36 U were added to 0.15 µg of nicked or un-nicked DNA in a standard buffer solution (30 mM sodium acetate, 15 mM NaCl, 1 mM ZnSO4, pH 4.6), incubated at 37°C for 30 min and the enzyme inactivated and removed by phenol extraction. Similarly for mung bean nuclease, 2 or 20 U were added to 0.15 µg of DNA and incubated in a standard buffer solution [30 mM CH3COONa, 100 mM NaCl, 1 mM (CH3COO)2Zn, 5% glycerol, pH 5.0] at 37°C for 30 min.
A 900 bp fragment of pBR322 (nt 121–1020) was prepared by PCR with CACCGTCACCCTGGATGCTG and GAAGCGAGAAGAATCATAAT as primers. The solution was irradiated using a UV lamp (254 nm, 4 W) for 5 h after removing the polymerase by phenol extraction. Irradiated and non-irradiated DNA were electrophoresed in low melting point agarose and the 900 bp band was excised and recovered.
DNA samples were characterized by 0.8% agarose gel electrophoresis as well as AFM imaging. Freshly cleaved mica substrate was pretreated with 3-aminopropyltriethoxysilane (APS, AP-mica) for 30 min and rinsed with water and ethanol. DNA solution (10 µl) was dropped onto the AP-mica, which after standing for several minutes was washed with water. The sample was dried under a stream of nitrogen. Observations were performed on a NanoScope IIIa (Digital Instruments, Santa Barbara, CA) in the tapping mode in air, using standard TESP cantilevers. Fields of 1–3 µm were scanned at <2 Hz. Images were flattened to account for Z offsets and sample tilt and exported as TIF files. The lengths of the DNA molecules were measured using Image SXM v.1.60 software.
RESULTS AND DISCUSSION
Digestion of supercoiled or relaxed closed circular pBR322 DNA at a single ScaI site is expected to produce linear DNA containing no nicked sites. In contrast, linear DNA obtained from nicked pBR322 DNA will contain one or more nicks.
Figure 1a and b shows AFM images of supercoiled and nicked/relaxed circular pBR322 DNA, respectively, prior to ScaI digestion. The supercoiled DNA contained a negligible amount of nicked DNA (Fig. 1a). AFM images of linear DNA prepared from the supercoiled (a) and nicked/relaxed (b) pBR322 DNA by ScaI digestion are shown in Figure 1c and d, respectively. They closely resemble each other. All the subsequent experiments were carried out using the two linear DNAs.
Figure 1.
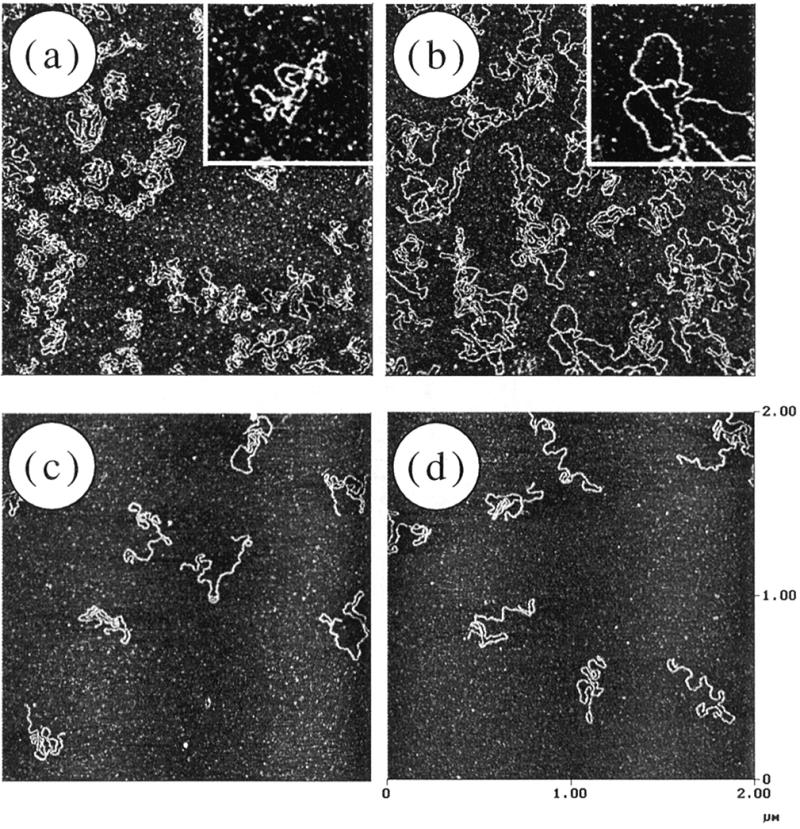
AFM images of pBR322 DNA purified by gel electrophoresis in low melting point agarose. (a and b) Supercoiled and nicked/relaxed circular forms, respectively. (c and d) Linear DNAs prepared by ScaI digestion from DNA in (a) and (b), respectively. Magnified images of individual DNA molecules are presented as insets in (a) and (b).
The intact and nicked linear DNAs were treated separately with S1 nuclease and characterized by gel electrophoresis for macroscopic monitoring (Fig. 2). In the case of un-nicked DNA, there was no clear decrease in intensity of the bands from lane 2 to 6 with increasing amount of S1 nuclease. Only in lane 7, where 36 U of S1 nuclease were added, did the intensity of the linear band clearly decrease, as previously reported (15). However, using nicked DNA as substrate, the linear DNA band was progressively degraded depending on the S1 nuclease concentration (from lane 9 to 14). The remarkable difference in digestion between lanes 6 and 13 clearly demonstrates the activity of S1 nuclease specific to nicked DNA.
Figure 2.
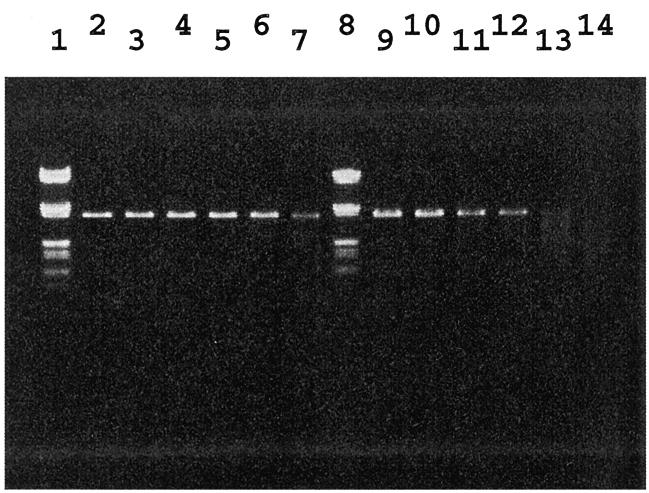
Agarose gel electrophoresis of linear DNA digested with S1 nuclease. Lanes 1 and 8, molecular weight marker (λ DNA digested with EcoRI and HindIII); lanes 2–7, linear DNA prepared from supercoiled pBR322; lanes 9–14, linear DNA prepared from nicked pBR322. S1 nuclease was added at 0, 0.6, 1.8, 3.6, 18 and 36 U in lanes 2–7 and 9–14, respectively.
AFM images of S1-treated DNA and histograms of length distribution obtained from the images are shown in Figure 3. In the case of nicked DNA samples, many digested DNA fragments were observed even at the lowest S1 concentration of 0.6 U (Fig. 3e) as compared with the control sample (see Fig. 1d). DNA samples in Figures 1d and 3e are identical to those used in lanes 9 and 10 in gel electrophoresis, respectively (Fig. 2). While the difference between lanes 9 and 10 is marginal on the electrophoresis gel, it is substantial in the AFM images. In Figure 3g and h various lengths of DNAs were individually observed while smeared patterns were observed in lanes 13 and 14 in electrophoresis.
Figure 3.

AFM images and the corresponding length distributions of S1-treated un-nicked (Ia–Id) and nicked (IIe–IIh) DNA. S1 nuclease was added at 0.6, 1.8, 18 and 36 U in (a)–(d) and (e)–(h), respectively. The arrows in (c) indicate the digested DNA. The number of DNA molecules was plotted against the measured DNA length (left, short; right, full-length, 1.4 µm) in a histogram presentation.
In the case of un-nicked linear DNA only a few digested DNA fragments were observed in Figure 3a, although it was treated with the same amount of S1 nuclease as in Figure 3e. The difference between Figure 3a and e is consistent with selective S1 nuclease action at nicked sites on DNA. Digested DNA was found in the AFM image (Fig. 3c, see arrows) but not in Figure 3a. This is in sharp contrast to gel electrophoresis, where no difference was observed between the corresponding lanes 3 and 5, although they are the identical samples to Figure 3a and c, respectively. While AFM observes individual DNA molecules, the intensity of bands in gel electrophoresis visualized by the fluorescence of ethidium bromide intercalated between the DNA base pairs depends not only on the number of molecules, but also on DNA length. The results illustrate the advantage of the AFM method in obtaining information on minor components in DNA samples.
The experiments described so far used AP-mica as substrate. Similar experiments were carried out using bare mica. Deposition of DNA solutions containing magnesium or other ions onto bare mica is a popular method. However, because of the weak adhesion of DNA to bare mica, we found the method to be sensitive to the preparation method of AFM samples and that it tended to lose shorter DNA fragments. Thus, AP-mica is a more suitable substrate for AFM measurements of DNA length distribution in the sample. As adsorbed DNAs are likely to be less stretched on AP-mica, care has to be taken when tracing DNA lengths.
Using the numerical data obtained from the histogram analysis under each experimental condition (Fig. 3), we have tried to roughly estimate the number of digested sites per DNA molecule. For simplicity, it was assumed that nicking of DNA during sample preparation was negligible. The calculation procedure was as follows: (i) the full length of pBR322 DNA was divided by the calculated average length of digested DNA; (ii) 1 was subtracted from this number to adjust for the difference in the number of cleavage sites and that of fragments; (iii) the estimated digestion number for the un-nicked sample was subtracted from that of the nicked sample to obtain the number of S1 cleavages specific to nicked double-stranded DNA (Nn).
When 1.8 U of S1 nuclease was employed, Nn was calculated to be 0.9 from the comparison of histogram analysis of Figure 3b and f. Nn value for the experiments with 18 U was 1.4. These results suggest that the nicked circular DNA sample employed in this work has on average one or two nicked sites per molecule. If the normalized Nn value per 10 kb is defined as N0, N0 was calculated to be 2.1 and 3.2 from Figure 3b/f and c/g, respectively. When excess S1 nuclease (36 U) was employed (Fig. 3d and h), Nn was 0.4. The small number may be due to substantial non-specific cleavage which cannot be regarded as background.
This numerical analysis should not be taken rigorously, as it is based on various assumptions, such as introduction of no-nicking during the experiments apart from S1 treatment and no loss of shorter DNA fragments during removal of proteins. Even so, this kind of simple calculation can give a rough estimate of the degree of nicking of DNA samples.
Characterization of digestion with mung bean nuclease was carried out using AFM as shown in Figure 4. There was no significant difference between the nicked and un-nicked samples even when a considerable amount of mung bean nuclease (20 U) was added to 0.15 µg of DNA (Fig. 4b and d). Thus, AFM could visualize the different specificities of S1 and mung bean nuclease with respect to double-stranded DNA cleavage.
Figure 4.

Digestion of linear DNA by mung bean nuclease. The DNA sample and amount of mung bean nuclease added were as follows: (a) un-nicked, 2 U; (b) un-nicked, 20 U; (c) nicked, 2 U; (d) nicked, 20 U. The amount of DNA was 0.15 µg in all cases. The number of DNA molecules was plotted against the measured DNA length (left, short; right, full-length, 1.4 µm).
Having established the numerical method based on AFM images, we have further applied the method to nicked DNAs prepared by UV irradiation. Figure 5a and b shows the results of S1 nuclease action of unirradiated and UV-treated 900 bp linear DNA, respectively. The Nn value of UV-treated DNA was estimated to be 1.21 per 900 bp, i.e. N0 was calculated to be 13.4. The value is much higher than that obtained in Figure 3 (N0 = 2–3). These values appear reasonable and the method can be applied to characterize highly nicked DNA samples.
Figure 5.
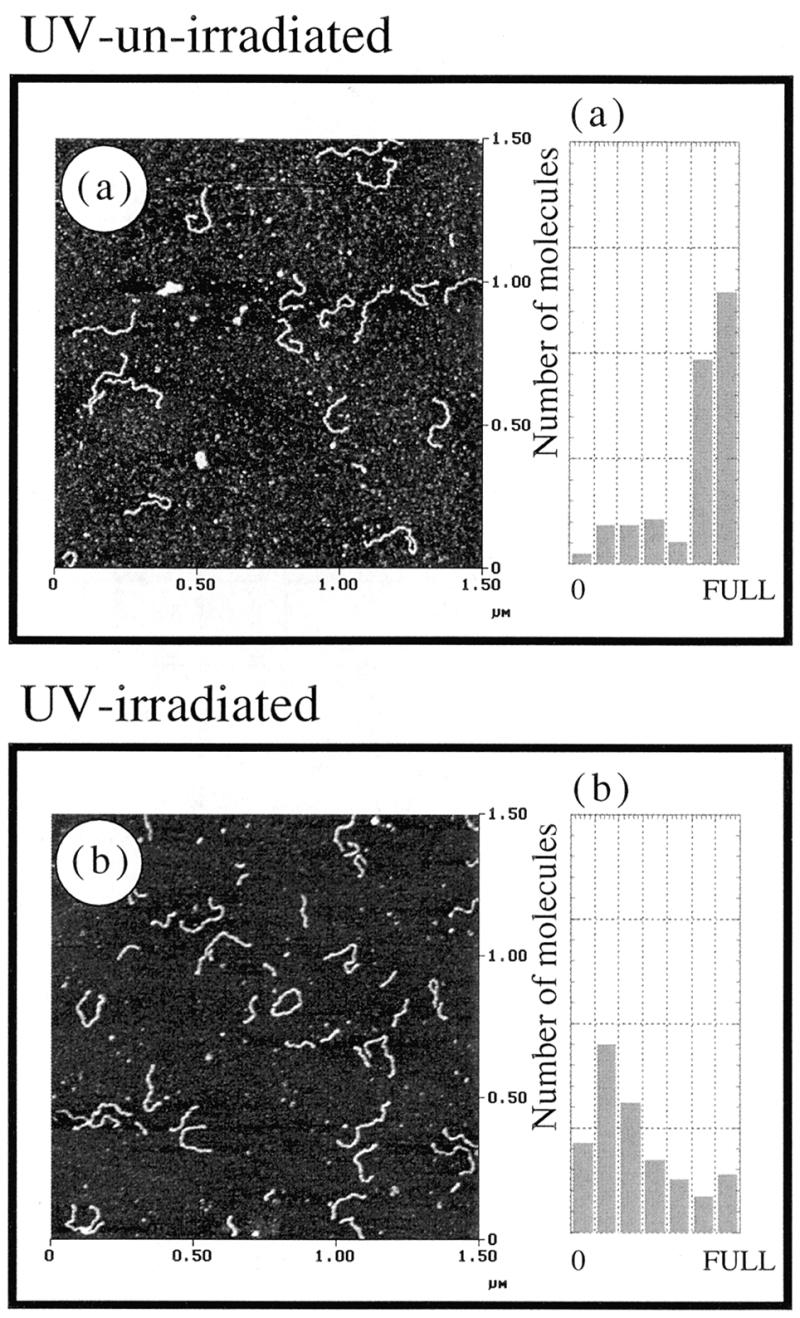
AFM images and the corresponding histograms of S1 digestion of (a) unirradiated control DNA and (b) UV-irradiated DNA. Twenty units of S1 nuclease were reacted with 0.15 µg of DNA. The number of DNA molecules was plotted against the measured DNA length (left, short; right, full-length, 0.3 µm) in the histograms.
In this paper, we have shown that AFM imaging clearly identifies shorter DNA fragments produced by S1 nuclease treatment of a nicked DNA sample. Thus, AFM imaging together with nuclease digestion is a useful method to offer information on the degree of nicking of a DNA sample.
Acknowledgments
ACKNOWLEDGEMENTS
This work was performed under the auspices of the Angstrom Technology Partnership in the Joint Research Center for Atom Technology, partly supported by the New Energy and Industrial Technology Development Organization.
REFERENCES
- 1.Arscott P.G. and Bloomfield,V.A. (1992) Methods Enzymol., 211, 491–502. [DOI] [PubMed] [Google Scholar]
- 2.Bustamante C., Keller,D. and Yang,G. (1993) Curr. Opin. Struct. Biol., 3, 363–372. [Google Scholar]
- 3.Bustamante C., Erie,D.A. and Keller,D. (1994) Curr. Opin. Struct. Biol., 4, 750–760. [Google Scholar]
- 4.Engel A., (1991) Annu. Rev. Biophys. Chem., 20, 79–108. [DOI] [PubMed] [Google Scholar]
- 5.Hansma H.G. and Hoh,J. (1994) Annu. Rev. Biophys. Biochem. Struct., 23, 115–139. [DOI] [PubMed] [Google Scholar]
- 6.Binnig G., Quate,C.F. and Gerber,C.H. (1986) Phys. Rev. Lett., 56, 930–933. [DOI] [PubMed] [Google Scholar]
- 7.Ando T. (1966) Biochim. Biophys. Acta, 114, 158–168. [DOI] [PubMed] [Google Scholar]
- 8.Vogt V.M. (1973) Eur. J. Biochem. 33, 192–200. [DOI] [PubMed] [Google Scholar]
- 9.St John T., Jhonson,J.D. and Bonner,J. (1974) Biochem. Biophys. Res. Commun., 57, 240–247. [DOI] [PubMed] [Google Scholar]
- 10.Germond J.-E., Vogt,V.M. and Hirt,B. (1974) Eur. J. Biochem., 43, 591–600. [DOI] [PubMed] [Google Scholar]
- 11.Wiegand R.C., Godson,G.N. and Radding,C.M. (1975) J. Biol. Chem., 250, 8848–8855. [PubMed] [Google Scholar]
- 12.Englund P.T., DiMaio,D.C. and Price,S.S. (1977) J. Biol. Chem., 252, 6208–6216. [PubMed] [Google Scholar]
- 13.Kedzierski W., Lasowski,M.,Sr and Mandel,M. (1973) J. Biol. Chem., 248, 1277–1280. [PubMed] [Google Scholar]
- 14.Kroeker D.W. and Kowalski,D. (1978) Biochemistry, 17, 3236–3242. [DOI] [PubMed] [Google Scholar]
- 15.Godson G.N. (1973) Biochim. Biophys. Acta, 308, 59–67. [DOI] [PubMed] [Google Scholar]