

Abstract
Background:
Current molecular breast imaging (MBI) images are limited to qualitative evaluation, not absolute measurement, of 99mTc uptake in benign and malignant breast tissues.
Purpose:
This work assesses the accuracy of previously-published and newly-proposed tumor and normal breast tissue 99mTc uptake MBI measurements using simulations of a commercial dual-headed planar MBI system under typical clinical and acquisition protocols.
Methods:
Quantification techniques were tested in over 4,000 simulated acquisitions of spherical and ellipsoid tumors with clinically relevant uptake conditions using a validated Monte Carlo application of the GE Discovery NM750b system. The evaluated techniques consisted of 4 tumor total activity methodologies (2 single-detector-based and 2 geometric-mean-based), 2 tumor MBI volume methodologies (diameter-based and ROI-based), and 2 normal tissue activity concentration methodologies (single-detector-based and geometric-mean-based). The most accurate of these techniques were then used to estimate tumor activity concentrations and tumor to normal tissue relative activity concentrations (RC).
Results:
Single-detector techniques for tumor total activity quantification achieved mean (standard deviation) relative errors of 0.2% (4.3%) and 1.6% (4.4%) when using the near and far detector images, respectively and were more accurate and precise than the measured 8.1% (5.8%) errors of a previously published geometric-mean technique. Using these activity estimates and the true tumor volumes resulted in tumor activity concentration and RC errors within 10% of simulated values. The precision of tumor activity concentration and RC when using only MBI measurements were largely driven by the errors in estimating tumor MBI volume using planar images (±30% inter-quartile range).
Conclusions:
Planar MBI images were shown to accurately and reliably be used to estimate tumor total activities and normal tissue activity concentrations in this simulation study. However, volumetric tumor uptake measurements (i.e., absolute and relative concentrations) are limited by inaccuracies in MBI volume estimation using two-dimensional images, highlighting the need for either tomographic MBI acquisitions or anatomical volume estimates for accurate three-dimensional tumor uptake estimates.
Keywords: molecular breast imaging, absolute quantification
1. INTRODUCTION
Molecular evaluation of breast cancers with gamma- and positron-emitting tracers or with magnetic resonance imaging is increasingly used as a complementary tool to standard-of-care mammography and ultrasound imaging to improve patient care. The growth in the past decade of clinical and investigational molecular breast imaging applications from initial screening and diagnosis to treatment response evaluation has been largely ushered by the advent and improvement of dedicated breast imaging systems.1 In contrast to conventional tomographic imaging with whole-body SPECT/CT and PET/CT systems, these dedicated breast systems are able to improve their detection sensitivity and spatial visualization of breast lesions by the use of specialized collimation and geometry by placing the detector elements either in contact with or adjacent to the breast itself.
Today, molecular breast imaging (MBI) typically refers to imaging of single-photon-emitting radiotracers using dedicated breast systems with two flat-panel detectors. The typical MBI protocol begins shortly after (within 10 minutes) a 6.5–8.0 mCi (240–300 MBq) technetium-99m sestamibi (99mTc-sestamibi) intravenous administration. The breast is immobilized by light compression between the two detectors and imaged for 10 minutes per view. The 2 standard views acquired per breast, craniocaudal (CC) and mediolateral oblique (MLO), reflect the standard views acquired with mammography. Additional views may be acquired depending on the breast size and tumor location within the breast.2–4
A current limitation of MBI is the lack of absolute quantitation of 99mTc uptake in malignant and benign breast tissues. As such, clinical applications of MBI are limited to the evaluation of relative counts per pixel in the image. However, the relative counts per pixel is known to vary even when the same 99mTc biodistribution is imaged due to differences in the tumor to detector distances and view angles, as evidenced by the differences between detectors and between views for the same patient. In spite of these variabilities, count-based metrics such as average region of interest (ROI) count ratios between tumor and normal tissue ROIs have been demonstrated to correlate with functional tumor changes. A recent meta-analysis found that an assorted range of ROI measurements and qualitative evaluations of 99mTc-sestamibi tumor uptake with MBI with previous iterations of breast imaging systems was moderately predictive of pathologic response following neoadjuvant therapies with an overall sensitivity of 70% (57%-81%, 95% confidence interval) and specificity of 90.1% (77.5%-96.0%).5
In a previously published manuscript, Monte Carlo simulations of a GE Discovery NM750b MBI system were used to develop and validate a technique for absolute tumor total 99mTc activity quantification with a theoretical accuracy and precision of 0.5% ± 11.1% for spherical and ellipsoidal tumors with diameters ≥ 1 cm and uniformly distributed total 99mTc activity ≥ 100 nCi, under a wide variety of simulated clinical breast positioning and image acquisition conditions.6 Of note, this accuracy was relatively constant for the different tumor sizes, depths within the compressed breast, and tumor-to-background 99mTc-sestamibi activity concentration ratios observed clinically. Briefly, this approach uses input contours of tumor and background regions and the measured compressed breast thickness and applies a series of background, attenuation, scatter, and detector response corrections (Equation 2) to quantify the absolute tumor total activity.
Building on the successful demonstration of absolute tumor total activity measurement in that work, the objective of this work is to assess the accuracy and performance of several MBI tissue uptake metrics (Table 1) in clinically relevant conditions using the GE Discovery NM750b MBI system. Here, we focus first on comparing the proposed tumor total uptake quantification to other published techniques and then on using the estimated tumor uptakes along with newly proposed techniques for tumor MBI volume and normal tissue uptake concentrations measurements to calculate a tumor to background relative activity concentrations .
Table 1.
Summary of calculated benign and malignant tissue uptake metrics investigated in this work with brief descriptions or equations for distinct calculations, when applicable.
| Uptake Metric | Truth | Comparisons | |||
|---|---|---|---|---|---|
| Tumor Total Activity |
(Near Detector) |
(Far Detector) |
(Geo. Mean) |
(Modified GM) |
|
| Tumor MBI Volume |
(Near Diameters) |
(Far Diameters) |
(True ROIs) |
||
| Tumor Activity Concentration | |||||
| Normal Tissue Activity Concentration |
(Single-Detector) |
(Geometric Mean) |
|||
| Tumor to Background Relative Concentrations | |||||
2. METHODS
2.1. Simulation Overview
The simulated data set used to compare tumor activity metrics in this study consisted of both spherical and ellipsoid tumors in “hot” breast tissue. All simulations consisted of 10-minute acquisitions of clinically-observed breast compressed thicknesses (, 6, 8, 10, 12 cm), normal tissue uptake concentrations (, 20, 60 nCi/cm3), tumor diameters , tumor distances from detectors , and tumor concentrations with tumor-to-background activity concentration relative differences of on a validated Geant4-based application of the Discovery NM750b clinical system (96x64 square pixels, 2.46 mm pixel pitch, dual cadmium-telluride-zinc detectors). 6 In all acquisitions, the detector heads were placed immediately adjacent to the simulated breast (Figure 1).
Figure 1.

Schematic of simulated 8-cm thick breast (20 nCi/cm3 ) with two identical ellipsoid tumors (2x3x2 cm diameters, 20:1, 2.51 µCi total activity) located at either 2 cm or 4 cm from inferior detector. Resulting MBI photopeak images (140 keV ± 10%) for both tumors from both detectors are shown in same window width/level. Reported values correspond to maximum tumor ROI (dashed lines) pixel count to average background ROI (not shown) pixel count.
Ellipsoid tumors were only simulated within the breast. Furthermore, ellipsoid tumor diameters were constrained such that the maximum difference between the smallest and largest tumor axes (i.e., between , , and ) could not exceed 2 cm. These values of normal tissue uptake and tumor uptakes were selected as they produced images spanning the typical background signal levels (i.e., 20–100 normal tissue counts per pixel) and tumor contrast levels observed in our practice (i.e., 2–6 ratio of maximum tumor count per pixel to average normal tissue counts per pixel). These simulated activities were also in accordance with values reported elsewhere.7 In total, 900 spherical and 5,373 ellipsoid tumors were initially simulated in this work. Unless otherwise stated, all images correspond to images with standard 99mTc photopeak window (140 keV ± 10%).
The evaluation and comparison of accuracy and precision of all uptake measurements in this work was limited to the subset of simulated acquisitions resulting in photopeak images in both detectors with background-corrected tumor ROI counts and ratios of maximum tumor ROI pixel count to average background ROI pixel count . These thresholds were found to occur at the lower end of clinical values measured at our institution and were implemented to remove simulation images beyond the known capabilities of both the commercial system and the proposed tumor total activity quantification technique.6
Each acquisition was additionally stratified into 1 of 6 sub-groups for additional analysis based on the tumor’s eccentricity and depth . The three tumor eccentricity categories, none, low, and high, were defined respectively as tumors with of 0 cm (i.e., spheres), of 0.5 or 1.0 cm, and of 1.5 or 2.0 cm. In addition, two tumor depth categories, mid-breast and edge-breast, were defined as tumors with centers in the middle one-third and the outer two-thirds of compressed breast thickness , respectively (Figure 1).
2.2. Tissue Uptake Measurements
2.2.a. Summary of Measurements
The various absolute and relative tumor and normal tissue 99mTc uptake measurements investigated are defined in Section 2.2 and evaluated in Section 2.3. In Section 2.3.a, we compare the performance of 4 different approaches for absolute tumor total 99mTc activity measurement. The first two estimates are calculated using either of the two single detector images and a set of tumor and background ROIs to calculate tumor activity following background, scatter, and attenuation corrections.6 The third estimate is as a simple geometric mean of both detector tumor ROI counts that includes background and attenuation corrections. The final estimate is calculated following a modified geometric mean approach proposed by Bache and Kappadath which incorporates a dual-energy window scatter correction and a volumetric background correction factor.8 In Section 2.3.b, we evaluate the performance of two tumor MBI volume methodologies, that will be needed for calculating tumor 99mTc activity concentrations. In Section 2.3.c, we evaluate two approaches for estimating normal tissue 99mTc activity concentrations, and finally, the estimated total tumor 99mTc activity, tumor MBI volume, and normal tissue 99mTc activity concentration are then used to calculate a new tumor uptake metric, .
2.2.b. Tumor Total Activity
Four distinct tumor total activity estimates were calculated for each simulated acquisition using a tumor ROI that spanned the true lateral extent of the simulated tumor and a 2.5 cm diameter background ROI. Two tumor activity estimates, and , were calculated following a proposed methodology incorporating normal tissue, scatter, background, and detector response corrections but applied separately to each of the two acquired images.6 For each acquisition, the near and far detectors were first identified by estimating the tumor relative depth using the total breast thickness and the ratio of the background-corrected tumor ROI total counts in the photopeak energy windows images of both detectors 7:
| Equation 1 |
where is the linear attenuation coefficient of photons in tissue (cm−1), and are the tumor ROI area and total counts in the detectors 1 and 2 photopeak energy window images, and and are the background ROI area and total counts in the detectors 1 and 2 photopeak window images.
The near single-detector total tumor activity estimate was calculated as:
| Equation 2 |
where is a unitless correction factor (range 0.80–0.96) derived with simulations to jointly correct scatter and partial volume effects, and is a constant sensitivity factor (Bq/counts). Likewise, the far single-detector total tumor activity estimate was calculated with Equation 2 with the same ROIs but with the corresponding far detector photopeak image and tumor depth estimate.
The third activity estimate, , was a simple geometric mean for attenuation correction that incorporated normal tissue uptake subtraction, and quantified total tumor activity as:
| Equation 3 |
The fourth activity estimate, , was a modified geometric mean calculation with additional dual-energy window scatter correction and a volumetric approach to normal tissue uptake subtraction, and quantified total tumor activity as:8
| Equation 4 |
where and are the tumor ROI total counts in the photopeak and lower (113–126 keV) energy window images, respectively, in detectors 1 and 2 and is a breast-thickness dependent dual-energy window scatter correction factor. is a volumetric-background correction factor given by:8
| Equation 5 |
2.2.c. Tumor MBI Volume
Three tumor MBI volume estimates were calculated. The first estimate, , was calculated from estimates of the tumor MBI major and minor diameters from the near detector image as:
| Equation 6 |
MBI tumor diameter estimates were calculated following the steps described in Lopez et al.9 Briefly, the methodology first locates the weighted centroid, major axis, and minor axis of a given tumor ROI. Then, major and minor profiles are extracted from the median-filtered image along the identified axes. Finally, major and minor tumor diameters (, ) are calculated from interpolated full-width at half-maximum (FWHM) values of each respective profile using the linear relationship .
The second volume estimate, , was calculated using the same steps above for Equation 6 but with the far detector image. The third volume estimate, , was calculated directly from the tumor ROI area ():
| Equation 7 |
2.2.d. Normal Tissue Concentration
Two separate normal tissue activity concentrations were calculated using the 2.5 cm diameter background ROIs. The first concentration estimate, , was calculated from the geometric mean of background ROI total counts and includes the same breast-thickness-dependent attenuation correction as and :
| Equation 8 |
The second, newly developed, concentration estimate, , was calculated from the average background ROI counts in both detectors based on following expression:
| Equation 9 |
where is the fraction of normal tissue primary counts within a background ROI. This equation was derived from the observation the fact that the measured counts in a background ROI () of area () can be estimated from the integral sum of the uniformly distributed activity () within the volume of tissue directly above the ROI:
| Equation 10 |
By rearranging the terms in Equation 10, we arrive at the expression reported in Equation 9. Based on a subset of 20 simulations of compressed breasts with normal tissue activity concentrations (Figure S-1), the fraction of normal tissue primary counts within a background ROI, could be estimated by the total breast thickness () and the linear attenuation coefficient in tissue by:
| Equation 11 |
2.3. Tumor Uptake Comparisons
2.3.a. Total Activity ()
The error of each activity methodology relative to the true simulated activity was calculated for all acquisitions. The accuracy and precision of each methodology is reported as the median and standard deviation (SD) of for all acquisitions and for each tumor eccentricity and depth sub-group. Within each sub-group, paired t-tests were performed to determine if 1) errors were significantly lower than , , and errors, 2) if errors were significantly lower than and errors, and 3) if errors were significantly lower than errors. Finally, to assess the impact of tumor position on the accuracy of each methodology, two-sample t-tests were performed to determine if mid-breast tumors had significantly different mean errors than edge-breast tumors. To minimize the likelihood of randomly rejecting the null hypothesis when performing these 10 comparisons using the same variables, the significance level of each t-test was modified by the Bonferroni correction 10 and conservatively set to p = 0.005 (= 0.05/10).
2.3.b. Tumor Volume () and Concentration ()
The median and inter-quartile range (IQR) of relative errors of the three tumor volume methodologies (, , ) were calculated for all acquisitions and for each of the 3 eccentricity sub-groups. The tumor total activity and volume methodologies with the lowest median error for all acquisitions were used to estimate tumor concentration (). For comparison, tumor concentrations () were also calculated with the same tumor total activities but with the true tumor volume (). The median and IQR of relative errors of both tumor concentration methodologies were calculated for all acquisitions and for each of the 3 eccentricity sub-groups.
2.3.c. Normal Tissue Concentration () and Tumor Relative Concentration ()
The median and inter-quartile range (IQR) of relative errors of the two normal tissue concentration methodologies (, ) were calculated for the 15 unique combinations of breast thickness () and concentration (). The normal tissue concentration methodology with the lowest median error in the 15 acquisitions and the estimated tumor concentration () were used to calculate the tumor to background relative activity concentration (). For comparison, were also calculated with the same normal tissue concentrations but with . The median and IQR of errors of both methodologies relative to the tumor-to-background activity concentration differences of were calculated for all acquisitions and for each of the 3 eccentricity sub-groups.
3. RESULTS
3.1. Tumor Total Activity
The calculated median (SD) relative activity error in all 4,024 acquisitions satisfying the inclusion criteria was 0.2% (4.3%) for , 1.6% (4.4%) for , 4.6% (14.5%) for , and 8.1% (5.8%) for . Table 2 summarizes the median (SD) relative errors for each of the 6 eccentricity and depth sub-groups. In general, and consistently had the lowest median and range of errors, with errors increasing when the tumor was near the breast edge. For reference, the median (SD) error in estimated tumor depth using Equation 1 across all acquisitions was 0 cm (0.16 cm), demonstrating that the near and far detectors can be confidently identified with this metric and that the appropriate scatter and attenuation factors were applied in the tumor total activity estimation. errors were significantly lower than other methodologies all sub-groups (p << 0.005, Table S-1). Figure 2 summarizes the distribution of errors in calculations for each of the 6 eccentricity and depth sub-groups.
Table 2.
Median (standard deviation) relative tumor activity error of 4 methodologies in all acquisitions and in each tumor depth and eccentricity sub-group.
| All Depth | Mid-Breast | Edge-Breast | |||||
|---|---|---|---|---|---|---|---|
| All Eccentricity | None | Low | High | None | Low | High | |
| N (%) | 4,024 (100%) | 352 (9%) |
976 (24%) |
1,260 (31%) | 153 (4%) |
524 (13%) |
759 (19%) |
| 0.2% (4.3%) | 0.1% (3.6%) | 0.5% (4.4%) | 0.2% (4.2%) | 0.2% (4.0%) | 0.3% (4.5%) | −0.5% (4.4%) | |
| 1.6% (4.4%) | 0.5% (4.0%) | 1.4% (4.3%) | 1.4% (4.0%) | 2.5% (5.2%) | 2.8% (5.0%) | 2.1% (4.1%) | |
| 4.6% (14.5%) | 6.8% (20.8%) | 3.5% (12.4%) | 4.5% (13.5%) | 3.1% (10.0%) | 3.5% (12.4%) | 4.0% (11.3%) | |
| 8.1% (5.8%) | 10.2% (5.9%) | 6.7% (5.9%) | 8.2% (5.3%) | 9.6% (5.9%) | 6.7% (5.9%) | 5.9% (5.4%) | |
Figure 2.
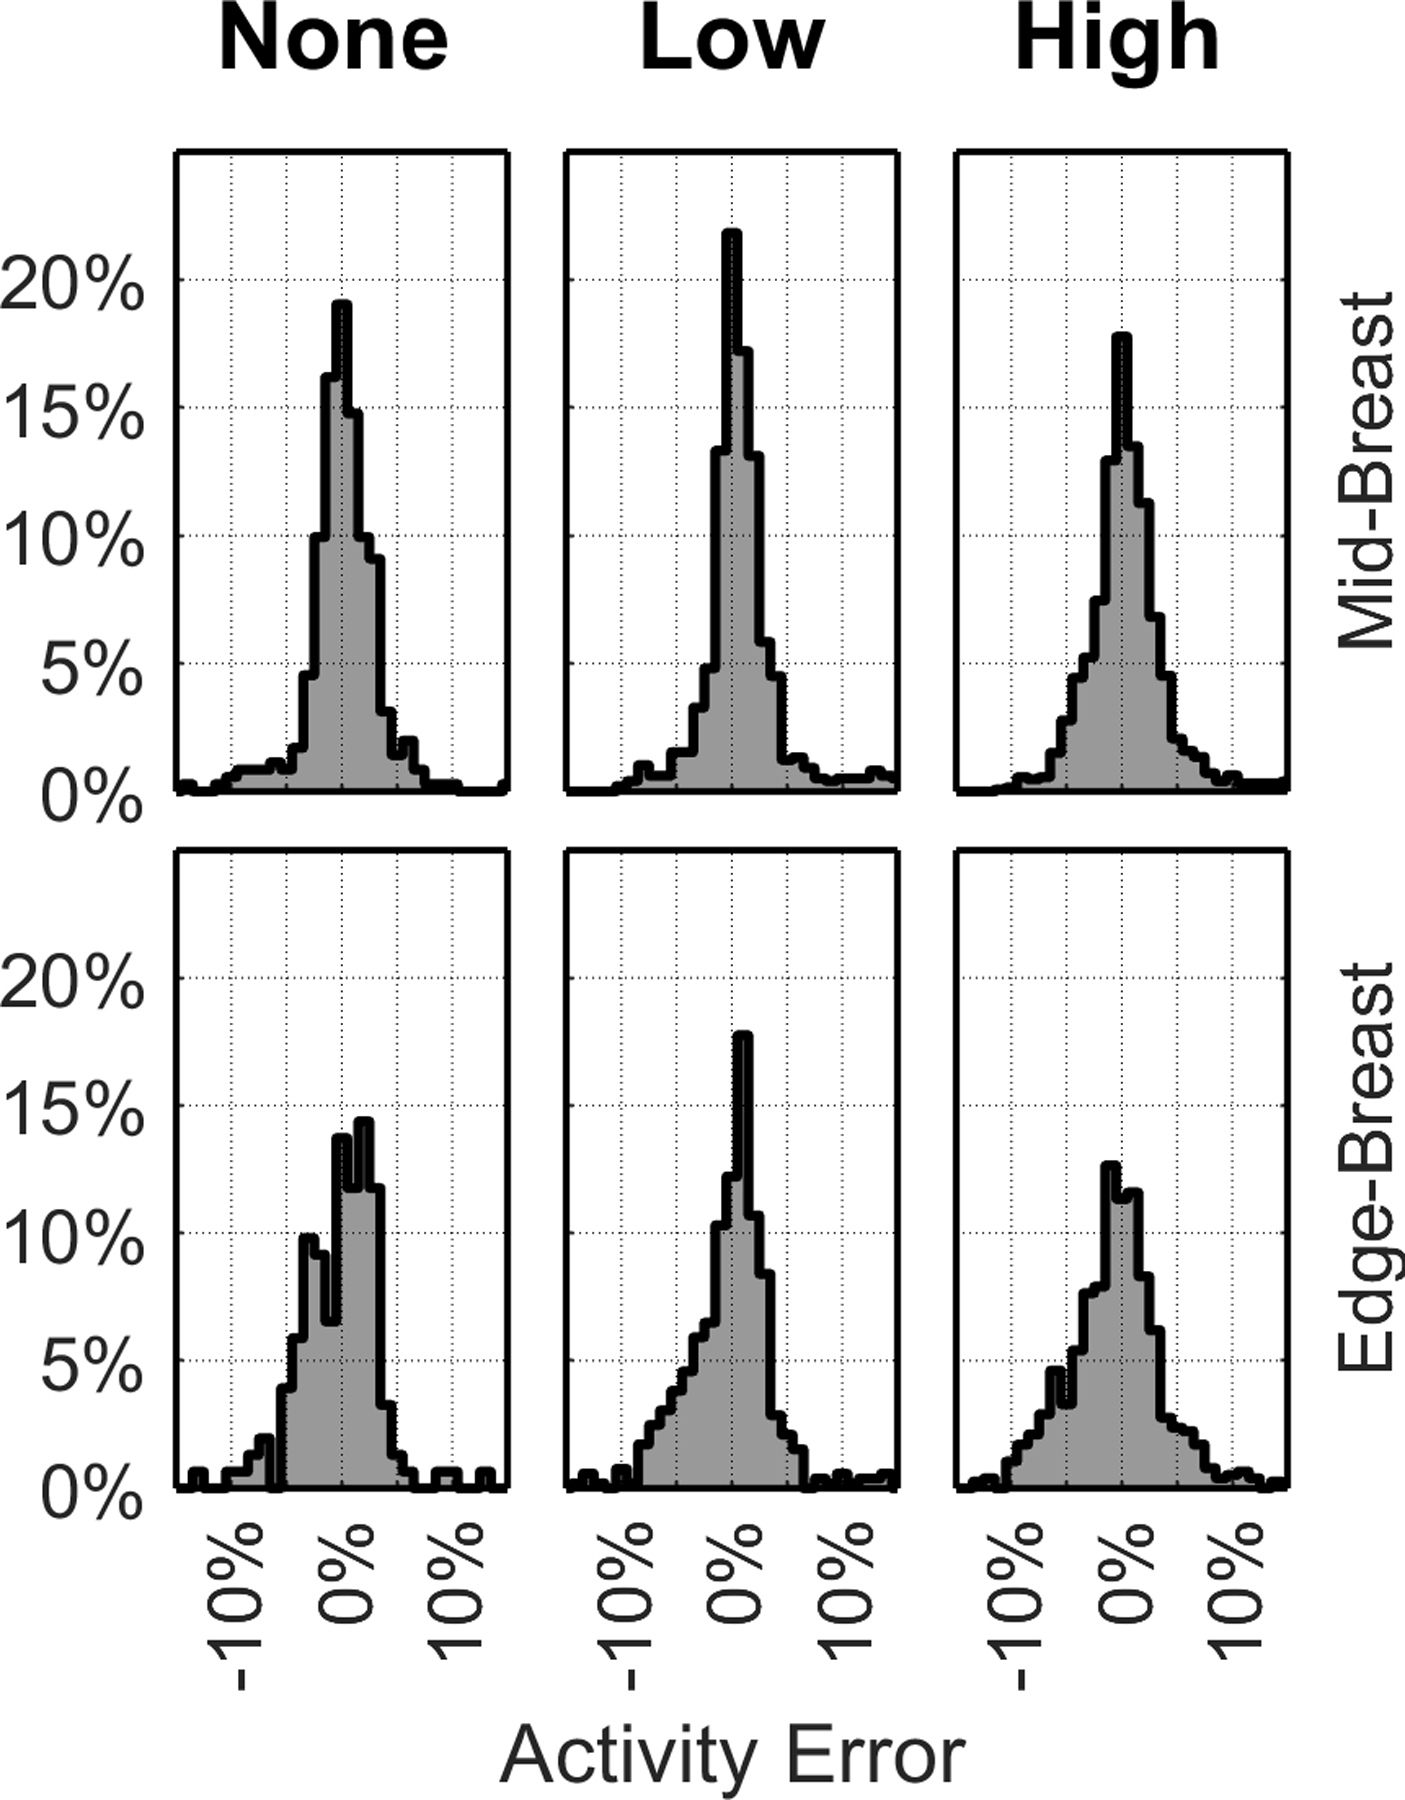
Frequency histograms (%) of relative error in . Each column corresponds to different tumor eccentricities () of 0 cm (left), 0.5 & 1.0 cm (middle), and 1.5 & 2.0 cm (right). Mid-Breast (top row) and Edge-Breast (bottom row) data correspond to tumors with centers in the middle 1/3rd and the outer 2/3rds, respectively, of compressed breast thickness.
The differences between and errors when the tumors were in the middle of the compressed breast were almost always (92% of the time), within 5 percentage points (pp) (Figure S-2), demonstrating that both detectors can achieve similar accuracy using the proposed methodology (Equation 2) if the tumor is centrally located. When the tumors were closer to the edge of the breast, the differences between and errors increased to up to 10 pp in some acquisitions. Nevertheless, errors were significantly lower than errors in all sub-groups but only significantly lower than errors when tumors were closer to the breast mid-line (p << 0.005).
Regarding the geometric mean approaches, had lower median errors than but had the lower range of errors (Table 2). These larger maximum errors with were found to occur primarily in the simulated tumors with 2:1 tumor-to-background activity concentration differences, indicating that this methodology is less accurate that a basic geometric mean calculation for very low contrast tumors. As a result of these larger errors in low contrast tumors, errors were only significantly lower than in 2 of the 6 subgroups (p << 0.005).
Mid-breast tumors had significantly lower errors (mean difference, SD difference) than edge-breast tumors when using both (−0.5 pp, 3.3 pp) and (−1.1 pp, 3.8 pp) methodologies but had significantly higher errors when using (2.2 pp, 12.8 pp) and (1.6 pp, 4.5 pp) methodologies. These results demonstrate the improved accuracy of single-detector-based tumor total activity measurement than the geometric mean approaches across all tumor depths. Furthermore, these results indicate that the geometric mean approaches can be less accurate when the tumor is positioned closer to one detector than near the midline of the compressed breast.
3.2. Tumor MBI Volume and Concentration
Tumor MBI volume errors in all 4,024 acquisitions ranged between −100% to +250% for diameter-based estimates and between −20% to +320% for ROI-based estimates (Table 3, Figure S-3). As expected, the accuracy decreased with increasing eccentricity, especially in tumors where the tumor diameter orthogonal to the detector face () was either smaller or larger than both diameters parallel to the detector face ( and ). In less eccentric tumors, approximately half of and estimates were within 10% and 25% of the true volume spherical tumors and low eccentricity ellipsoid tumors, respectively. The IQR of errors, however, increased to approximately −50% to +80% for high eccentricity tumors.
Table 3.
Median (inter-quartile range) relative error of 3 tumor volume calculations, 2 tumor activity concentration calculations, and 2 calculations across all tumor depths for all acquisitions and within each tumor eccentricity sub-group.
| All | None | Low | High | |
|---|---|---|---|---|
| N (%) | 4,024 (100%) | 505 (13%) | 1,500 (37%) | 2,019 (50%) |
| −2% (−33%, 36%) | 4% (−6%, 9%) | −2% (−22%, 27%) | −11% (−45%, 78%) | |
| −6% (−33%, 28%) | 1% (−9%, 8%) | −7% (−25%, 18%) | −14% (−41%, 58%) | |
| 50% (20%, 120%) | 45% (43%, 50%) | 51% (26%, 87%) | 66% (3%, 152%) | |
| −3% (−26%, 50%) | −3% (−8%, 6%) | 3% (−20%, 29%) | 15% (−43%, 79%) | |
| 0% (−2%, 2%) | 0% (−2%, 2%) | −0% (−1%, 2%) | 0% (−2%, 2%) | |
| 1% (−27%, 47%) | −4% (−9%, 6%) | 1% (−22%, 27%) | 12% (−44%, 77%) | |
| −2% (−3%, 1%) | −1% (−3%, 1%) | −2% (−3%, 1%) | −2% (−4%, 1%) |
Tumor concentrations calculated using tumor activity and volume estimates from the near detector image ( and ) are also reported in Table 3. median (IQR) error across all acquisitions was 0% (−2%, 2%), demonstrating the feasibility of accurate tumor concentration estimates when the tumor volume is known. When tumor volumes were estimated from MBI images, the concentration errors in were driven by the errors in . In spherical tumors where had a median (IQR) accuracy of 4% (−6%, 9%), had a median (IQR) error of −3% (−8%, 6%). In tumors with high eccentricity, however, median (IQR) error increased to 15% (−43%, 79%).
3.3. Normal Tissue Concentration and Tumor Relative Concentration
Across 15 unique simulated breast conditions, the novel normal tissue concentration approach, , had lower errors (1% median, 0–1% IQR) than the geometric mean approach, , (33%, 23–40%). The larger error observed in was largely driven by the lack of scatter correction. When was multiplied by the same breast-thickness-dependent scatter correction factor used to calculate , the resulting values had a median (IQR) error of 9% (5%, 12%).
values calculated using near detector image tumor concentrations ( and ) and the proposed normal tissue concentrations ( and ) are reported in Table 3. Similar to the tumor concentration results, median (IQR) error across all acquisitions was −2% (−3%, 1%), demonstrating the feasibility of accurately estimating the difference in true relative concentration between malignant and normal breast tissue, if tumor volume were to be known. When tumor volume was estimated, the concentration errors in followed the same errors as . Nevertheless, had comparable accuracies to for spherical tumors with a median (IQR) error of −4% (−9%, 6%), which worsened to 12% (−44%, 77%) in tumors with high eccentricity (Figure 3).
Figure 3.

Frequency histograms (%) of relative error in (dark) and (light). Each column corresponds to different tumor eccentricities () of 0 cm (left), 0.5 & 1.0 cm (middle), and 1.5 & 2.0 cm (right). Mid-Breast (top row) and Edge-Breast (bottom row) data correspond to tumors with centers () in the middle 1/3rd and the outer 2/3rds, respectively, of compressed breast thickness ().
4. DISCUSSION
This work, to our knowledge, is the first to evaluate the feasibility and performance of several three-dimensional tissue uptake metrics, including tumor and normal tissue absolute and relative uptake concentrations, using a dedicated planar breast MBI system. Across a wide range of simulated clinical conditions relevant to 99mTc-sestamibi uptake, a newly proposed single-detector approach had significantly lower total tumor 99mTc activity errors than previously published two-detector geometric mean approaches. Under appropriate measurement conditions, the single-detector methodology achieved a median (SD) error of 0.2% (4.3%), with a substantial improvement over the basic and modified geometric mean approaches with median (SD) errors of 4.6% (14.5%) and 8.1% (5.8%), respectively.
There are two key findings from this study regarding absolute tumor total activity measurements with MBI. First, the physics-based corrections derived from Monte Carlo simulations significantly improve the accuracy of tumor total activity quantification than phantom-derived correction factors. Of note, an improvement in the proposed methodology is achieved from the use of tumor depth, not total breast thickness, for attenuation and scatter correction. Second, the proposed methodology demonstrates better tumor total activity accuracy and precision using only a single detector rather than both detector images. MBI acquisitions for tumor total activity measurements may benefit from a reassessment of the image acquisition protocol, whereby the view angles and breast positioning are chosen to minimize the distance between the tumor and a single detector.
As expected, the errors in tumor 99mTc absolute and relative activity concentrations using MBI were driven by the inaccuracies of tumor MBI volume estimation using a parallel-detector planar system with 2.46 mm pixel pitch. These large pixel sizes relative to the typical tumor diameters contributed to the larger errors observed when volumes were calculated from segmented tumor ROI areas instead of estimated orthogonal tumor diameters (Table 3). Under good imaging and measurement conditions, perfectly spherical tumors diameter-based volumes had median (IQR) errors of 4% (−6% to 9%), however, some cases erred by up to ±50%. Volume errors increased rapidly with tumor eccentricity, with high eccentricity tumors errors ranging between −45% to 78% (IQR). In contrast, no meaningful loss of accuracy in tumor total activity quantification was observed with tumor eccentricity.
When the true tumor volumes were used to calculate three-dimensional tumor uptake, both tumor concentration and estimates had errors within 5% of the true simulated values (Table 3). This error in is well aligned with the estimated average errors in relative tumor-to-background uptake measurement (T/B) using true tumor volumes of ±5% reported in Hruska et al. in simulations of the LumaGem 3200s system (Gamma Medica-Ideas, Northridge, CA).7 These findings highlight that accurate absolute and relative tumor concentrations can be calculated with MBI but will require improved volume estimations. This improvement may come from acquiring better samples of the tumor volume by using modified MBI acquisition protocols with multiple views or different MBI systems with smaller pixel pitch or by incorporating anatomical tumor volumes (e.g., from mammography, ultrasound, or magnetic resonance imaging) as approximations of the functional volumes (as routinely done in tumor quantitative measurements with PET/CT and SPECT/CT).11
The clinical value of our proposed techniques to estimate normal tissue activity concentration may extend beyond its use as the denominator in the calculation. Recent studies have demonstrated the value of also evaluating normal tissue 99mTc-sestamibi uptake with MBI. With a cohort of 2,992 women, Hruska et al. reported that increased background parenchymal uptake (BPU), defined as increased tracer uptake in fibroglandular tissue relative to uptake in subcutaneous fat, was an independent risk factor for breast cancer.12 While BPU is typically qualitatively assessed by an expert radiologist using a 5-level scale 13, quantitative BPU techniques have been investigated using mammogram contour registration 14 or convolutional neural networks 15. Our work demonstrates the feasibility of extending these BPU measurements to also include absolute normal tissue uptake estimates. Additional investigations will be needed to first properly implement this technique in patient images, where parenchymal uptake is not homogeneous and background ROIs throughout the same breast can differ in average pixel counts by up to 35% 6, and to then determine correlation, if any, between absolute normal tissue activity concentrations to BPU classes and breast cancer risk.
While not investigated in this work, a critical and necessary component of implementing these quantitative tumor and normal tissue 99mTc uptake metrics in MBI clinical applications is an understanding of sources of error and measurement precision. The benchmark theoretical performance (median ± SD error) of the proposed tumor total activity measurement is 0.5% ± 11.1% 6, but the calculated accuracy in this work for across all acquisitions was 0.2% ± 4.3%. This performance improvement is artifactual, as all tumor total activity measurements here were calculated from perfectly sized and located tumor contours. Likewise, the remaining tumor and normal tissue uptake metrics in this work were calculated without additional impacts of patient heterogeneity, breast positioning differences during acquisition, confounding presence of image counts near chest wall originating from 99mTc-sestamibi uptake in the heart and liver, or contouring variability that would be present in clinical implementations. Such uncertainty analysis is beyond the scope of this work, which focuses instead on introducing new possible absolute tissue uptake measurements with MBI and on comparing theoretical performance of different approaches under ideal simulation conditions. Nevertheless, the range of errors calculated for each methodology under these best-case conditions still provides insight into which approaches are realistically feasible and into the expected magnitude of errors in clinical data with heterogenous patient conditions and larger measurement uncertainties.
Focusing only on spherical tumors, the estimated measurement precision (2 standard deviations ≈ 1.5 inter-quartile range) of the MBI-derived tumor uptake metrics was 8% for , 21% for , and 23% for . Based on these precision values, a difference of 25% or greater in any of these quantitative MBI tumor uptake metrics either between patients or between imaging time points of the same tumor could be established with statistical confidence to indicate a significant difference in biological tumor radiotracer uptake. For reference, the PET Response Criteria in Solid Tumors (PERCIST 1.0) defines a 30% change between baseline and follow-up 18F-fluorodeoxyglucose (FDG) standardized uptake value (SUV) as the threshold criteria for defining partial tumor response or progressive disease.16 In clinical studies, the cutoff 18F-FDG SUV change indicative of response ranged between 25% to 70%, with 55–65% SUV changes being most correlated with pathological tumor changes.17 In the context of using quantitative MBI for non-invasive evaluation of tumor response or progression, a 25% change would therefore be the minimum detectable tumor functional change and any thresholds used to classify response status would necessarily have to be greater than 25%.
Looking beyond 99mTc-sestamibi, the only radiotracer routinely used for clinical MBI preferentially localized in mitochondria of malignant cancer cells but also localized in varying levels within benign breast tissues, there are many new 99mTc-labelled radiotracers are actively under development and are being designed to more specifically target and even differentiate breast cancers.1,18 A PubMed search of “molecular breast imaging technetium-99m” manuscripts published since 2020 reveals on-going in vitro, pre-clinical, and even some initial human trials using 99mTc-labelled antibodies and affibodies, gold and silicon nanoparticles, and peptides and proteins to visualize, for example, general breast tumors,19–21 human epidermal growth factor receptor 2 and folate receptor expression in breast tumors,22–26 epithelial cell adhesion molecules expression in triple negative breast cancers,27 and even angiogenesis via αvβ3-integrin receptor targets.28,29 Thanks to improvements in MBI system sensitivity and resolution, largely due to the optimization of the detector and collimator design,18 MBI with proper quantification techniques may be uniquely positioned to become an alternative modality to whole-body SPECT/CT to image these new 99mTc-labelled tracers.
In summary, absolute tumor 99mTc uptake accuracy and precision with single-view planar MBI shows potential promise for quantitative clinical applications. However, future work is necessary to improve tumor MBI volume measurements, to better establish measurement uncertainties in clinical conditions, and to identify the clinical role of MBI tissue uptake metrics in breast cancer care.
5. CONCLUSION
Single-detector MBI photopeak images can be used to accurately quantify absolute tumor and normal tissue 99mTc total activity uptake and concentrations with improved performances over previously reported geometric mean approaches. While single-view planar MBI has limited reliability for tumor volume estimation, this work demonstrates the possibility of accurate tumor absolute and relative to normal tissue 99mTc concentration estimations if the proposed quantitative MBI techniques are used in conjunction with volumetric measurements from anatomical imaging.
Supplementary Material
Figure S-1. Primary photon fraction in normal tissue ROIs () as a function of breast thickness () in 20 simulated breasts with normal tissue activity concentrations > 60 nCi/cm3. Fit line corresponds to , where .
Figure S-2. Distributions of differences in percentage points (pp) between errors, errors, and errors relative to errors. Each column corresponds to different tumor eccentricities () of 0 cm (left), 0.5 & 1.0 cm (middle), and 1.5 & 2.0 cm (right). Mid-Breast (top row) and Edge-Breast (bottom row) data correspond to tumors with centers in the middle 1/3rd and the outer 2/3rds, respectively, of compressed breast thickness.
Figure S-3. Distributions of errors in tumor MBI volume for , , and for the different tumor eccentricities () of 0 cm (left panel), 0.5 & 1.0 cm (middle panel), and 1.5 & 2.0 cm (right panel).
ACKNOWLEDGEMENTS
The authors acknowledge the support of the High Performance Computing for research facility at the University of Texas MD Anderson Cancer Center for providing computational resources that have contributed to the research results reported in this paper. This work was supported in part by a research grant from GE Healthcare and from The University of Texas MD Anderson Cancer Center Support Grant CA016672 from the National Institutes of Health.
MATHEMATICAL ABBREVIATIONS
background ROI area
tumor ROI area
tumor total activity
compressed breast thickness (distance between detectors)
- ,
background / normal tissue uptake concentration
tumor-to-background activity concentration difference
tumor concentration
- ,
tumor diameters in plane of detector face
tumor diameter orthogonal to detector face
- ,
major and minor tumor diameters in plane of detector face
joint scatter and partial volume correction factor
fraction of primary to total tumor counts in ROI
ratio of tumor activity to measured tumor ROI counts
linear attenuation coefficient of photons in tissue
tumor ROI total counts
background ROI total counts (cm−1)
background-corrected tumor ROI counts
excess tumor activity concentration relative to normal tissue activity concentration
detector sensitivity as measured during annual performance evaluation
tumor center distance from detector face
ratio of average tumor ROI counts per pixel to average background ROI counts per pixel
ratio of maximum tumor ROI pixel count to average background ROI count per pixel
tumor MBI volume
REFERENCES
- 1.Collarino A, Fuoco V, Pereira Arias-Bouda LM, et al. Novel frontiers of dedicated molecular imaging in breast cancer diagnosis. Transl Cancer Res 2018;7(Suppl 3):S295–S306. doi: 10.21037/tcr.2017.10.28 [DOI] [Google Scholar]
- 2.Huppe AI, Mehta AK, Brem RF. Molecular Breast Imaging: A Comprehensive Review. Semin Ultrasound, CT MRI Published online 2018:60–69. doi: 10.1053/j.sult.2017.10.001 [DOI] [PubMed]
- 3.Swanson TN, Tran TD, Ellingson LR, et al. Best practices in molecular breast imaging: A guide for technologists. J Nucl Med Technol 2018;46(1):3–11. doi: 10.2967/jnmt.117.204263 [DOI] [PubMed] [Google Scholar]
- 4.Hruska CB, Corion C, de Geus-Oei L- F, et al. SNMMI Procedure Standard/EANM Practice Guideline for Molecular Breast Imaging with Dedicated γ-Cameras. J Nucl Med Technol 2022;50(2):103–110. doi: 10.2967/jnmt.121.264204 [DOI] [Google Scholar]
- 5.Collarino A, de Koster EJ, Valdés Olmos RA, de Geus-Oei L- F, Pereira Arias-Bouda LM. Is Technetium-99m Sestamibi Imaging Able to Predict Pathologic Nonresponse to Neoadjuvant Chemotherapy in Breast Cancer? A Meta-analysis Evaluating Current Use and Shortcomings. Clin Breast Cancer 2018;18(1):9–18. doi: 10.1016/j.clbc.2017.06.008 [DOI] [PubMed] [Google Scholar]
- 6.Lopez BP, Kappadath SC. Monte Carlo-derived 99mTc uptake quantification with commercial planar MBI: Absolute tumor activity. Med Phys 2022;00:1–13. doi: 10.1002/mp.16196 [DOI] [PMC free article] [PubMed] [Google Scholar]
- 7.Hruska CB, O’Connor MK. Quantification of lesion size, depth, and uptake using a dual-head molecular breast imaging system. Med Phys 2008;35(4):1365–1376. doi: 10.1118/1.2885371 [DOI] [PMC free article] [PubMed] [Google Scholar]
- 8.Bache ST, Kappadath SC. Quantitation of tumor uptake with molecular breast imaging. Med Phys 2017;44(9):4593–4607. [DOI] [PubMed] [Google Scholar]
- 9.Lopez BP, Rauch GM, Adrada BE, Kappadath SC. Functional tumor diameter measurement with Molecular Breast Imaging: Development and clinical application. Biomed Phys Eng Express 2022;(review). [DOI] [PubMed]
- 10.Rosner B Fundamentals of Biostatistics 7th ed. Brooks/Cole; 2011. [Google Scholar]
- 11.O’Connor MK, Morrow MM, Tran TD, Hruska CB, Conners AL, Hunt KN. Technical Note: Development of a combined molecular breast imaging/ultrasound system for diagnostic evaluation of MBI-detected lesions: Development. Med Phys 2017;44(2):451–459. doi: 10.1002/mp.12043 [DOI] [PubMed] [Google Scholar]
- 12.Hruska CB, Geske JR, Conners AL, et al. Background parenchymal uptake on molecular breast imaging and breast cancer risk: A cohort study. Am J Roentgenol 2021;216(5):1193–1204. doi: 10.2214/AJR.20.23854 [DOI] [PMC free article] [PubMed] [Google Scholar]
- 13.Conners AL, Maxwell RW, Tortorelli CL, et al. Gamma camera breast imaging lexicon. Am J Roentgenol 2012;199(6):767–774. doi: 10.2214/AJR.11.8298 [DOI] [PMC free article] [PubMed] [Google Scholar]
- 14.Hruska CB, Geske JR, Swanson TN, et al. Quantitative background parenchymal uptake on molecular breast imaging and breast cancer risk: a case-control study. Breast Cancer Res 2018;20(26):1–10. doi: 10.1186/s13058-018-0973-3 [DOI] [PMC free article] [PubMed] [Google Scholar]
- 15.Carter RE, Attia ZI, Geske JR, et al. Classification of background parenchymal uptake on molecular imaging using a convolutional neural network. JCO Clin Cancer Informatics 2019;2:1–11. doi: 10.1016/j.physbeh.2017.03.040 [DOI] [PMC free article] [PubMed] [Google Scholar]
- 16.Wahl RL, Jacene H, Kasamon Y, Lodge MA. From RECIST to PERCIST: Evolving Considerations for PET Response Criteria in Solid Tumors. J Nucl Med 2009;50(Suppl_1):122S–150S. doi: 10.2967/jnumed.108.057307 [DOI] [PMC free article] [PubMed] [Google Scholar]
- 17.Rauch GM, Adrada BE, Kuerer HM, van la Parra RFD, Leung JWT, Yang WT. Multimodality imaging for evaluating response to neoadjuvant chemotherapy in breast cancer. Am J Roentgenol 2017;208(February):290–299. doi: 10.2214/AJR.16.17223 [DOI] [PubMed] [Google Scholar]
- 18.Covington MF, Parent EE, Dibble EH, Rauch GM, Fowler AM. Advances and Future Directions in Molecular Breast Imaging. J Nucl Med 2022;63(1):17–21. doi: 10.2967/jnumed.121.261988 [DOI] [PMC free article] [PubMed] [Google Scholar]
- 19.Mojarrad P, Zamani S, Seyedhamzeh M, et al. Novel radiopharmaceutical (Technetium-99m)-(DOTA-NHS-ester)-Methionine as a SPECT-CT tumor imaging agent. Eur J Pharm Sci 2020;141(June 2019). doi: 10.1016/j.ejps.2019.105112 [DOI] [PubMed] [Google Scholar]
- 20.Zamani S, Shafeie-Ardestani M, Bitarafan-Rajabi A, Khalaj A, Sabzevari O. Synthesis, radiolabelling, and biological assessment of folic acid-conjugated G-3 99mTc-dendrimer as the breast cancer molecular imaging agent. IET Nanobiotechnology 2020;14(7):628–634. doi: 10.1049/iet-nbt.2020.0176 [DOI] [PMC free article] [PubMed] [Google Scholar]
- 21.Jiang Y, Gai Y, Long Y, et al. Application and evaluation of [99mTc]-labeled peptide nucleic acid targeting microRNA-155 in breast cancer imaging. Mol Imaging 2020;19(1277):1–10. doi: 10.1177/1536012120916124 [DOI] [PMC free article] [PubMed] [Google Scholar]
- 22.Oroujeni M, Rinne SS, Vorobyeva A, et al. Preclinical evaluation of 99mTc-ZHER2:41071, a second-generation affibody-based HER2-visualizing imaging probe with a low renal uptake. Int J Mol Sci 2021;22(5):1–20. doi: 10.3390/ijms22052770 [DOI] [PMC free article] [PubMed] [Google Scholar]
- 23.Zhao L, Liu C, Xing Y, et al. Development of a 99mTc-Labeled Single-Domain Antibody for SPECT/CT Assessment of HER2 Expression in Breast Cancer. Mol Pharm 2021;18(9):3616–3622. doi: 10.1021/acs.molpharmaceut.1c00569 [DOI] [PubMed] [Google Scholar]
- 24.Bragina O, Von Witting E, Garousi J, et al. Phase I study of 99mTc-ADAPT6, a scaffold protein-based probe for visualization of HER2 expression in breast cancer. J Nucl Med 2021;62(4):493–499. doi: 10.2967/jnumed.120.248799 [DOI] [PMC free article] [PubMed] [Google Scholar]
- 25.Facca VJ, Al-saden N, Ku A, Reilly RM. Imaging of HER2-Positive Tumors in NOD/SCID Mice with Pertuzumab Fab-Hexahistidine Peptide Immunoconjugates Labeled with [99mTc]-(I)-Tricarbonyl Complex. Mol Imaging Biol 2021;23(4):495–504. doi: 10.1007/s11307-020-01571-z [DOI] [PubMed] [Google Scholar]
- 26.Kumar D, Sakhare N, Das S, et al. Development of technetium-99m labeled ultrafine gold nanobioconjugates for targeted imaging of folate receptor positive cancers. Nucl Med Biol 2021;93:1–10. doi: 10.1016/j.nucmedbio.2020.11.001 [DOI] [PubMed] [Google Scholar]
- 27.Vorobyeva A, Bezverkhniaia E, Konovalova E, et al. Radionuclide molecular imaging of EpCAM expression in triple-negative breast cancer using the scaffold protein DARPin Ec1. Molecules 2020;25(20):1–20. doi: 10.3390/molecules25204719 [DOI] [PMC free article] [PubMed] [Google Scholar]
- 28.Vatsa R, Madaan S, Chakraborty S, et al. Clinical evaluation of kit based Tc-99m-HYNIC-RGD2 for imaging angiogenesis in breast carcinoma patients. Nucl Med Commun 2020;41:1250–1256. doi: 10.1097/MNM.0000000000001282 [DOI] [PubMed] [Google Scholar]
- 29.O’Connor MK, Morrow MMB, Hunt KN, et al. Comparison of Tc-99m maraciclatide and Tc-99m sestamibi molecular breast imaging in patients with suspected breast cancer. EJNMMI Res 2017;7(1):1–12. doi: 10.1186/s13550-017-0255-6 [DOI] [PMC free article] [PubMed] [Google Scholar]
Associated Data
This section collects any data citations, data availability statements, or supplementary materials included in this article.
Supplementary Materials
Figure S-1. Primary photon fraction in normal tissue ROIs () as a function of breast thickness () in 20 simulated breasts with normal tissue activity concentrations > 60 nCi/cm3. Fit line corresponds to , where .
Figure S-2. Distributions of differences in percentage points (pp) between errors, errors, and errors relative to errors. Each column corresponds to different tumor eccentricities () of 0 cm (left), 0.5 & 1.0 cm (middle), and 1.5 & 2.0 cm (right). Mid-Breast (top row) and Edge-Breast (bottom row) data correspond to tumors with centers in the middle 1/3rd and the outer 2/3rds, respectively, of compressed breast thickness.
Figure S-3. Distributions of errors in tumor MBI volume for , , and for the different tumor eccentricities () of 0 cm (left panel), 0.5 & 1.0 cm (middle panel), and 1.5 & 2.0 cm (right panel).