

Summary
Dysbiosis of the gut microbiome is implicated in the growing burden of non-communicable chronic diseases, including neurodevelopmental disorders, and both preclinical and clinical studies highlight the potential for precision probiotic therapies in their prevention and treatment. Here, we present an optimized protocol for the preparation and administration of Limosilactobacillus reuteri MM4-1A (ATCC-PTA-6475) to adolescent mice. We also describe steps for performing downstream analysis of metataxonomic sequencing data with careful assessment of sex-specific effects on microbiome composition and structure.
For complete details on the use and execution of this protocol, please refer to Di Gesù et al.1
Subject areas: Bioinformatics, Microbiology, Neuroscience, Sequence analysis
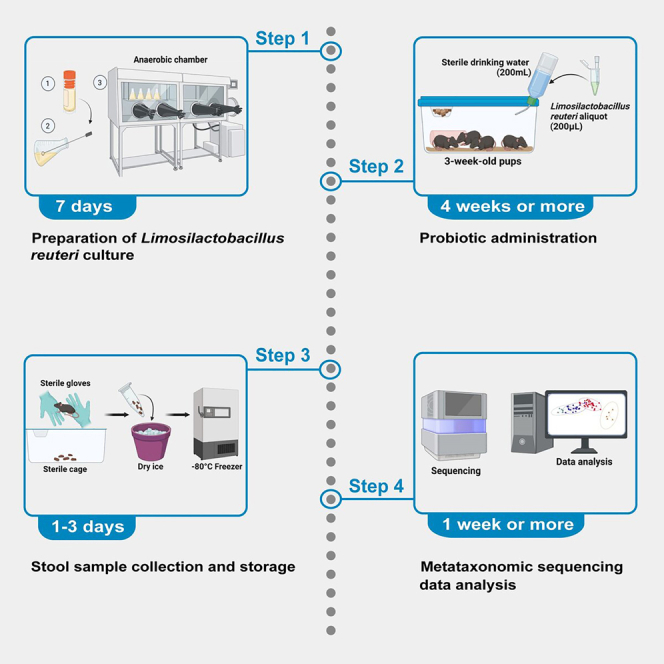
Graphical abstract
Highlights
-
•
Probiotics for precision targeting of the gut microbiome to improve health outcomes
-
•
Optimized preparation and administration of Limosilactobacillus reuteri to mice
-
•
Rigorous step-by-step analysis of metataxonomic sequencing data
-
•
Careful assessment of sex-specific effects on microbiome composition and structure
Publisher’s note: Undertaking any experimental protocol requires adherence to local institutional guidelines for laboratory safety and ethics.
Dysbiosis of the gut microbiome is implicated in the growing burden of non-communicable chronic diseases, including neurodevelopmental disorders, and both preclinical and clinical studies highlight the potential for precision probiotic therapies in their prevention and treatment. Here, we present an optimized protocol for the preparation and administration of Limosilactobacillus reuteri MM4-1A (ATCC-PTA-6475) to adolescent mice. We also describe steps for performing downstream analysis of metataxonomic sequencing data with careful assessment of sex-specific effects on microbiome composition and structure.
Before you begin
Gut microbiota are emerging as powerful regulators of host physiology, including immune function, metabolism, and brain function and behavior.2 Alterations in composition and structure of the gut microbiome, termed ‘dysbiosis’, induced by environmental factors such as diet, infections, and antibiotics play a key role in driving cellular and molecular mechanisms associated with disease. Mounting evidence suggests that dysbiosis of the maternal gut microbiome during pregnancy affects fetal development and sets the stage for chronic disorders later in life.3,4,5 Probiotics are ingestible live microorganisms that have the potential to remedy dysbiosis of the gut microbiome through a variety of mechanisms including restoration of intestinal barrier integrity,6 modulation of the immune response,7 and secretion of antimicrobial compounds.8,9,10 Therefore, both clinical and preclinical studies in the field of precision medicine have begun to explore probiotics as an approach for disease treatment and prevention.11 However, the rapidly expanding field of microbiome-targeting strategies is often characterized by inconsistent evidence of probiotic efficacy.12,13,14 Underpowered study design, variability of probiotic culture and administration methods, sequencing pipeline pitfalls such as contamination, and inconsistent reporting of microbiome dataset statistical analyses are some of the reasons behind conflicting results of probiotic studies, hindering the ability to compare outcomes. In this protocol, we provide guidance on how to obtain and orally administer a monospecies probiotic formulation, specifically Limosilactobacillus (L.) reuteri, collect stool samples, and analyze metataxonomic (16S ribosomal RNA gene amplicon) sequencing of the fecal microbiome in a murine mouse model. Use of an appropriate method for a priori power analysis is critical to determine the necessary sample size for the specific study design, which can be performed in software such as the freely accessible G∗Power 3 (https://www.psychologie.hhu.de/arbeitsgruppen/allgemeine-psychologie-und- arbeitspsychologie/gpower) or tools specifically designed for microbiome studies.15 Based on our recent work1 showing sex-based differences in remodeling of the gut microbiome in response to probiotic treatment, this protocol emphasizes the need to include both male and female subjects in probiotic studies and to account for sex as a key biological variable. Successful implementation of this approach will drive marked improvements in both mechanistic and therapeutic insights gained from preclinical investigations into host-microbe interactions modulating host health and disease and inform precision targeting of the gut microbiome to improve health outcomes.
Institutional permissions
Animal care and experimental procedures were approved by The University of Texas Medical Branch at Galveston Institutional Animal Care and Use Committee in accordance with all guidelines set forth by the U.S. National Institutes of Health.
Anaerobic preparation and storage of Limosilactobacillus (L.) reuteri
Timing: 7 days
The following steps outline how probiotic L. reuteri is obtained, cultured, and properly stored.
-
1.
Procure stocks of the strain(s) of interest from a commercial vendor or collaborator.
CRITICAL: Confirm strain identity via PCR or full-length 16S sequencing prior to use to avoid working with a misidentified strain.
Note: This protocol describes culture of probiotic species that are typical residents of the mammalian gut microbiome, including obligate and facultative anaerobes. Limosilactobacillus (L.) reuteri MM4-1A (ATCC-PTA-6475) is a facultative anaerobe. While it is possible to culture facultative anaerobes in an oxygenated environment, we recommend anaerobic culture of both facultative and obligate anaerobes. Gloved anaerobic gas chambers (See materials and equipment) make it possible to culture anaerobes in a typical wet laboratory environment.
-
2.Prepare the anaerobic chamber according to the instructions provided by the manufacturer (anaerobesystems.com).
-
a.Thoroughly clean surfaces inside the anaerobic chamber using 0.13% benzalkonium chloride solution.
-
b.Connect the pre-mixed anerobic gas (5% CO2, 5% H2, 90% N2 environment) tank using a gas regulator.
-
c.Fill the chamber with anaerobic gas, and set the integrated incubator temperature to 37°C.
-
a.
Note: Allow 5 h for the chamber to become anaerobic.
-
3.
Prepare 1 L of De Man, Rogosa and Sharpe (MRS) broth according to the instructions provided by the manufacturer. Heat-sterilize the growth media (moist heat; autoclave liquid cycle 121°C, 30 min).
Note: Prior to inoculation, media should be placed in the anaerobic chamber overnight (12 h) with caps loosened.
-
4.Prepare 1 L De Man, Rogosa and Sharpe (MRS) agar plates.
-
a.Dissolve MRS agar (See key resources table) in a 2 L flask containing 1 L purified water and an autoclavable magnetic stir bar according to the instructions provided by the manufacturer.
-
b.Autoclave at 121°C for 30 min.
-
c.Stir on a magnetic plate until cool enough to handle.
-
d.Using a biosafety cabinet, aseptically pour into polystyrene petri dishes (approximately 25 mL per plate) and allow to set for 30 min.
-
e.Once set, invert plates, slightly offset bottom from lid, and allow plates to dry for 1 h to avoid condensate.
-
f.Store plates inverted in plate sleeves at 4°C.
-
a.
-
5.Grow L. reuteri MM4-1A (ATCC-PTA-6475) in MRS media.
-
a.Inoculate strain by transferring the glycerol stock culture into 5 mL of sterile MRS broth according to ATCC handling procedures.
-
b.Grow bacteria anaerobically in MRS broth at 37°C for 24 h without shaking.
-
c.After 24 h, transfer 1 mL of the primary culture into 500 mL of sterile MRS broth.
-
d.Grow anaerobically at 37°C for 16–24 h without shaking until an OD600 = 0.6 is reached corresponding to the log growth phase.
-
e.Centrifuge 500 mL of L. reuteri culture at 5,000 × g for 20 min and discard supernatant.
-
a.
-
6.Prepare stock aliquots.
-
a.Suspend the cell pellet in a 50 mL conical centrifuge tube containing 50 mL sterile deoxygenated 1X PBS. For long-term storage, suspend in deoxygenated 1X PBS with an equal volume of filter-sterilized 30% glycerol.
-
i.Reserve 100 μL to confirm concentration (step 7) and freeze remainder at -80°C until further use.
-
i.
-
a.
Note: Suspensions can be stored in bulk in 50 mL conical centrifuge tubes, aliquoted into 15 mL conical centrifuge tubes, or aliquoted into 1.5 mL microcentrifuge tubes for ease of use during dosing.
Pause point: Long-term stock viability in deoxygenated 1X PBS with 15% glycerol (final concentration) stored at -80°C is typically indefinite but may vary by strain. Avoid multiple freeze-thaws. See “probiotic administration in drinking water” for dosing recommendations.
-
7.Determine stock concentration by performing a serial dilution.
-
a.Add the reserve 100 μL of L. reuteri stock from step 6 to a microcentrifuge tube containing 900 μL sterile deoxygenated 1X PBS.
-
b.Vortex for 30 s.
-
c.Serially dilute 9 times by continuing to transfer 100 μL into a new microcentrifuge tube containing 900 μL sterile deoxygenated 1X PBS, changing tips between tubes.
-
d.Plate 100 μL of diluents from 10-7 to 10-9 in triplicate on MRS agar plates using a cell spreader (See note on alternatives).
-
e.Grow anaerobically at 37°C for 48 h.
-
f.Enumerate colony forming units (CFU) from plated dilutions containing 30–300 colonies.
-
g.Back-calculate the concentration of bacteria in CFU/mL by multiplying by the dilution factor, including accounting for the original plated volume of 0.1 mL (i.e., [(# colonies × 10Dilution Factor) × 10].
-
a.
Note: Reagents requiring deoxygenation should be placed in the anaerobic chamber overnight (12 h).
Alternatives: Spot plating 10 μL in triplicate may also be used to determine stock concentration.16
Key resources table
| REAGENT or RESOURCE | SOURCE | IDENTIFIER |
|---|---|---|
| Bacterial and virus strains | ||
| Limosilactobacillus reuteri Strain MM4-1A | ATCC | Cat# PTA-6475™ |
| Chemicals, peptides, and recombinant proteins | ||
| De Man, Rogosa, and Sharpe (MRS) Media | MilliporeSigma | Cat# MHA00MRS2 |
| De Man, Rogosa, and Sharpe (MRS) Agar | MilliporeSigma | Cat# 110660 |
| Glycerol | Sigma-Aldrich | Cat# G5516 |
| Phosphate buffered saline, 10X Solution | Thermo Fisher | Cat# BP3991 |
| 5% H2, 5% CO2, 90% N2 anaerobic gas mixture | Linde Gas & Equipment, Praxair Distribution | Cat# BI NICDHYC1-K |
| Anaerobe Systems Anaerobic Chamber Cleaner (Benzalkonium Chloride 0.13% solution) | Thermo Fisher | Cat# NC0195813 |
| Critical commercial assays | ||
| MagAttract PowerSoil DNA Kit | Qiagen | Cat# 27100-4-EP |
| Power SYBR Green PCR Master Mix | Thermo Fisher | Cat# 4368577 |
| Experimental models: Organisms/strains | ||
| 3-week-old weanling male and female C57BL/6N mice | Taconic Biosciences | Cat# B6-M; Cat# B6-F |
| Deposited data | ||
| Deposited data I | Di Gesù, Matz et al., Cell Rep 20221 | BioProject Accession: PRJNA878523 |
| Deposited data I | Di Gesù, Matz et al., Cell Rep 20221 | https://data.mendeley.com/datasets/z6wz8kpk3n/1 |
| Software and algorithms | ||
| Prism 9.0 | GraphPad | https://www.graphpad.com/scientific-software/prism |
| Adobe Illustrator CS6 | Adobe | https://www.adobe.com |
| Miseq Software | Illumina | https://support.illumina.com/sequencing/sequencing_software/miseq_reporter/downloads.html |
| R | The R Foundation | https://www.r-project.org/about.html |
| RStudio | R Studio | https://rstudio.com/ |
| Galaxy Computation Tool | Huttenhower Lab | http://huttenhower.sph.harvard.edu/galaxy |
| Agile Toolkit for Incisive Microbial Analyses (ATIMA2) Platform | Petrosino Lab | https://atima.research.bcm.edu |
| Other | ||
| Avanti J-26 XP Centrifuge or other floor centrifuge | Beckman Coulter | Cat# B14535 |
| J-LITE JLA-8.1000 Fixed-Angle Aluminum Rotor | Beckman Coulter | Cat# 363688 |
| Removable 1 L canisters | Beckman Coulter | Cat# 363686 |
| Gloveless anaerobic chamber with plate incubator | Anaerobe Systems | AS-580 |
| CGA-350 gas regulator | Anaerobe Systems | B480007 |
| Combustible gas detector | Extech | EZ40 |
| Anaerobic atmosphere indicator | Thermo Fisher | Cat# R684002 |
| Petri plates (100 mm × 15 mm) | Thermo Fisher | Cat# FB0875713 |
| L-Shaped Cell Spreaders | Thermo Fisher | Cat# 14-665-230 |
| 1.7 mL RNase- and DNase-free microcentrifuge tubes | VWR | Cat # 87003-294 |
| Magnetic stir bar | VWR | Cat# 58948-171 |
| Individually packaged Kimtech™ sterile nitrile gloves | Kimberly-Clark | Cat# 11823 |
| BioTek Epoch Microplate Spectrophotometer | Agilent | Agilent.com |
Materials and equipment
Equipment: In the paper associated with this protocol (Di Gesù, Matz et al., Cell Rep 20221), we used the Anaerobe Systems AS-580 gloveless anaerobic chamber with an integrated 580-plate incubator (https://anaerobesystems.com/products/anaerobic-chambers/) for culture of L. reuteri. Alternative commercial sources for anaerobic chambers include Coy Lab Products (https://coylab.com/products/anaerobic-chambers/) and Sheldon Manufacturing (https://www.sheldonmanufacturing.com/anaerobic-chambers). To detect the presence of anaerobic gas flow into the surrounding environment we used the EzFlex EZ40 Combustion Gas Detector from EXTECH Instruments (https://www.flir.com/products/ez40/?vertical=condition+monitoring&segment=solutions). Optical density (OD) can be monitored using a spectrophotometer.
Step-by-step method details
Probiotic administration in drinking water
These steps describe details of mouse caging, housing, and daily probiotic administration.
-
1.Confirm viability of the strain of interest in drinking water.
-
a.Viability of bacteria in water can be established by determining the concentration of viable bacteria in drinking water immediately post-inoculation and at the end of desired treatment period.
-
a.
Note: As we previously demonstrated,17L. reuteri MM4-1A (ATCC-PTA-6475) is viable in pH-sterilized drinking water, losing approximately one order of magnitude in CFU/mL over a 24-h period.
Note: See step 7 under “Anaerobic preparation and storage of Limosilactobacillus reuteri” for determining viability.
Note: If the bacterial species of interest is not viable in water, alternative methods of strain delivery include oral gavage or use of an alternative delivery vehicle, such as sugar-free applesauce [as used by Hsiao et al. to deliver Bacteroides fragilis18]. Researchers should carefully consider their experimental design and tailor this protocol to fit their strain of interest and animal model.
Note: The method used to sterilize drinking water is an environmental factor that may alter the results of an experiment. We have observed reproducible results across institutions using a maternal high-fat diet model for the effects of maternal overnutrition on offspring health outcomes when L. reuteri is suspended in drinking water sterilized by either reverse osmosis or acidification (pH 2.0).
-
2.Obtain 3-week-old weanling male and female mice of the desired genotype.
-
a.Cage subjects according to sex and experimental group.
-
b.Maintain mice at the appropriate animal biosafety level (ABSL1 for L. reuteri) under specific pathogen-free (SPF) conditions and keep on a 12-h light/dark cycle in polysulfone cages with access to sterile food and treated water ad libitum.
-
a.
-
3.Add strain of interest to sterile water of experimental cages.
-
a.Thaw the required number of L. reuteri aliquots based on the number of cages for each treatment day.
-
b.Refresh treated water daily 2 h prior to the start of the dark cycle to reduce variation in probiotic exposure.
-
c.Continue treatment for at least four weeks before and throughout behavioral assessment until time of tissue collection.
-
a.
Note: In the paper associated with this protocol, we added 200 μL of L. reuteri at a stock concentration of 1011 CFU/mL to mouse water bottles containing 199.8 mL sterile drinking water.
Note: Probiotic administration over a period of four weeks allows for stabilization of the gut microbial ecosystem in response to the probiotic administration prior to assessment of probiotic efficacy.
Stool sample collection for analysis of microbiome community structure
Described here is the procedure for aseptic collection of fecal samples to characterize the fecal microbiota via 16S ribosomal RNA (rRNA) gene amplicon sequencing.
-
4.Collect stool samples from 7–8-week-old mice (consider a minimum of 5 min per mouse).
-
a.Pre-label a sterile (autoclaved) 1.7 mL RNase- and DNase-free microcentrifuge tube for each subject.
-
b.Open sterile packaging of sterile gloves and place in an empty autoclaved cage to cover the cage bottom.
-
c.Allow mouse to defecate during handling with sterile gloves.
-
i.Collect at least two fecal pellets per animal by collecting directly into the microcentrifuge tube or from the sterile glove packaging.
-
i.
-
d.Close the microcentrifuge tube securely and snap-freeze on dry ice immediately upon collection to maintain specimen integrity.
-
a.
Note: We find that fecal pellet collection takes less time (roughly 5 min per mouse) on the first day of handling compared to subsequent days as the animals acclimate to being handled.
Note: Within a given study, it is recommended that samples be collected around the same of day, as circadian rhythms are known to impact microbiome composition.20
Note: In Di Gesù, Matz et al. Cell Rep (2022),1 we collected murine fecal samples at a single timepoint prior to behavioral assessment. However, longitudinal assessment may also be considered.
Note: Given that the distribution of microbial species differs along the gastrointestinal (GI) tract,21 endpoint collection of GI contents from specific segments may be considered if readers wish to interrogate regional differences in microbiome composition and community structure upon probiotic treatment.
Analysis of metataxonomic sequencing data
Variable regions within the 16S ribosomal RNA gene are used to assign phylogenetic affiliation to prokaryotic organisms. What follows is a description of the statistical methods used to analyze the 16S rRNA gene amplicon (metataxonomic) sequencing dataset once DNA extraction, 16S amplicon library generation, library sequencing, and data pre-processing for quality control, demultiplexing, and trimming are complete (see22). This protocol enables the investigation of both composition (within-sample, or alpha-, diversity) and community structure (between-sample, or beta-, diversity) of the bacterial component of the microbiome in discrete experimental groups. Additional guidance is provided to assess differentially abundant bacterial taxa (e.g., at the genus level).
Note: In this protocol, bacterial DNA extraction and metataxonomic sequencing was performed by the Alkek Center for Metagenomics and Microbiome Research at Baylor College of Medicine to ensure high quality standards for sample processing. Protocols used were adapted from those established for the NIH-Human Microbiome Project.23 Protocol details can be found in Di Gesù, Matz et al. Cell Rep (2022).1 A custom script was used to construct a rarefied OTU or ASV table from the output files generated in the sequencing pipeline, and downstream analysis of alpha-diversity, beta-diversity, and phylogenetic trends was performed using the Agile Toolkit for Incisive Microbial Analyses (ATIMA2) web platform (https://atima.research.bcm.edu). Visit the Tutorials tab in ATIMA for an instructions guide.
Alternatives: An alternative web-based platform, such as Microbiome analyst24 (https://www.microbiomeanalyst.ca) can be used to perform statistical analysis and visualization of common datasets from microbiome studies.
-
5.In ATIMA or an alternative microbiome analysis platform, upload sequencing dataset.
-
a.In ATIMA, upload sequencing dataset as a .biom file.
-
b.In ATIMA, select Option >> Rarefaction to visualize rarefaction curves and, if needed, adjust rarefaction depth.
-
a.
-
6.Analyze alpha-diversity metrics: Observed OTUs (Operational Taxonomic Units), Chao1 index, Shannon index, and Inverse Simpson index.25
-
a.In ATIMA under the Options >> Export tab, export the rarified alpha-diversity values for each mouse/sample and import them into a statistical analysis program such as GraphPad’s Prism (https://www.graphpad.com/):
-
i.Create a column-formatted data table.
-
ii.Remove outliers using Grubbs’ test with alpha = 0.05.
-
iii.For comparison of two experimental groups, analyze data with the appropriate t test or nonparametric test as determined by normality tests.
-
iv.For comparisons between three or more groups, use a one-way ANOVA or nonparametric test.
-
i.
-
b.To examine cage and/or litter effects, alpha-diversity can be analyzed using a nested analysis while still visualized as column data:
-
i.Create a nested data table where each sub-column contains values for one cage and/or litter, grouped by treatment.
-
ii.Analyze data using a nested t-test to compare two groups or a nested one-way ANOVA to compare three or more groups. In addition to the p-value assigned to the test, a chi-square test is performed to determine if sub-columns (litters) differ significantly within each column (treatment group), indicating the presence of litter effects.
-
i.
-
c.Graph results as columns with individual values and plot mean with SEM or SD.
-
i.Use different symbols to distinguish sex (i.e., triangles for females, circles for males) or sexes combined (i.e., diamonds)and different colors to indicate treatment, generations, etc.
-
ii.Always include error bars and p-values or asterisks (see Figure 3).
-
i.
-
a.
Note: See Love et al., STAR Protocols (2022) for an excellent step-by-step protocol for microbial DNA isolation, metataxonomic sequencing, and data pre-processing.22
Note: The total number of sequence reads defines the library size for each sample. Given that library size is not uniform across samples, even within the same sequencing run, normalization approaches are required to compare taxa diversity, distribution, and phylogenetic relationships between different samples to obtain biologically meaningful information. In the publication associated with this protocol, we used rarefaction as the normalization tool which randomly subsamples reads from the library to a defined sequencing depth, thus defining a standardized library size across all the samples. Limitations of subsampling include exclusion of a random amount of the observed sequences which may impact diversity analysis.26 The process of choosing a read depth is based on the rarefaction curve (Figure 1). Determining whether a defined sequencing depth is adequate to capture a sufficient proportion of the diversity in the samples without omitting samples with low library size is often specific to the dataset on hand. We recommend verifying that the rarefaction curve of a certain alpha-diversity metric plateaus at the library size selected, indicating sufficient saturation of the dataset.
Note: In the publication associated with this protocol, the UPARSE algorithm27 was used to cluster 16S rRNA gene sequences into OTUs based on a similarity cutoff value of 97%. This approach minimizes the effect of sequencing errors in downstream diversity calculations.28 Alternatively, non-cluster based approaches can be applied to amplicon sequence variants (ASV) reconstructed through “denoising” pipelines, such as Deblur.29 For in an in-depth review of sequence error-correction approaches, see Nearing et al.30 (2018).
Note: Distinct alpha-diversity metrics are relevant to specific properties of gut microbiome composition and highlight different aspects of the intrasample variation, such as richness (number of taxa), evenness (distribution of taxa abundances), or both.31 We recommend using and reporting multiple alpha-diversity metrics in microbiome studies.
Note: Simpson’s index includes values ranging from 0 to 1, with 0 representing the highest (infinite) diversity and 1 representing a complete absence of diversity. Therefore, Simpson’s index negatively correlates with species diversity. For this reason, Simpson’s index is often reported as its inverse (1/D), the ‘Inverse Simpson index.’
Note: For more detailed information on statistical analyses in Prism 9 (including nested analyses), refer to the GraphPad Prism statistics guide.32 Alternative software packages for graphing and data analysis, such as SYSTAT’s SigmaPlot (https://systatsoftware.com/sigmaplot/), can be used.
Note: Outliers identified by Grubbs’ test for a specific alpha- or beta-diversity metric must be excluded from all other metrics.
Note: For each alpha-diversity metric, choose left Y-axis range between 0 and n based on the highest value in the entire dataset.
Note: We do not recommend combining datasets from samples processed in separate sequencing runs, given interexperimental variability.
-
7.Perform ordination analysis for beta-diversity to calculate and visualize the statistically significant changes in the murine gut microbiome community between two or more experimental groups.
-
a.In ATIMA or other microbiome analysis platform, measure phylogenetic distances between sets of taxa via the UniFrac method, both weighted and unweighted.33
-
i.In ATIMA, select the Options >> Metadata tab to add the metadata to identify individual samples and experimental groups.
-
ii.Select the Beta Diversity >> Ordination tab to visualize calculated UniFrac distances by principal coordinate analysis (PCoA), which identifies the variance explained by each principal coordinate. Select UniFrac as distance metric and PCoA as ordination method.
-
iii.Use the Color by, Shape by, Facet by, and Limit by functions to visualize individual data points representing discrete samples according to group affiliation.
-
iv.Identify the 95% confidence interval of those groups using the ellipse function. Display centroids to show the centers of the sample clusters.
-
i.
-
a.
Note: ATIMA2 will apply permutational multivariate analysis of variance (PERMANOVA) for statistical analysis of the datasets.
Note: Unweighted UniFrac distance is binary, considering only the presence or absence of OTUs or ASVs (proxies for taxa), while weighted UniFrac distance is calculated by considering species abundance, weighing the phylogenetic branch length with differential abundance. The first method is useful in detecting changes of low abundance taxa, while weighted UniFrac has a higher sensitivity in detecting changes in abundant taxa. Both UniFrac approaches should be used to investigate differences in microbiome community structures.
Note: In ATIMA2, it is possible to choose alternative distance metrics including Jaccard, Bray-Curtis, Manhattan, or Euclidean.
Note: Other non-phylogenetic-based metrics are commonly used in beta-diversity analysis of community structures. Among these are the OTU-based metrics Jaccard and Bray-Curtis, which consider each OTU as a separate entity without taking taxonomy and phylogenetic relationship into account. Unlike UniFrac, these methods assume that all members of the microbial community are equivalently related to each other. However, it must be considered that UniFrac is more sensitive to low abundance and phylogenetically distant OTUs.34
Note: In addition to Principal Coordinate Analysis (PCoA), non-metric multidimensional scaling (NMDS) is one of the most frequently used ordination methods to visually explore dissimilarity matrices based on beta-diversity metrics. However, in PCoA, the ordination obtained matches the actual distance between samples, instead of its rank order. Both PCoA and NMDS ordination methods can be used to obtain 2D and 3D plots of the dataset. The main difference between 2D PCoA and 3D PCoA is the number of dimensions (i.e., axes) used for plotting. If the first two axes explain most of the variation, third or n+1 dimensions are not necessary.
Note: PERMANOVA tests if the centroids, or means, of each group are significantly different from each other. Additionally, a R2 statistic is calculated, showing the percentage of the variance explained by the groups.
-
8.Apply Linear Discriminant Analysis (LDA) Effect Size (LEfSe) to identify differentially abundant bacterial taxa using a program like Galaxy 2.0 (http://galaxy.biobakery.org).35
-
a.Obtain from ATIMA rarefied abundance matrices with taxonomic classifications at the genus level under the Options >> Export tab.
-
b.Prepare a tab-delimited input file consisting of a list of numerical features, the class vector, and optionally the subclass and subject vectors (Figure 2).
-
c.Upload the input file using Galaxy’s "Get-Data/Upload-file” function.
-
d.Use the “Format Data for LEfSe” function to select if the features (classes and subclasses) and metadata information (subjects) are listed in columns or rows.Note: The “Format Data for LEfSe” function offers the option to normalize the sum of the values to 1M, which is recommended when very low values are present. If the samples are already normalized and do not represent absolute OTU counts, selecting this option will multiply the values by 1M.
-
e.Use the “LDA Effect Size (LEfSe)” function to perform the analysis using the data formatted in the previous step.Note: Distribution-free (non-parametric) factorial Kruskal-Wallis (KW) sum-rank test is used to identify features (or taxa) with statistically different abundance among classes. If subclasses were indicated, the (unpaired) Wilcoxon rank-sum test is run to test if differentially abundant features identified among classes are also consistent with biologically significant categories (subclasses). In the absence of subclasses, LEfSe performs both KW and Wilcoxon between classes. Alpha values must be selected for both the KW and the Wilcoxon tests. Features passing the Wilcoxon test are identified as biomarkers. The Linear Discriminant Analysis (LDA) is performed based on the specific subset of vectors (biomarkers/taxa) obtained, in which features are ranked based on the relative differences among the classes. The LDA model provides an estimate of the feature's effect size reported as an LDA score. The threshold on the logarithmic LDA score for biomarkers is set to 2.0 by default but can be increased to be more stringent.Note: A different strategy is required when more than two classes are used. In this case, the user must set the strategy for multi-class analysis. Two options are offered: the all-against-all and the one-against-all strategies. For the first, which is more stringent, all the n abundance profiles of a certain feature must be statistically significant among all the classes. The second requires that at least one class is statistically different from the others for that specific feature.
-
f.Data can be visualized with the “Plot LEfSe Results” function, where text, labels, and graphical options can be customized.Note: The “Plot LEfSe Results” function will provide a column bar graph in which significant features identified by LEfSe are ranked based on their LDA score and color-matched with the class with the highest median for each specific feature. Alternatively, from the “LDA Effect Size (LEfSe)” function, data can be downloaded as tab-delimited file and imported into Prism. Statistically significant features, i.e., taxa, can be represented in a column bar graph.
-
g.Use the “Plot Cladogram” function to obtain a cladogram showing the taxa identified by the “LDA Effect Size (LEfSe)” function with taxonomic levels from phylum to genus represented by rings. Text, labels, and graphical options can be customized.Note: To obtain the cladogram, the original input file must include the taxonomic description (denoted with "|" in the input file, see Figure 2).Note: LEfSe analysis steps described here can be easily adapted for rarefied abundance matrices where OTUs are used as the taxonomic level.
-
a.
Figure 3.

Visualization of sex-specific effects of probiotic administration on alpha-diversity metrics of the gut microbiome
(A–H) Alpha-diversity metrics for regular versus maternal high-fat diet lineage F2 mice treated with anaerobically cultured (as described above) L. reuteri in Di Gesù et al. Cell Rep (2022).1 Note, the analysis identified a differential effect of L. reuteri treatment on female (bottom triangles, “L. reuteri, Female”) versus male (top circles, “L. reuteri, Male”) F2 MHFD descendants. Error bars represent mean ± SEM. Symbols represent individual murine samples. P < 0.05 is considered significant, where ∗p < 0.05, ∗∗p < 0.01, ∗∗∗p < 0.001, and ∗∗∗∗p < 0.0001.
Figure 1.

Rarefaction curves of alpha-diversity indices and plot of retained samples and reads
Examples of rarefaction curves of (A) observed OTUs and (B) Shannon index, and plots of (C) samples retained from total number of samples for a given rarefaction depth and (D) reads retained from total number of sequencing reads for a given rarefaction depth. Example curves and plots obtained from the ATIMA2 web platform (https://atima.research.bcm.edu).
Figure 2.

Galaxy LEfSe tab-delimited input file with hierarchical structure
Example input file containing defined class, subclass, and subject vectors are identified by a name (maternaldiet, sex, and id, respectively) and a series of non-numerical strings (MHFD/MRD, male/female, and 1–10, respectively). Features with hierarchy are listed in rows.
Expected outcomes
In the publication associated with this protocol,1 we administered L. reuteri to male and female second-generation (F2) offspring of regular or high-fat diet-fed dams, a mouse model associated with gut dysbiosis and behavioral deficits. Following overnight incubation in 500 mL of MRS broth, the washed L. reuteri cells are resuspended in 50 mL of deoxygenated 1X PBS resulting in a concentrate of OD600nm ≅ 10 and roughly 1010 CFU/mL. Figures below represent the results of metataxonomic sequencing analysis. Comparisons shown throughout the figures are based on maternal diet and offspring sex and are built on rarefied datasets.
Alpha-diversity metrics shown in Figure 3 include total number of observed OTUs (richness), Chao1 index (a richness estimator based on counts of detected rare species, i.e., singletons and doubletons),36 Shannon index (a diversity estimator which combines both taxa richness and evenness of taxa distribution), and Inverse Simpson index (a diversity estimator in which evenness is considered more than richness). The multi-metric approach used in this protocol allows for a comprehensive and accurate investigation of the “within-sample” diversity of gut microbial communities.
Beta-diversity metrics shown in Figure 4 include PCoA plots based on weighted and unweighted UniFrac distances by sex. Samples displayed closer together show a higher degree of similarity, and each axis reflects the percentage of the variance explained. Visualization of plots with 95% confidence intervals (indicated by ellipses) and p-values (obtained by applying the PERMANOVA method) aid the identification of statistically significant clusters between experimental groups. For a comprehensive analysis of microbial communities, it is recommended to apply a variety of weighted and unweighted beta-diversity measurements (e.g., UniFrac, Jaccard, and Bray-Curtis) to improve the identification of differences in community structure.37
Figure 4.

Visualization of sex-specific effects of probiotic administration on beta-diversity metrics of the gut microbiome
(A) Principle coordinate analysis (PCoA) plots from fecal samples of L. reuteri-treated MRD (blue) or MHFD (orange) F2 offspring based on calculated unweighted (A, males; B, females) and weighted (C, males; D, females) UniFrac distances displaying beta-diversity metrics in Di Gesù et al. Cell Rep (2022).1 Ellipses indicate 95% confidence intervals, while phylogenetic distances are represented by distance from the centroid. P-values and R2 value are reported at the top of each plot. Note, the analysis identified a differential effect of L. reuteri on female versus male MHFD descendants.
In Figure 5, Histograms of the LDA scores (log10) computed for genus-level taxa with differential abundance in L. reuteri-treated mice by sex allow for the identification of taxa most likely to explain the biological differences between groups. Bar magnitudes represent the effect size and therefore the relative influence of a given biomarker or taxa. LEfSe statistical analysis was performed using R scripts integrated in the Galaxy web platform.
Figure 5.

Visualization of genus-level bacterial taxa differentially enriched in the experimental groups identified by linear discriminant analysis (LDA) effect size (LEfSe) algorithm
LEfSe plots were originally generated in Galaxy, then transferred to Prism for proper group affiliation color-coding, identifying differential taxa between L. reuteri-treated groups of (A) males and (B) females in Di Gesù, Matz et al. Cell Rep (2022).
Quantification and statistical analysis
Methods used for data processing, quantification, and statistical analysis of 16S rRNA gene amplicon sequencing datasets are fully described in the published article associated with this protocol.1 Raw data is available as a Mendeley Dataset (https://data.mendeley.com/datasets/z6wz8kpk3n/1), as detailed below.
Limitations
This protocol was established with a focus on the probiotic species Limosilactobacillus reuteri. Although it is possible to adapt this protocol to other probiotic species, we recommend verifying specific requirements for the strain of interest. This protocol also describes the analysis of metataxonomic sequencing datasets obtained through 16S rRNA gene amplicon sequencing for the investigation of the bacterial component of the microbiome exclusively, and thus does not consider other microorganisms living in the gut, such as commensal populations of fungi and viruses. While microbiome research primarily focuses on the study of the bacterial composition of the microbiome, recent efforts have begun to characterize the functional role of these non-bacterial communities, and to develop methods for data acquisition and analysis, which will improve future studies.38,39
Troubleshooting
Problem 1
Failure to obtain adequate culture density.
Potential solutions
-
•
To address issues with adequate culture density, consider both the type of growth media used as well as the duration of growth. Depending on the bacterial species of interest, it may be necessary to use an alternative growth media for anaerobic culture. While L. reuteri thrives in MRS broth, other species, like those in genera Streptococcus, grow best in BHI (Brain Heart Infusion) broth (Millipore Sigma #110493).
-
•
Likewise, it is recommended that an anaerobic growth curve (based on UV/Vis absorbance values; a sigmoidal shape should be obtained) be generated for each strain of interest to identify the exponential growth phase, at which harvest is optimal.
Problem 2
Samples with very low library size.
Potential solutions
-
•
When a high proportion of samples have a low library size and a rarefaction curve of a chosen alpha-diversity metric that does not plateau, alpha-diversity estimation may not be accurate. Multiple factors can affect sample library size, including DNA extraction and sequencing efficiency. If the chosen DNA extraction and sequencing pipeline was previously optimized and validated, alternative approaches26 for sample normalization can be used based on the characteristics of the dataset.
Resource availability
Lead contact
Further information and requests for resources and reagents should be directed to and will be fulfilled by the lead contact, Shelly A. Buffington (shelly.buffington@bcm.edu).
Materials availability
No newly generated materials are associated with this protocol.
Data and code availability
The protocol does not include all datasets generated or analyzed during this study (Di Gesù, et al.1). We provide the following information about data and code availability:
-
•
Deposited data I. The accession number for the 16S rRNA gene amplicon sequencing data reported in the associated paper is NCBI Sequence Read Archive. BioProject Accession: PRJNA878523.
-
•
Deposited data II. The original, unprocessed data reported in the published paper associated with this protocol is published as a Mendeley Dataset: https://data.mendeley.com/datasets/z6wz8kpk3n/1
-
•
Neither this protocol nor the associated paper1 report original code.
Any additional information required to reanalyze the data reported in this paper is available from the lead author upon request.
Acknowledgments
Research reported in this publication was supported with funding from the National Institutes of Health (R01HD109095), the Brain and Behavior Research Foundation (NARSAD Young Investigator Grant 28298), the Scott-Gentle Foundation, the UTMB Institute for Human Infections and Immunity, and the Gulf Coast Center for Precision Environmental Health (via Center Core Grant from the National Institute for Environmental Health Sciences of the National Institutes of Health [NIH] under award no. P30ES030285), to S.A.B. Salary support for L.M.M. during a portion of the project was provided by NIH 1T32AG067952-01 (UTMB Mitchell Center for Neurodegenerative Diseases). The content is solely the responsibility of the authors and does not necessarily represent the official views of the NIH.
We would like to acknowledge The Alkek Center for Metagenomics and Microbiome Research (CMMR) at Baylor College of Medicine—particularly Drs. Daniel P. Smith, Sara J. Javornik Cregeen, Kristi L. Hoffman, and Joseph F. Petrosino—for creation and maintenance of the ATIMA2 platform, RNA extraction, and 16S rRNA gene amplicon sequencing in the accompanying study.1 Figures were created using Adobe Illustrator and schematics using BioRender (BioRender.com; publication and licensing rights agreement QR23HLBKNP).
Author contributions
Conceptualization, C.M.D.G., R.F., S.A.B.; Formal Analysis, C.M.D.G., R.F., L.M.M., I.J.B., S.A.B.; Investigation, C.M.D.G., R.F., L.M.M., I.J.B.; Writing, C.M.D.G., L.M.M., R.F., S.A.B.; Revising, L.M.M., C.M.D.G., S.A.B.; Funding Acquisition, S.A.B.
Declaration of interests
S.A.B. is an inventor on a patent granted to Baylor College of Medicine related to the use of Limosilactobacillus reuteri for treating disorders characterized by social dysfunction (US Patent No. 11135252).
References
- 1.Di Gesù C.M., Matz L.M., Bolding I.J., Fultz R., Hoffman K.L., Gammazza A.M., Petrosino J.F., Buffington S.A. Maternal gut microbiota mediate intergenerational effects of high-fat diet on descendant social behavior. Cell Rep. 2022;41 doi: 10.1016/j.celrep.2022.111461. [DOI] [PMC free article] [PubMed] [Google Scholar]
- 2.Sommer F., Bäckhed F. The gut microbiota--masters of host development and physiology. Nat. Rev. Microbiol. 2013;11:227–238. doi: 10.1038/nrmicro2974. [DOI] [PubMed] [Google Scholar]
- 3.Jašarević E., Bale T.L. Prenatal and postnatal contributions of the maternal microbiome on offspring programming. Front. Neuroendocrinol. 2019;55 doi: 10.1016/j.yfrne.2019.100797. [DOI] [PubMed] [Google Scholar]
- 4.Mueller N.T., Bakacs E., Combellick J., Grigoryan Z., Dominguez-Bello M.G. The infant microbiome development: mom matters. Trends Mol. Med. 2015;21:109–117. doi: 10.1016/j.molmed.2014.12.002. [DOI] [PMC free article] [PubMed] [Google Scholar]
- 5.Di Gesù C.M., Matz L.M., Buffington S.A. Diet-induced dysbiosis of the maternal gut microbiome in early life programming of neurodevelopmental disorders. Neurosci. Res. 2021;168:3–19. doi: 10.1016/j.neures.2021.05.003. [DOI] [PMC free article] [PubMed] [Google Scholar]
- 6.Krumbeck J.A., Rasmussen H.E., Hutkins R.W., Clarke J., Shawron K., Keshavarzian A., Walter J. Probiotic Bifidobacterium strains and galactooligosaccharides improve intestinal barrier function in obese adults but show no synergism when used together as synbiotics. Microbiome. 2018;6:121. doi: 10.1186/s40168-018-0494-4. [DOI] [PMC free article] [PubMed] [Google Scholar]
- 7.Jia D.J.C., Wang Q.W., Hu Y.Y., He J.M., Ge Q.W., Qi Y.D., Chen L.Y., Zhang Y., Fan L.N., Lin Y.F., et al. Lactobacillus johnsonii alleviates colitis by TLR1/2-STAT3 mediated CD206(+) macrophages(IL-10) activation. Gut Microb. 2022;14 doi: 10.1080/19490976.2022.2145843. [DOI] [PMC free article] [PubMed] [Google Scholar]
- 8.Shelby R.D., Mar P., Janzow G.E., Mashburn-Warren L., Tengberg N., Navarro J.B., Allen J.M., Wickham J., Wang Y., Bailey M.T., et al. Antibacterial and anti-inflammatory effects of Lactobacillus reuteri in its biofilm state contribute to its beneficial effects in a rat model of experimental necrotizing enterocolitis. J. Pediatr. Surg. 2022;57:1382–1390. doi: 10.1016/j.jpedsurg.2021.09.001. [DOI] [PubMed] [Google Scholar]
- 9.Spinler J.K., Auchtung J., Brown A., Boonma P., Oezguen N., Ross C.L., Luna R.A., Runge J., Versalovic J., Peniche A., et al. Next-generation probiotics targeting Clostridium difficile through precursor-directed antimicrobial biosynthesis. Infect. Immun. 2017;85 doi: 10.1128/IAI.00303-17. [DOI] [PMC free article] [PubMed] [Google Scholar]
- 10.Urrutia-Baca V.H., Escamilla-García E., de la Garza-Ramos M.A., Tamez-Guerra P., Gomez-Flores R., Urbina-Ríos C.S. In vitro antimicrobial activity and downregulation of virulence gene expression on Helicobacter pylori by reuterin. Probiotics Antimicrob. Proteins. 2018;10:168–175. doi: 10.1007/s12602-017-9342-2. [DOI] [PubMed] [Google Scholar]
- 11.Sanders M.E., Merenstein D.J., Reid G., Gibson G.R., Rastall R.A. Probiotics and prebiotics in intestinal health and disease: from biology to the clinic. Nat. Rev. Gastroenterol. Hepatol. 2019;16:605–616. doi: 10.1038/s41575-019-0173-3. [DOI] [PubMed] [Google Scholar]
- 12.Dehghani F., Abdollahi S., Shidfar F., Clark C.C.T., Soltani S. Probiotics supplementation and brain-derived neurotrophic factor (BDNF): a systematic review and meta-analysis of randomized controlled trials. Nutr. Neurosci. 2022;1:1–11. doi: 10.1080/1028415X.2022.2110664. [DOI] [PubMed] [Google Scholar]
- 13.Siafis S., Çıray O., Wu H., Schneider-Thoma J., Bighelli I., Krause M., Rodolico A., Ceraso A., Deste G., Huhn M., et al. Pharmacological and dietary-supplement treatments for autism spectrum disorder: a systematic review and network meta-analysis. Mol. Autism. 2022;13:10. doi: 10.1186/s13229-022-00488-4. [DOI] [PMC free article] [PubMed] [Google Scholar]
- 14.Kelly J.R., Allen A.P., Temko A., Hutch W., Kennedy P.J., Farid N., Murphy E., Boylan G., Bienenstock J., Cryan J.F., et al. Lost in translation? The potential psychobiotic Lactobacillus rhamnosus (JB-1) fails to modulate stress or cognitive performance in healthy male subjects. Brain Behav. Immun. 2017;61:50–59. doi: 10.1016/j.bbi.2016.11.018. [DOI] [PubMed] [Google Scholar]
- 15.Ferdous T., Jiang L., Dinu I., Groizeleau J., Kozyrskyj A.L., Greenwood C.M.T., Arrieta M.C. The rise to power of the microbiome: power and sample size calculation for microbiome studies. Mucosal Immunol. 2022;15:1060–1070. doi: 10.1038/s41385-022-00548-1. [DOI] [PubMed] [Google Scholar]
- 16.Whitmire J.M., Merrell D.S. Successful culture techniques for Helicobacter species: general culture techniques for Helicobacter pylori. Methods Mol. Biol. 2012;921:17–27. doi: 10.1007/978-1-62703-005-2_4. [DOI] [PubMed] [Google Scholar]
- 17.Buffington S.A., Di Prisco G.V., Auchtung T.A., Ajami N.J., Petrosino J.F., Costa-Mattioli M. Microbial reconstitution reverses maternal diet-induced social and synaptic deficits in offspring. Cell. 2016;165:1762–1775. doi: 10.1016/j.cell.2016.06.001. [DOI] [PMC free article] [PubMed] [Google Scholar]
- 18.Hsiao E.Y., McBride S.W., Hsien S., Sharon G., Hyde E.R., McCue T., Codelli J.A., Chow J., Reisman S.E., Petrosino J.F., et al. Microbiota modulate behavioral and physiological abnormalities associated with neurodevelopmental disorders. Cell. 2013;155:1451–1463. doi: 10.1016/j.cell.2013.11.024. [DOI] [PMC free article] [PubMed] [Google Scholar]
- 19.Preidis G.A., Saulnier D.M., Blutt S.E., Mistretta T.A., Riehle K.P., Major A.M., Venable S.F., Finegold M.J., Petrosino J.F., Conner M.E., Versalovic J. Probiotics stimulate enterocyte migration and microbial diversity in the neonatal mouse intestine. FASEB J. 2012;26:1960–1969. doi: 10.1096/fj.10-177980. [DOI] [PMC free article] [PubMed] [Google Scholar]
- 20.Liang X., Bushman F.D., FitzGerald G.A. Rhythmicity of the intestinal microbiota is regulated by gender and the host circadian clock. Proc. Natl. Acad. Sci. USA. 2015;112:10479–10484. doi: 10.1073/pnas.1501305112. [DOI] [PMC free article] [PubMed] [Google Scholar]
- 21.Lkhagva E., Chung H.J., Hong J., Tang W.H.W., Lee S.I., Hong S.T., Lee S. The regional diversity of gut microbiome along the GI tract of male C57BL/6 mice. BMC Microbiol. 2021;21:44. doi: 10.1186/s12866-021-02099-0. [DOI] [PMC free article] [PubMed] [Google Scholar]
- 22.Love C.J., Gubert C., Kodikara S., Kong G., Lê Cao K.A., Hannan A.J. Microbiota DNA isolation, 16S rRNA amplicon sequencing, and bioinformatic analysis for bacterial microbiome profiling of rodent fecal samples. STAR Protoc. 2022;3 doi: 10.1016/j.xpro.2022.101772. [DOI] [PMC free article] [PubMed] [Google Scholar]
- 23.Human Microbiome Project Consortium A framework for human microbiome research. Nature. 2012;486:215–221. doi: 10.1038/nature11209. [DOI] [PMC free article] [PubMed] [Google Scholar]
- 24.Chong J., Liu P., Zhou G., Xia J. Using MicrobiomeAnalyst for comprehensive statistical, functional, and meta-analysis of microbiome data. Nat. Protoc. 2020;15:799–821. doi: 10.1038/s41596-019-0264-1. [DOI] [PubMed] [Google Scholar]
- 25.Kim B.R., Shin J., Guevarra R., Lee J.H., Kim D.W., Seol K.H., Lee J.H., Kim H.B., Isaacson R. Deciphering diversity indices for a better understanding of microbial communities. J. Microbiol. Biotechnol. 2017;27:2089–2093. doi: 10.4014/jmb.1709.09027. [DOI] [PubMed] [Google Scholar]
- 26.Cameron E.S., Schmidt P.J., Tremblay B.J.M., Emelko M.B., Müller K.M. Enhancing diversity analysis by repeatedly rarefying next generation sequencing data describing microbial communities. Sci. Rep. 2021;11 doi: 10.1038/s41598-021-01636-1. [DOI] [PMC free article] [PubMed] [Google Scholar]
- 27.Edgar R.C. UPARSE: highly accurate OTU sequences from microbial amplicon reads. Nat. Methods. 2013;10:996–998. doi: 10.1038/nmeth.2604. [DOI] [PubMed] [Google Scholar]
- 28.Mysara M., Njima M., Leys N., Raes J., Monsieurs P. From reads to operational taxonomic units: an ensemble processing pipeline for MiSeq amplicon sequencing data. GigaScience. 2017;6:1–10. doi: 10.1093/gigascience/giw017. [DOI] [PMC free article] [PubMed] [Google Scholar]
- 29.Prodan A., Tremaroli V., Brolin H., Zwinderman A.H., Nieuwdorp M., Levin E. Comparing bioinformatic pipelines for microbial 16S rRNA amplicon sequencing. PLoS One. 2020;15 doi: 10.1371/journal.pone.0227434. [DOI] [PMC free article] [PubMed] [Google Scholar]
- 30.Nearing J.T., Douglas G.M., Comeau A.M., Langille M.G.I. Denoising the Denoisers: an independent evaluation of microbiome sequence error-correction approaches. PeerJ. 2018;6 doi: 10.7717/peerj.5364. [DOI] [PMC free article] [PubMed] [Google Scholar]
- 31.Kers J.G., Saccenti E. The power of microbiome studies: some considerations on which alpha and beta metrics to use and how to report results. Front. Microbiol. 2021;12 doi: 10.3389/fmicb.2021.796025. [DOI] [PMC free article] [PubMed] [Google Scholar]
- 32.Motulsky H.J. GraphPad Statistics Guide. Accessed 17 May 2023. https://www.graphpad.com/guides/prism/latest/statistics/index.htm.
- 33.Chen J., Bittinger K., Charlson E.S., Hoffmann C., Lewis J., Wu G.D., Collman R.G., Bushman F.D., Li H. Associating microbiome composition with environmental covariates using generalized UniFrac distances. Bioinformatics. 2012;28:2106–2113. doi: 10.1093/bioinformatics/bts342. [DOI] [PMC free article] [PubMed] [Google Scholar]
- 34.Lozupone C., Knight R. UniFrac: a new phylogenetic method for comparing microbial communities. Appl. Environ. Microbiol. 2005;71:8228–8235. doi: 10.1128/AEM.71.12.8228-8235.2005. [DOI] [PMC free article] [PubMed] [Google Scholar]
- 35.Segata N., Izard J., Waldron L., Gevers D., Miropolsky L., Garrett W.S., Huttenhower C. Metagenomic biomarker discovery and explanation. Genome Biol. 2011;12:R60. doi: 10.1186/gb-2011-12-6-r60. [DOI] [PMC free article] [PubMed] [Google Scholar]
- 36.Chiu C.H., Chao A. Estimating and comparing microbial diversity in the presence of sequencing errors. PeerJ. 2016;4 doi: 10.7717/peerj.1634. [DOI] [PMC free article] [PubMed] [Google Scholar]
- 37.Lozupone C.A., Hamady M., Kelley S.T., Knight R. Quantitative and qualitative beta diversity measures lead to different insights into factors that structure microbial communities. Appl. Environ. Microbiol. 2007;73:1576–1585. doi: 10.1128/AEM.01996-06. [DOI] [PMC free article] [PubMed] [Google Scholar]
- 38.Nash A.K., Auchtung T.A., Wong M.C., Smith D.P., Gesell J.R., Ross M.C., Stewart C.J., Metcalf G.A., Muzny D.M., Gibbs R.A., et al. The gut mycobiome of the Human Microbiome Project healthy cohort. Microbiome. 2017;5:153. doi: 10.1186/s40168-017-0373-4. [DOI] [PMC free article] [PubMed] [Google Scholar]
- 39.Ajami N.J., Wong M.C., Ross M.C., Lloyd R.E., Petrosino J.F. Maximal viral information recovery from sequence data using VirMAP. Nat. Commun. 2018;9:3205. doi: 10.1038/s41467-018-05658-8. [DOI] [PMC free article] [PubMed] [Google Scholar]
Associated Data
This section collects any data citations, data availability statements, or supplementary materials included in this article.
Data Availability Statement
The protocol does not include all datasets generated or analyzed during this study (Di Gesù, et al.1). We provide the following information about data and code availability:
-
•
Deposited data I. The accession number for the 16S rRNA gene amplicon sequencing data reported in the associated paper is NCBI Sequence Read Archive. BioProject Accession: PRJNA878523.
-
•
Deposited data II. The original, unprocessed data reported in the published paper associated with this protocol is published as a Mendeley Dataset: https://data.mendeley.com/datasets/z6wz8kpk3n/1
-
•
Neither this protocol nor the associated paper1 report original code.
Any additional information required to reanalyze the data reported in this paper is available from the lead author upon request.