


Abstract
As a trial practical application, we have applied optimized microfabricated electrophoresis devices, combined with enzymatic mutation detection methods, to the determination of single nucleotide polymorphism (SNP) sites in the p53 suppressor gene. Using clinical samples, we have achieved robust assays with quality factors as good as conventional electrophoresis in ~100 s. This is 10 and 50 times faster than capillary and slab gel electrophoresis, respectively. The method was highly accurate with an average error of mutation site measurement of only ±5 bp. No clean-up of the digestion mixtures was needed prior to injection. This greatly simplifies sample handling relative to capillary instruments, which is important for high-throughput screening applications. Following identification, absolute mutation determination of the screened samples was achieved in a second microdevice optimized for four-color DNA sequencing. Total run time was 25 min in this second device and sequencing data were in full agreement with ABI Prism® 377 sequencing runs which required 3.5 h. The tandem application of microdevices for location then full characterization of SNPs appears to confirm many of the improvements claimed for future application of microdevices in practical scaled screening for mutational analysis.
INTRODUCTION
Single nucleotide polymorphisms (SNPs) appear on average once every 1000 bases in the human genome. They are considered important tools for genetic testing, the identification of human disease genes and pharmacogenomics (1,2). There are many different methods to identify SNPs (3), such as DNA sequencing (4), single-stranded conformational polymorphism analysis (5), denaturing gradient gel electrophoresis (6), mass spectrometry (7) and hybridization arrays (1), each with its own merits. A major demand on these methods is the need for high throughput screening. Significant improvements in DNA sample throughput are anticipated, though for the most part unproven, for microdevice electrophoresis (8). In this method DNA analysis is performed by electrophoresis in microchannel structures etched into glass substrates. High throughput is expected from precise microinjectors, shorter separation distances, higher voltages, automation and high channel densities. We were interested in applying this method to enzymatic mutation detection (EMD™) to achieve rapid detection of SNPs (9–11). In EMD™, wild-type DNA is mixed with PCR-amplified target DNA to form heteroduplexes, which are then exposed to enzymatic cleavage by endonuclease VII cloned from bacteriophage T4 (T4 endo VII). This enzyme recognizes structural changes (‘loops’) in double-stranded DNA due to single base pair mismatches and cleaves within 6 bp on the 3′-side of the mutation. The digest is usually analyzed by denaturing slab gel electrophoresis, revealing not only the presence or absence of a mutation but also its specific location within a given target sequence. However, slab gel electrophoresis is labor intensive and slow, a typical EMD™ run taking 90 min for completion, thereby greatly limiting sample throughput.
MATERIALS AND METHODS
Microfabrication
Devices were built from fused silica wafers (Hoya, Tokyo) as described recently (12). Channel structures consisted of a simple cross. The total lengths of the separation channels were 3.5 and 11.5 cm. Two side arms, each 0.5 cm in length, arranged perpendicularly 0.5 cm below the cathodic end of the separation channels, formed the loading channel. The cross microinjectors were 150 µm long. The channels were 40 µm deep and 90 µm wide at the top. Glass reservoirs (Ace Glass, Vineland, NJ) of 50 µl volume were affixed around the channel accesses to hold sample and buffer.
Electrophoresis
Microdevice. The instrumental set-up equipped with a thermostated heating plate and a laser-induced fluorescence detection system using an argon ion laser as excitation source has been described previously (13). The microchannel structures were chemically passivated (14). Linear polyacrylamide (LPA) was used as separation matrix and it was replaced between each run (15). For loading, samples were electrophoresed at an appropriate voltage and time through the loading channel. For injection and separation, voltages were switched to create the appropriate field strength in the separation channel (for details see figure captions). Data were collected using custom software written in HPVEE (Hewlett Packard, Palo Alto, CA). EMD™ assay data were analyzed by Origin 6.0 (Microcal Software Inc., Northampton, MA). DNA fragment sizes were calculated using a calibration curve established with the Genescan-500 sizing standard (PE Biosystems, Foster City, CA). DNA sequencing runs were analyzed by Trout base calling software.
ABI Prism® 377. An aliquot of 1.8 µl of EMD™ sample was loaded on a 12 cm 5% Rapid Ranger Premix slab gel (6 M urea, 0.5× TBE) (FMC Bioproducts, Rockland, ME) and electrophoresed at 750 V, 60 mA, 200 W for 90 min. Data analysis was performed with GeneScan software (PE Biosystems, Foster City, CA). Confirmation of mutational status for the p53 samples was performed by DNA sequencing. Samples (1 µl each) were loaded on a 36 cm sequencing gel and electrophoresed on an ABI 377 at 3 kV, 60 mA, 200 W, 51°C for 3.5 h. Samples were analyzed using ABI Sequencing Analysis software and Sequencher.
Sample preparation
PCR amplification. PCR-amplified human p53 cDNA test samples were provided by a collaborator and amplified utilizing the Amplitaq Gold PCR Kit (PE Biosystems, Foster City, CA) and a nested PCR strategy to obtain the 469 bp fragment for the EMD™ assay. Aliquots of 0.6 pM primers, 1× GeneAmp PCR Buffer II, 1.5 mM MgCl2, 200 µM dNTPs, 1.0 U AmpliTaq Gold and 4 ng of sample cDNA were combined and brought to a final volume of 30 µl with sterile water. PCR comprised 95°C for 12 min and 30 cycles of 94°C for 10 s, 62°C for 10 s and 72°C for 20 s, followed by a 4°C soak. An excess of probe DNA (1 ml) was amplified using the same amplification protocol with wild-type template but with 5 µM of R110-dUTP (Molecular Probes, Eugene, MA) added for random fluorescent labeling of wild-type DNA. The wild-type probe was subsequently purified with a Centricon-50 concentrator (Amicon, Beverly, MA) according to the manufacturer’s instructions and diluted to 41.7 fmol/µl in TE buffer (10 mM Tris, 1 mM EDTA pH 8.0) for use as a probe in heteroduplex formation during the EMD™ assay. All amplified test DNA samples were used directly in the EMD™ assay without purification.
Hybridization. A hybridization reaction was performed on each sample using 10 µl of test DNA combined with 3 µl of probe (125 fmol of wild-type DNA) and 2 µl of hybridization buffer (Passport EMD™ Kit; Amersham Pharmacia, Piscataway, NJ). The mixture was heated to 95°C for 5 min and allowed to cool at room temperature for 5 min.
Enzymatic detection. An enzymatic digest of hybridized probe and test DNA was performed using a 5 µl mixture consisting of 2 µl of T4 endo VII and 3 µl of enzyme dilution buffer (Passport EMD™ Kit). The mixture was incubated at 37°C for 30 min. A portion of the reaction (2 µl) was extracted and stopped by adding a mixture (3 µl) of 88% formamide, 8.3% GeneScan 2500 ROX molecular weight marker (PE Biosystems) and loading dye.
Sequencing samples. Dye terminator cycle sequencing (Big Dye Cycle Sequencing Kit; PE Biosystems, Foster City, CA) was used. Prior to the sequencing reactions, 30 µl of each PCR product were treated with 2 µl of a 1:1 mixture of shrimp alkaline phosphatase and exonuclease I (PCR Product Pre-sequencing Kit; US Biochemical Corp., Cleveland OH). A portion of the PCR product (6 µl) was used in the cycle sequencing reactions along with 3.2 pmol of primer. Cycle sequencing was performed on an MJ-200 thermocycler (MJ Research, Watertown, MA) with 35 cycles of 95°C for 30 s, 62°C for 15 s and 60°C for 4 min, followed by a 4°C soak. Purification and desalting of the reactions was performed by adding the entire reaction mixture to a washed column of Sephadex G-50 (75 g/l) (Amersham Pharmacia, Piscataway, NJ). Reactions were subsequently dried in an evaporator and a 6 µl mixture of formamide and ABI Blue Dextran/EDTA loading dye in a 5:1 ratio was added.
RESULTS AND DISCUSSION
EMD™ assay on microdevice
In a blind study, clinical samples of human p53 cDNA were screened for SNPs on a microfabricated electrophoretic device of 2.0 cm effective length. The data were compared with the EMD™ results produced by conventional denaturing slab gel electrophoresis on an ABI PRISM® 377. Double-stranded target and wild-type DNA probe DNA used in the comparison were both 469 bp in length. Rhodamine-labeled deoxyuracil biphosphate (R110 dUTP) was used to fluorescently label the wild-type DNA by randomly incorporating R110 dUTP in place of thymine during PCR to allow for sensitive laser-induced fluorescent detection of the digestion products.
Figure 1 depicts the electrophoretic profiles of wild-type DNA and sample 4 (S4) superimposed for analysis. The comparison reveals that there was one peak in S4 at 100.2 s which was not present in wild-type DNA, indicating the presence of a point mutation. A calibration curve was established in an independent experiment using a DNA sizing standard and the same electrophoretic conditions as for the EMD™ samples (the same curve was used for all samples). The curve shows that the mutation location for S4 is approximately at position bp 455. The 14 bp long counterpart to the 455 bp fragment was not detected, which was possibly a result of its low fluorescent signal strength due to its short length. The rest of the peaks seen in both electropherograms matched. The very strong peak at 102.0 s, eluting only 1.8 s behind the digestion product, was non-digested target and probe DNA. All the other, smaller peaks were caused by non-specific cleavage by T4 endo VII, which required the digestion to be terminated before completion.
Figure 1.
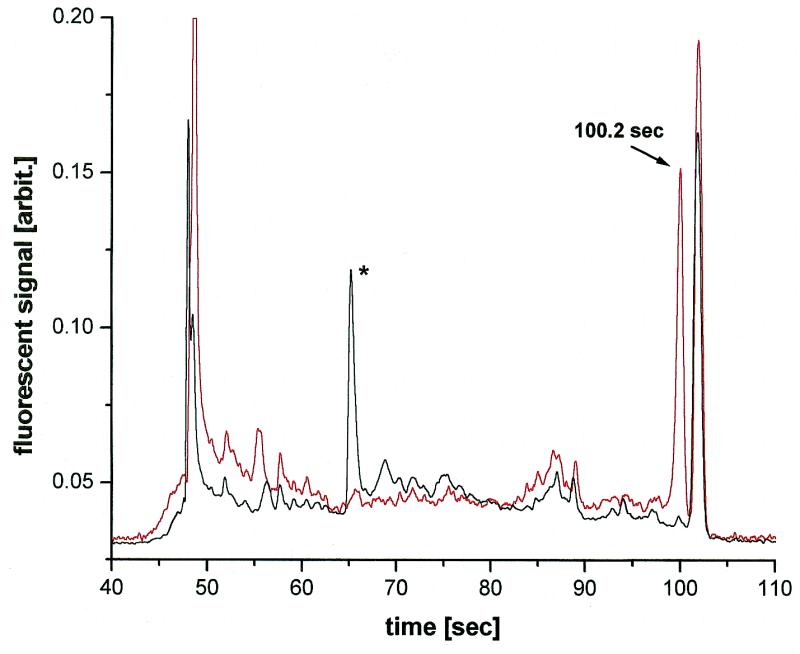
EMD™ assay on microdevice. Wild-type DNA (black trace) and S4 (red trace). Channel lengths: 3.5 cm (total), 2.0 cm (effective). Sieving matrix: 4% (w/v) LPA in 1× TBE, 3.5 M urea, 30% (v/v) formamide. Pre-electrophoresis: 2 min at 250 V/cm. Loading: 1 min at 250 V/cm. Injection/run voltage: 250 V/cm. Volume: 2 µl of unpurified sample diluted in 20 µl of water. Temperature: 45°C. *Non-denatured heteroduplex DNA.
Another assay example is given in Figure 2, where wild-type DNA is compared with sample 5 (S5). This time four cleavage products were detected at 68.4, 69.0, 78.0 and 79.2 s belonging to the two cleavage pairs 186/277 and 191/267 bp. Multiple peaks are, in many cases, an indication of an insertion or a deletion (11). In this case only a single base substitution was found by DNA sequencing (see below). In all other aspects the two assay profiles were identical to those in Figure 1, documenting the high run-to-run reproducibility of the electrophoretic microdevice. The latter is imperative for this type of assay, which is based on inter-run comparisons to the wild-type profile.
Figure 2.

EMD™ assay on microdevice. Wild-type DNA (black trace) and S5 (red trace). *Non-denatured heteroduplex DNA. Conditions as in Figure 1.
Microdevice EMD™ accuracy
The microdevice EMD™ results are summarized in Table 1. They are compared to the ABI Prism® 377 EMD™ data and the absolute mutation locations as determined by conventional ABI Prism® 377 slab gel sequencing. Table 1 shows that the average electrophoretic run time on the microdevice was 102 s, 50 times faster than we achieved on the slab gel system. Run time was also 10 times shorter than capillary electrophoresis (data not shown). The average accuracy of the microdevice method (±5 bp) was as high as that of the slab gel method (±4 bp), which shows that data quality was never compromised by the very short separation distance and the very high separation speed of the device. The outstanding analytical power of the microdevice method is underlined by the fact that all the digestion products eluted between ~68 and 102 s, leaving a window of only 34 s for accurate sizing of all the fragments. This put an extremely high demand on the separation capability and the reproducibility of the system. The excellent performance of the device is further illustrated by Figure 3, where the microdevice and the ABI Prism® 377 EMD™ assay profile of sample 2 (S2) are directly compared.
Table 1. Comparison of microdevice and ABI Prism® 377 EMD™ data.
| Sample | Time on chip (s) | Time on ABI377 (min) | Cleavage products determined on chip (bp) | Cleavage products determined on ABI 377 (bp) | Mutation site by DNA sequencing (bp) | Theoretical cleavage productsa (bp) | Accuracy of chip (bp) | Accuracy of ABI 377 (bp) |
|---|---|---|---|---|---|---|---|---|
| 1 | —b | — | — | — | 427 | 43 | — | — |
| 97.2 | 124.13 | 430 | 426 | Heterozygous C→T | 427 | +3 | –1 | |
| 2 | 68.4 | 63.97 | 186 | 196 | 279 | 191 | –5 | +5 |
| 79.2 | 84.27 | 277 | 275 | Heterozygous G→C | 279 | +2 | –4 | |
| 3 | — | 58.1 | — | 173 | 293 | 177 | — | –4 |
| 82.5 | 989.95 | 303 | 297 | Homozygous G→A | 293 | +10 | +6 | |
| 4 | 100.2 | — | — | — | 453 | 17 | — | — |
| — | 130.35 | 455 | 452 | Heterozygous GA insertion | 453 | +2 | –1 | |
| 5 | 68.4 | 63.30 | 186 | 195 | 273 | — | — | — |
| 69.0 | 64.83 | 191 | 199 | Heterozygous A→T | 197 | –6 | +2 | |
| 78.0 | 82.59 | 267 | 269 | 273 | –6 | –4 | ||
| 79.2 | 84.67 | 277 | 277 | — | — | — |
aBased on the location of the actual mutation site as determined by DNA sequencing.
b—, fragment not detected.
Figure 3.

EMD™ assay on (a) ABI Prism® 377 and (b) on microdevice. Wild-type DNA (black trace) and S2 (red trace). Conditions as in Figure 1.
The microdevice did not require any sample clean-up of the digestion mixture prior to injection. The same samples failed on capillaries when salt was not removed prior to injection. This provides additional evidence that the cross injector method used in microdevices is significantly more robust towards variations in sample composition than the electrokinetic injection employed in capillaries. A similar injection advantage of microdevices over capillaries has been reported for the analysis of DNA sequencing mitures (16).
DNA sequencing on microdevice
Final verification and identification of mutations is typically achieved by four-color DNA sequencing. We and others have recently shown that on microfabricated devices of intermediate lengths (7 and 11.5 cm) 500 and 565 bases can be sequenced in 20 and 27 min, respectively (13,17). Figure 4 depicts the processed four-color sequencing analysis of S5 performed on an electrophoretic microdevice. The separation distance was increased to 11.5 cm to provide single-base resolution over the entire size range of the sequencing fragments. Only the section which contains the actual mutation is shown. It can be seen that S5 was heterozygous and that an A was substituted for a T at position 197 in one of the two alleles. The analysis was confirmed by conventional slab gel sequencing on an ABI Prism® 377. Total run time on the ABI machine was 3.5 h. The same analysis took only 20 min on the microdevice, with similarly high data quality.
Figure 4.

DNA sequencing on microdevice of wild-type DNA and S5. Only the region of the actual mutation site is shown. Channel lengths: 11.5 cm (total), 10.5 cm (effective). Sieving matrix: 4% LPA in 1× TTE, 7 M urea. Pre-electrophoresis: 5 min at 200 V/cm. Loading: 3 min at 300 V/cm. Run voltage: 150 V/cm. Volume: 10 µl of sample in water. Temperature: 50°C.
In summary, we have shown that microdevice electrophoresis can provide high sizing accuracy at high separation speed without sample clean-up. The feasibility of fast and reliable mutation identification by microdevice sequencing was also demonstrated. We believe that both accurate, large- scale screening of SNPs and high throughput mutational sequencing will be possible by this powerful technology once channel multiplexing, process integration and automation are routine components of microdevice systems. There appear to be no losses in quality and only advantages when the assay is performed in the microchip format.
Acknowledgments
ACKNOWLEDGEMENTS
We would like to thank A. Ferrie and A. Bailey, both of Variagenics Inc. (Cambridge, MA), for support and helpful discussions. We further would like to thank Amersham-Pharmacia for kindly providing the clinical samples used in this study.
REFERENCES
- 1.Wang D.G., Fan,J.B., Siao,C.J., Berno,A., Young,P., Sapolsky,R., Ghandour,G., Perkins,N., Winchester,E., Spencer,J. et al. (1998) Science, 280, 1077–1082. [DOI] [PubMed] [Google Scholar]
- 2.Evans W.E. and Relling,M.V. (1999) Science, 286, 487–491. [DOI] [PubMed] [Google Scholar]
- 3.Prosser J. (1993) Trends Biotechnol., 11, 238–246. [DOI] [PubMed] [Google Scholar]
- 4.Rao V.B. (1994) Anal. Biochem., 216, 1–14. [DOI] [PubMed] [Google Scholar]
- 5.Orita M., Iwahana,H., Kanazawa,H., Hayashi,K. and Sekiya,T. (1989) Proc. Natl Acad. Sci. USA, 86, 2766–2770. [DOI] [PMC free article] [PubMed] [Google Scholar]
- 6.Fischer S.G. and Lerman,L.S. (1983) Proc. Natl Acad. Sci. USA, 80, 1579–1583. [DOI] [PMC free article] [PubMed] [Google Scholar]
- 7.Haff L. and Smirnov,I.P. (1997) Genome Res., 7, 378–388. [DOI] [PMC free article] [PubMed] [Google Scholar]
- 8.Harrison D.J., Fluri,K., Seiler,K., Fan,Z., Effenhauser,C.S. and Manz,A. (1993) Science, 261, 895–897. [DOI] [PubMed] [Google Scholar]
- 9.Del Tito B.J. Jr, Poff,H.E., Novotny,M.A., Cartledge,D.M, Walker,R.I., Earl,C.D. and Bailey,A.L. (1998) Clin. Chem., 44, 731–739. [PubMed] [Google Scholar]
- 10.Abon J.J., McKenzie,M. and Cotton,R.G.H. (1999) Electrophoresis, 20, 1162–1170. [DOI] [PubMed] [Google Scholar]
- 11.Youil R., Kemper,B.W. and Cotton,R.G.H. (1995) Proc. Natl Acad. Sci. USA, 92, 87–91. [DOI] [PMC free article] [PubMed] [Google Scholar]
- 12.Koutny L.B., Schmalzing,D., Taylor,T.A. and Fuchs,M. (1996) Anal. Chem., 68, 18–22. [DOI] [PubMed] [Google Scholar]
- 13.Schmalzing D., Tsao,N., Koutny,L., Chisholm,D., Srivastava,A., Adourian,A., Linton,L., McEwan,P., Matsudaira,P. and Ehrlich,D. (1999) Genome Res., 9, 853–858. [DOI] [PMC free article] [PubMed] [Google Scholar]
- 14.Hjerten S. (1985) J. Chromatogr., 347, 191–198. [Google Scholar]
- 15.Goetzinger W., Kotler,L., Carrilho,E., Ruiz-Martinez,M.C., Salas-Solano,O. and Karger,B.L. (1998) Electrophoresis, 19, 242–248. [DOI] [PubMed] [Google Scholar]
- 16.Schmalzing D., Adourian,A., Koutny,L., Ziaugra,L., Matsudaira,P. and Ehrlich,D. (1998) Anal. Chem., 70, 2303–2310. [DOI] [PubMed] [Google Scholar]
- 17.Liu S., Shi,Y., Ja,W.W. and Mathies,R.A. (1999) Anal. Chem., 71, 566–573. [DOI] [PubMed] [Google Scholar]