
Fig. 1: Range of responses for the 12 cell systems in the BioMap Diversity Plus panel of cell systems.
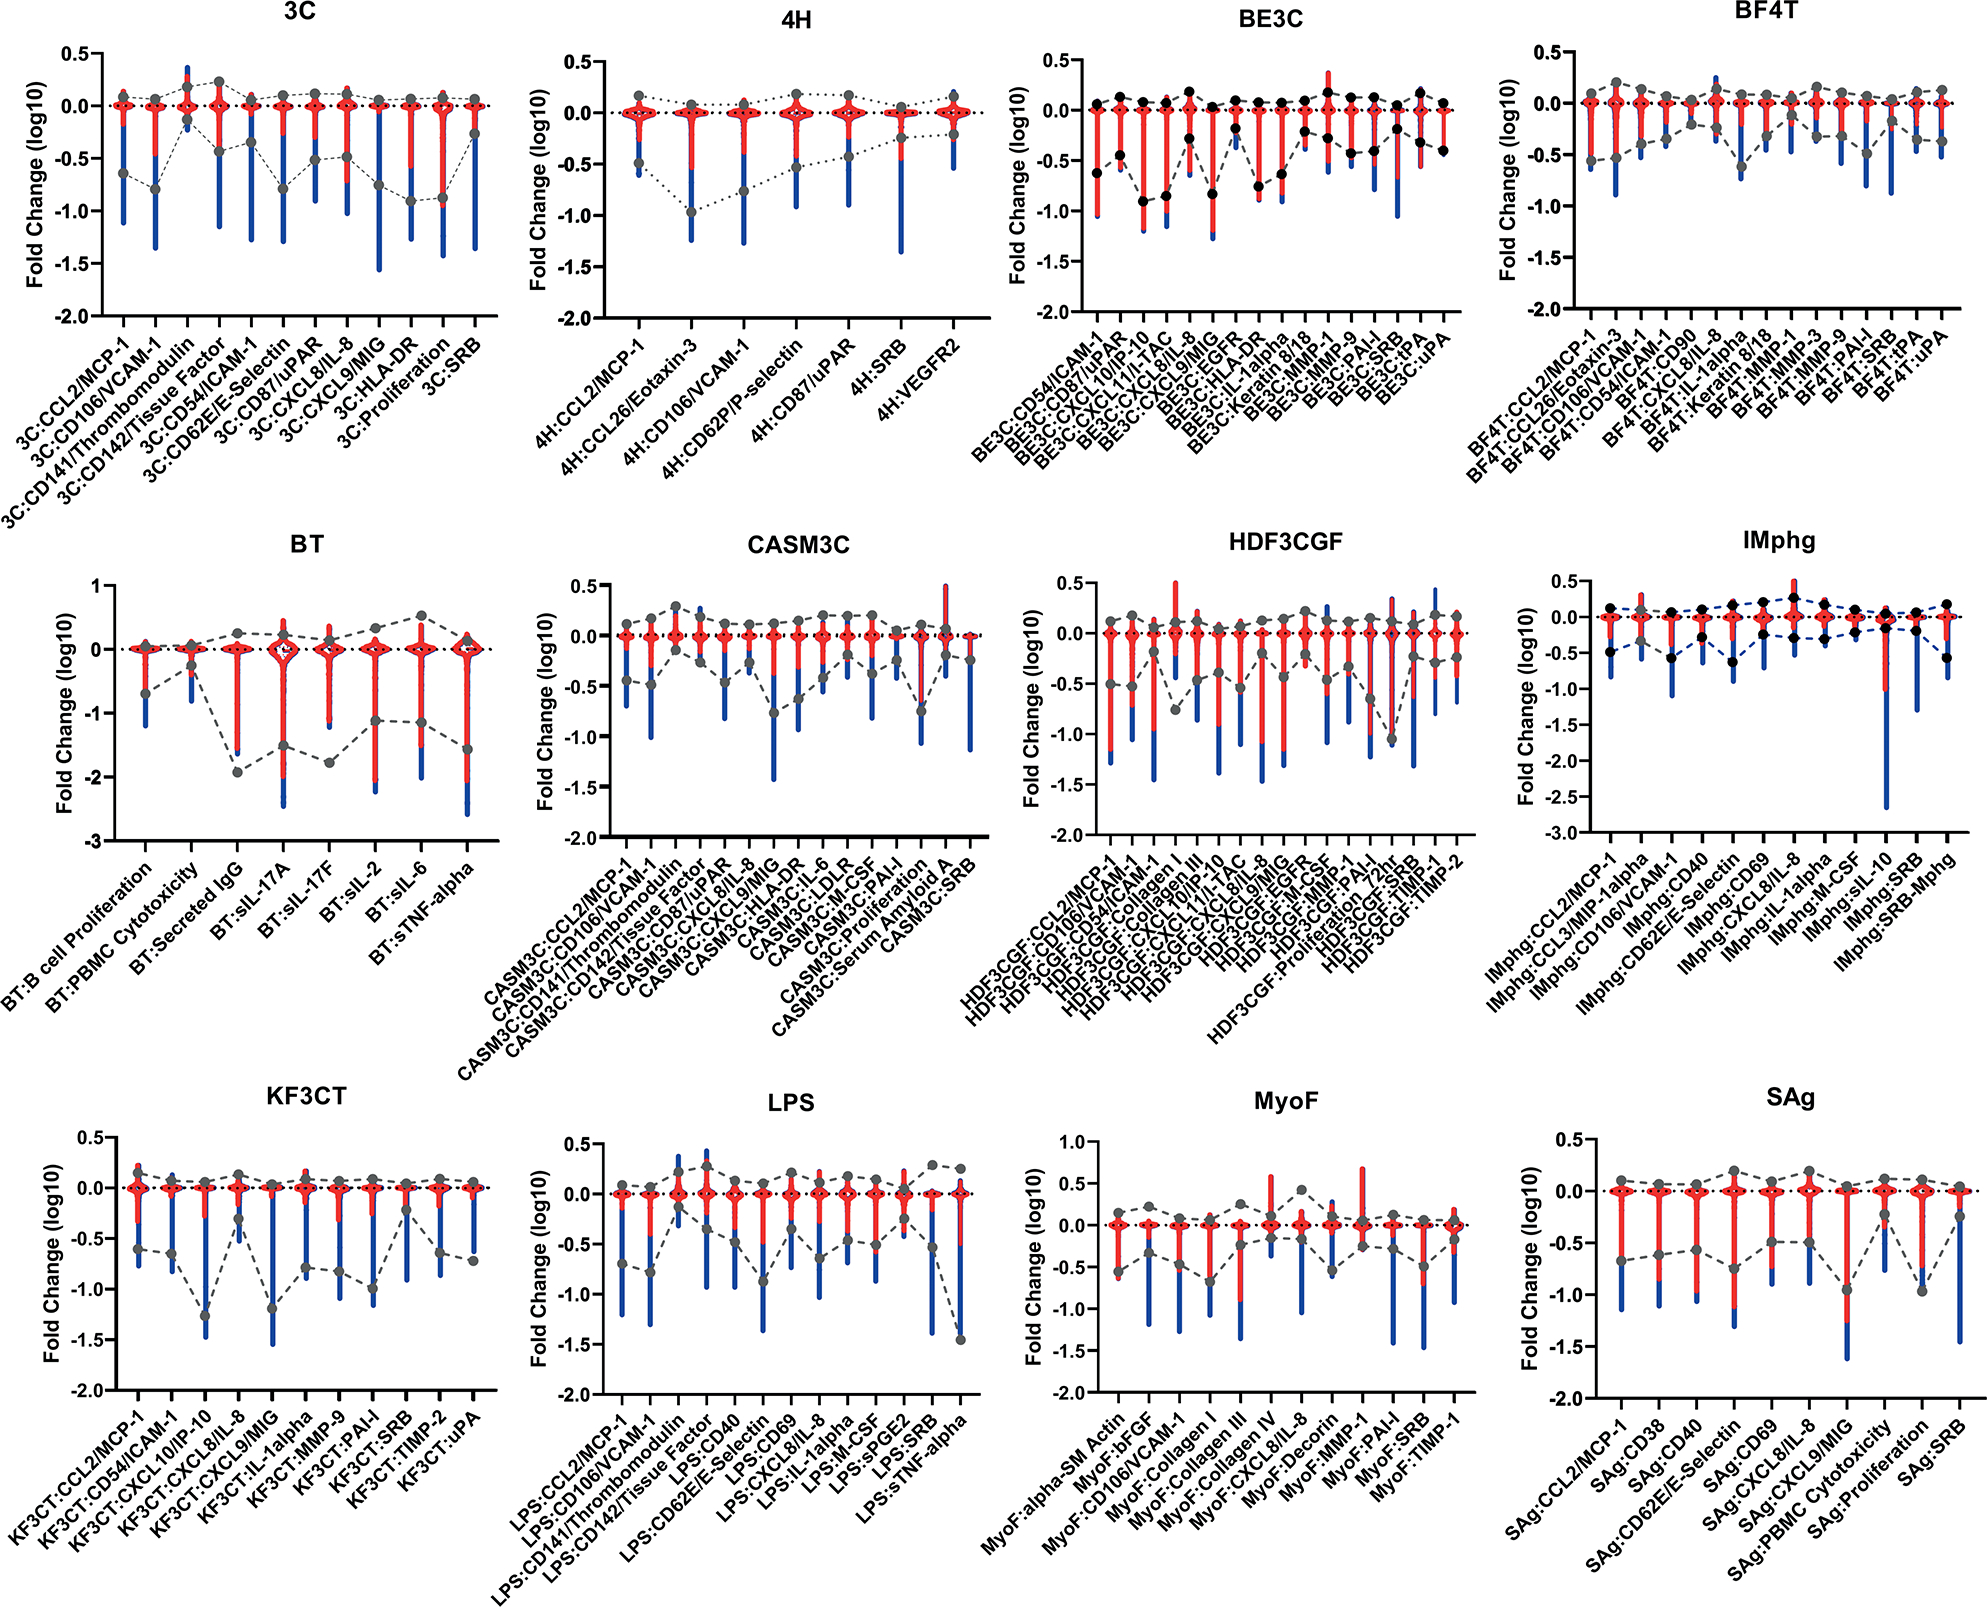
The fold change (log10) values for all PFAS samples at all concentrations for each assay endpoint are shown in red and grouped by cell system (cell system abbreviations are shown above each graph and detailed in the Materials and Methods). The range after removing data from chemical-concentration pairs where two or more cytotoxicity endpoints were active (blue) is indicated along with the 1–99% range for historic values after cytotoxicity filtering (dotted lines).