Abstract
In the present study, Lam Dong bentonite clay was utilized as a novel resource to effectively synthesize microporous ZSM-5 zeolite (Si/Al ∼ 40). The effects of aging and hydrothermal treatment on the crystallization of ZSM-5 were carefully investigated. Herein, the aging temperatures of RT, 60, and 80 °C at time intervals of 12, 36, and 60 h, followed by high temperature hydrothermal treatment (170 °C) for 3–18 h were studied. Techniques such as XRD, SEM-EDX, FTIR, TGA-DSC, and BET-BJH were applied to characterize the synthesized ZSM-5. Bentonite clay showed great benefits as a natural resource for ZSM-5 synthesis and is cost efficient, environment friendly, and has a large reserves. The form, size, and crystallinity of ZSM-5 were greatly influenced by aging and hydrothermal treatment conditions. The optimal ZSM-5 product had high purity, crystallinity (∼90%), and porosity (BET ∼380 m2 g−1) as well as thermal stability, which are beneficial for adsorptive and catalytic applications.
In the present study, Lam Dong bentonite clay was utilized as a novel resource to effectively synthesize microporous ZSM-5 zeolite (Si/Al ∼ 40).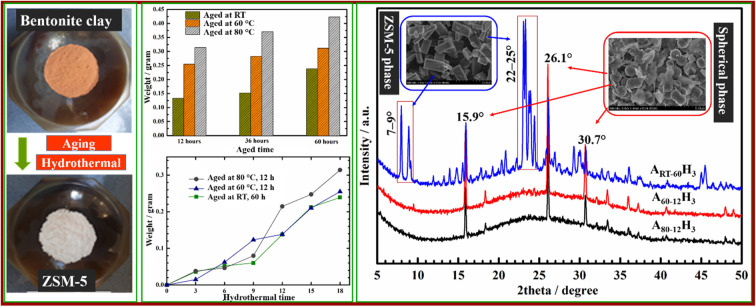
1. Introduction
ZSM-5 zeolite (MFI type zeolite, high-silica pentasils) has been widely employed in elective catalyst processing1–6 or as adsorption materials7–13 because of its unique channel structure of opening capacity in the range from 5.1 to 5.6 Å, form selectivity, hydrophobic nature, high acid strength, and thermal stability.14–17 These properties and structures are controlled by a range of variables such as silica and alumina sources,18–20 template/alumina ratio,21 SiO2/Al2O3 ratio (SAR),22 as well as aging and hydrothermal processes.21,22 Over the last 20 years, researchers have attempted to investigate the influence of aging and hydrothermal treatment on the crystallization of high silica pentasils. However, investigations on gel precursor characterization and the effect of gel aging on ZSM-5 crystallization are still in the early stages.21–27 These studies focus on factors that affect the chemical, physical, and structural properties of gel precursors as well as their impact on the kinetics of tile nucleation, crystal growth, and crystallization of MFI zeolites. Huang et al. (2000) and Frunz et al. (2006) found that extended gel aging at 25 °C increased the amount of ZSM-5 precursors.23,24 Selvin et al. (2011) and Goncalves et al. (2008) aged ZSM-5 gels at various temperatures and periods.22,25 These studies were not, however, focused on hydrothermal therapy. Selvin's group reported that their aged gel was hydrothermally treated for 90 min at 180 °C,25 compared to crystallization for 24, 48, and 72 h by Goncalves and colleagues.22 ZSM-5 crystals, on the other hand, often develop within 24–48 h.21,22,26,28–32 As a result, investigating ZSM-5 creation early within the hydrothermal process is critical to understanding more about ZSM-5 growth.21 Furthermore, other studies have shown that the aging stage may change the nuclei and crystallization speed, resulting in changes to the crystal size and synthesis yield.25,33 Therefore, aging and hydrothermal treatment have a significant influence on the formation and growth of ZSM-5 crystals and require further study.
ZSM-5 is commonly produced from a range of silica and alumina sources such as Na2SiO3·9H2O; Ludox-AS-40 colloidal sol: SiO2 40 wt%; tetraethyl orthosilicate (TEOS): Si(OC2H5)4, NaAlO2; Al(OH)3; aluminum isopropoxide: Al(O-iC3H7)3; and Al(NO3)3·9H2O.17–22,24–26,29,34 Besides these, ZSM-5 has also been synthesized from natural sources such as kaolinite clay.28,31,32 For example, Nigerian Ahoko kaolinite was used for the first time in 2009 for ZSM-5 synthesis where a novel metakaolinization technique was used in the manufacture of the required reactant phase.31 Indeed, ZSM-5 from commercial kaolinite was synthesized by A. S. Kovo et al., and the results demonstrated that the novel metakaolinization method was applicable to materials other than the commercial Nigerian kaolinite utilized in their study.31 Lafi and colleagues (2015)32 used high-silica Jordanian kaolinite to synthesize ZSM-5 with varying SiO2/Al2O3 ratios. Asghari et al. (2019) produced nanocrystalline ZSM-5 from Si and Al precursors from Iranian kaolinite.28 Bentonite clay, which has a similar composition to kaolinite, has long been used to efficiently synthesize a variety of zeolite materials including zeolite 13X,35 zeolite A,36 zeolite Y,37,38 and beta zeolite.39
In Vietnam, high-silica bentonite clay is well known as a low cost, ecologically beneficial natural clay resource with abundant reserves.40 Si and Al oxides are the major chemical components of bentonite with minor quantities of Fe, Ca, Na, and K oxides as well as additional elements.35,41 The present study is the first to employ Lam Dong bentonite clay and sodium silicate (Na2SiO3·5H2O) to manufacture microporous ZSM-5 zeolite. The effects of gel precursor aging and hydrothermal treatment on ZSM-5 crystallization were investigated. The aluminosilicate gel was aged at temperatures ranging between RT and 80 °C for 12–60 h before being hydrothermalized for 3–18 h at 170 °C. The properties of the prepared ZSM-5 zeolite were characterized by XRD, SEM-EDX, FTIR, TGA-DSC, and BET-BJH methods.
2. Results and discussion
2.1. Effect of aging condition on the crystallization of ZSM-5 zeolite
To investigate the effect of the aging condition, we fixed the hydrothermal condition. Indeed, after being aged at various times and temperatures, all aluminosilicate gels were hydrothermallized at 170 °C for 18 h.
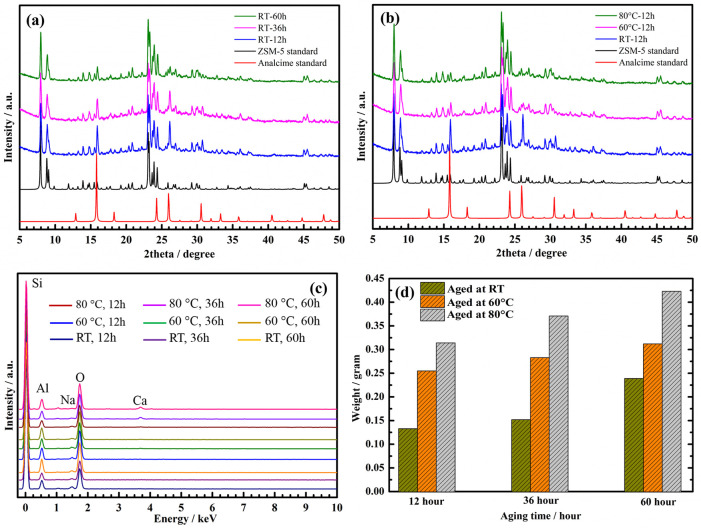
Fig. S1, S2 (ESI†) and Fig. 1a, b display the XRD patterns of the ZSM-5 samples synthesized with the aged aluminosilicate gel. All samples showed peaks at 2θ = 7°–9° and 22°–25°, which are features of typical zeolite ZSM-5.18,21,28 It should be noted that ZSM-5 zeolite prepared from pure chemicals,18,21,29 kaolinite,28,31,32 and Lam Dong bentonite clay display remarkably similar XRD patterns.
Fig. 1. XRD patterns of ZSM-5 samples aged at RT for different periods (a) and aged for 12 h at different temperatures (b). EDX diagram (c) and weight (d) of ZSM-5 samples from aged gels.
The presence of analcime zeolite was clearly observed in the RT-12 h and RT-36 h samples when compared to the standard XRD pattern of analcime zeolite.42 Indeed, the three main diffraction peaks that emerged at 2θ = 15.9°, 26.1°, and 30.7° are recognized as the characteristic diffraction peaks of analcime zeolites42,43 (Fig. 1a). Surprisingly, the intensity of these peaks decreased with aging time, especially at 60 h (RT-60 h). This demonstrated that the RT-60 h sample was extremely crystalline, with distinct peaks matching the standard XRD pattern of the ZSM-5 zeolite structure and no identifiable impurity phases.44 Furthermore, the RT-12 h and RT-36 h samples have the lowest Si/Al ratio (21.96 and 28.66, respectively) compared to the other samples, as shown in Table 1. Therefore, we assume that 12–36 h of aging at RT is insufficient for transferring the aluminosilicate gel to the nuclei prior to hydrothermal treatment. This means that the aged gel's free alumina and silica content is quite high and that neither component participated in crystallization, resulting in a very low amount of observed ZSM-5. Indeed, R. Selvin et al. described solution aging during initial synthesis as one of the most important reaction factors to maximize the number of nuclei.25 Aging shortens the induction time and enhances the crystallization rate. The more the solution ages, the more active sites it forms, and the more nuclei are generated.25 These results are comparable to those of Hou and colleagues, who discovered that when SAR was low, a longer crystallization period was required for the development of the crystalline phase.45 The assumption was also the same as in the previous article in that the initial quantity of aluminum in the gel impacted ZSM-5 crystallization, i.e., it became more difficult to integrate alumina into a pentasil structure as the amount of alumina increases.46 The crystallinity of ZSM-5 was calculated, and the results are shown in Table S3.† The crystallinity increases with aging time at RT; however, the aging time at 80 °C considerably decreases the degree of crystallization. For instance, the crystallinity of 80 °C-12 h, 80 °C-36 h, and 80 °C-60 h samples was 78.5, 74.2, and 70.0%, respectively. When increasing the aging time at a temperature of 80 °C, the number of seed crystals generated increases and settles at the bottom of the glass vessel, along with a certain amount of silica species. The size and quantity of these seed crystals increase over aging time, and they will crystallize to form ZSM-5 zeolite crystals first. These crystals will have a higher degree of crystallinity when hydrothermally treated at a high temperature (170 °C for 18 h). At the same time, a significant amount of dispersed silica species remains in the solution, including under the Teflon lining, and throughout the solution, seeds will begin to form and the crystal grows. These crystals will have a lower degree of crystallinity due to insufficient crystallization time. In fact, there is an indefinite amount of unreacted amorphous silica present on the surface of the crystals (SEM image, Fig. 2) as well as a significant decrease in the surface area of ZSM-5 zeolite from 380 to 272 m2 g−1 (Table 2). As a result, the product consists of a mixture of high and low crystallinity crystals, leading to a decrease in the overall crystallinity of the material as the aging time at 80 °C increases. This result is consistent with the study conducted by R. Van Griken et al. in 2000. Specifically, the authors also observed a slight decrease in the crystallinity of ZSM-5 material when increasing the aging time at 80 °C from 41 to 66 h, but they did not provide an explanation for this phenomenon.47
The SiO2/Al2O3 ratio (SAR) in ZSM-5 samples calculated from the EDX resultsa.
| Sample | wt% of element | Si/Al molar ratio | SAR(*) | |||||
|---|---|---|---|---|---|---|---|---|
| Si1 | Al1 | Si2 | Al2 | S1/A1 | S2/A2 | Average | ||
| RT-12 h | 33.14 | 3.27 | 32.47 | 2.57 | 9.77 | 12.18 | 10.98 | 21.96 |
| RT-36 h | 35.51 | 2.2 | 33.67 | 2.48 | 15.56 | 13.09 | 14.33 | 28.66 |
| RT-60 h | 32.74 | 1.68 | 38.3 | 2.38 | 18.79 | 15.52 | 17.15 | 34.31 |
| 60 °C-12 h | 34.09 | 1.77 | 35.71 | 1.83 | 18.57 | 18.82 | 18.69 | 37.39 |
| 60 °C-36 h | 33.88 | 1.67 | 36.09 | 2.14 | 19.56 | 16.26 | 17.91 | 35.83 |
| 60 °C-60 h | 33.03 | 1.30 | 36.39 | 1.37 | 24.50 | 25.61 | 25.06 | 50.11 |
| 80 °C-12 h | 37.19 | 1.78 | 32.05 | 1.46 | 20.15 | 21.17 | 20.66 | 41.32 |
| 80 °C-36 h | 34.50 | 1.0 | 33.82 | 1.27 | 33.27 | 25.68 | 29.47 | 58.95 |
| 80 °C-60 h | 31.01 | 0.84 | 35.73 | 1.69 | 35.60 | 20.39 | 27.99 | 55.99 |
(*) = initial gel component: 2TPA-Br : 5Na2O : Al2O3 : 48SiO2 : 1300H2O
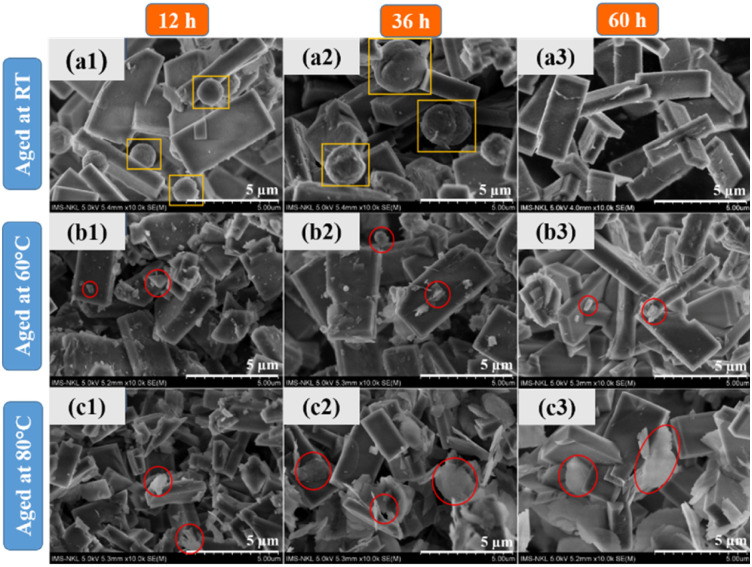
Fig. 2. SEM images of ZSM-5 crystals at various aluminosilicate gel aging conditions.
Porosity properties of the prepared ZSM-5 samples.
| Sample | S BET a (m2 g−1) | S micro (m2 g−1) | S ext b (m2 g−1) | V total (cm3 g−1) | V micro (cm3 g−1) | V meso c (cm3 g−1) |
|---|---|---|---|---|---|---|
| RT-12 h | 317 | 255 | 62 | 0.15 | 0.09 | 0.06 |
| RT-36 h | 330 | 264 | 66 | 0.15 | 0.09 | 0.06 |
| RT-60 h | 366 | 293 | 73 | 0.17 | 0.1 | 0.07 |
| 60 °C-12 h | 382 | 306 | 76 | 0.18 | 0.11 | 0.07 |
| 60 °C-36 h | 376 | 300 | 76 | 0.18 | 0.11 | 0.07 |
| 60 °C-60 h | 361 | 290 | 71 | 0.17 | 0.11 | 0.06 |
| 80 °C-12 h | 380 | 303 | 77 | 0.18 | 0.11 | 0.07 |
| 80 °C-36 h | 309 | 256 | 53 | 0.16 | 0.09 | 0.05 |
| 80 °C-60 h | 272 | 222 | 50 | 0.14 | 0.08 | 0.06 |
Calculated with the BET model.
Determined by the t-plot method, Sext = SBET − Smicro.
Determined by the t-plot method, Vmeso = Vtotal − Vmicro.
According to Fig. 1b, with the same aging time (12 h) at different temperatures, besides the two diffraction peaks at 2θ = 15.9° and 26.1°, only the RT-12 h sample showed a small peak at about 2θ = 30.7°. We anticipated that the intensity of the diffraction peaks at 2θ = 15.9° and 26.1°, as well as the disappearance of the peak at 2θ = 30.7°, were attributable to the aging time and temperature. This means that the aluminosilicate gel must first develop analcime zeolite before producing ZSM-5 zeolite and also indicates that the rate of nucleation and crystallization of ZSM-5 is affected by the aging temperature, which is consistent with earlier findings.48,49 Furthermore, R. Selvin and colleagues discovered that heating the sol to 80 °C promotes nuclei production. The number of nuclei produced in the aged sol, however, was insufficient to produce tiny crystals. The low-temperature stage is designed to generate a greater number of nuclei, and the crystallization process is also finished at low temperature. The last hydrothermal step allows the development of any unreacted silica, resulting in a high yield.25
Peaks from the major elements Si, Al, and O are clearly observed in the EDX spectra of all ZSM-5 samples (Fig. 1c). This is evidence that ZSM-5 was effectively synthesized under all aging conditions of the aluminosilicate gel. The weights of the ZSM-5 materials consistently grew with increasing aging time and more considerably with increasing aging temperature (Fig. 1d). It should be highlighted that the sols aged at 60–80 °C speed up the production of nuclei compared to sols aged without heat. As a consequence, the synthesis yields of ZSM-5 from the series 60 °C_x and 80 °C_x (where x = 12, 36, 60 h) are high at the same period of hydrothermal stage (170 °C, 18 h). For example, during the same aging period (12 h), the weights of ZSM-5 in a series of Ty-12 h (Ty = RT, 60 °C, 80 °C) samples are 0.133, 0.255, and 0.314 g, respectively. However, whether ZSM-5 crystals were formed during aluminosilicate gel aging or the early stage of hydrothermal cannot be confirmed right now. We simply assume that the synthesis of ZSM-5 consists of two steps: the formation of nuclei at low temperatures (I) and the crystallization of nuclei to produce the final ZSM-5 product (II). R. Selvin et al. claimed that the majority of nucleation occurred during the early stages of hydrothermal synthesis; however, this was not supported by other physical/chemical methods such as XRD and SEM.25 Furthermore, Selvin did not study the effect of hydrothermal treatment; instead, they heated the aged sol at high temperatures (180 °C) for a set period of time (90 min).25 This issue will be thoroughly investigated in the following step and presented in the current work.
The morphologies of the ZSM-5 samples are given in Fig. 2 as the aging time and temperature were varied. As can be observed, all ZSM-5 samples have rectangular parallelepiped crystals. Our results differ from previous studies in that their ZSM-5 morphologies comprised more diverse forms. For example, ZSM-5 synthesis from natural kaolinite utilizing the dealumina technique resulted in nanospherical or rod forms28 and hexagonal prismatic shapes.32,50 Other scientists found that ZSM-5 synthesis from various pure chemical sources showed single hexagonal, twinned hexagonal, spindle,20 cubic,18 and coffin18,19 forms. The various structures, particle sizes, and dissolving rates of the silica sources in an alkaline environment51–54 may contribute to these morphological differences and impact the state of polymerization, distribution, and supersaturation of the silica species in a solution.
It should be noted that the gels aged at RT for 12 and 36 h (Fig. 2a1 and a2) are composed of two-phase crystals: ZSM-5 and the analcime phase. However, at a longer aging period (60 h), only ZSM-5 crystals were produced with no additional crystals or amorphous phases (Fig. 2a3). The appearance of analcime is similar to previous ZSM-5 morphologies reported in the literature that were synthesized with TPA-OH as the structural directing agent.55 As shown in the SEM picture obtained at 15 000 magnifications with a scale of 3 μm, the ZSM-5 crystals have a rectangular parallelepiped form with dimensions of about 4 × 0.5 × 1.5 μm (length × width × height) (see Fig. S3†). The XRD and SEM results revealed that aluminosilicate gels require longer aging times or higher aging temperatures to generate zeolite ZSM-5. All samples that produced ZSM-5 crystals at 60–80 °C without analcime zeolite were observed, even if the aging duration was reduced (12 h) (Fig. 2b1–b3 and c1–c3). However, we can observe that the appearance of the amorphous phase may be due to free species of silica or alumina (red circles in the SEM images). Furthermore, diffraction peaks at 15.9°, 26.1°, and 30.7° are present in all samples, as seen from the XRD patterns. The intensity of these peaks in pure ZSM-5 samples is very low compared to the main peaks at 2θ = 7°–9° and 22°–25°. This shows that analcime zeolite (spherical phases) were formed prior to the formation of ZSM-5. When the aging time or temperature is increased to the required levels, nuclei formation and crystallization are accelerated. Consequently, although using the same hydrothermal conditions (18 h, 170 °C), the weight of ZSM-5 zeolite increased considerably. Under the current experimental conditions, the homogeneous gel must be aged for at least 60 h at RT before hydrothermal treatment to produce pure ZSM-5. Notably, aging at RT can reduce energy usage, resulting in cost savings. This study found that the aging process had a significant impact on the crystallization of ZSM-5, which is consistent with prior research.25,27,51
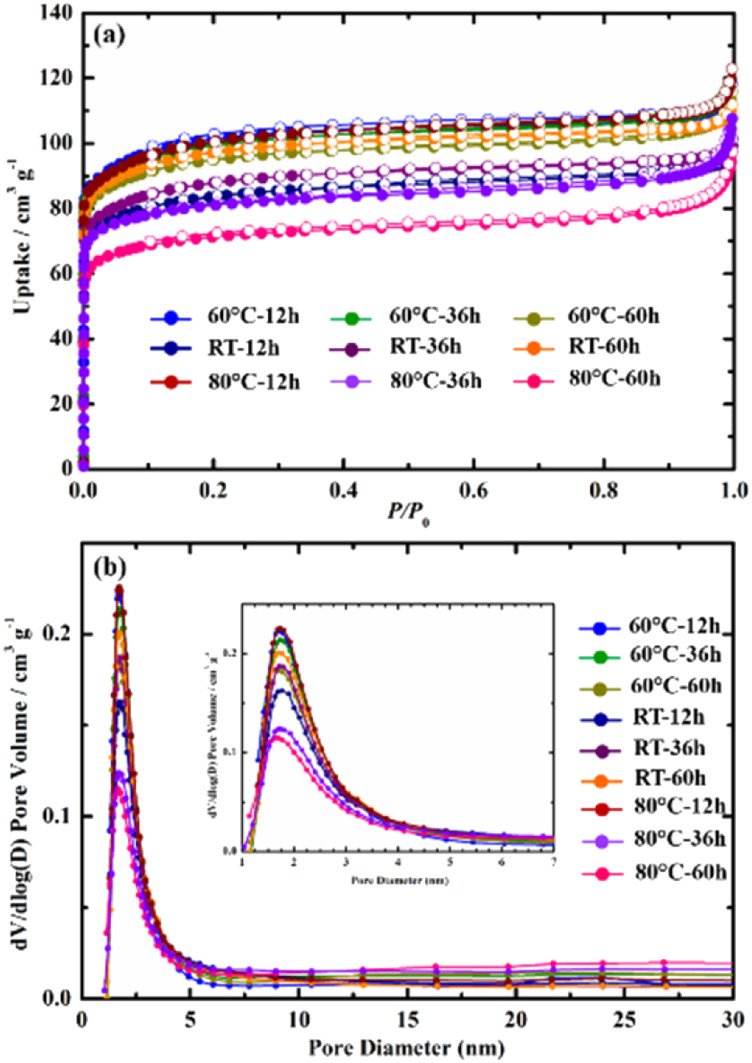
Fig. 3a shows the N2 adsorption and desorption isotherms of the ZSM-5 under different aging conditions. At an initial low relative pressure (P/P0), a rapid rise in adsorbed volume takes place, indicating the presence of micropores. In accordance with IUPAC categorization, the isotherms of all samples were classified as type I (small exterior surfaces and large micropores).56–58 The isotherms of all synthesized ZSM-5 products were similar, implying they had a similar pore structure. When compared to the other samples, the 60 °C-12 h and 80 °C-12 h have an excellent BET surface area (382 and 380 m2 g−1, respectively), which is consistent with the results of Y. J. Wang et al.18 and A. Asghari et al.28 However, with additional aging time, the BET surface area of the samples aged at 60 and 80 °C fell considerably with the 80 °C-60 h sample having the lowest BET surface area (272 m2 g−1) (see Table 2). Comparisons of the porosity of various ZSM-5 products reported by other authors and this work are shown in Table 3.
Fig. 3. N2 adsorption–desorption isotherms at 77 K (a) and DFT pore size distributions (b) of zeolite ZSM-5 with different gel aging treatments.
Comparison of the porosity of ZSM-5 zeolite reported by other authors with this work.
| # | Type of ZSM-5 | Silica/alumina source | Porosity | Ref. | ||
|---|---|---|---|---|---|---|
| BET (m2 g−1) | Pore size (Å) | Pore volume (cm3 g−1) | ||||
| 1 | ZSM-5 | Pure chemical | 268–399 | 7–10 | 0.1–0.15a | 18 |
| 2 | ZSM-5 | Pure chemical | 374 | 26 | 0.087a | 21 |
| 3 | ZSM-5 | Pure chemical | 446–934 | 23–28 | 0.43–0.92b | 22 |
| 4 | ZSM-5 | Pure chemical | 248–360 | NR | 0.09–0.16a | 26 |
| 5 | ZSM-5 | Pure chemical | 356–378 | ∼30 | 0.1–0.13a | 29 |
| 6 | H-ZSM-5 | Pure chemical & ZSM-5 commercial | 350–403 | ∼20 | 0.11–0.12a | 59 |
| 7 | ZSM-5 | Pure chemical | 460 | NR | 0.11a | 33 |
| 8 | NH4-ZSM-5 | Pure chemical | 385–405 | 50–60 nm | 0.1–0.11a | 50 |
| 9 | Al-rich ZSM-5 | ZSM-5 commercial | 376–409 | 10–20 nm | 0.07–0.22c | 60 |
| 10 | ZSM-5 | Biowaste | 400–500 | 5.1–5.8 | 0.18–0.21a | 30 |
| 11 | ZSM-5 | Zeolite Y | 360 | NR | 0.104 | 55 |
| 12 | H-ZSM-5 | Kaolinite clay | 283–389 | 45–98 | 0.12–0.3a | 28 |
| 13 | ZSM-5 | Kaolinite clay | 345–388 | NR | 0.08–0.1a | 32 |
| 14 | ZSM-5d | Bentonite clay | 366 | ∼20 | 0.1a | This study |
| ZSM-5e | 382 | 0.11a | This study | |||
| ZSM-5e | 380 | 0.11a | This study | |||
V micro.
V total.
V meso.
Aged at RT, 60 h.
Aged at 60 °C and 80 °C, 12 h; NR: not reported.
We hypothesized that aging at high temperatures for long periods increases the rate of nuclei production based on N2 physisorption measurements. However, this could also result in the precipitation of a significant amount of free silicon and aluminum. As a result, the dispersion of ZSM-5 seeds in solution is not uniform and the final products contain a significant proportion of amorphous phase, resulting in a low BET surface area. This hypothesis is appropriate considering the SEM images of the samples aged at high temperatures. The amorphous phase can be seen in addition to ZSM-5 crystals (see Fig. 2b1–b3 and c1–c3). T. C. Hoff et al. also found that the nature of Al has a major impact on the crystallization process. Amorphous species, such as Al-rich detritus, can block pores and reduce surface area, making it difficult to access strong acid sites.60 In contrast, the specific surface area of the samples aged at RT increased dramatically with aging time. Indeed, the BET surface area of RT-12 h, RT-36 h, and RT-60 h were 317, 330, and 366 m2 g−1, respectively. Furthermore, there is no appearance of amorphous phase in this series of ZSM-5 samples. Thus, the increase in BET can be explained by the increase of ZSM-5 crystallization degree and the gradual transformation of analcime zeolite into the ZSM-5 zeolite.
The Barrett–Joyner–Halenda (BJH) method was used to assess the pore size distribution of the ZSM-5 zeolites. Fig. 5b shows a high-intensity peak is found at pore sizes of about 2.0 nm in almost all synthesized samples, agreeing with the results from the N2 adsorption–desorption isotherms. In contrast, broad and low-intensity peaks are found in the 80 °C-36 h and 80 °C-60 h samples. Considering the sharp and high-intensity peaks at about 2.0 nm found on all the other samples, we speculate this to be evidence of a microporous structure in all the samples. In general, the RT-60 h, 60 °C-12 h, and 80 °C-12 h samples exhibited the highest BET specific surface area, which make them suitable for adsorption applications. Further, the samples aged at RT for 60 h or at 60–80 °C for 12 h require less energy or time, allowing cost and time savings. Indeed, these samples were high in purity, crystal quality, and yield. As a result, samples RT-60 h, 60 °C-12 h, and 80 °C-12 h were chosen for further investigation.
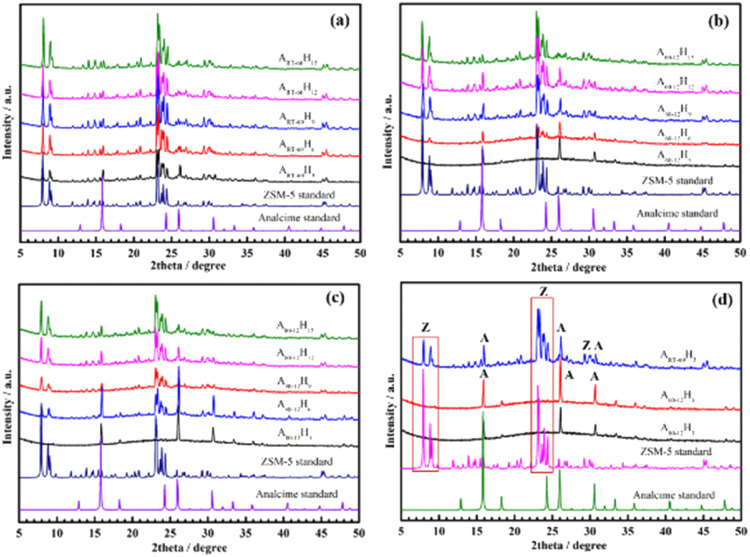
Fig. 5. XRD patterns of ZSM-5 samples at different hydrothermal conditions (a–d).
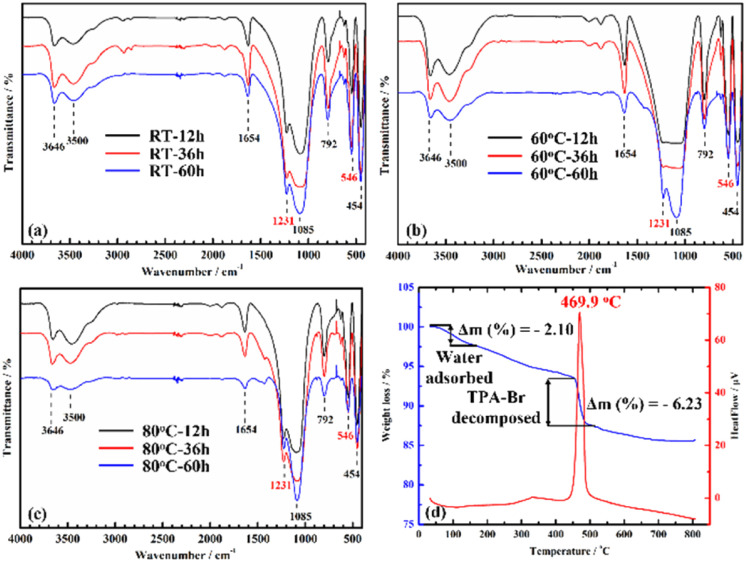
The FTIR spectra of samples that aged at different conditions in the range of 400–4000 cm−1 are given in Fig. 4a–c. It can be clearly observed that the FTIR spectra of all the as-synthesized ZSM-5 is typical of pentasil zeolites. The asymmetric stretch vibration band at 1231 cm−1 is the characteristic signal of ZSM-5, which occurs from external linkages (between TO4 tetrahedral) and is a structure-sensitive IR band.61 The two sharp bands at 1085 and 792 cm−1 are attributed to internal stretching and external symmetrical bands of T–O–T (T = Si, Al), while the vibrational band at 546 cm−1 confirms the presence of the five-membered ring of the pentasil structure.62 Hydroxyl groups (hydrogen bonded Si–OH groups) are responsible for the bands at 3500 and 3646 cm−1. The OH bending vibration is ascribed to the well-defined band at 1654 cm−1. Finally, the band at 454 cm−1 is indicative of the T–O bending vibration of the SiO4 and AlO4 internal tetrahedral.62 The TGA-DSC curve of the ZSM-5 sample was measured to determine the water and TPA-Br template decomposition of the ZSM-5 zeolite (as shown in Fig. 4d). The TGA curve for the synthesized ZSM-5 sample (blue) demonstrated a slight weight loss starting at above 90 °C (the TGA traces exhibited some guest solvent evaporation, such as moisture and air). This is characteristic of porous zeolite materials, particularly ZSM-5, which has a large surface area and permanent porosity. Furthermore, the TGA-DSC curve (red) implies exothermic behavior, which may be caused by decomposing TPA cations trapped in ZSM-5 channels. Significant weight losses recorded at the temperature range 450–500 °C also indicate the loss of TPA-Br (6.23%). As a result, in the current study, all the as-synthesized ZSM-5 samples were calcined at 500 °C for 5 h to entirely remove TPA templates, resulting in guest-free porous ZSM-5 zeolites.
Fig. 4. FTIR spectra of ZSM-5 after various gel aging conditions: RT (a); 60 °C (b); and 80 °C (c). TGA-DSC curve (d) of ZSM-5 zeolites.
2.2. Effect of hydrothermal conditions on the crystallization of ZSM-5 zeolite
The XRD patterns of ZSM-5 synthesized at different periods of hydrothermal treatment from 3–15 h are shown in Fig. 5. According to Fig. 5a, the samples that were aged at RT for 60 h showed the fastest crystallization with the ZSM-5 crystals forming after 3 h hydrothermal treatment (ART-60H3). On the other hand, the gels aged at 60–80 °C for 12 h (A60-12H6 and A80-12H6) required at least 6 h to obtain ZSM-5 crystal peaks (Fig. 5b and c).
Indeed, the A60-12H3 and A80-12H3 samples after 3 h of crystallization do not display the diffraction peak of the ZSM-5 zeolite phase (Z)44 and instead show high intensity diffraction peaks at 15.9°, 26.1°, and 30.7° of analcime zeolite (A),42 as shown in Fig. 5d. Furthermore, these match the XRD patterns of the RT-12 h and RT-36 h samples (Fig. 2a). Therefore, we hypothesize that the analcime zeolite phase formed during the early stages of hydrothermal treatment. These findings also reveal that when the gel was aged for an extended period, a shorter crystallization period was required for the formation of the ZSM-5 crystalline phase. This is comparable to what many other researchers have observed: the aging stage may change the nuclei and crystallization speed, resulting in changes of crystal size and synthesis yield.22–25 When the period of hydrothermal treatment was increased from 3 to 15 h, the crystallinity of the ZSM-5 product significantly increased. All samples crystallized at 15 h exhibited clear diffraction peaks of ZSM-5 while the diffraction peaks at 15.9, 26.1, and 30.7° significantly decreased. This proves that the pure ZSM-5 phase could be obtained under current experimental conditions.
Furthermore, the baseline of these samples was straight, revealing excellent crystallinity and quality of the ZSM-5 crystal, particularly in the ART-60H15 sample. Not only did the hydrothermal treatment increase crystallinity but it also increased the synthesis yield. The crystallinities of the ZSM-5 samples were calculated and are shown in Table 4. In addition to the aging process, hydrothermal treatment is a key factor in improving the crystallinity of ZSM-5 materials. Table 4 shows that as the hydrothermal treatment duration is increased, the crystallinity of the material increases until the crystallinity is essentially constant after about 12–15 h of hydrothermal treatment. After only 3 h of hydrothermal treatment, the ART-60H3 sample exhibited high crystallinity (70.1%), which grew by about 20% to reach 89.6% for the ART-60H15. Meanwhile, when the hydrothermal duration increased from 6°-15 h for samples aged at 60–80 °C/12 h, the crystallinity of ZSM-5 increased by about 25 to 30%. However, as we indicated earlier, increasing the aging period at high temperature (80 °C) considerably lowers the crystallinity (Table S3†). As a result, under our experimental circumstances, aging at ambient temperature is appropriate for the synthesis of ZSM-5 with high crystallinity. Furthermore, in line with what some authors have reported,22,33,45 the hydrothermal process was shown to increase the synthesis efficiency.
Calculation of crystallinity of ZSM-5 sample under different hydrothermal treatment conditions.
| Sample | Crystallinity = [area of crystalline peaka/area of all peaksb] × 100 | ||
|---|---|---|---|
| a | b | Crystallinity (%) | |
| ART-60H3 | 3839.3 | 5480.1 | 70.1 |
| ART-60H6 | 5207.4 | 6582.7 | 79.1 |
| ART-60H9 | 6190.5 | 7407.1 | 83.6 |
| ART-60H12 | 5477.6 | 6636.9 | 82.5 |
| ART-60H15 | 6185.3 | 6902.4 | 89.6 |
| A60-12H3 | Only analcime zeolite | ||
| A60-12H6 | 1568.1 | 3546.3 | 43.0 |
| A60-12H9 | 4121.7 | 5153.5 | 79.9 |
| A60-12H12 | 4858.6 | 6262.5 | 77.6 |
| A60-12H15 | 4543.0 | 5890.9 | 77.1 |
| A80-12H3 | Only analcime zeolite | ||
| A80-12H6 | 2311.5 | 4012.8 | 57.6 |
| A80-12H9 | 2708.8 | 3951.9 | 68.5 |
| A80-12H12 | 3056.1 | 4177.5 | 73.2 |
| A80-12H15 | 3271.5 | 4351.4 | 75.2 |
The area under the diffraction peaks corresponding to the crystalline phase of the material.
The total area under all peaks.
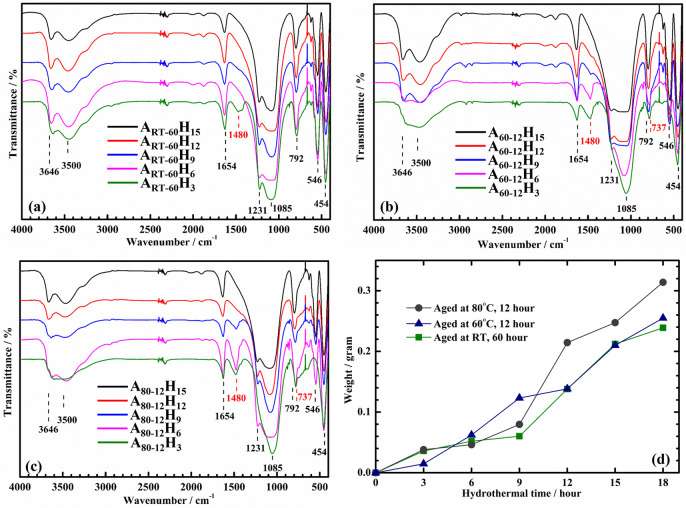
The FTIR spectra of the as-synthesized ZSM-5 at different hydrothermal times are given in Fig. 6a–c and match the XRD patterns. When compared to the A60-12H3 and A80-12H3 samples at the same hydrothermal condition (170 °C, 3 h), only ART-60H3 shows characteristic bands of the ZSM-5 zeolite (546 and 1231 cm−1). Meanwhile, analcime zeolite has well-defined IR bands at 737, 1021, and 1480 cm−1, which can be observed clearly in the A60-12H3 and A80-12H3 samples.43 Other than ART-60H3, the feature IR bands of analcime zeolite are not visible in the FTIR spectra of other samples, as illustrated in Fig. 6a. This shows that ZSM-5 developed after 3 h of hydrothermalization, then its crystallinity steadily increased, and ultimately the pure ZSM-5 phase (ART-60H15) was achieved without analcime zeolite. However, when the aluminosilicate gel was aged at 60–80 °C before hydrothermal treatment, the analcime phase was generated at first, which then progressively changed into the ZSM-5 phase. This is why the signal from analcime zeolite's characteristic IR bands (737, 1021, and 1480 cm−1) steadily decreased and disappeared in the last stage of hydrothermal treatment (A60-12H15 and A80-12H15) (Fig. 6b and c, black line).
Fig. 6. FTIR spectra at various times of hydrothermal treatment at three optimum aging conditions: RT-60 h (a); 60 °C-12 h (b); 80 °C-12 h (c) and weight of ZSM-5 samples with time (d).
Changes in sample weight with hydrothermal time are shown in Fig. 6d. In general, the weight of the product increases with hydrothermal time, with a few notable exceptions listed below. As can be seen, samples aged at 80 °C for 12 h and at RT for 60 h have very similar weight increase trends (the gray and green line from Fig. 6d). Specifically, the weight of ZSM-5 increased slightly during hydrothermal periods of 3–9 h. When the hydrothermal time was increased to 12 h, the mass of ZSM-5 dramatically increased. However, the mass of the ZSM-5 product aged at 60 °C for 12 h grew more uniformly with time (the blue line). Recall that the two samples A60-12H3 and A80-12H3 did not generate ZSM-5 crystals after 3 h of hydrothermal treatment. However, after hydrothermal treatment for 18 h, ZSM-5 crystals were produced and their weight substantially increased, and the weight of samples A60-12H18 and A80-12H18 were slightly higher than that of ART-60H18. If the hydrothermal treatment time increases, the product mass may continue to increase as well. This, however, is a waste of time and energy. Therefore, we select 18 h as the ideal hydrothermal time to achieve an optimal combination of performance, cost, and duration for ZSM-5 synthesis.
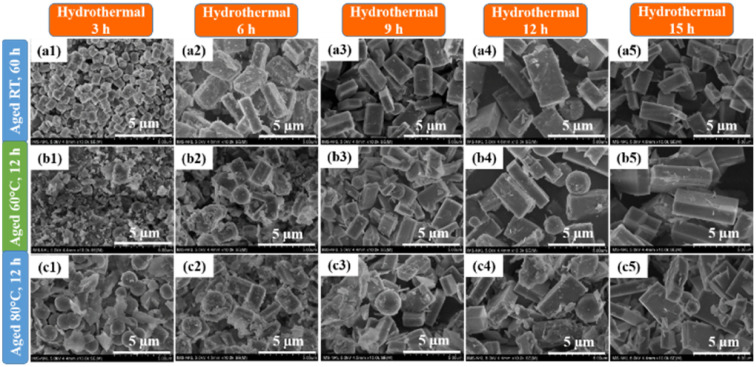
Fig. 7 depicts the microstructure and morphologies of the synthesized ZSM-5 samples. After 3 h of hydrothermal treatment, the ART-60H3 sample began to form ZSM-5 crystals (Fig. 7a1). Meanwhile, samples A60-12H3 and A80-12H3 revealed a highly distinct spherical crystalline phase (analcime zeolite) and many amorphous phases (Fig. 7b1 and c1). This is entirely consistent with the FTIR results and XRD patterns with the latter showing typical diffraction peaks of analcime zeolite at 15.9°, 26.1°, and 30.7°. These peaks can also be seen in the XRD scan of sample ART-60H3 next to the major peaks at 2θ = 7–9° and 22–25°, indicating the presence of analcime zeolite in addition to the crystalline ZSM-5 phase (see Fig. 5a1). When the hydrothermal time was increased to 6 h, the ZSM-5 crystals became more observable. For all three optimum aging conditions, the crystallinity increased as the hydrothermal duration increased to 9, 12, and 15 h. Only ZSM-5 crystals and a few amorphous phases were found after 15 h of hydrothermal treatment (Fig. 7a5, b5 and c5).
Fig. 7. SEM images of ZSM-5 crystal at various crystallization conditions.
ZSM-5 crystals synthesized from bentonite clay are rectangular in shape, but other authors have claimed that ZSM-5 synthesized from kaolin clay has a variety of different shapes.28,32,50 The difference can be attributed to the initial conditions (SiO2/Al2O3 ratio, concentration of NaOH, liquid silica, template,…)18–20 as well as synthesis conditions such as aging and hydrothermal treatment,21,22 which cause changes in polymerization state, distribution, and supersaturation of Si species in a solution.51–54 We can observe from the XRD, SEM, and FTIR data, as well as the weight of the products produced, that the hydrothermal process had a significant impact on the synthesis of ZSM-5. Also, the hydrothermal procedure aids in increasing the synthesis efficiency, increasing crystallinity, and demonstrating the creation and growth of the ZSM-5 material. Apparently, the production of ZSM-5 crystals begins with a spherical crystalline phase, followed by a phase transition into a rectangular crystal. In addition, certain aging times and temperatures shorten the crystallization process, improving the efficiency through the generation of large amounts of crystal nuclei during the aging process. However, as we have demonstrated, aging at high temperatures over an extended period causes an agglomeration of a substantial quantity of alumina and free silica, resulting in a considerable amount of amorphous phase in the product. Longer aging at room temperature, on the other hand, not only shortens the crystallization process but also generates high quality crystals. This particular aging process is cost effective as it consumes no energy, which is why most researchers carry out aging at room temperature.21,23,24
3. Experimental
3.1. Materials and general procedures
Lam Dong bentonite clay and sodium silicate (Na2SiO3·5H2O) were purchased from Vietnam. Sodium hydroxide pellets (NaOH, 99%) and tetrapropylammonium bromide (TPA-Br, 99%) were acquired from Sigma-Aldrich (Saint Louis, MO, USA). All other chemicals were used without further purification unless otherwise stated. Water was obtained using the deionized system Barnstead Easypure II (17.4 MΩ cm resistivity).
Powder X-ray diffraction (XRD) data were collected using a Bruker D8 Advance (Billerica, MA, USA) with Ni-filtered (0.2 mm) Cu Kα radiation (λ = 1.5401 Å) at 1600 W (40 kV, 40 mA) power. The 2θ range was 5°–50° with a step size of 0.02° and a fixed counting time of 0.25 s per step. Low pressure N2 adsorption experiments were conducted using an Autosorb iQ volumetric gas sorption analyzer. Ultrapure (99.999%) N2 and He gases were used for the adsorption measurements. Liquid N2 (77 K) was used for all N2 isotherm measurements. The microstructure and chemical composition were analyzed using a scanning electron microscope (SEM, Hitachi S-4800, Japan) operated at an accelerating voltage of 5 kV. The energy dispersive X-ray (EDX) spectroscopy attachment in the SEM was used to determine the chemical composition. An FTIR spectrometer (PerkinElmer Frontier, USA) was used to determine specific vibrations of the material within the wavenumber range of 400–4000 cm−1 using potassium bromide (KBr) pellets. Thermogravimetric analysis and differential scanning calorimetry (TGA-DSC) were performed using a Labsys Evo (TG-DSC 1600 °C, France). The analyzed materials were placed on a platinum pan under airflow, which was heated up to 800 °C at a constant rate of 10 °C min−1.
3.2. Synthesis and activation of the ZSM-5 zeolite
3.2.1. Refinement of raw bentonite clay
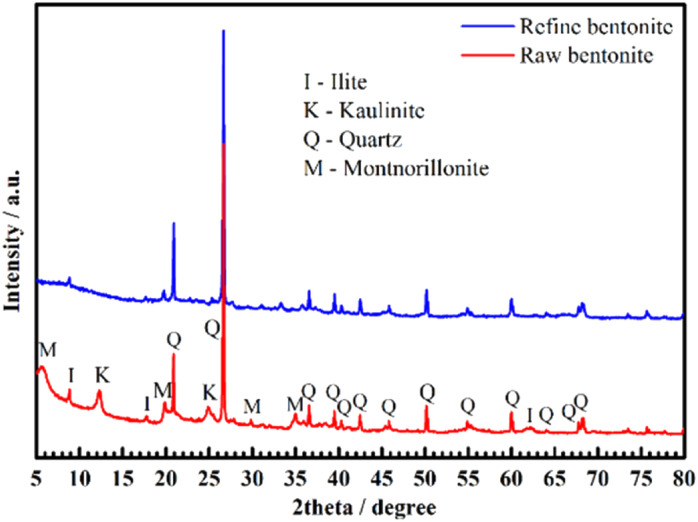
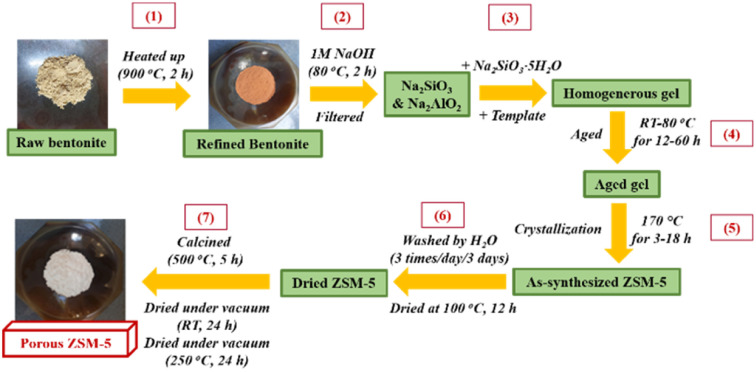
Bentonite clay used in the synthesis of ZSM-5 were refined following a previously reported metabentonite technique.63,64 Bentonite undergoes different modifications under the effect of temperature, which are the causes of the loss of its binding characteristics. As a result, the following processes may occur: dehydration (under 300 °C); dehydroxylation (500–700 °C); decomposition and recrystallization (800–1050 °C).64 In this work, raw bentonite was calcined at 900 °C for 2 h to the transformation of a crystal structure into an amorphous phase (so-called ref-LDB).65 The chemical components of raw bentonite and ref-LDB were analyzed using X-ray fluorescence (XRF). These results are given in Table S1 (ESI†). The results showed that the main components of the raw and refined bentonite are oxides of Si and Al (wt% of SiO2, Al2O3 are 51.00%, 21.16% and 63.3%, 22.53% before and after refinement, respectively), which are appropriate for the synthesis of high-silica ZSM-5. The loss on ignition (LOI) of raw bentonite are 12.44%, which are calculated by chemical analysis and shown in Table S1.† The XRD pattern of bentonite and refined bentonite clay are shown in Fig. 8. The primary phases in the XRD pattern of Lam Dong bentonite clay are montmorillonite (M) and quartz (Q), which correspond to the previous publication.63,66 Ilite (I) and kaolinite (K) are also found in the bentonite. After refinement, the diffraction signals of the K, I, and M phases dramatically decreased, whereas the diffraction signal of the Q phase increased sharply.
Fig. 8. XRD pattern of bentonite clay (red) and refined bentonite clay (blue).
The SiO2/Al2O3 molar ratios in the ZSM family of zeolites are quite high. Instead of treating the re-LDB sample with sulfuric acid (H2SO4) for an extended amount of time to extract part of its alumina oxide content, we enhanced the sample by including an additional source of silica in the reaction mixture (sodium silicate, Na2SiO3·5H2O).28,32,67 The aluminosilicate gel utilized for ZSM-5 synthesis was completed with minor changes to the gel component, as reported in previous publications28,31,32,67 and was based on the molar ratio 2TPA-Br : 5Na2O : Al2O3 : 48SiO2 : 1300H2O. Scheme 1 shows the bentonite treatment (1), synthesis (2–5), and activation procedure (6–7) of microporous ZSM-5 zeolite.
Scheme 1. Bentonite treatment (1), synthesis (2–5), and activation procedures (6–7) of microporous ZSM-5 using ref-LDB.
3.2.2. Synthesis procedure
In a typical ZSM-5 synthesis procedure, NaOH pellets (1.77 g, 0.0443 mmol) were dissolved in 44.25 mL deionized water and stirred at room temperature (RT). The ref-LDB sample (2 g) is progressively added to the solution for 1 h while continually stirring at 80 °C for an additional 2 h. The mixture was then filtered to collect the sodium silicate (Na2SiO3) and sodium aluminate solution (NaAlO2). To this solution, Na2SiO3·5H2O (44.2 g, 0.2084 mmol), 17.65 mL TPABr solution (2.35 g, 0.0088 mmol), and 42 mL deionized water were slowly added, respectively. After 1 h of stirring, the aluminosilicate gel was aged for 12, 36, and 60 h at RT, 60, and 80 °C in a 100 mL glass bottles before being hydrothermally treated at 170 °C in Teflon-lined autoclaves for various crystallization periods (3, 6, 9, 12, 15, and 18 h). The details of the experiments are shown in Table S2 (ESI†).
3.2.3. Activation procedure
The as-synthesized ZSM-5 was thoroughly washed with deionized water (3 × 50 mL per day for 3 d) and dried at 100 °C for 12 h. The dried ZSM-5 was then calcined at 500 °C for 5 h to entirely remove the organic template (TPA-Br). Finally, ZSM-5 was dried under vacuum at RT overnight, followed by heating at 250 °C for an additional 24 h to produce guest-free porous materials for application or adsorption measurements.
4. Conclusion
The effects of aging and hydrothermal conditions on the crystallization of ZSM-5 synthesized from bentonite clay were studied in this work. Techniques such as XRD, SEM-EDX, FTIR, TGA-DSC, and BET-BJH were used to characterize the properties of the ZSM-5 materials. Three aging temperatures (RT, 60, and 80 °C) over three time periods (12, 36, and 60 h) were investigated. Then, the aged gels were crystallized at 170 °C for 3, 6, 9, 12, 15, and 18 h. The results showed that aging increases the number of seeds and decreases the duration of crystallization, resulting in a substantial improvement in synthesis yield. Long-term aging at 60 and 80 °C reduces the BET specific surface area; however, extending the aging period at RT increases the surface area because the produced ZSM-5 has high purity, and the amorphous phase is absent. When the period of hydrothermal treatment was increased, the crystallinity and weight of the synthesized ZSM-5 increased considerably. The XRD, SEM, and FTIR findings also revealed that the crystalline phase is analcime zeolite (spherical) before producing rectangular ZSM-5 crystals. Ultimately, the optimally synthesized ZSM-5 (ART-60H18) had high purity and crystallinity and thermal stability. Furthermore, the material is microporous in nature with large specific surface area (380 m2 g−1) and large pore size (about 2.0 nm), making it ideal for adsorption and catalytic applications.
Author contributions
Conceptualization: Van-Phuc Dinh, Duy-Khoi Nguyen; data curation: Van-Phuc Dinh, Duy-Khoi Nguyen; formal analysis and investigation: Duy-Khoi Nguyen, Van-Phuc Dinh, N. T. Dang, D. Thanh Khan, Nguyen Trong Hung, Nhu Hoa Thi Tran; methodology: Van-Phuc Dinh, Nguyen Trong Hung; supervision: Van-Phuc Dinh; writing – original draft: Duy-Khoi Nguyen, Nguyen Trong Hung, Van-Phuc Dinh.
Conflicts of interest
There are no conflicts to declare.
Supplementary Material
Acknowledgments
This work was supported by Ho Chi Minh City Department of Science and Technology under grant number of 1040/QĐ-SKHCN. The authors also thank Nguyen Tat Thanh University, Ho Chi Minh City, Vietnam to provide the facilities required to carry out this work.
Electronic supplementary information (ESI) available. See DOI: https://doi.org/10.1039/d3ra02552g
References
- Verboekend D. Pérez-Ramírez J. J. C. S. Catal. Sci. Technol. 2011;1:879–890. [Google Scholar]
- Tzeng Y.-Z. Chang C.-J. Yang M.-C. Tsai M.-J. Teramura K. Tanaka T. Lee H. V. Juan J. C. Wu J.-Y. Lin Y.-C. Catal. Today. 2021;375:70–78. [Google Scholar]
- Wang Z. Wang L. Jiang Y. Hunger M. Huang J. ACS Catal. 2014;4:1144–1147. [Google Scholar]
- Zhao T. Li F. Yu H. Ding S. Li Z. Huang X. Li X. Wei X. Wang Z. Lin H. Appl. Catal., A. 2019;575:101–110. [Google Scholar]
- Pan M. Zheng J. Liu Y. Ning W. Tian H. Li R. J. Catal. 2019;369:72–85. [Google Scholar]
- Auepattana-aumrung C. Márquez V. Wannakao S. Jongsomjit B. Panpranot J. Praserthdam P. Sci. Rep. 2020;10:13643. doi: 10.1038/s41598-020-70568-z. [DOI] [PMC free article] [PubMed] [Google Scholar]
- Borai E. H. Harjula R. Malinen L. Paajanen A. J. Hazard. Mater. 2009;172:416–422. doi: 10.1016/j.jhazmat.2009.07.033. [DOI] [PubMed] [Google Scholar]
- Zhang B. Sun H.-Y. Li J. Li L.-Z. Deng Y.-L. Liu S.-H. Feng M.-L. Huang X.-Y. Inorg. Chem. 2019;58:11622–11629. doi: 10.1021/acs.inorgchem.9b01531. [DOI] [PubMed] [Google Scholar]
- Bolisetty S. Peydayesh M. Mezzenga R. Chem. Soc. Rev. 2019;48:463–487. doi: 10.1039/c8cs00493e. [DOI] [PubMed] [Google Scholar]
- Radoor S. Karayil J. Jayakumar A. Parameswaranpillai J. Siengchin S. Colloids Surf., A. 2021;611:125852. [Google Scholar]
- Zhang Z. Wu J. Li B. Xu H. Liu D. Chem. Eng. J. 2019;375:121946. [Google Scholar]
- Wang X. Shao D. Hou G. Wang X. Alsaedi A. Ahmad B. J. Mol. Liq. 2015;207:338–342. [Google Scholar]
- Gao X. Zhang P. Yang J. Sun X. Fu Y. Shi K. Chai Z. Wu W. Appl. Radiat. Isot. 2018;139:231–237. doi: 10.1016/j.apradiso.2018.05.019. [DOI] [PubMed] [Google Scholar]
- Chang C. D. Silvestri A. J. J. Catal. 1977;47:249–259. [Google Scholar]
- Kokotailo G. T. Lawton S. L. Olson D. H. Meier W. M. Nature. 1978;272:437–438. [Google Scholar]
- Anderson J. R. Foger K. Mole T. Rajadhyaksha R. A. Sanders J. V. J. Catal. 1979;58:114–130. [Google Scholar]
- Pham T. C. T. Kim H. S. Yoon K. B. J. S. Science. 2011;334:1533–1538. doi: 10.1126/science.1212472. [DOI] [PubMed] [Google Scholar]
- Wang Y.-J. Cao J.-P. Ren X.-Y. Feng X.-B. Zhao X.-Y. Huang Y. Wei X.-Y. Fuel. 2020;268:117286. [Google Scholar]
- Mohamed R. M. Aly H. M. El-Shahat M. F. Ibrahim I. A. Microporous Mesoporous Mater. 2005;79:7–12. [Google Scholar]
- Zhang L. Liu S. Xie S. Xu L. Microporous Mesoporous Mater. 2012;147:117–126. [Google Scholar]
- Chen Z. Li Z. Zhang Y. Chevella D. Li G. Chen Y. Guo X. Liu J. Yu J. Chem. Eng. J. 2020;388:124322. [Google Scholar]
- Gonçalves M. L. Dimitrov L. D. Jordão M. H. Wallau M. Urquieta-González E. A. Catal. Today. 2008;133–135:69–79. [Google Scholar]
- Huang L. Guo W. Deng P. Xue Z. Li Q. J. Phys. Chem. B. 2000;104:2817–2823. [Google Scholar]
- Frunz L. Prins R. Pirngruber G. D. Microporous Mesoporous Mater. 2006;88:152–162. [Google Scholar]
- Selvin R. Hsu H.-L. Roselin L. S. Bououdina M. Synth. React. Inorg., Met.-Org., Nano-Met. Chem. 2011;41:1028–1032. [Google Scholar]
- Jun J. W. Ahmed I. Kim C.-U. Jeong K.-E. Jeong S.-Y. Jhung S. H. Catal. Today. 2014;232:108–113. [Google Scholar]
- Snyder M. A. Tsapatsis M. Angew. Chem., Int. Ed. 2007;46:7560–7573. doi: 10.1002/anie.200604910. [DOI] [PubMed] [Google Scholar]
- Asghari A. Khorrami M. K. Kazemi S. H. Sci. Rep. 2019;9:17526. doi: 10.1038/s41598-019-54089-y. [DOI] [PMC free article] [PubMed] [Google Scholar]
- Noor P. Khanmohammadi M. Roozbehani B. Yaripour F. Bagheri Garmarudi A. J. Energy Chem. 2018;27:582–590. [Google Scholar]
- Lin K.-S. Wang H. P. Chang N.-B. Jou C. J. G. Hsiao M. C. Energy Sources. 2003;25:565–576. [Google Scholar]
- Kovo A. S. Hernandez O. Holmes S. M. J. Mater. Chem. 2009;19:6207–6212. [Google Scholar]
- Lafi A. A.-h. F. Matam S. K. Hodali H. A. Ind. Eng. Chem. Res. 2015;54:3754–3760. [Google Scholar]
- Hsu C.-Y. Chiang A. S. T. Selvin R. Thompson R. W. J. Phys. Chem. B. 2005;109:18804–18814. doi: 10.1021/jp0526391. [DOI] [PubMed] [Google Scholar]
- Petrik L. F., O'Connor C. T. and Schwarz S., in Studies in Surface Science and Catalysis, Elsevier, 1995, vol. 94, pp. 517–524 [Google Scholar]
- Chen C. Park D.-W. Ahn W.-S. Appl. Surf. Sci. 2014;292:63–67. [Google Scholar]
- Ma H. Yao Q. Fu Y. Ma C. Dong X. Ind. Eng. Chem. Res. 2010;49:454–458. [Google Scholar]
- Faghihian H. Godazandeha N. J. Porous Mater. 2009;16:331–335. [Google Scholar]
- Hamidi R. Khoshbin R. Karimzadeh R. Adv. Powder Technol. 2021;32:524–534. [Google Scholar]
- Vajglová Z. Kumar N. Peurla M. Peltonen J. Heinmaa I. Murzin D. Y. Catal. Sci. Technol. 2018;8:6150–6162. [Google Scholar]
- Dinh V.-P. Nguyen P.-T. Tran M.-C. Luu A.-T. Hung N. Q. Luu T.-T. Kiet H. A. T. Mai X.-T. Luong T.-B. Nguyen T.-L. Ho H. T. T. Nguyen D.-K. Pham D.-K. Hoang A.-Q. Le V.-T. Nguyen T.-C. Chemosphere. 2022;286:131766. doi: 10.1016/j.chemosphere.2021.131766. [DOI] [PubMed] [Google Scholar]
- Arthur G. C. Robert W. D. Clays Clay Miner. 2010;10:272–283. [Google Scholar]
- Mazzi F. Galli E. Am. Mineral. 1978;63:448–460. [Google Scholar]
- Sari Z. G. L. V. Younesi H. Kazemian H. Appl. Nanosci. 2015;5:737–745. [Google Scholar]
- Schmidt W. Wilczok U. Weidenthaler C. Medenbach O. Goddard R. Buth G. Cepak A. J. Phys. Chem. B. 2007;111:13538–13543. doi: 10.1021/jp075934p. [DOI] [PubMed] [Google Scholar]
- Hou L.-Y., Sand L. B. and Thompson R. W., in Studies in Surface Science and Catalysis, Elsevier, 1986, vol. 28, pp. 239–246 [Google Scholar]
- Peter A. and Johan A., in Studies in Surface Science and Catalysis, Elsevier, 1987, pp. 47–111 [Google Scholar]
- Van Grieken R. Sotelo J. L. Menéndez J. M. Melero J. A. Microporous Mesoporous Mater. 2000;39:135–147. [Google Scholar]
- Cundy C. S. Forrest J. O. Plaisted R. J. Microporous Mesoporous Mater. 2003;66:143–156. [Google Scholar]
- Cundy C. S. Forrest J. O. Microporous Mesoporous Mater. 2004;72:67–80. [Google Scholar]
- Xue T. Wang Y. M. He M.-Y. Microporous Mesoporous Mater. 2012;156:29–35. [Google Scholar]
- Li Q. Mihailova B. Creaser D. Sterte J. Microporous Mesoporous Mater. 2001;43:51–59. [Google Scholar]
- Kalipcilar H. Culfaz A. Cryst. Res. Technol. 2001;36:1197–1207. [Google Scholar]
- Mintova S. Valtchev V. Microporous Mesoporous Mater. 2002;55:171–179. [Google Scholar]
- Raileanu M. Popa M. Moreno J. M. C. Stanciu L. Bordeianu L. Zaharescu M. J. Membr. Sci. 2002;210:197–207. [Google Scholar]
- dos Santos M. B. Vianna K. C. Pastore H. O. Andrade H. M. C. Mascarenhas A. J. S. Microporous Mesoporous Mater. 2020;306:110413. [Google Scholar]
- Sing K. S. W. Pure Appl. Chem. 1985;57:603–619. [Google Scholar]
- Kumar M. S. Pérez-Ramírez J. Debbagh M. N. Smarsly B. Bentrup U. Brückner A. Appl. Catal., B. 2006;62:244–254. [Google Scholar]
- Sun Q. Wang N. Guo G. Chen X. Yu J. J. Mater. Chem. A. 2015;3:19783–19789. [Google Scholar]
- Lee T. H. Jeong H. Jeong B. H. Han J. S. Gim M. Y. Kim D. H. Kim S. H. Lee K. B. Appl. Surf. Sci. 2020;511:145398. [Google Scholar]
- Hoff T. C. Gardner D. W. Thilakaratne R. Proano-Aviles J. Brown R. C. Tessonnier J.-P. Appl. Catal., A. 2017;529:68–78. [Google Scholar]
- Cheng Y. Wang L.-J. Li J.-S. Yang Y.-C. Sun X.-Y. Mater. Lett. 2005;59:3427–3430. [Google Scholar]
- Ismail A. A. Mohamed R. M. Fouad O. A. Ibrahim I. A. Cryst. Res. Technol. 2006;41:145–149. [Google Scholar]
- Zivica V. Palou M. T. Composites, Part B. 2015;68:436–445. [Google Scholar]
- Holtzer M. Bobrowski A. Żymankowska-Kumon S. J. Mol. Struct. 2011;1004:102–108. [Google Scholar]
- Grim R. E. Bradley W. F. J. Am. Ceram. Soc. 1940;23:242–248. [Google Scholar]
- Yaghmaeiyan N. Mirzaei M. Delghavi R. Results Chem. 2022;4:100549. [Google Scholar]
- Abdmeziem K. Siffert B. Appl. Clay Sci. 1994;8:437–447. [Google Scholar]
Associated Data
This section collects any data citations, data availability statements, or supplementary materials included in this article.


