

Abstract
Protein expression varies as a result of intricate regulation of synthesis and degradation of messenger RNAs (mRNA) and proteins. Studies of dynamic regulation typically rely on time-course data sets of mRNA and protein expression, yet there are no statistical methods that integrate these multiomics data and deconvolute individual regulatory processes of gene expression control underlying the observed concentration changes. To address this challenge, we developed Protein Expression Control Analysis (PECA), a method to quantitatively dissect protein expression variation into the contributions of mRNA synthesis/degradation and protein synthesis/degradation, termed RNA-level and protein-level regulation respectively. PECA computes the rate ratios of synthesis versus degradation as the statistical summary of expression control during a given time interval at each molecular level and computes the probability that the rate ratio changed between adjacent time intervals, indicating regulation change at the time point. Along with the associated false-discovery rates, PECA gives the complete description of dynamic expression control, that is, which proteins were up- or down-regulated at each molecular level and each time point. Using PECA, we analyzed two yeast data sets monitoring the cellular response to hyperosmotic and oxidative stress. The rate ratio profiles reported by PECA highlighted a large magnitude of RNA-level up-regulation of stress response genes in the early response and concordant protein-level regulation with time delay. However, the contributions of RNA- and protein-level regulation and their temporal patterns were different between the two data sets. We also observed several cases where protein-level regulation counterbalanced transcriptomic changes in the early stress response to maintain the stability of protein concentrations, suggesting that proteostasis is a proteome-wide phenomenon mediated by post-transcriptional regulation.
Keywords: time series, post-transcriptional regulation, proteostasis, rate ratios, synthesis, degradation, stress response
Graphical Abstract
INTRODUCTION
RNA concentration has been used as a surrogate measure of final protein concentration in the cell due to highly accessible technologies such as gene expression microarrays and next-generation sequencing in the biological and clinical research.1,2 However, gene expression is controlled during all steps of the protein synthesis pathway, including transcription and RNA degradation at the RNA level and translation and protein degradation at the protein level. Moreover, the relative contribution of each regulatory process to the final output is still largely unknown. For example, although the transcriptome is heavily reprogrammed under environmental stress3,4 and translation and protein degradation also change substantially,5–10 the exact timing and relative contribution of each regulatory process and the interaction between different processes are unclear.
In the past, this information gap was due to the difficulty of generating proteome-wide expression data sets with sufficient coverage and quantitative precision, especially in a time-resolved manner. Thanks to recent advances in large-scale high-resolution mass spectrometry (MS), similarly comprehensive quantitative proteomics data sets are now becoming available with longitudinal designs (e.g., following a treatment of interest). For example, Fournier et al. (2010) measured mRNA and protein expression over several hours in yeast cells after rapamycin treatment, demonstrating that mRNA and protein expression profiles are correlated with time delay.11 Lee et al. (2011) and Vogel et al. (2011) also reported time-course transcriptomic and proteomic data sets for the osmotic and oxidative yeast stress response, respectively, and described the distinct roles of regulation at the level of RNAs and proteins, in which transcription changes alone explained only a fraction of the observed protein concentration changes.12,13 While these results are intriguing, statistical analysis was limited to linear correlation or the analysis of variance, separately applied to RNA and protein data sets. In other words, there is no generalizable method to objectively assign confidence measures on the RNA-level and protein-level regulation based on joint analysis of the two data sets.
With the emergence of these new data sets, time is now ripe to develop robust statistical methods to identify candidate genes that are regulated at the RNA or protein levels and to quantitatively dissect the different layers of gene expression control. Because the final protein concentration is the combined result of these processes, the key task is to construct a mathematical model of gene regulation, equipped with appropriate kinetic parameters for transcription, translation, and the respective degradation that can deconvolute the different levels in regulation. For example, we may observe an increase in protein concentration that is entirely attributable to increased transcription (and subsequently mRNA copy numbers) with no further regulation at the level of translation (left panel of Figure 1A). Conversely, mRNA transcript copies may not change or even decrease, while the final protein concentrations increase due to increased translation or decreased protein degradation. In a more sophisticated scenario, mRNA transcript copies change significantly, but the protein concentrations remain unchanged, which can be explained only by additional regulation at the protein level to balance the relative ratio of translation and degradation rates for proteostasis (right panel of Figure 1A).14 With a mathematical framework to address this challenge, the synthesis-degradation rate ratios can be inferred and formally tested, providing statistically rigorous and unbiased interpretation of the regulatory mechanism that resulted in the observed concentration changes for each protein. In other words, we convert expression data into information on the rates of changes and regulation.
Figure 1.

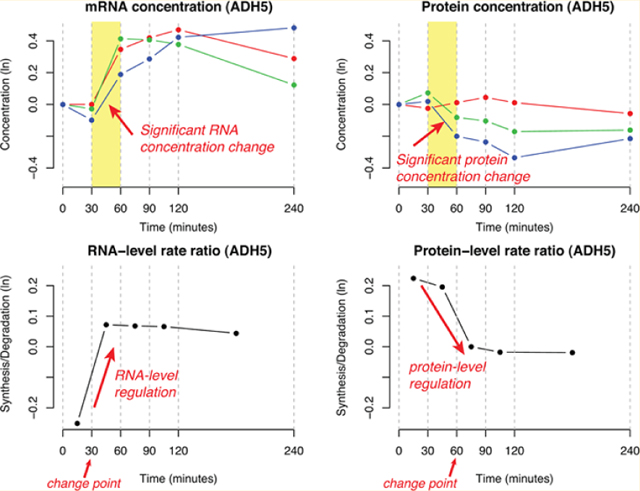
(A) Hypothetical examples of RNA-level regulation and protein-level regulation. refer to the protein synthesis and degradation rates during the t-th time interval, respectively. are the corresponding RNA-level rate parameters. PECA models the ratio of the two rates over the time course. The left panel illustrates the case in which protein concentration is entirely regulated at the RNA level, that is, with no change in the protein-level kinetic parameters. The right panel shows the case in which protein concentration is regulated at both RNA and protein level, where the protein-level regulation compensates the RNA-level regulation to maintain the protein homeostasis, which is not easy to see from the concentration data alone. (B) Extraction of RNA- and protein-level regulation signals in alcohol dehydrogenase class-3 protein encoded by ADH5 gene. The upper panels of the Figure show the time course of mRNA and protein concentrations of ADH5 after an osmotic shock. The lower panels show the kinetic parameters (rate ratios) during time intervals at both levels, as reported by PECA. The protein-level rate ratio is estimated accounting for the available amount of mRNA at the beginning of each time interval. The consistency of rate ratio profiles across the replicates is automatically taken into consideration in the estimation process.
In this work, we propose a statistical modeling framework called Protein Expression Control Analysis (PECA) to identify genes putatively regulated at the RNA or protein levels based on parallel time-course expression data sets. Adopting the kinetic mass-action model used in the simulation exercise by Lee et al.,12 PECA dissects the change in the protein concentration during each time interval (i.e., the period between adjacent time points) into two potential sources: the change in the concentration of mRNA transcripts and the change in the protein synthesis/degradation rate ratios. This deconvolution renders the inferred protein rate ratios specific to the regulation at the protein level. As explained later, the same model can be posited to infer the RNA rate ratios to infer RNA-level regulation, under the reasonable assumption that the DNA copy numbers do not change over time. For both analyses, PECA derives the posterior probability that the rate ratio of synthesis versus degradation changed at each time point (before and after each time point), along with the associated false discovery rates (FDRs).15 This scoring framework leads to unbiased statistical framework of regulation changes at both molecular levels.
We remark that there are a few methods for analyzing time-course data sets in the current statistics and bioinformatics literature.16–19 However, these methods are not suitable for the multiomics data of our interest, especially for detecting regulation at the RNA and protein levels simultaneously. First, those methods are designed to analyze single-source data sets (e.g., transcriptomics data alone) and they do not explicitly model the kinetic parameters of synthesis and degradation. Second, they are not able to account for the contribution of mRNA concentration changes when analyzing protein-level regulation. Third, they perform statistical tests whether the expression has changed anywhere in the time course, not the temporal changes of regulatory parameters at specific time points and the direction of change, which is offered by PECA. More recently, computational methods for kinetic patterns in longitudinal biomolecular data came about in the metabolomics literature,20,21 but those methods are not applicable to multiomics data. The motivation for developing PECA is in the analysis of multiomics data, where the effect of regulation in one molecular level (RNA) must be subtracted from the concentration change to infer the effect of regulation in the other level (protein).
RESULTS AND DISCUSSION
Statistical Model for RNA and Protein-Level Regulation
We first describe the statistical model of PECA for protein-level regulation for the mRNA and protein expression data. We will then explain how we can apply the same model to analyse RNA-level regulation using gene expression data alone. To analyze protein-level regulation, we use paired mRNA and protein expression data for protein in replicates observed at time points , denoted by and , respectively (Figure 1A). Time indicates the beginning point of the time course just before the treatment of interest. We assume that the observed concentration of each protein follows a log-normal distribution . We aim to infer the translation and protein degradation rate and as functions of time , which are required to be non-negative at all times. Fluctuation in any of these two rates indicates protein-level regulation, inducing the change in the rate of translation or protein degradation and thus ultimately affecting the overall protein synthesis. If the two rates are constant over time, then translation and protein degradation are assumed to take place without additional forms of regulation, and protein concentration will be determined solely by the available amount of mRNA.
Using the notations above, we express the protein concentration change between two consecutive time points as
| (1) |
Note that if all kinetic parameters remain constant across the time course then this equation can be written as an ordinary differential equation (ODE). However, the goal of our analysis is to detect the changes in these parameters in dynamic conditions. Moreover, transcriptomics and proteomics experiments cannot be performed for a sufficient number of time points (e.g., tens or hundreds of time points) to allow accurate inference of either ODEs or continuous-time stochastic process (e.g., Gaussian process).
Alternatively, we developed a different approach based on a discrete stochastic process in which the rate functions are assumed to be piecewise constant: between two consecutive time points, the rate functions are constant so that and over the interval for each protein . Denoting the length of interval by , this simplifies the model to
| (2) |
for . For protein at time point , the observed mRNA and protein concentration is and respectively, and the protein concentration at time point will change to . This is based on the mass-action kinetic model similar to Lee et al.12 While the discrete nature of eq 2 can be an oversimplification of the continuous processes, it captures the essential notion that the protein concentration change is expressed as the difference between the amount of newly synthesized proteins and the amount of protein degradation, and it also provides the basis for formulating each time point as a potential change point of regulation (see later). That is, the nominal change in protein concentration can be rewritten as , that is, a combined effect of either translation or protein degradation, or both.
Unfortunately, it is not possible to distinguish whether is a result of or , or likely a combination of both, because there are infinitely many solutions of to explain the observed difference . This phenomenon is known as the identifiability problem in the statistics literature.22 In PECA, we address this issue by imposing an appropriate constraint on the sum of the rate parameters so that the rate ratio can be estimated uniquely during each time interval. (See the Materials and Methods section.) Because of the constraint, we lose the ability to infer the absolute rates of synthesis and degradation, but we can still infer the direction of concentration change through monitoring of the rate ratio across the time intervals. In addition, we can formally test whether each time point is a change point at which the rate ratios change significantly between the adjacent time intervals, that is, . We refer the readers to the Materials and Methods section for the detailed mathematical formulation of the model.
So far, we have focused on the statistical model for analyzing protein-level regulation, but the same mathematical model as in eq 2 can be applied to mRNA data for RNA-level regulation. Assuming that the DNA is present in the cell at copy number one or two and that its accessibility for transcription is constant for all genes, we can perform statistical inference on the rate ratio setting the DNA concentration to a constant (e.g., 1). Thus we construct a DNA copy number matrix as , where the latter is filled with 1, and use the mRNA data matrix as . This model is effective in characterizing the change points of RNA-level regulation in sparse time-course data sets such as the yeast data set we analyze. (See the Results section.)
Biological Interpretation of the Model
The protein-level model of PECA allows three different entry points for controlling the protein concentration at time (whose mean is ): (i) mRNA concentration (as the result of transcription and mRNA degradation), (ii) translation rate , and (iii) degradation rate . We note that biological reality is much more complex than this representation, involving several other processes that impact the efficiency of protein synthesis. If the concentration of a protein is regulated at the RNA level only, then the two protein-level parameters will be constant over time. By contrast, if the protein is regulated by altering the ratio of translation and protein degradation rates, we consider it as protein-level regulation (irrespective of additional RNA-level regulation). With these properties, PECA is able to identify regulatory patterns (i.e., rate ratio profiles) that go beyond what can be seen in the mRNA and protein concentration profiles alone. This enables us to deconvolute the contribution of regulation at each molecular level to the final protein concentration changes.
To illustrate the access of multiple regulatory processes, we show in Figure 1B the mRNA and protein expression profiles of the alcohol dehydrogenase class-3 encoded by ADH5 responding to hyperosmotic stress, as recorded by Lee et al.12 From the top left panel of Figure 1B, it is clear that mRNA concentration has increased dramatically between 30 and 60 min in all three replicates, indicating that the rate ratio of transcription versus RNA degradation increased (30 min is a change point). Nevertheless, the protein concentration has decreased in two of the three replicates (green and blue lines), suggesting down-regulation in the protein level, although it remained unchanged in the other replicate (red, top right panel of Figure 1B). Moreover, notice that protein concentration remained constant or even decreased after mRNA concentration had risen after 60 min. As a result, PECA estimated that the most significant change in protein-level rate ratio occurred around 60 min (decrease), making the time point a significant change point at the protein level. Hence the regulation of the ADH5 gene can be characterized by two change points, the first at the RNA level at 30 min and the other at the protein level at 60 min.
Simulation Study
We first conducted simulation studies to evaluate the sensitivity and specificity of the method. We simulated time-course data sets for 1500 mRNAs and proteins in parallel across six different time points (no replicates). Among these, we created three groups of proteins that are subject to different forms of gene expression control, emulating the protein concentration profiles of up- and down-regulated proteins in a yeast data set.12 The contribution of each of these regulatory patterns in the simulation is as close as possible to observed data, where each group represented a different combination of RNA- and protein-level regulation. In Group 1, protein concentration is regulated at the RNA-level only, that is, by up-regulation of transcription. In Group 2, protein concentration is regulated by increased rate of translation during the first time period in addition to the transcriptional up-regulation that takes places throughout the entire time. We observed such concurrent regulation frequently in the yeast data discussed below. Finally, in Group 3, protein concentration was regulated by the RNA-level down-regulation at early time points and the protein-level down-regulation at later time points. See the Materials and Methods for the detailed description of the data generating scheme. We simulated data for these groups 100 times and averaged the results.
PECA performed very well in all regulatory groups with low coefficient of variation ( or less), that is, low levels of noise, achieving 70% sensitivity at nearly zero FDR and nearly perfect sensitivity at 3–8% FDRs (Figure 2A). Interestingly, sudden jumps to perfect sensitivity in these plots was due to the failure to identify the down-regulation in Group 3 at the third time point (at high score thresholds), where the gene expression level increased at the third time point to compensate for the decrease in protein synthesis rate in this group at that time point. In more realistic scenarios with a higher coefficient of variation (; bottom right panel of Figure 2A), PECA still showed good sensitivity and specificity while controlling the FDR below 5%. The result also suggests that the optimal threshold can be set as low as (∼0.6) in the scenarios with a high signal-to-noise ratio, even if the associated FDR estimates may be greater than conventional FDR threshold such as 5%. However, quantitative proteomics data can be noisier in real experimental data than it is in our simulation setup, and hence a stringent selection criterion that controls FDR at reasonably low levels is desirable.
Figure 2.

(A) Simulation results. The sensitivity of PECA was plotted against the FDR under various scenarios of signal-to-noise ratio. The four panels show the pseudo-receiver-operating characteristic (ROC) curve in four different noise levels (), where the horizontal axis represents the false discovery rates, instead of the conventional values in the horizontal axis (1– specificity). In each panel, three different signals () were planted, representing from low to modest coefficient of variation. (See the Supporting Information.) (B) Number of selected (significant) change points at the RNA and protein level at respective probability thresholds. (See the justification of target FDRs in the main text.) The yellow rectangles show the selection region at the respective significance levels.
Analysis of Osmotic Stress Response in Yeast
Next, we analyzed a yeast data set that was generated for the cellular response to a hyperosmotic shock in budding yeast.12 The experiment was conducted in triplicate, and RNA and protein concentrations were monitored over 240 min (0, 30, 60, 90, 120, and 240 min after high molar NaCl treatment). Both mRNA and protein level data were available for 1508 genes without missing data across all time points and replicates.
Scoring Regulation Changes at the RNA and Protein Levels.
We first applied PECA to mRNA data alone to identify genes subject to RNA-level regulation. PECA identified 722 out of 1508 mRNAs (∼49%) as putatively regulated at the RNA level. The selection required that the change-point probability be >0.95 at any of the four possible time points (30, 60, 90, and 120 min), controlling the FDR at 0.7% (top panel of Figure 2B; Supplementary Figure 1 in the Supporting Information for the heatmap of the estimated rate ratios and the expression data; Supplementary Table 1 in the Supporting Information for the PECA output). See Supplementary Table 1 in the Supporting Information for the PECA output of this data set. Annotation of the stress-induced (up-regulated) genes revealed the enrichment of stress-related functions, while the repressed (down-regulated) genes showed significant enrichment of RNA processing and ribosome assembly (p value <0.001, Supplementary Table 2 in the Supporting Information). Enrichment of these functions is consistent with the expected cellular stress response.
Next, we applied PECA to the paired mRNA and protein data to extract candidate genes subject to protein-level regulation. We selected 249 out of the 1508 proteins with the posterior probability >0.8 at any of the time points as proteins putatively regulated at the protein level, controlling the FDR at 10% (Supplementary Table 3; Supplementary Figure 2 in the Supporting Information for the heatmaps). Here we chose a more lenient threshold for two reasons. First, the total number of selected proteins was so small at equivalent threshold that a conventional FDR (e.g., 5%) threshold would result in a total of <5 false-positives (in expectation). Second, the protein-level analysis is prone to two sources of measurement errors (RNA and protein), and thus expectedly, the posterior probabilities were on average much lower in this paired analysis than the RNA-only analysis above. To see gene function enrichment in the proteins regulated at the protein level, we selected two clusters of 68 and 131 proteins that were up- and down-regulated, respectively, at 30 min. All 1508 proteins in the protein/RNA data set served as the background list for the hypergeometric test. Similar to the transcriptome analysis above, up-regulated proteins showed enrichment of stress-related functions (p value < 0.001). By contrast, down-regulated proteins showed enrichment of the terms related to RNA processing and regulation of translation, indicating immediate shutdown of translation activities under high osmolarity (p value < 0.001, Supplementary Table 4 in the Supporting Information).
Similar to the majority of significant RNA-level changes, we found that the major change in the protein-level rate ratios also occurred immediately after the treatment (0–30 min). In addition, most proteins regulated at the protein level (161/199) were also significantly regulated at the RNA level, implying that the regulation of gene expression during osmotic stress response was highly coordinated at both levels, particularly at early time points. However, because only 249 genes (17%) were regulated at the protein level while 722 genes (49%) were at the RNA level at much more stringent FDR, one may hypothesize that transcriptional reprogramming is the dominant response to osmotic stress and ultimately protein concentrations change only by carefully selected paths through protein-level regulation (Figure 2B).
Characterizing the Link between the Regulatory Processes.
Next, we inspected the correlation between the regulatory patterns using the rate ratio profiles within the same molecules. Figure 3 shows the RNA and protein concentrations and the rate ratios for four key proteins known to be up-regulated during osmotic stress response:23 glycerol-phosphate dehydrogenase GPD1, cytosolic catalase T CTT1, and heat shock proteins HSP12 and HSP104. Time intervals where the rate ratios changed significantly are indicated by yellow rectangles, illustrating that the RNA level up-regulation was most active during the first 30 min and subsided afterward, with mRNA concentration recovering the stability within 60 min. By contrast, protein-level regulation was also the most active during the first time interval, but it counterbalanced the RNA-level regulation in the opposing direction (down) during the next time interval, resulting in stabilized protein level concentrations. This pattern suggests that protein-level regulation buffered the abrupt change at the RNA level and contributed to the stable protein concentration levels.
Figure 3.

mRNA and protein concentration data and estimated rate ratios at both levels of regulation for GPD1, CTT1, HSP12, and HSP104. These are four proteins with osmotic shock-induced expression. Blue, red, and green curves are time-course data for each biological replicate. Yellow background indicates the time intervals during which the rate ratios deviated from the average range across the time course. Red arrows indicate significant regulation change at the RNA and protein level in each gene.
The possible role of buffering by protein-level regulation was even more pronounced for down-regulated mRNAs, consistent with Lee et al.’s observation of less correlation between mRNA and protein concentrations for down-regulated RNAs.12 For example, PECA provides strong evidence of protein-level regulation that resulted in stable protein concentration for four members of the large subunit of ribosome (RPL9A, RPL9B, RPL16A, RPL19A) and several subunits of RNA polymerase I and III subunits (RPA43, RPA49, RPC19, RPC53, and RPC82; Supplementary Figures 3 and 4 in the Supporting Information). In these examples, mRNA concentration decreased significantly within the first 30 min and recovered to the pretreatment level after 60 min, whereas protein concentrations hardly changed. The rate ratio profiles reported by PECA showed that there was substantial protein-level up-regulation between 30 and 60 min to compensate the effect of reduced mRNAs during the same time interval.
In sum, RNA- and protein-level regulation were orchestrated together in the early response in this data, but protein-level regulation clearly acted as the buffer to the vast transcriptome changes. Supplementary Figure 5 in the Supporting Information shows the correlation patterns between RNA- and protein-level regulation across the time points. Because most regulation activities occurred in the first time interval in this data set, we focus on the first row of the Figure, that is, correlation between RNA- and protein-level regulation during the first time interval. Consistent with the evidence from Supplementary Figure 2 in the Supporting Information, the top left panel shows that RNA and protein expression were consistently up- or down-regulated in many genes during the first time interval with positive correlation (r = 0.51). The negative correlation in the next two panels clearly illustrates that the RNA-level regulation of the first time interval was countered by protein-level regulation of opposite direction of the second and third time intervals (r = −0.78, −0.37). In those intervals, the majority of the buffering effect was for the RNA-level down-regulation (countered by protein-level up-regulation), suggesting proteome-wide evidence of proteostasis through protein-level regulation. Interestingly, the positive correlations in the remaining two panels with large time lags (last two in the first row) suggest that the effect of RNA-level down-regulation takes a long time to come through at the protein concentration.
Analysis of Oxidative Stress Response in Fission Yeast
To illustrate the utility of PECA in another independent data set, we also analyzed the fission yeast data by Lackner et al. (2012), which features transcriptomics and proteomics data during response to oxidative stress induced by hydrogen peroxide.8 The experiment reports six time points collected over 3 h (0, 10, 30, 60, 120, 180). In contrast with the data set previously discussed, this study reported the ratio of mRNA and protein concentrations normalized to time point 0 (log 2 spectral counts referenced to the first time point, giving ratios). Considering that the first time point data is 0 on the log scale in both RNA and protein data, we can still apply PECA to analyze regulatory changes. This data set has complete time-course expression data for 1860 genes for RNAs and proteins (no biological replicate).
To select genes subject to significant regulation in both molecular levels, we used the probability score threshold 0.8, associated with 13% FDR in both data. This implies that for every 10 RNAs or proteins selected to be regulated by PECA, about one gene is a false-positive finding. On the basis of the criterion, we selected 58 up-regulated and 48 down-regulated genes at the RNA level and 85 up-regulated and 41 down-regulated genes at the protein level, respectively. Selections based on more lenient thresholds also led to similar proportions of significant regulation, suggesting that the oxidative stress response in fission yeast is not dominant at one molecular level over the other, in contrast with the predominantly transcriptomic response in the previous budding yeast example. Interestingly, we observed that most RNA-level up-regulation (increase in transcription over RNA degradation) occurred during the last time interval, whereas RNA-level down-regulation occurred during the first time interval. Meanwhile, protein-level regulation in both directions occurred during the first two time intervals, indicating their involvement in early response. Overall, the temporal pattern of RNA-level regulation in this data set was significantly different from the previous budding yeast data set.
We further investigated the correlation between RNA-level regulation and protein-level regulation across different time points. Supplementary Figure 6 in the Supporting Information shows the correlation plot between the two rate ratios across time points (log 2 scale). Unlike the budding yeast data above, the top left panel (correlation of processes during the first time interval, r = −0.09) suggests that the early response was not well-coordinated between the two levels. However, the negative correlation in the second panel in the first row (r = −0.26) indicates that the protein-level regulation acted as a buffer to the RNA-level regulation in many genes, possibly to maintain constant protein concentrations. Moreover, the early RNA-level regulation was well-correlated with the late protein-level regulation (panels in the top right corner), indicating time delays for RNA-level regulation to be processed through protein-level regulation (similar to the budding yeast data).
To see what functions are activated or deactivated at the two levels of regulation, we used the 43 Gene Ontology (GO) terms provided by the S. pombe database (http://www.pombase.org) to perform gene set enrichment analysis (hypergeometric test) for the four categories of genes. Because of the small number of selected genes, we limited our interpretation to those terms with at least five significant genes in each GO term. As expected, a limited number of terms were found to be significant after multiple testing correction.24 In the early phase of the response, DNA-dependent transcription (GO:0006351) and cytoskeleton organization (GO:0007010) genes were up-regulated at the protein level, while translation (GO:0002181) and mitochondrion organization (GO:0007005) genes were down-regulated at the RNA level. In the late phase of the response, ribosome biogenesis (GO:0042254) genes were up-regulated at the RNA level, and no terms were significantly enriched at the protein level. Therefore, similar to the previous data set, the functional landscape was mostly about the suspension of translation machinery in the early response and resumption of cellular growth with subsiding stress levels over time, as expected from the general environmental stress response.3
In summary, the data from the two yeast data sets suggest that the cellular response to environmental stress yields similar functional outcome and coordination between the two levels of regulation but with heterogeneous temporal patterns and in varying magnitudes. We also observed coordination between RNA-level regulation and protein-level regulation as well as cases of counterbalancing and buffering processes. This likely reflects that different environmental stress can induce stress response at a different pace through a unique sequence of RNA- and protein-level responses at the two molecular levels.
CONCLUSIONS
We presented a novel statistical method called PECA to quantitatively assess the patterns of RNA- and protein-level regulation based on paired mRNA and protein expression data and to dissect the contribution of RNA- and protein-level regulation for individual genes. PECA assumes a model of mass action kinetics in a time-course data set and carries out probabilistic inference on the kinetic parameters. The main strength of our method is that we formulated a systematic way to identify the change points where the regulation activity changes significantly with the control of the FDR. Furthermore, we offer a generalizable statistical framework that can be used to analyze both RNA data alone and combined RNA/protein data. PECA can be easily applied to other data sets from any organism as long as sufficient time-point measurements (i.e., a minimum of four) are available. In contrast with the statistical models that provide a single p value for each gene, PECA offers a significance measure for each time point and can thus pinpoint the timing of regulation change at different molecular levels.
Despite the sparsity and noisiness of the data, PECA provides a statistically rigorous analysis of paired time-course expression data with good sensitivity and specificity and, more importantly, with biologically meaningful summaries of regulation activities. In the simulation study, we showed that the method is able to detect protein regulation activities in scenarios with reasonably modest signal-to-noise ratios. We also applied PECA to an RNA/protein data set in which yeast cells were challenged with hyperosmolarity. The PECA analysis revealed two aspects of regulation that had not been directly apparent from inspection of the concentration data alone. During the immediate stress response, both RNA- and protein-level regulation acted concordantly, amplifying the resulting changes in protein expression. However, we also identified a number of cases in which protein-level regulation appeared to counterbalance the effects of RNA-level regulation, hence suggesting a type of buffering of protein expression changes to maintain proteostasis.
MATERIALS AND METHODS
Data Sets
We obtained the protein expression data from the Supplementary Table 5 in the Supporting Information of the paper by Lee et al.12 (isobaric tagging, LTQ Orbitrap Velos instrument). From this experiment, 1999 proteins were quantified consistently across the time points in at least two replicates, and among those we analyzed 1508 proteins with no missing data across all three replicates. We also obtained the gene expression data from Gene Expression Omnibus database (GSE23798, custom Nimblegen tiled microarray platform). Because the data did not exhibit any systematic shift in expression level distribution across different samples, we did not perform any further normalization. We took the subset of 1508 genes with matching protein IDs in the proteomics data. The complete sets of logtransformed data, estimated rate ratios, change-point probabilities for the RNA, and protein-level regulation are provided in the Supplementary Tables 3 and 4 in the Supporting Information, respectively.
To create heatmaps of clustered gene expression or rate ratio data in Supplementary Figures 1 and 2 in the Supporting Information, we applied agglomerative hierarchical clustering25 with the Euclidean distance metric to the rate ratio matrices and drew the heatmap for the normalized gene and protein expression data arranged in the same order, respectively. For functional annotation of selected proteins, we used the online annotation tool DAVID available at http://david.abcc.ncifcrf.gov/.26
Change-Point Model
To statistically test the change in rate ratios, we formulated a change-point model to describe the probability distribution of as follows. As indicated in the main text, we impose the restriction for all . This condition does not undermine the aim of this model because the change in the rate ratio indicates protein-level regulation as long as . For protein , let be the set of time points where this rate ratio shifts, that is, . If the elements of remained constant across time, would be an empty set; if some elements of were distinct from others, would be the set of all intermediate time points from 1 to with different adjacent rate ratios. Let denote the size of . Given a specific configuration of , we can reparameterize this model by , where , which further reduces to under the simplex constraint. For example, consider a data set with six time points . implies that there are two change points, requiring three rate ratio parameters such that , and .
Given the notations above, we write the likelihood of the entire model first:
where
We specified the priors as
for fixed for all , where , , and denote normal, uniform, and gamma distributions, respectively. We also assume that the change-point configuration has the following prior:
where we set assuming that nothing is known a priori about the probability of having a change point in any of the proteins. As for the hyperprior for , we elicit by obtaining the maximum likelihood estimates of gamma distribution based on the sample variances computed assuming constant mean across all time points in each replicate. Finally, a hyperprior distribution of change-point probability is specified as Beta distribution , which we set at (1,1). In summary, the prior can be written as
where the prior for is omitted conditional on the fact that they are all on the unit interval and denotes standard normal density. This completes the specification of the mass-action model.
Inference
To perform statistical inference on the model, we use sampling-based estimation via Markov chain Monte Carlo, which generates random samples drawn from the posterior distributions. (See the Supporting Information.) Our main goal is to compute the score of protein rate ratio change, that is, , where and denote the gene and protein expression data for protein , respectively. This score has the property that it is a marginal probability computed after accounting for the data and various change point configurations at all time points. Instead of seeking the maximum a posteriori estimate of , we perform our inference based on this probability. Denote the posterior samples of by for each . We first compute by . If holds for at least one , where is the probability threshold, we consider protein to be translationally regulated. To determine an optimal threshold, we compute the Bayesian FDR as
| (3) |
where .15,27 This decision rule results in the selection of specific time points where protein-level regulation shifted from the preceding time period.
Availability
The software package PECA and user manual are freely available for download at http://pecanalysis.sourceforge.net/.
Supplementary Material
ACKNOWLEDGMENTS
This work was supported in part by a Singapore Ministry of Education AcRF Tier 1 grant (H.C.) and the New York University Whitehead Fellowship (C.V.).
Footnotes
The authors declare no competing financial interest.
■ ASSOCIATED CONTENT
Supporting Information
Description of the simulation setting and the Markov chain Monte Carlo sampling steps. Heatmaps of the 722 stress induced and repressed proteins subject to RNA-level regulation. Heatmaps of the 249 stress induced and repressed proteins subject to protein-level regulation. The mRNA and protein expression and estimated rate ratios at both levels of regulation for RPL9A, RPL9B, RPL16A, RPL19A, which are members of the large subunit of ribosome. The mRNA and protein expression and estimated rate ratios at both levels of regulation for RPA43, RPA49, RPC19, RPC53, and RPC82, which are subunits of RNA polymerase I and III. S. cerevisiae data with osmotic stress. S. pombe data with oxidative stress. The RNA expression data, protein expression data, the estimated protein- and RNA-level rate ratios, and the change point probabilities for all 1508 proteins. The list of Saccharomyces Genome Databse (SGD) identifiers for 722 stress induced and repressed genes at the RNA-level and 249 stress induced and repressed genes at the protein-level. This material is available free of charge via the Internet at http://pubs.acs.org.
REFERENCES
- (1).Schena M; Shalon D; Davis R; Brown P.Quantitative monitoring of gene expression patterns with a complementary DNA microarray. Science 1995, 270, 467–470. [DOI] [PubMed] [Google Scholar]
- (2).Voelkerding K; Dames S; Durtschi J.Next-generation sequencing: from basic research to diagnostics. Clin. Chem 2009, 55 (4), 641–658. [DOI] [PubMed] [Google Scholar]
- (3).Gasch A; Spellman P; Kao C; Carmel-Harel O; Eisen M; Storz G; Botstein D; Brown P.Genomic expression programs in the response of yeast cells to environmental changes. Mol. Biol. Cell 2000, 11 (12), 4241–4257. [DOI] [PMC free article] [PubMed] [Google Scholar]
- (4).Murray J; Whitfield M; Trinklein N; Myers R; Brown P; Botstein D.Diverse and specific gene expression responses to stresses in cultured human cells. Mol. Biol. Cell 2004, 15 (5), 2361–2374. [DOI] [PMC free article] [PubMed] [Google Scholar]
- (5).Grune T.Oxidative stress, aging and the proteasomal system. Biogerontology 2000, 1 (1), 31–40. [DOI] [PubMed] [Google Scholar]
- (6).Davies K.Oxidative stress, antioxidant defenses, and damage removal, repair, and replacement systems. IUBMB Life 2000, 50 (4–5), 279–289. [DOI] [PubMed] [Google Scholar]
- (7).Davies K.Degradation of oxidized proteins by the 20S proteasome. Biochimie 2001, 83 (3–4), 301–310. [DOI] [PubMed] [Google Scholar]
- (8).Lackner D; Schmidt M; Wu S; Wolf D; Bahler J.Regulation of transcriptome, translation, and proteome in response to environmental stress in fission yeast. Genome Biol. 2012, 13 (4), R25. [DOI] [PMC free article] [PubMed] [Google Scholar]
- (9).Shenton D; Smirnova J; Selley J; Carroll K; Hubbard S; Pavitt G; Ashe M; Grant C.Regulation of transcriptome, translation, and proteome in response to environmental stress in fission yeast. J. Biol. Chem 2006, 281 (39), 29011–29021. [DOI] [PubMed] [Google Scholar]
- (10).Uesono Y; Toh E.Transient inhibition of translation initiation by osmotic stress. J. Biol. Chem 2002, 277 (16), 13848–55. [DOI] [PubMed] [Google Scholar]
- (11).Fournier M; Paulson A; Pavelka N; Mosley A; Gaudenz K; Bradford W; Glynn E; L. H; Sardiu M; Fleharty B; Seidel C; Florens L; Washburn M. Delayed correlation of mRNA and protein expression in rapamycin-treated cells and a role for Ggcl in cellular sensitivity to rapamycin. Mol. Cell. Proteomics 2010, 9, 271–284. [DOI] [PMC free article] [PubMed] [Google Scholar]
- (12).Lee M; Topper S; Hubler S; Hose J; Wenger C; Coon J; Gasch A.A dynamic model of proteome changes reveals new roles for transcript alteration in yeast. Mol. Syst. Biol 2011, 7, 514. [DOI] [PMC free article] [PubMed] [Google Scholar]
- (13).Vogel C; Silva G; Marcotte E.Protein expression regulation under oxidative stress. Mol. Cell. Proteomics 2011, 10 (12), M111.009217. [DOI] [PMC free article] [PubMed] [Google Scholar]
- (14).Powers E; Balch W.Diversity in the origins of proteostasis networks - a driver for protein function in evolution. Nat. Rev. Mol. Cell Biol 2013, 14, 237–248. [DOI] [PMC free article] [PubMed] [Google Scholar]
- (15).Muller P; Parmigiani G; Rice K.FDR and Bayesian Multiple Comparison Rules, Paper 115; Johns Hopkins University Department of Biostatistics Working Paper, 2006. [Google Scholar]
- (16).Storey JD; Xiao W; Leek JT; Tompkins RG; Davis RW Significance analysis of time course microarray experiments. Proc. Natl. Acad. Sci. U.S.A 2005, 102 (36), 12837–12842. [DOI] [PMC free article] [PubMed] [Google Scholar]
- (17).Park T; Yi SG; Lee S; Lee SY; Yoo DH; Ahn JI; Lee YS Statistical tests for identifying differentially expressed genes in timecourse microarray experiments. Bioinformatics 2003, 19 (6), 694–703. [DOI] [PubMed] [Google Scholar]
- (18).Conesa A; Nueda MJ; Ferrer A; Talon M.maSigPro: a method to identify significantly differential expression profiles in time-course microarray experiments. Bioinformatics 2006, 22 (9), 1096–1102. [DOI] [PubMed] [Google Scholar]
- (19).Tai YC; Speed TP Statistical tests for identifying differentially expressed genes in time-course microarray experiments. Ann. Stat 2006, 34 (5), 2387–2412. [DOI] [PubMed] [Google Scholar]
- (20).Baumgartner C; Lewis G; Netzer M; Pfeifer B; Gerszten R.A new data mining approach for profiling and categorizing kinetic patterns of metabolic biomarkers after myocardial injury. Bioinformatics 2010, 26 (14), 1745–1751. [DOI] [PMC free article] [PubMed] [Google Scholar]
- (21).Netzer M; Weinberger K; Handler M; Seger M; Fang X; Kugler K; Gerber A; Baumgartner C.Profiling the human response to physical exercise: a computational strategy for the identification and kinetic analysis of metabolic biomarkers. J. Clin. Bioinf 2011, 1, 34. [DOI] [PMC free article] [PubMed] [Google Scholar]
- (22).Casella G; Berger R.Statistical Inference; Thomson Learning: Stamford, CT, 2002. [Google Scholar]
- (23).Rep M; Reiser V; Gartner U; Thevelein J; Hohmann S; Ammerer G; Ruis H.Osmotic stress-induced gene expression in Saccharomyces cerevisiae requires Msn1p and the novel nuclear factor Hot1p. Mol. Cell. Biol 1999, 19, 54745485. [DOI] [PMC free article] [PubMed] [Google Scholar]
- (24).Benjamini Y; Hochberg Y.Controlling the false discovery rate: a practical and powerful approach to multiple testing. J. Royal Stat. Society, Ser. B 1995, 57, 289–300. [Google Scholar]
- (25).Eisen M; Spellman P; Brown P; Botstein D.Cluster analysis and display of genome-wide expression patterns. Proc. Natl. Acad. Sci. U.S.A 1998, 95, 14863–14868. [DOI] [PMC free article] [PubMed] [Google Scholar]
- (26).Huang D; Sherman B; Lempicki R.Systematic and integrative analysis of large gene lists using DAVID bioinformatics resources. Nat. Protoc 2009, 4, 44–57. [DOI] [PubMed] [Google Scholar]
- (27).Genovese C; Wasserman L.In Statistics Bayesian 7; Bernardo J, Berger J, Bayarri M, Dawid A, Eds.; Oxford University Press: Oxford, 2003; Chapter 7, pp 145–161. [Google Scholar]
Associated Data
This section collects any data citations, data availability statements, or supplementary materials included in this article.