

Abstract
Neurological diseases are on the rise worldwide, leading to increased healthcare costs and diminished quality of life in patients. In recent years, Big Data has started to transform the fields of Neuroscience and Neurology. Scientists and clinicians are collaborating in global alliances, combining diverse datasets on a massive scale, and solving complex computational problems that demand the utilization of increasingly powerful computational resources. This Big Data revolution is opening new avenues for developing innovative treatments for neurological diseases. Our paper surveys Big Data’s impact on neurological patient care, as exemplified through work done in a comprehensive selection of areas, including Connectomics, Alzheimer’s Disease, Stroke, Depression, Parkinson’s Disease, Pain, and Addiction (e.g., Opioid Use Disorder). We present an overview of research and the methodologies utilizing Big Data in each area, as well as their current limitations and technical challenges. Despite the potential benefits, the full potential of Big Data in these fields currently remains unrealized. We close with recommendations for future research aimed at optimizing the use of Big Data in Neuroscience and Neurology for improved patient outcomes.
Supplementary Information
The online version contains supplementary material available at 10.1186/s40537-023-00751-2.
Keywords: Big data, Neuroscience, Neurology, Brain Stimulation, Artificial Intelligence, Pain, Depression, Addiction, Stroke, Alzheimer’s
Introduction
The field of Neuroscience was formalized in 1965 when the “Neuroscience Research Program” was established at the Massachusetts Institute of Technology with the objective of bringing together several varied disciplines including molecular biology, biophysics, and psychology to study the complexity of brain and behavior [1]. The methods employed by the group were largely data driven, with a foundation based on the integration of multiple unique data sets across numerous disciplines. As Neuroscience has advanced as a field, appreciation of the nervous system’s complexity has grown with the acquisition and analysis of larger and more complex datasets. Today, many Neuroscience subfields are implementing Big Data approaches, such as Computational Neuroscience [2], Neuroelectrophysiology [3–6], and Connectomics [7] to elucidate the structure and function of the brain. Modern Neuroscience technology allows for the acquisition of massive, heterogeneous data sets whose analysis requires a new set of computational tools and resources for managing computationally intensive problems [7–9]. Studies have advanced from small labs using a single outcome measure to large teams using multifaceted data (e.g., combined imaging, behavioral, and genetics data) collected across multiple international sites via numerous technologies and analyzed with high-performance computational methods and Artificial Intelligence (AI) algorithms. These Big Data approaches are being used to characterize the intricate structural and functional morphology of healthy nervous systems, and to describe and treat neurological disorders.
Jean-Martin Charcot (1825–1893), considered the father of Neurology, was a pioneering figure in utilizing a scientific, data-driven approach to innovate neurological treatments [10]. For example, in the study of multiple sclerosis (MS), once considered a general "nervous disorder" [10], Charcot's approach integrated multiple facets of anatomical and clinical data to delineate MS as a distinct disease. By connecting pathoanatomical data with behavioral and functional data, Charcot's work ultimately transformed our understanding and treatment of MS. Furthermore, Charcot’s use of medical photographs in his practice was an early instance of incorporating ‘imaging’ data in Neurology and Psychiatry [11]. Today, Neuroimaging, spurred on by new technologies, computational methods, and data types, is at the forefront of Big Data in Neurology [9, 12]—see Fig. 1. Current neurology initiatives commonly use large, highly heterogeneous datasets (e.g., neuroimaging, genetic testing, or clinical assessments from 1000s to 100,000s patients [13–18]) and acquire data with increasing velocity (e.g., using wearable sensors [6]) and technologies adapted from other Big Data fields (e.g., automatized clinical note assessment [19], social media-based infoveillance applications [16, 20]). Similar to how Big Data has spurred on Neuroscience, the exponentially growing size, variety, and collection speed of datasets combined with the need to investigate their correlations is revolutionizing Neurology and patient care (see Fig. 1).
Fig. 1.

Evolution of data types [21]. The evolution of Data types in the development of Computational Neuroscience can be traced from Golgi and Ramón y Cajal’s structural data descriptions of the neuron in the nineteenth century [22]; to Hodgkin, Huxley, and Ecceles’s biophysical data characterization of the “all-or-none” action potential during the early to mid-twentieth century [23]; to McCulloch and Pitts’ work on the use of ‘the "all-or-none" character of nervous activity’ to model neural networks descriptive of fundamentals of nervous system [24]. Similarly, Connectomics’ Data evolution [25] can be traced from Galen’s early dissection studies [26], to Wernicke’s and Broca’s postulations on structure and function [27], to imaging of the nervous system [28, 29], and brain atlases (e.g., Brodmann, Talairach) and databases [30, 31] into the Big Data field that is today as characterized by the Human Connectome Project [32] and massive whole brain connectome models [7, 33]. Behavioral Neuroscience and Neurology can be tracked from early brain injury studies [34] to stimulation and surgical studies [35, 36], to Big Data assessments in cognition and behavior [37]. All these fields are prime examples of the transformative impact of the Big Data revolution on Neuroscience and Neurology sub-fields
This paper examines the evolving impact of Big Data in Neuroscience and Neurology, with a focus on treating neurological disorders. We critically evaluate available solutions and limitations, propose methods to overcome these limitations, and highlight potential innovations that will shape the fields' future.
Problem definition
According to the United States (US) National Institutes of Health (NIH), neurological disorders affect ~ 50 M/yr. people in the US, with a total annual cost of hundreds of billions of dollars [38]. Globally, neurological disorders are responsible for the highest incidence of disability and rank as the second leading cause of death [39]. These numbers are expected to grow over time as the global population ages. The need for new and innovative treatments is of critical and growing importance given the tremendous personal and societal impact of diseases of the nervous system and brain.
Big Data holds great potential for advancing the understanding of neurological diseases and the development of new treatments. To comprehend how such advancements can occur and have been occurring, it is important to appreciate how this type of research is enabled, not only through methods classically used in clinical research in Neurology such as clinical trials but also via advancing Neuroscience research.
This paper aims to review how Big Data is currently used and transforming the fields of Neuroscience and Neurology to advance the treatment of neurological disorders. Our intent is not merely to survey the most prominent research in each area, but to give the reader a historical perspective on how key areas moved from an earlier Small Data phase to the current Big Data phase. For applications in Neurology, while numerous clinical areas are evolving with Big Data and exemplified herein (e.g., Depression, Stroke, Alzheimer’s Disease (AD)), we highlight its impact on Parkinson’s Disease (PD), Substance Use Disorders (SUD), and Pain to provide a varied, yet manageable, review of the impact of Big Data on patient care. To balance brevity and completeness, we summarize a fair amount of general information in tabular form and limit our narrative to exemplify the Big Data trajectories of Neurology and Neuroscience. Additionally, in surveying this literature, we have identified a common limitation; specifically, the conventional application of Big Data, as characterized by the 5 V’s (see Fig. 2), is often unevenly or insufficiently applied in Neurology and Neuroscience. The lack of standardization for the Big Data in studies across Neurology and Neuroscience as well as field-specific and study-specific differences in application limit the reach of Big Data for improving patient treatments. We will examine the reasons that contribute to any mismatch and areas where past studies have not reached their potential. Finally, we identify the limitations of current Big Data approaches and discuss possible solutions and opportunities for future research.
Fig. 2.
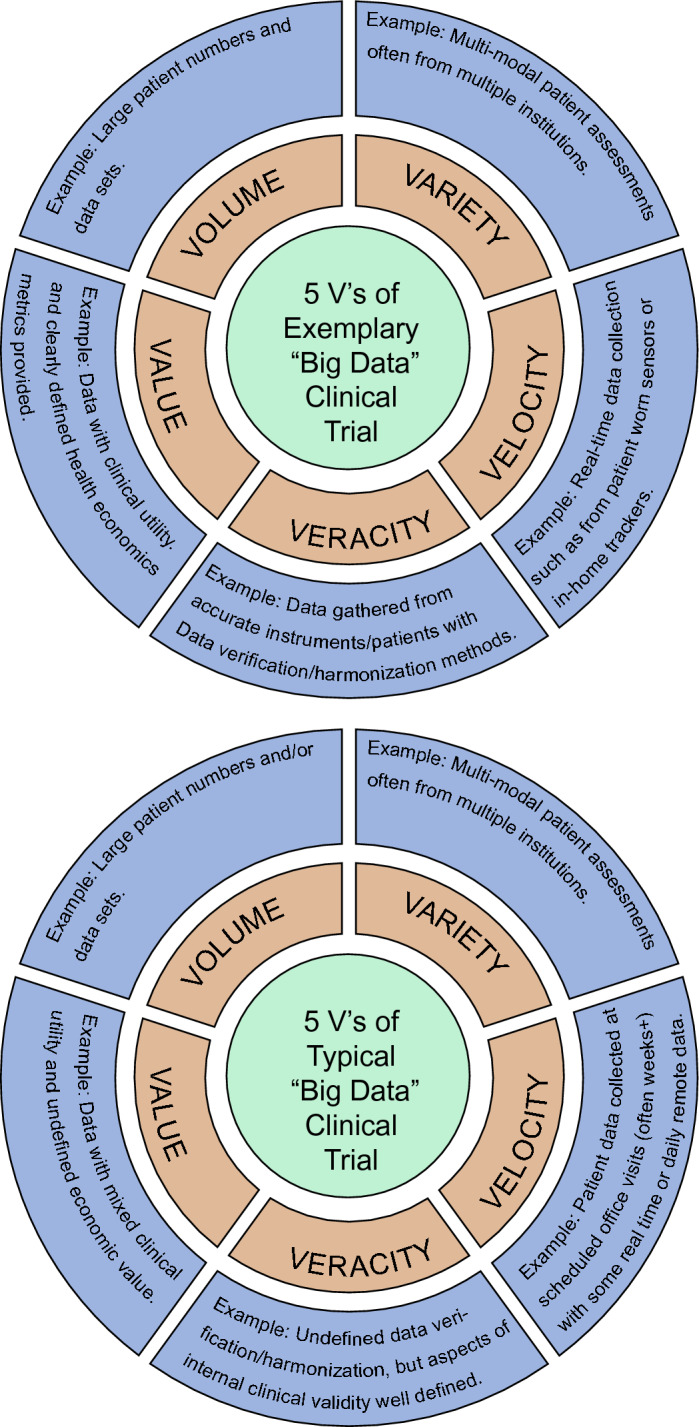
The 5 V’s. While the 5 V’s of Big Data (“Volume, Variety, Velocity, Veracity, and Value”) are clearly found in certain fields (e.g., social media) there are many "Big Data" Neuroscience and Neurology projects where categories are not explored or are underexplored. Many self-described “Big Data” studies are limited to Volume and/or Variety. Furthermore, most “Big Data” clinical trial speeds move at the variable pace of patient recruitment which can pale in comparison to the speeds of Big Data Velocity in the finance and social media spaces. “Big Data” acquisition and processing times are also sporadically detailed in the fields. Finally, there is not an accepted definition of data Veracity as it pertains to healthcare (e.g., error, bias, incompleteness, inconsistency) and Veracity can be assessed on multiple levels (e.g., from data harmonization techniques to limitations in experimental methods used in studies)
Our paper differs from other Big Data review papers in Neuroscience and/or Neurology (e.g., [12], [40–43]) as it specifically examines the crucial role of Big Data in transforming the clinical treatment of neurological disorders. We go beyond previous papers that have focused on specific subfields (such as network data (e.g., [44]), neuroimaging (e.g., [12]), stroke (e.g., [45]), or technical methodologies related to data processing (e.g., [46, 47]) and/or sharing (e.g., [48, 49]). Furthermore, our review spans a broad range of treatments, from traditional pharmacotherapy to neuromodulation and personalized therapy guided by Big Data methods. This approach allows for a comparison of the evolving impact of Big Data across Neurology sub-specialties, such as Pain versus PD. Additionally, we take a cross-disciplinary approach to analyze applications in both Neuroscience and Neurology, synthesizing and categorizing available resources to facilitate insights between neuroscientists and neurologists. Finally, our study appraises the present implementation of the Big Data definition within the fields of Neuroscience and Neurology. Overall, we differentiate ourselves in terms of scope, breadth, and interdisciplinary analysis.
Existing solutions
Big Data use in Neuroscience and Neurology has matured as a result of national and multi-national projects [40–43]. In the early to mid-2000’s, several governments started national initiatives aimed at understanding brain function, such as the NIH Brain Initiative in the US [50], the Brain Project in Europe [51, 52], and the Brain Mapping by Integrated Neurotechnologies for Disease Studies (Brain/MINDS) project in Japan [53]. Although not always without controversy [40, 51, 52], many initiatives soon became global and involved increasingly larger groups of scientists and institutions focused on collecting and analyzing voluminous data including neuroimaging, genetic, biospecimen, and/or clinical assessments to unlock the secrets of the nervous system (the reader is referred to Table 1 and Additional file 1: Table S1 for exemplary projects or reviews [40–43]). These projects spurred the creation of open-access databases and resource depositories (the reader is referred to Table 2 and Additional file 1: Table S2 for exemplary databases or reviews [41, 42]). The specific features of the collected data sets, such as large volume, high heterogeneity/variety, and inconsistencies across sites/missing data, necessitated the development of ad-hoc resources, procedures, and standards for data collection and processing. Moreover, these datasets created the need for hardware and software for data-intensive computing, such as supercomputers and machine learning techniques, which were not conventionally used in Neuroscience and Neurology [54–58]. Most significantly, the Big Data revolution is improving our understanding and treatment of neurological diseases, see Tables 3–6 and Additional file 1: Tables S3-S6.
Table 1.
Sample of National Projects that Spurred on the Big Data Revolution (see additional information in Additional file 1: Table S1)
| Name of project | Where | Year | Population | Data type | Link | Sample References |
|---|---|---|---|---|---|---|
| ADNI | US | 2004 | Human | Neuroimaging, genetic, clinical, and biospecimen data | https://adni.loni.usc.edu | [228] |
| EPFL Blue Brain Project | CH | 2005 | Animal (mouse) | Models, tools, algorithms, brain cell atlas | https://www.epfl.ch/research/domains/bluebrain/ | [229] |
| Human Brain Connectome Project | US | 2009 | Human | Neuroimaging, phenomic, and genomic data | https://www.humanconnectome.orghttp://www.humanconnectomeproject.org | [230, 231, 232] |
| ENIGMA | US | 2009 | Human | Neuroimaging, genetic, and clinical | https://enigma.ini.usc.edu | [37] |
| Brain Canada Foundation | CA | 2011 | Human | Neuroimaging and disease models | https://braincanada.ca | [233] |
| The BRAIN Initiative | US | 2013 | Human, animal | Neuroimaging, genetic, clinical, neurophysiological, simulations | https://braininitiative.nih.gov/ | [234] |
| Human Brain Project | EU, IL, NO, UK, CH | 2013 | Human | Neuroimaging, genetic, clinical, neurophysiological, simulations | https://www.humanbrainproject.eu/en/ | [51, 52] |
| Japan Brain/MINDS | JP | 2014 | Human, animal (marmoset) | Neuroimaging, neurophysiological, genetic, and clinical data | https://brainminds.jp/en/ | [53] |
| China Brain Project | CN | 2016 | Human, animal | Not available | Not available | [235] |
| Korea Brain Initiative | KR | 2016 | Human, animal | Cell imaging, molecular, mini-brain cultures, AI technology, mapping | https://www.kbri.re.kr/new/pages_eng/main/ | [236] |
| Australian Brain Alliance | AU | 2016 | Human | Not available | https://www.ans.org.au/resources/issues/about-the-australian-brain-alliance | [237] |
| CBRS | CA | 2017 | Human | Not available | https://canadianbrain.ca/ | [238] |
| IBI International Brain Initiative | JP, AU, EU, US, CA, KR, CN | 2017 | Human, animal | Diverse data sets represented across international collaborators | https://www.internationalbraininitiative.org/ | [239] |
| The BRAIN Initiative 2.0 | US | 2018 | Human, animal | Neuroimaging, genetic, clinical, neurophysiological, simulations | https://braininitiative.nih.gov/strategic-planning/acd-working-groups/brain-initiative®-20-cells-circuits-toward-cures | [240] |
| EBRAINS | EU | 2020 | Human, animal | Study data, computational models, and software | https://ebrains.eu/ | [241] |
CH Switzerland , IL Israel, NO Norway, UK United Kingdom, KR South Korea, CA Canada, AU Australia, CN China, JP Japan
Table 2.
Sample of Neurology and Neuroscience Databases (see additional information in Additional file 1: Table S2 for the above databases)
| Database | Vol | Var | Vel | Ver | O/C | Val |
|---|---|---|---|---|---|---|
| Allen brain map: https://portal.brain-map.org/ | Varied (57 projects mouse, non-human primate & human) | Diverse dataset including imaging (eg., MRI), atlases, histology, gene, etc. | O | + | C | P&C |
| ADNI: https://adni.loni.usc.edu/ | > 1000 AD subjects | MRI, PET, biosamples, neuropsychological data, genetic data | O | + | C | C |
| LONI image & data archive: https://ida.loni.usc.edu/login.jsp | 143 studies, 84864 HP subjects | MRI, EEG, PET, CT, SPECT, demographics, biospecimen, and clinical data | O* | + | O | P&C |
| Big brain project: https://bigbrain.loris.ca; https://bigbrainproject.org/ | 1 subject (H), full dataset over 1 TB, 7404 histological slices | Brain atlas, histology images, 3D reconstruction | F | + | C | C |
| Biomarkers for spinal muscular atrophy: https://smafoundation.org/discovery/biomarkers/ | > 100 SMA subjects at 18 sites | Primarily descriptive data but resource for potential SMA testing tools | F | + | C | P&C |
| Bipolar disorder neuroimaging database: https://sites.google.com/site/bipolardatabase/ | 141 studies comparing bipolar and H | Data from studies using MRI and CT scans | F | + | C | C |
| Brain architecture management system: https://bams1.org | 65000 reports of rat brain connections | Brain parts, cell types, molecules | F | + | C | P |
| Brain architecture management system 2: https://bams2.bams1.org | 45000 reports of connections H and animals | Brain parts, cell types, molecules | F | + | C | P |
| Brain machine interface platform (BMI PF): https://bmi.neuroinf.jp/ | > 3500 BMI-related papers, 185 BMI-related sites links | Brain atlases, reconstructed images, fMRI | F | + | C | P&C |
| Brain transcriptome database: https://www.cdtdb.neuroinf.jp/CDT/Top.jsp | Data from over 30 different gene categories | Genetic (molecular functions, cellular components, biological processes) | F | + | C | C |
| Brain/MINDS data portal: https://dataportal.brainminds.jp/ | 154 subjects (H), > 300 marmoset | Marmoset: MRI, brain & gene atlas, tracer injection, calcium imaging, ECoG and connectivity mapping. Human brain MRI | FUA | + | C | P&C |
| Marmoset gene atlas: https://gene-atlas.brainminds.jp/ | > 1200 genes of > 150 brain regions, 21 diseases | Atlases and gene mapping of marmoset brain | O | + | C | P |
| BrainChart: https://brainchart.shinyapps.io/brainchart/ | 123984 MRIs, > 100 studies, 101457 subjects | MRI scans reduced to Summary Graphs in Database | F | + | C | C |
|
Brain-CODE: |
1547 CP, 797 concussion, 1074 depression, 1265 epilepsy, 15959 ND, 4386 NeD & 1516 animal records | MRI, EEG, MEG, DTI, ocular data, clinical data, genomic, proteomic, demographic data | FUA | + | O | P&C |
| Brain-development.org: https://brain-development.org/ | > 2000 subjects (H) | MRI, MRA, DTI, demographic data, brain atlases | F | + | C | C |
| BrainGraph.org: https://braingraph.org/cms/ | 1053 H brains | Braingraphs, connectomes | F | + | C | C |
| BrainInfo: http://braininfo.rprc.washington.edu/ | 4 cortical views, 58 coronal sections of 3 longtailed macaque | Macaque brain atlas | F | + | C | P&C |
| BrainMap: https://brainmap.org/ | Functional: 105589, Voxel-based morphometry: 115627 H | Descriptive BrainMap taxonomy and software tools | O | + | C | C |
|
BrainMaps.org: |
> 140 TB, "140 million megapixels of sub-micron resolution, annotated, scanned images of serial sections" of brains | Atlases human & animals, brain connectivity graphs & 3D. Histochemical, immunocytochemical & tracer connectivity. EM, MRI, DTI. Gene database | F | O | P&C | |
| Brainomics/Localizer: https://osf.io/vhtf6/ | 94 subjects (H) | fMRI, MRI, genetic, cognitive, and behavioral data | F | + | C | C |
| BRAINSPAN: https://brainspan.org/ | 300 distinct human brain structures | Genetic, atlas, MRI, DTI | O | + | C | P&C |
|
Caltech subcortical atlas: |
168 subjects (H) | "Probabilistic atlases of the human amygdala and of the subcortical nuclei associated with reinforcement learning." | FUA | + | O | C |
| Cambridge centre for ageing & neuroscience: https://www.cam-can.org/ | Nearly 3000 subjects | MRI, fMRI, MEG, cognitive, behavioral, demographic, and physiological data | O | + | O | C |
|
Canadian open neuroscience platform: https://braincanada.ca/funded_grants/canadian-open-neuroscience-platform/ |
More than 60 datasets and 75 tools | Imaging, genetic, behavioral neuroscience data, and more | O | + | O | P&C |
| Cell image library: http://www.cellimagelibrary.org/home | > 12000 unique datasets and 30 TB of data | Images, videos, animations | F | + | O | P |
| CellML: https://www.cellml.org/ | > 900 model exposures | Computer-based mathematical models | F | C | P | |
| Center for integrative connectomics: https://cic.ini.usc.edu/ | > 500 connectomes | Multimodal multiscale connectome & cell-type map, imaging, computational | F | + | C | P |
| Center-TBI: https://www.center-tbi.eu/ | > 4500 TBI subjects | Clinical, imaging, ICU data, and biomarker data | F | + | C | C |
| CoCoMac: http://cocomac.g-node.org/main/index.php | > 8000 brain site | Neuroinformatics database | F | C | P | |
| Mammalian brain collections: https://brainmuseum.org/index.html | > 100 species of mammals including humans | Images and information from sectioned and stained brains | F | + | C | P&C |
| CNS-PF: https://cns.neuroinf.jp/index.php?ml_lang=en | 47 species | Images, 3D brain gallery, brain and neurons of invertebrates | F | + | C | P |
| Connectome coordination facility: https://www.humanconnectome.org | > 10000 subjects in 20 human connectome studies | Human connectomes | FUA | + | C | P&C |
| Baby connectome project: https://humanconnectome.org/study/lifespan-baby-connectome-project\ | 500 subjects (H) | MRI, clinical data, behavioral data | FUA | + | C | P&C |
| HCP YoungAdult: https://www.humanconnectome.org/study/hcp-young-adult | 1200 subjects (H) | dMRI, rfMRI, tfMRI, MEG/EEG, behavioral, genetic data | F | + | C | P&C |
| HCP aging: https://www.humanconnectome.org/study/hcp-lifespan-aging | 725 subjects (H) | sMRI, rfMRI, tfMRI, dMRI, ASL, demographic, and behavioral data | FUA | + | C | C |
| HCP development: https://www.humanconnectome.org/study/hcp-lifespan-development | > 1200 subjects (H) | MRI, rfMRI, tfMRI, sMRI, fMRI, behavioral data, demographic | FUA | + | C | C |
| Collaborative research in computational neuroscience: https://crcns.org/ | > 100 datasets from rodent, feline, and primate studies | MRI, neurophysiology data | F | + | C | P&C |
|
Distributed archives for neurophysiology data integration: |
440 TB total data size, 233 dandisets | "Electrophysiology, optophysiology, behavioral time-series, images from immunostaining" | O | + | O | P&C |
| Data archive BRAIN initiative (DABI): https://dabi.loni.usc.edu/home | > 430 TB | Invasive neurophysiology, EEG, single unit activity, EMG, MRI, DTI, PET, CT, clinical, demographics, behavioral, eye-tracking, movement related, etc | O | + | O | P&C |
| DevelopmentalBrainDisorderGeneDatabase: https://dbd.geisingeradmi.org/ | 7204 cases, 704 genes | Genotypic and phenotypic data | O | + | C | C |
| Drug design data resource: https://drugdesigndata.org/ | Datasets in MS Excel and HTML | Experimental datasets for diverse protein–ligand interactions | F | + | C | P |
| EBRAINS: https://ebrains.eu/ | 128 Projects, 943 datasets, 221 models | Knowledge graphs, atlases, simulations, brain modelling, neuromorphic computer, neurorobotics, medical data analytics | O | + | O | P&C |
| EEGbase: http://eeg2.kiv.zcu.cz:8080/home-page?0 | > 350 EEGs across 39 different scenarios (H) | EEG/ERP | F | O | C | |
| ENCODE: https://www.encodeproject.org/ | H: 1063878 cCREs, 1518 cells. Mo: 313838 cCREs, 169 cells | Functional genomics, characterization, terminology, elements from genome | O | + | O | P&C |
| ENIGMA: https://enigma.ini.usc.edu/ | > 12,800 | MRI, DTI, fMRI, genetic data | O | + | O | C |
| Ensembl: https://useast.ensembl.org/index.html | > 500000 genomes | Comparative genomics from multiple species (eg. Human, mouse, etc.) | O | + | C | P |
| Fruit fly brain observatory: https://www.fruitflybrain.org/#/brainmapsviz | 7 Fruit Fly Connectomes | 7 different adult and larva datasets | O | + | C | P |
| Gene expression nervous system atlas: http://www.gensat.org/ | Undefined | Gene expression atlas and select brain slice images | O | + | C | P |
| Gene expression omnibus: https://www.ncbi.nlm.nih.gov/geo/ | 101940 datasets | "Gene-specific information from microarray and sequencing studies" | F | + | O | P |
|
GeneNetwork: |
Unknown [25 years of legacy genetic data sets] | "Data sets and tools used to study complex networks of genes, molecules, and higher order gene function and phenotypes" | O | + | O | P&C |
| Genetics Alzheimer’s disease data storage site: https://www.niagads.org/ | 263.5 million annotated genetic variants | Genotype & phenotype inform from 56 summary statistics from AD/ADRD GWAS | O | + | O | C |
| G-NODE open data: https://gin.g-node.org/ | > 270 study data sets | Electrophysiology, behavioral, biospecimens, stimulation, imaging, modeling | O | O | P&C | |
| Hippocampome portal: https://hippocampome.org/php/index.php | 527802 datapoints, 46004 pieces of evidence | Cell morphology, electrophysiology, region makeup, connectivity | O | + | C | P |
| Human connectome project: http://www.developingconnectome.org/ | 783 neonatal subjects (886 datasets) | MRI, rs-fMRI, demographics, clinical, neurodevelopmental, genetics | FUA | + | C | P&C |
| Global Alzheimer’s AssociationInteractiveNetwork: https://www.gaain.org/ | 480629 subjects (HP) | MRI, fMRI, DTI, clinical data, biospecimen, genetic data | O | + | C | C |
| Human brain transcriptome: https://hbatlas.org/ | 1340 tissue samples, genotyping data for 2.5 million markers | Transcriptome data and associated metadata | FUA | + | C | C |
| INCF knowledgespace: https://knowledge-space.org/ | Unknown | Anatomy, expression, models, morphology, physiology, links to data sets | F | + | O | P&C |
| International epilepsy electrophysiology database: https://www.ieeg.org/ | > 3000 datasets | Electrophysiology data, MRI, PET, clinical data | O | + | O | P&C |
| Invertebrate brain platform: https://invbrain.neuroinf.jp/modules/htmldocs/IVBPF/Top/index.html | Unknown | Images of invertebrate brain and nervous system | F | + | C | P |
| IonChannelGenealogy: https://ionchannelmodels.org/ | 4815 models with 3706 quantitative ion channel data | Ion channel electrophysiology from diverse species, locations & neurons | O | + | O | P |
|
Japan monkey centre primate brain imaging repository |
16 datasets | High-resolution MRI of non-human primates | F | + | C | P |
| JuBrain atlas: https://julich-brain-atlas.de/ | Maps of > 200 regions | Brain atlases. Integrating big brain dataset, and EBRAINS data | O | + | C | C |
| Kymata atlas: https://kymata.org/ | > 50 functions mathematical describing brain functions | Functional atlas of brain (eg. binary detection of skin vibration) | O | + | C | C |
|
Major depressive disorder neuroimaging database |
225 studies in (HP) subjects | Descriptive and numerical information of the studies which have investigated brain structure using MRI and CT scans | F | + | C | C |
| MSU brain biodiversity bank: https://brains.anatomy.msu.edu/ | 27 brain atlases from humans, sheep, dolphin, and axolotls | Brain images and atlases | O | C | P | |
|
National institute of mental health data archive (NDA) |
2396 collections of data from NIH studies | Virtual container for data and other information related to a project/grant. Clinical, phenotypical, neurosignal recordings, omics | O | + | O | P&C |
| National database for autism research: https://nda.nih.gov/ | As of 2013, 90000 participants | Data from genetic validation, imaging, and genomics tools | O | + | O | P&C |
| National database for clinical trials related to mental illness: https://nda.nih.gov/ | Unknown | Molecular, genetic, behavioral, social, and environmental interaction data | O | + | O | P&C |
|
NeuroData |
> 100 datasets | Neuroimaging datasets, electron microscopy, cleared lightsheet microscopy, array tomography, sMRI, fMRI. Brain atlas of the zebrafish. Connectomes | F | + | C | P&C |
|
Neuroelectro.org |
> 2300 electrophysiology assessments from ~ 100 distinct neurons and > 300 publications | Electrophysiological properties and data of diverse neuron types | F | C | P | |
| Neuroimaging tools and resources collaboratory: https://www.nitrc.org/ | > 17 Imaging Studies (1000’s patients) & compatible software | MRI, CT, PET, neuroinformatics software and data from 17 + studies | O | + | C | P&C |
| 1000 functional connectomes https://www.nitrc.org/projects/fcon_1000/ | 1288 subjects, 1200 R-fMRI from 33 sites | fMRI, demographics | F | + | C | C |
| International neuroimaging data-sharing initiative (INDI) | 5 + studies, > 7000 subjects (HP) | rs-fMRI, MRI, DTI, software, demographics, behavioral data | O | + | O | C |
| Southwest university adult lifespan dataset (SALD) | 494 subjects (H) | sMRI, rs-fMRI, behavioral data, basic phenotypic data | F | + | C | C |
| Autism brain imaging data exchange (ABIDE) | 1060 ASD and 1166 (H) | rs-fMRI, MRI, anatomical and phenotypic data | F | + | C | C |
| Consortium for reliability and reproducibility (CoRR) | “1629 subjects (H), 3357 anatomical scans, 5093 resting functional scans, 1302 diffusion scans, 300 CBF & ASL scans” | rs-fMRI and diffusion imaging data | FUA | + | C | C |
| Addiction connectome preprocessed initiative (ACPI) | 158 subjects, 128 anatomical scans, 185 resting functional scans | rs-fMRI | FUA | + | C | C |
|
Preprocessed connectomes: |
11 repositories | MRI | F | + | C | C |
| NeuroML database: https://neuroml-db.org/ | Annotated computational models | Neuronal morphology, ion channel dynamics, synaptic mechanisms, etc | O | + | C | P |
| Neuromorpho.org: https://neuromorpho.org/ | 241034 cells | Atlases and 3D data | O | + | C | P&C |
| Neuroscience gateway portal: https://www.nsgportal.org/overview.html | Provides NSF-funded HPC resources for modelling | Can model EEG, MRI, fMRI data, and more | O | C | C | |
| Neuroscience information framework: https://neuinfo.org/ | Can deep search across over 150 separate platforms | Brain atlases, genomics, clinical, experimental, knowledge databases | O | + | C | P&C |
| NeuroVault: https://neurovault.org/ | > 6500 studies | "Statistical maps, parcellations & atlases produced by MRI & PET studies." | O | + | O | C |
| NIDA data share website: https://datashare.nida.nih.gov/ | Around 78 studies | Substance Abuse Disorder clinical trial data | O | + | O | P&C |
|
NIDDK central repository |
136 studies with data, 91 studies with biospecimens | NIDDK-sponsored study data including clinical data, biospecimens and associated databases. MRI, CT | O | + | O | P&C |
| NIH NeuroBioBank (NBB): https://neurobiobank.nih.gov/ | 6 biorepositories of diseased subjects | Human post-mortem brain tissue and related biospecimens | O | + | C | P&C |
| NIH roadmap epigenomics mapping consortium https://egg2.wustl.edu/roadmap/web_portal/ | Data from 127 different tissues and both adult and embryonic cell types | "High-quality, genome-wide maps of several key histone modifications, chromatin accessibility, DNA methylation and mRNA expression" | F | C | P&C | |
| NURSA: https://www.nursa.org/nursa/index.jsf | 527 transcriptomic & 21 non-transcriptomic datasets | Transcriptomic, non-transcriptomic, molecular, cell line data, and more | F | + | C | P |
| Open access series of imaging studies: https://www.oasis-brains.org/ | > 3000 H and AD subjects | MRI, PET, clinical data, cognitive data, biomarker data | F | + | C | C |
| Open MEG archive (OMEGA) https://www.mcgill.ca/bic/neuroinformatics/omega | 3 studies, 161 H, 127 PD & 7 chronic pain subjects, about 900 resting-state MEG | MEG, T1 MRI, multimodal electrophysiological data, demographics data, questionnaire information | FUA | + | C | C |
| OPEN SCIENCE—repository for research data and publications of OVGU: http://open-science.ub.ovgu.de/xmlui/ | Data from 73 publications | Neuro data includes structural MRI, microstructure MRI, fMRI | O | + | C | P&C |
| OpenSource Brain: https://www.opensourcebrain.org/ | Unknown | Computational models of neural systems. NeuroML and PyNN | O | C | P | |
| OpenfMRI: http://openfmri.org/ | 3372 subjects, 3372 datasets | Functional and structural MRI, EEG | F | + | O | C |
| OpenNEURO: https://openneuro.org/ | 29450 participants, 770 public datasets | MRI, PET, MEG, EEG, iEEG | O | + | O | C |
| Pain and interoception imaging network (PAIN) https://www.painrepository.org/repositories/ | > 1500 scans, CBP, FM, migraine, IBS, Vlvd, IBD and H subjects | MRI, demographic, behavioral data | O | + | O | C |
| Parkinson’s disease biomarkers program (PDBP): https://pdbp.ninds.nih.gov/ | > 2000 Parkinsonian, > 250 Lewy body | Biospecimen, imaging, clinical | O | + | O | C |
| Parkinson’s progression markers initiative: https://www.ppmi-info.org/ | 1758 subjects (902 PD, 619 Prodromal, 237 H) | Clinical, imaging, ‘omics, genetic, sensor, biospecimen | O | + | C | C |
| PeptideAtlas: http://www.peptideatlas.org/ | 1600 samples | "Compendium of peptides in a large set of tandem mass spectrometry proteomics experiments" | O | + | O | P |
| PhysioBank: https://archive.physionet.org/physiobank/ | Over 75 databases | "Digital recordings of physiologic signals" and related clinical data | F | + | O | C |
| PhysioNet gait in aging and disease database https://physionet.org/content/gaitdb/1.0.0/ | 15 H and PD subjects | Electrophysiological recordings, clinical data | F | + | C | C |
| Pig imaging group: https://pigmri.illinois.edu/ | 15 pigs | MRI | F | + | C | P |
| Primate cell type database: https://primatedatabase.com/ | 106 patch clamp recordings | Images, morphology, 3D reconstructions, electrophysiological data | F | + | C | P |
| ProteomeXchange: http://www.proteomexchange.org/ | 24923 datasets | Proteomics repository | O | + | O | P&C |
| PTSD MRI database and meta-analysis https://sites.google.com/site/ptsdmri/ | 89 studies | Descriptive, numerical | F | + | C | C |
| Scalable brain atlas: https://scalablebrainatlas.incf.org/ | 20 brain atlases | Brain regions and reference images in 2D and 3D | F | C | P&C | |
| SchizConnect: http://schizconnect.org/ | 1392 Subjects | Structural and functional MRI, clinical data, cognitive data | O | + | C | C |
| ORDB (Olfactory Receptor Database) https://senselab.med.yale.edu/ORDB/ | 12 databases with over 20,000 entries in total | Chemosensory receptor data, tissue, sequencing, nomenclature data, etc | O | + | C | P |
| NeuronDB: https://senselab.med.yale.edu/neurondb | 83 neurons | Descriptive data | F | + | C | P&C |
| ModelDB: https://senselab.med.yale.edu/ModelDB/ | 1770 models | Computational neuroscience models (text files) | O | + | O | P |
| OdorMapDB: https://senselab.med.yale.edu/odormapdb/ | 68 entries | Maps of the olfactory bulb, descriptions, imaging (fMRI) | F | + | C | P |
| SimTK: https://simtk.org/ | 1649 projects | High quality simulation tools, models | O | |||
| StudyForrest: https://www.studyforrest.org/ | 36 subjects (H) | fMRI, structural brain scans, eye tracking data, clinical data | F | + | C | C |
| SynapseWeb: https://synapseweb.clm.utexas.edu/ | 1 atlas, shared data from 6 publications | 3D brain ultrastructure, high resolution images of CNS cells | + | C | P | |
| The ABCD study: https://abcdstudy.org/ | Nearly 12000 youth | Structural, task functional and resting state functional imaging, clinical data | O | + | C | C |
| The cancer imaging archive https://www.cancerimagingarchive.net/ | > 3000 cancer subjects | MRI, CT, PT, SC, digital histopathology | O | + | O | P&C |
| The mouse brain library (MBL): https://www.mbl.org/ | 800 brain images, > 8000 numerical data | Atlases, numerical data | F | + | C | P |
| The federal interagency traumatic brain injury research (FITBIR) informatics system: https://fitbir.nih.gov | 170 studies, 86985 subjects, 5276289 record (2352 forms with data) | MRI, CT, blood biospecimens, clinical data | O | + | C | C |
| UK biobank: https://www.ukbiobank.ac.uk/ | 500000 subjects (HP) | Varied biomedical data | O | + | P&C | |
| UNC-wisconsin neurodevelopment rhesus database https://data.kitware.com/#collection/54b582c38d777f4362aa9cb3 | > 150 neonate macaque brain scans across 32 subjects, 34 rhesus monkeys (healthy infants and juveniles) | Structural and diffusion MRI | FUA | + | C | P |
| USC multimodal connectivity database (USC-MCD) http://umcd.humanconnectomeproject.org/ | 2354 records | Connectivity matrices from de-identified neuroimaging data | O | + | O | C |
| VISTA: https://genome.lbl.gov/vista/index.shtml | 3315 in vivo tested elements, 1694 elements with enhancer activity | Genetic data from mice and humans | F | O | P&C | |
| Whole brain atlas: https://www.med.harvard.edu/aanlib/ | > 30 imaging-based atlas of (HP) | Brain atlas from structural MRI, PET, CT, SPECT | F | C | C | |
|
WORMATLAS |
Unknown | Gene expression, mutant phenotypes, genome and proteome data, educational resources, neural connectivity and neural circuits | O | + | C | P |
| XNAT central: https://central.xnat.org/ | 506 projects, 7139 subjects, 16567 imaging sessions | MRI, fMRI, PET, CT | O | O | P&C |
Vol Volume, H Healthy, P Pathology, HP Healthy and Pathology, CBP Chronic Back Pain, FM Fibromyalgia, IBS Irritable Bowel Syndrome, Vlvd Vulvodynia, ND Neurodegenerative Disease, CP Cerebral Palsy, Mo Mouse, Var Variety, CT Computed Tomography, SPECT Single-Photon Emission Computerized Tomography, SMA Spinal Muscular Atrophy, SC Second Capture, sMRI structural Magnetic Resonance Imaging, ADRD Alzheimer’s Disease and Related Dementias, ECoG Electro-Corticography, MEG Magnetoencephalography, ERP Event-Related Potential, iEEG intracranial Electroencephalography, EMG Electromyography, CNS Central Nervous System, ASD Autism Spectrum Disorder, ASL Arterial Spin Labeling, ISH In Situ Hybridization, ICU Intensive Care Unit, NSF National Science Foundation, Vel Velocity, O Ongoing, O* 9707 uploads over the last 30d, 254227 uploads per year, F Fixed, FUA Fixed (updates anticipated), Ver Veracity, O/C Open/Closed to uploads, Val Value, P PreClinical, C Clinical, P&C PreClinical and Clinical. Furthermore, for Veracity: Blank unclear how data handled, + Site has data management standard for submission and/or collection. Note in the O/C column O refers to Open and C to Closed, while in the Value column C refers to Clinical and in the Velocity column O refers to Ongoing. Finally, the reported Volume was indicated at the date/time of paper submission.
Table 3.
Sample of Connectome Studies and Evolving Big Data Use
| Refs | Date | Author | Vol | Var | Vel | Ver | Val |
|---|---|---|---|---|---|---|---|
| [66] | 1986 | White | Imaging: “302 Neurons”, “5000 chemical synapses, 2000 neuromuscular junctions and 600 gap junctions” | Anatomical EM studies of a Nematode nervous system | F | M | P |
| [242] | 1993 | Young | Tabulated: 72 areas with connections coded via 0 no, 1 one-way, and 2 two-way connections | Neuroanatomical literature review (Macaque cortical areas) | F | M | P |
| [67] | 1995 | Scannell | Tabulated: 1139 reported corticocortical connections between 65 cortical areas | Neuroanatomical literature review (Feline cortical areas) | F | M | P |
| [243] | 2001 | Stephan | Tabulated: 270 papers– > 4723 Brain Sites with connection data from 0 to 3 in strength to build CoCoMac database | Literature review of tracer studies in Macaque | F | Mix | P |
| [31, 244] | 2003 | Bota | Tabulated: Multiple Data Set Types (e.g., Multiple Rat connectomes (50,000 + connectivity reports each)) | Variety across data types and organisms (Rat & Macaque) | F | Mix | P |
| [245] | 2010 | Modha | Tabulated: Focused on 383 regions “spanning cortex, thalamus, and basal ganglia”; models “6,602 directed long-distance connections” | Collation of 410 Macaque tracer studies from CoCoMac | F | Mix | P |
| [246] | 2011 | Bock | Imaging: 1500 cell bodies of visual cortex with reconstruction of 245 synapses originating from 10 functionally characterized pyramidal neurons | Anatomical EM and Functional 2P imaging mouse visual cortex | F | M | P |
| [247] | 2011 | Briggman | Imaging: 634 neuronal cell bodies, with 25 Directionally Sensitive On–Off Cells in retina | Mouse Anatomical EM, Functional 2P, and visual stimulation results | F | M | P |
| [72] | 2011 | van den Heuvel | Imaging: DTI (n = 21) focused on 12 strongly interconnected bihemispheric hub regions | DTI & random attack simulation assess connection weight from 21 Humans | F | A | C |
| [230, 231, 232] | 2011 | Van Essen, Glasser | Imaging and clinical data: Over 1000 subjects (healthy young adult 22–35), over 1000 Aging adults (36–100 +), etc. following protocols of HCP | Multimodal imaging, clinical, genetic, biospecimens for 1000’s subjects | O | A | C |
| [248] | 2012 | Harriger | Tabulated: 410 studies from CoCoMac—> whole-brain connection matrix (352 regions) & cortical connectome for 242 regions and 4090 projections | Collation of 410 Macaque tracer studies from CoCoMac | F | A | P |
| [249] | 2012 | Jarrell | Imaging: 144 neurons, 64 muscles, and 1 gonad (at synaptic level) | Nematode EM, Simulation and Correlation with past experiments | F* | DML | P |
| [250] | 2013 | Takemura | Imaging: 379 neurons and 8,637 chemical synaptic contacts of Optic Medulla (focused on motion detection cells) | Anatomical EM studies from Fruit Fly | F | Mix | P |
| [251] | 2014 | Markov | Imaging: “29 of the 91 areas of the macaque cerebral cortex revealed 1615 interareal pathways” | Retrograde tracer injection studies and simulations from Macaque | F | A | P |
| [252] | 2014 | Ingalhalikar | Imaging: Structural connectome (“95 regions of interest (Regions of Interest; 68 cortical and 27 subcortical regions)” from 949 DTIs | Human DTI Imaging (Male vs. Female, 428 Male and 521 Female) | F | A | C |
| [253] | 2014 | Deligianni | Imaging: “Simultaneous resting-state EEG-fMRI was acquired from 17 adult volunteers” | Human (n = 17) EEG and fMRI comparisons | F | A | P |
| [71] | 2015 | Ohyama | Imaging: Electron Microscopy spans 10,000 neuron nervous system, but reconstructed multisensory circuit supporting synergy | Fruit Fly Anatomical EM, Behavioral, Optogenetics, Physiological Data | F | Mix | P |
| [254] | 2015 | Bota | Tabulated: 16,000 BAMS database reports of histologically defined axonal connections to assess cognition 923 rat cortical association connections | Collation of histology studies from 16,000 rats | F* | M | P |
| [255] | 2016 | Ryann | Imaging: 177 CNS neurons, 6618 synapses (including 1772 neuromuscular junctions, augmented by 1206 gap junctions) | Anatomical EM (but includes 2P coregistered data for future use) from Tadpole larva) | F | Mix | P |
| [256] | 2017 | Hildebrand | Imaging: Complete larval zebrafish brains but reconstructions focused on 2589 myelinated axons | Anatomical EM and Functional 2P from zebrafish larva | F | Mix | P |
| [257] | 2017 | Vishwanthan | Imaging: 2967 somata identified with “22 integrator neurons” “and annotated the pre- and” postsynaptic locations reconstructed | Anatomical EM and Functional 2P from zebrafish larva | F | Mix | P |
| [33] | 2018 | Zheng | Imaging: Electron Microscopy spans 100,000 neuron nervous brain, but reconstruction centered on the mushroom body (MB) | Fruit Fly Anatomical EM reconstructions with light microscopy databases | F* | Mix | P |
| [258] | 2019 | Ardesch | Imaging: DTI Humans (n = 57) and chimpanzees (n = 20), with analysis focused on rich club organization from 36 areas per hemisphere [72 in total] for both species | Human vs. non Human Primate DTI | F | Mix | P |
| [74] | 2019 | Van Essen | Imaging: Differs across species | Human (MRI), Non-Human Primate (MRI), Mouse (tracer) imaging | F | Mix | P |
| [7] | 2020 | Scheffer | Imaging: Around 25,000 neurons, with most “clustered and named”, and approximately 20 million synapses mapped for the central brain circuits (assuming bilateral symmetry) | Fruit Fly Anatomical EM studies and neural simulations | F* | Mix | P |
| [70] | 2020 | Wanner | Imaging: 1003 neurons of Olfactory Bulb (Mitral cells (n = 745), interneurons, (n = 254), and “atypical projection neurons” (n = 4) | Anatomical EM, Functional 2P, and Simulation from zebrafish larva | F | Mix | P |
| [259] | 2021 | Ashaber | Imaging and Behavioral: Recorded from 25 neurons simultaneously, but focused on reconstruction of Explore Dorsal Excitor motor neuron DE-3 and 531 synapses of the cell | Anatomical EM, Functional Voltage Sensitive Dye, Behavioral Observation, X-ray tomography from Medicinal Leech | F | Mix | P |
| [260] | 2021 | Scholl | Imaging and stimulation data: Imaging and stimulation data: “155 visually responsive” “synapses imaged in vivo on 23 dendritic segments from 5 cells” | Anatomical EM, Functional 2P, and visual stimulation results from Ferrets | F | Mix | P |
| [261] | 2021 | Brittin | Imaging: 2 complete connectomes (adult and larva) | Nematode Adult and Larva Anatomical EM | F | Mix | P |
| [262] | 2021 | Sorrentino | Imaging: Structural connectomes of 58 healthy adults [26 females, 32 males] | DTI and MEG combination (MEG better temporal resolution) from Humans | F | Mix | P |
| [15] | 2021 | Demro | 247 participants completed the study as of publication date following data collection protocols of HCP (multimodal imaging) and additional clinical/behavioral/cognitive data | Data as defined by HCP project, plus additional clinical, behavioral, and cognitive metrics in 247 psych patients | O | Mix | C |
| [263] | 2022 | Scholl | Imaging and stimulation data: Characterized 5923 visually responsive dendritic spines from 35 cells with focus on 28 binocular cells | Anatomical EM, Functional 2P, visual stimulus, and simulation | F | Mix | P |
| [13] | 2022 | Bethlehem | Imaging: MRI repository “aggregated 123,984 MRI scans, across more than 100 primary studies, from 101,457 human participants between 115 days post and conception to 100 years of age” | Longitudinal Information from 101,457 human participants (including modeled simulations) | O | Mix | C |
| [264] | 2022 | Chen | Imaging: “Resting-state functional connectivity (rs-fcMRI) data from 1416 healthy adults” (“whole brain into 300 parcels, including 27 cerebellar areas and 273 cerebral areas”) | rs-fcMRI data combined with Markov model to ascertain functional connectivity from 1416 healthy adult humans | F | A | C |
We have classified the experiments with the classic 5 V’s definition. However, certain categories are not clearly defined in the review of prospective, retrospective, and data collation studies. For Volume (Vol): We focused on volume of Imaged Structures for histology-based Imaging (e.g., Anatomical EM studies) and the size of patient cohorts and experimental data for clinical studies. We chose this method as there is not a clear standard in reporting digital data sizes across the literature. For Variety (Var): We indicate the different data and specimen types. For Velocity (Vel): We reported the data Velocity as either ‘F’ for Fixed Studies (analyzing data from databases or studies which are no longer acquiring data) or ‘O’ for Ongoing studies (analyzing data from databases or clinical studies that are still acquiring data, although it should be noted that the reported results of the studies are based on analysis of a fixed data set with the noted volume at the time of the publication). We discuss this further in the text, but implemented this simplified standard given: 1. Few studies report data in a manner that allows one to calculate data Velocity acquisition and processing (e.g., for clinical trials, which are dependent on ‘unpredictable’ patient recruitment rates and Data Acquisition velocities are often not clearly reported), 2. For the multimodal nature of data in the above studies there is not a standard of how velocity should be reported (e.g., Scheffer reported “over 50 person-years of proofreading effort over ≈2 calendar years” transforming 20 TB of raw data into 26 MB useable network diagrams for the Imaging “25,000 neurons. most of which were clustered and named” with “about 20 million chemical synapses” for an estimated speed of 400,000 synapses/person year or a transformation speed of 0.4 TB raw data/person year). Where any type of Velocity information is given, and a velocity calculation can be made, it is provided in the Additional file 1: Table S3 (and noted herein with a *). For Veracity (Ver): M Manual verification; A Data verified through automated analytical process (e.g., AI, statistical methods), Mix Automated Analytical and Manual (or semi-automated). However, all experimental data veracity is dependent on the methodological limitations of the core studies, thus we also provide examples of variability or error in the Additional file 1: Table S3 (if no explicit assessment of data Veracity is outlined in the publication or the data does not come from a validated database (e.g., primary research data), the study is just marked DML Dependent on Methodological Limitations and expanded upon in the Additional file 1: Table). For Value (Val): As neither study costs are disclosed, health economics assessments completed, nor a monetary cost assigned in the sale or purchase of any of the above data sets, we simply report on the study as having “P” for Preclinical or “C” for Clinical value dependent on the study species and Data Use. The limitations to these definitions and study information availability are described in the text. For Year we indicate the year of the earliest publication. Ref Reference
Table 6.
Sample of Pain “Big Data” Studies
| Refs | Year | Author | Vol | Var | Vel | Ver | Val |
|---|---|---|---|---|---|---|---|
| [298] | 2013 | Kim | 18,590 patients | Insurance disease/procedure codes, tracking recurring surgical methods (e.g., fusion, laminectomy, open and endoscopic discectomy, nucleolysis) | F | A | C |
| [165] | 2015 | Zaslansky | > 35,000 patients [299, 300] | Surveys, medical records, ward practices | O (HD) | A | C |
| [169] | 2016 | Ultsch | 535 pain genes | Genes, pain types (e.g., chronic) | F | A | C |
| [301] | 2017 | Taghva | 178 patients with SCS | Clinical, electrode location, paresthesia map, SCS programs | F | Mix | C |
| [168] | 2017 | Lotsch | 4834 database-queried drugs, 20 genes | Genes, syndromes, analgesic drugs | F | A | C |
| [302] | 2017 | Nijs | NA | NA | NA | NA | C |
| [303] | 2017 | Nomura | 51,000 EHRs | Clinical, sociodemographic, medication hx | O | Mix | C |
| [304] | 2018 | Min | 2 M AEs:64,354 associated to painkillers | FDA’s Adverse Events Reporting System Reports | O | Mix | C |
| [172] | 2018 | deVries | 102 subjects (34 with radiographic signs of hip OA) | Clinical, imaging (e.g., MRI), gait biomechanics, & bone shape analysis | F | Mix | C |
| [305] | 2018 | Bomberg | 26,733 German Network for Regional Anesthesia registry case reports | Clinical, imaging (e.g., ultrasound), block site, surgical specialty | F | A | C |
| [306] | 2020 | Kwon | 514,866 Health Records– > 204,066 Male records [160, 105 smokers, 43, 961 nonsmokers] | Clinical (e.g., LBP diagnosis), self-reported recreational drug use | O | Mix | C |
| [167] | 2020 | Mukasa | > 500,000 participants extracted from Korean National Health Insurance Service Database | Clinical, alcohol consumption, physical exercise, drug hx | O | A | C |
| [307] | 2020 | Schnabel | 50,005 post-op patients | Clinical, Surgery parameters | F | A | C |
| [142] | 2020 | Wong | NA | NA | F | A | C |
| [166] | 2021 | Muller-Wirtz | NA | NA | NA | NA | C |
| [308] | 2021 | Yu | 837 video-assisted thoracoscopic surgery cases | Clinical, medication hx | F | A | C |
| [309] | 2021 | Huie | 159 rats | Genes, behavioral and histological data, proteins | F | A | P |
| [310] | 2021 | Kringel | 30/28 patients with high/common opioid dosing | Genetics, opioid dosage | F | A | C |
| [170] | 2021 | Wu | 650 patients (n = 275 decompression group, n = 375 fusion group) (from 6 RCTs) | Demographics, treatment outcome and complications, clinical variables (e.g., VAS pain)- Classic Meta-Analysis | F | Mix | C |
| [171] | 2021 | Lin | 84 OA patients (42 tretinoin, 42 sodium glutamate) | Clinical, gait kinematics (video-based) | F | Mix | C |
| [311] | 2022 | Anis | “681 patients with IC/BPS” and 3376 controls | Clinical variables, demographics, diagnoses | F | Mix | C |
We have classified the [111, 165–172, 298, 299, 301–311] citations with the classic 5 V’s definition. However, these are not always clearly defined in the prospective studies, retrospective studies, or review articles. For Volume (Vol): We focused on the size of patient cohorts. For Variety (Vol): We indicate the different data and specimen types derived from the cohorts (note, Variety can also be seen in patient type, tabulated in Volume; and vice versa the data type is indicative of volume indicated in Variety). For Velocity (Vol): We reported the Data Velocity as either ‘F’ for Fixed studies (analyzing data from databases or studies which are no longer acquiring data) or ‘O’ for Ongoing studies (analyzing data from databases or clinical studies that are still acquiring data, although it should be noted that the reported results of the studies are based on analysis of a fixed data set with the noted volume at the time of the publication). We also indicate if any “real-time” data was or will be gathered as part of the study (HD Hospital upload Dependent). Where any type of velocity information is given, and a velocity calculation can be made, it is provided in the Additional file 1: Table S6 (and noted herein with a *). For Veracity (Vol): M Manual verification, A Data verified through automated analytical process (AI, statistical methods), and Mix Automated Analytical and Manual (or semi-automated). However, all experimental data veracity is dependent on the methodological limitations of the core studies; thus, we also provide examples of variability or error in the Additional file 1: Table S6. For Value (Vol): As neither study costs are disclosed, health economics assessments completed, nor a monetary cost assigned in the sale or purchase of any of the above data sets, we report "P" for Preclinical, “C” for Clinical value or “PC” for Preclinical and Clinical, dependent on the study species and data use. The limitations to these definitions and study information availability are described in the text (e.g., see “Proposed Solutions”). In the Additional file 1, Additional file 1: Table S6, we also include information on the tools used, database source(s), and methodological limitations. What should be noted in several of the studies, particularly with smaller patient samples, is the liberal use the “Big Data” classification by the authors (e.g., contrast [111] which is a classic meta-analysis with [171] which implements multimodal data sets (e.g., Clinical, imaging, kinematics) and Big Data analytic methods). For Year we indicate the year of the earliest publication. SCS Spinal cord stimulation, OA osteoarthritis, IC interstitial cystitis, BPS bladder pain syndrome, VAS visual analog scale
National projects and big data foundations: Connectomes, neuroimaging, and genetics
The human brain contains ~ 100 billion neurons connected via ~ 1014 synapses, through which electrochemical data is transmitted [59]. Neurons are organized into discrete regions or nuclei and connect in precise and specific ways to neurons in other regions; the aggregated connections between all neurons in an individual comprises their connectome. The connectome is a term coined by Sporns et al. designed to be analogous to the genome; like the genome, the connectome is a large and complex dataset characterized by tremendous interindividual variability [60]. Connectomes, at the level of the individual or as aggregate data from many individuals, have the potential to produce a better understanding of how brains are wired as well as to unravel the “basic network causes of brain diseases” for prevention and treatment [60–63]. Major investments in human connectome studies in health and disease came in ~ 2009, when the NIH Blueprint for Neuroscience Research launched the Blueprint Grand Challenges to catalyze research. As part of this initiative, the Human Connectome Project (HCP) was launched to chart human brain connectivity, with two research consortia awarded approximately $40 M. The Wu-Minn-Ox consortium sought to map the brain connectivity (structural and functional) of 1200 healthy young adults and investigate the associations between behavior, lifestyle, and neuroimaging outcomes. The MGH-UCLA (Massachusetts General Hospital-University of California Los Angeles) consortium aimed to build a specialized magnetic resonance imager optimized for measuring connectome data. The Brain Activity Map (BAM) Project was later conceived during the 2011 London workshop “Opportunities at the Interface of Neuroscience and Nanoscience.” The BAM group proposed the initiation of a technology-building research program to investigate brain activity from every neuron within a neural circuit. Recordings of neurons would be carried out with timescales over which behavioral outputs or mental states occur [64, 65]. Following up on this idea, in 2013, the NIH BRAIN Initiative was initiated by the Obama administration, to “accelerate the development and application of new technologies that will enable researchers to produce dynamic pictures of the brain that show how individual brain cells and complex neural circuits interact at the speed of thought”. Other countries and consortia generated their own initiatives, such as the European Human Brain Project, the Japan Brain/MINDS project, Alzheimer’s Disease Neuroimaging Initiative (ADNI), Enhancing Neuroimaging Genetics through Meta-analysis (ENIGMA), and the China Brain Project. These projects aimed to explore brain structure and function, with the goal of guiding the development of new treatments for neurological diseases. The scale of these endeavors, and the insights they generated into the nervous system, were made possible by the collection and analysis of Big Data (see Table 1). Below, we succinctly exemplify ways in which Big Data is transforming Neuroscience and Neurology through the HCP (and similar initiatives), ADNI, and ENIGMA projects.
Connectome
Ways in which Big Data is transforming Neuroscience and Neurology are exemplified through advancements in elucidating the connectome (see for example Table 3 and Additional file 1: Table S3). Early studies in organisms such as the nematode C. elegans used electron microscopy (EM) to image all 302 neurons and 5000 connections of the animal [66], while analyses on animals with larger nervous systems collated neuroanatomical tracer studies to extract partial cerebral cortex connectivity matrices, e.g., cat [67] and macaque monkey [68, 69]. More recently, advancements in imaging and automation techniques, including EM and two-photon (2P) fluorescence microscopy, have enabled the creation of more complete maps of the nervous system in zebrafish and drosophila [7, 33, 70, 71]. Despite the diminutive size of their nervous systems, the amount of data is enormous. Scheffer and colleagues generated a connectome for portion of the central brain of the fruit fly “encompassing 25,000 neurons and 20 million chemical synapses” [7]. This effort required “numerous machine-learning algorithms and over 50 person-years of proofreading effort over ≈2 calendar years” processing > 20 TB of raw data into a 26 MB connectivity graph, “roughly a million fold reduction in data size” (note, a review of the specific computational techniques is outside this paper’s scope, see [7, 33, 58, 70, 71] for more examples). Thus, connectomes can be delineated in simple animal models; however, without automation and the capacity to acquire Big Data of this type, such a precise reconstruction could not be accomplished. Extending this detailed analysis to the human brain will be a larger challenge, as evidenced by the stark contrast between the 25,000 neurons analyzed in the above work and the 100 billion neurons and ~ 1014 synapses present in the human brain.
At present, the study of the human connectome has principally relied on clinical neuroimaging methods, including Diffusion Tensor Imaging (DTI) and Magnetic Resonance Imaging (MRI), to generate anatomical connectomes, and on neuroimaging techniques such as functional MRI (fMRI), to generate functional connectomes [9, 12]. For example, in what might be considered a “Small Data” step, P. van den Heuvel and Sporns, demonstrated “rich-club” organization in the human brain (“tendency for high-degree nodes to be more densely connected among themselves than nodes of a lower degree, providing important information on the higher-level topology of the brain”) via DTI and simulation studies based on imaging from 21 subjects focused on 12 brain regions [72]. This type of work has quickly become “Big Data” science, as exemplified by Bethlehem et al.’s study of “Brain charts for the human lifespan” which was based on 123,984 aggregated MRI scans, “across more than 100 primary studies, from 101,457 human participants between 115 days post-conception and 100 years of age” [13]. The study provides instrumental evidence towards neuroimaging phenotypes and developmental trajectories via MRI imaging. Human connectome studies are also characterized by highly heterogeneous datasets, owing to the use of multimodal imaging, which are often integrated with clinical and/or biospecimen datasets. For example, studies conducted under the HCP [32] have implemented structural MRI (sMRI), task fMRI (tfMRI), resting-state fMRI (rs-fMRI), and diffusion MRI (dMRI) imaging modalities, with subsets undergoing Magnetoencephalography (MEG) and Electroencephalography (EEG). These studies usually involve hundreds to thousands of subjects, such as the Healthy Adult and HCP Lifespan Studies [73]. While the above connectome studies have primarily focused on anatomical, functional, and behavioral questions, connectome studies are used across the biological sciences (e.g., study evolution by comparing mouse, non-human primates, and human connectomes [74]) and as an aid in assessing and treating neuropathologies (as will be elaborated on further below).
ADNI
In the same period that the NIH was launching its Neuroscience Blueprint Program (2005), it also helped launch the ADNI in collaboration with industry and non-profit organizations. The primary objectives of ADNI are to develop “biomarkers for early detection” and monitoring of AD; support “intervention, prevention, and treatment” through early diagnostics; and share data worldwide [75–77]. Its Informatics Core [78], which was established for data integration, analysis, and dissemination, was hosted at University of Southern California, and highlights the Big Data underpinnings of ADNI (https://adni.loni.usc.edu). ADNI was originally designed to last 5 years with bi-annual data collection of cognition; brain structural and metabolic changes via Positron Emission Technology (PET) and MRIs; genetic data; “and biochemical changes in blood, cerebrospinal fluid (CSF), and urine in a cohort of 200 elderly control subjects, 400 Mild Cognitive Impairment patients, and 200 mild AD patients" [75, 76, 79]. The project is currently in its fourth iteration, ADNI4, with funding through 2027 [80, 81]. To date, ADNI has enrolled > 2000 participants who undergo continuing longitudinal assessments. The ADNI study has paved the way for the diagnosis of AD through the usage of biomarker tests such as amyloid PET scans and lumbar punctures for CSF, and demonstrated that ~ 25% of people in their mid-70’s has a very early stage of AD (“preclinical AD”), which would have previously gone undetected. These results have helped encourage prevention and early treatment as the most effective approach to the disease.
ENIGMA
During the same period that major investments were beginning in connectome projects (2009), the ENIGMA Consortium was established [82, 83]. It was founded with the initial aim of combining neuroimaging and genetic data to determine genotype–phenotype brain relationships. As of 2022, the consortium included > 2000 scientists hailing from 45 countries and collaborating across more than 50 working groups [82]. These efforts helped spur on many discoveries, including genome-wide variants associated with human brain imaging phenotypes (see, the 60 + center large-scale study with > 30,000 subjects that provided evidence of the genetic impact on hippocampal volume [84, 85], whose reduction is possibly a risk factor for developing AD). The group has also conducted large scale MRI studies in multiple pathologies and showed imaging-based abnormalities or structural changes [82, 83] in numerous conditions, such as major depressive disorder (MDD) [86] and bipolar disorder [87]. Other genetics/imaging-based initiatives have made parallel advancements, such as the genome-wide association studies of UK Biobank [88–90], Japan’s Brain/MINDS work [53], and the Brainstorm Consortium [91]. For example, the Brainstorm Consortium assessed “25 brain disorders from genome-wide association studies of 265,218 patients and 784,643 control participants and assessed their relationship to 17 phenotypes from 1,191,588 individuals.” Ultimately, Big Data-based genetic and imaging assessments have permeated the Neurology space, significantly impacting patient care through enhanced diagnostics and prognostics, as will be discussed further below.
From discovery research to improved neurological disease treatment
The explosive development of studies spurred on by these national projects with growing size, variety, and speed of data, combined with the development of new technologies and analytics, has provoked a paradigm shift in our understanding of brain changes through lifespan and disease [7, 92–96], leading to changes in the investigation and treatment development for neurological diseases and profoundly impacting the field of Neurology. Over the past decade, such impact has occurred in multiple ways. First, Big Data has opened the opportunity to analyze combined large, incomplete, disorganized, and heterogenous datasets [97], which may yield more impactful results as compared to clean curated, small datasets (with all their external validity questions and additional limitations). Second, Big Data studies have improved our basic understanding (i.e., mechanisms of disease) of numerous neurological conditions. Third, Big Data has aided diagnosis improvement (including phenotyping) and subsequently refined the determination of a presumptive prognosis. Fourth, Big Data has enhanced treatment monitoring, which further aids treatment outcome prediction. Fifth, Big Data studies have recently started to change clinical research methodology and design and thus directly impact the development of novel therapies. In the remainder of this section, we will elaborate on the aforementioned topics, followed by the presentation of particular case studies in select areas of Neurology.
Opportunities and improved understanding
As introduced above, Big Data solutions have impacted our understanding of the fundamentals of brain sciences and disease, such as brain structure and function (e.g., HCP) and the genetic basis of disease (e.g., ENIGMA). Advancements in connectome and genetics studies, along with improved analytics, have advanced our understanding of brain changes throughout the lifespan and supported hypotheses linking abnormal connectomes to many neurological diseases [13, 72, 92, 98]. Studies have consistently shown that architecture and properties of functional brain networks (which can be quantified in many ways, e.g., with graph theoretical approaches [94]) correlate with individual cognitive performance and dynamically change through development, aging, and neurological disease states including neurodegenerative diseases, autism, schizophrenia, and cancer (see, e.g., [92, 93, 95, 96]). Beyond genetics and connectomes, Big Data methods are used in vast ways in brain research and the understanding of diseases, such as from brain electrophysiology [99], brain blood-flow [100], brain material properties [101], perceptual processing [102, 103], and motor control [104].
Diagnostics/prognostics/monitoring
Big Data methods are also increasing in prevalence in diagnostics and prognostics. For example, the US Veterans Administration recently reported on the genetic basis of depression based on analysis from > 1.2 M individuals, identifying 178 genomic risk loci, and confirming it in a large independent cohort (n > 1.3 M) [105]. Subsequent to the European Union (EU) neuGRID and neuGRID4You projects, Munir et. al. used fuzzy logic methods to derive a single “Alzheimer’s Disease Identification Number” for tracking disease severity [106]. Eshaghi et. al. identified MS subtypes via MRI Data and unsupervised machine learning [107] and Mitelpunkt et al. used multimodal data from the ADNI registry to identify dementia subtypes [108]. Big Data methods have also been used to identify common clinical risk factors for disease, such as gender, age, and geographic location for stroke [109] (and/or its genetic risk factors [110]). Big Data approaches to predict response to treatment are also increasing in frequency. For example, for depression, therapy choice often involves identifying subtypes of patients based on co-occurring symptoms or clinical history, but these variables are often not sufficient for Precision Medicine (i.e., predict unique patient response to specific treatment) nor even at times to differentiate patients from healthy controls [17, 111]. Noteworthy progress has been made in depression research, such as successful prediction of treatment response using connectome gradient dysfunction and gene expression [18], through resting state connectivity markers of Transcranial Magnetic Stimulation (TMS) response [17], and via a sertraline-response EEG signature [111]. As another example, the Italian I-GRAINE registry is being developed as a source of clinical, biological, and epidemiologic Big Data on migraine used to address therapeutic response rates and efficiencies in treatment [112].
Additionally, Big Data approaches of combining high volumes of varied data at high velocities are offering the potential for new "real-time" biomarkers [113]. For instance, data collected with wearable sensors has been increasingly used in clinical studies to monitor patient behavior at home or in real-world settings. While the classic example is the use of EEG for epilepsy [114], numerous other embodiments can be found in the literature. For example, another developing approach is utilizing smartphone data to evaluate daily changes in symptom severity and sensitivity to medication in PD patients [115]. This approach has led to a memory test and simple finger tapping and to track the status of study participants [116]. Collectively, these examples highlight Big Data’s potential for facilitating participatory Precision Medicine (i.e., tailored to each patient) in trials and clinical practice (which is covered in more detail in Sect. “Proposed Solutions”).
Evolving evaluation methods
The way in which new potential neurological therapies are being developed is also changing. Traditionally, Randomized Controlled Trials (RCTs) evaluate the safety and efficacy of potential new treatments. In an RCT the treatment group is compared to a control or placebo group, in terms of outcome measures, at predefined observation points. While RCTs are the gold standard for developing new treatments, they have several limitations [117], which can include high cost, lengthy completion times, limited generalizability of results, and restricted observations (e.g., made at a limited number of predefined time points in a protocol (e.g., baseline, end of treatment)). Thereby, clinical practice is currently limited by RCT and evidence-based medicine interpretations and limitations [118], which are largely responsible for a predominant physician’s responsive mindset. A wealth of recent manuscripts on Big Data analysis facilitates a potential solution for individual patient behavior prediction and proactive Precision Medicine management [119] by augmenting and extending RCT design [117]. Standardization and automation of procedures using Big Data make entering and extracting data easier and could reduce the effort and cost of running an RCT. They can also be used to formulate hypotheses fueled by large, preliminary observational studies and/or carry out virtual trials. For example, Peter et al. showed how Big Data could be used to move from basic scientific discovery to translation to patients in a non-linear fashion [120]. Given the potential pathophysiological connection between PD and inflammatory bowel disease (IBD), they evaluated the incidence of PD in IBD patients and investigated whether anti-tumor necrosis factor (anti-TNF) treatment for IBD affected the risk of developing PD. Rather than a traditional RCT, they ran a virtual repurposing trial using data from 170 million people in two large administrative claims databases. The study observed a 28% higher incidence rate of PD in IBD patients than in unaffected matched controls. In IBD patients, anti-TNF treatment resulted in 78% reduction in the rate of PD incidence relative to patients that did not receive the treatment [120, 121]. A similar approach was reported by Slade et al. They conducted experiments on rats to investigate the effects of Attention Deficit Hyperactivity Disorder (ADHD) medication (type and timing) on the “rats’ propensity to exhibit addiction-like behavior”, which led to the hypothesis that initiating ADHD medication in adolescence “may increase the risk for SUD in adulthood”. To test this hypothesis in humans, rather than running a traditional RCT, they used healthcare Big Data from a large claim database and, indeed, found that “temporal features of ADHD medication prescribing”, not subject demographics, predicted SUD development in adolescents on ADHD medication [122]. A hybrid approach was used in the study by Yu et al. [123]. Their study examined the potential of vitamin K2 (VK2) to reduce the risk of PD, given its anti-inflammatory properties and inflammation's role in PD pathogenesis. Initially, Yu et al. assessed 93 PD patients and 95 controls and determined that the former group had lower serum VK2 levels compared to the healthy controls. To confirm the connection between PD and inflammation, the study then analyzed data from a large public database, which revealed that PD patients exhibit dysregulated inflammatory responses and coagulation cascades that correlate with decreased VK2 levels [123].
Even though these pioneering studies demonstrate potential ways in which Big Data can be used to perform virtual RCT trials, several challenges remain. The processing pipeline of Big Data, from collection to analysis, has still to be refined. Moreover, it is still undetermined how regulatory bodies will ultimately utilize this type of data. In the US, the Food and Drug Administration (FDA) has acknowledged the future potential of “Big Data” approaches, such as using data that could be gathered from Electronic Health Records (EHRs), pharmacy dispensing, and payor records, to help evaluate the safety and efficacy of therapeutics [124]. Furthermore, the FDA has begun the exploration and use of High-Performance Computing (HPC) to internally tackle Big Data problems [125] and concluded that Big Data methodologies could broaden “the range of investigations that can be performed in silico” and potentially improve “confidence in devices and drug regulatory decisions using novel evidence obtained through efficient big data processing”. The FDA is also employing Big Data based on Real World Evidence (RWE), such as with their Sentinel Innovation Center, which will implement data science advances (e.g., machine learning, natural language processing) to expand EHR data use for medical product surveillance [126, 127]. Lastly, the exploration of crowdsourcing of data acquisition and analysis is an area still to be explored and outside the scope of this review [128].
Big Data case studies in neurology
To provide the reader with a sample of existing Big Data solutions for improving patient care (beyond those surveyed above), we focus on three separate disorders, PD, SUD, and Pain. While Big Data has positively impacted numerous other neuropathologies (e.g., [129–132]), we have chosen these three disorders due to their significant societal impact and their representation of varying stages of maturity in the application of Big Data to Neurology. Finally, we exemplify Big Data’s foreseeable role in therapeutic technology via brain stimulation, which is used in the aforementioned disorders and is particularly suitable for Precision Medicine.
PD
After AD, PD is the second most prevalent neurodegenerative disorder [133–135]. About 10,000 million people live with PD worldwide, with ~ 1 million cases in the US. The loss of dopamine-producing neurons leads to symptoms such as tremor, rigidity, bradykinesia, and postural instability [136]. Traditional treatments include levodopa, physical therapy, and neuromodulation (including Deep Brain Stimulation (DBS) and Noninvasive Brain Stimulation (NIBS) [36, 137, 138].
The increasing significance of Big Data in both PD research and patient care can be measured by the rising number of published papers over the past decade (Fig. 3). Several national initiatives have been aimed at building public databases to facilitate research. For example, the Michael J. Fox Foundation’s Parkinson’s Progression Markers Initiative (PPMI) gathers data from about 50 sites in several nations including the US, Europe, Israel, and Australia with the objective of identifying potential biomarkers of disease progression [139, 140]. A major area of research involving Big Data analytics focuses on PD’s risk factors, particularly through genetic data analysis. The goal is to enhance our comprehension of the causes of the disease and develop preventive treatments. The meta-analysis of PD genome-wide association studies by Nalls et al. illustrates this approach, which involved the examination of “7,893,274 variants” among “13,708 cases and 95,282 controls”. The findings revealed and confirmed “28 independent risk variants” for PD “across 24 loci” [141]. Patient phenotyping for treatment outcome prediction is another research area that utilizes Big Data analytics. Wong et al.’s paper discusses this approach, reviewing the use of structural and functional connectivity studies to enhance the efficacy of DBS treatment for PD and other neurological diseases [142]. An emerging area of patient assessment is wearable sensors and/or apps for potential real-time monitoring of symptoms and response to treatment [143]. A major project in this area is the iPrognosis mobile app, which was funded by the EU Research Programme Horizon 2020 and aimed at accelerating PD diagnosis and developing strategies to help improve and maintain the quality of life of PD patients via capturing data during user interaction with smart devices, including smartphones and smartwatches [144]. Similar to other diseases, PD analysis is also being conducted via social media (e.g., [16, 145]) and EHR [146, 147] analyses. See Table 4 and Additional file 1: Table S4 or review articles in [148–154] for further examples of Big Data research in PD.
Fig. 3.

Cumulative number of papers on Big Data over time for different areas, as per Pubmed. The panels illustrate when Big Data started to impact the area and allow a comparison across areas As graphs were simply created by using the keywords “Big Data” AND “area”, with "area" being “Parkinson’s Disease”, “Addiction”, etc. as opposed to using multiple keywords that may be used to describe each field, actual numbers are likely to be underestimated
Table 4.
Sample of PD “Big Data” Studies
| Refs | Year | Author | Vol | Var | Vel | Ver | Val |
|---|---|---|---|---|---|---|---|
| [140] | 2010 | Dinov | PD (263 de novo, 40 SWEDD), 127 HC | PPMI imaging, genetics, clinical and demographic | O | A | C |
| [265, 266, 267] | 2012 | PDBP Cons | > 2000 Parkinsonian, > 250 Lewy body | Biospecimen (e.g., blood), imaging (e.g., fMRI), clinical | O | A | C |
| [141] | 2014 | Nalls | “7,893,274 variants across 13,708 cases and 95,282 controls” | Demographics, genetic, clinical | O | Mix | |
| [116] | 2018 | Prince | 312 PD subjects & 236 HC | Demographics, clinical, walking, voice, finger tapping | F(ApD) | A | C |
| [268] | 2016 | Cohen | NA (but includes 700,000 h smartwatch data from hundreds of PD) | Clinical, kinematics | F(ApD) | A | C |
| [144, 269, 270, 271, 272] | 2017 | Age Plat. EU | > 4500 Elderly Adults | Behaviroal (acitvity), location, typing, voice | O(ApD) | A | C |
| [273] | 2017 | Suo | 153 PD, 81 HC | Clinical, imaging (e.g., rs-fMRI) | F | Mix | C |
| [180] | 2017 | Horn | 95 PD patients with STN DBS [2 centers] | Imaging (eg. rs-fMRI), clinical | F | A | C |
| [274] | 2018 | Senthilarumugam | 1479 patients (418 PD, 172 HC, 62 prodromal, 827 genetic cohorts) | PPMI imaging, genetics, clinical and demographic | O | A | C |
| [120] | 2018 | Peter | 170 million health care–covered- > 144,018 IBD & 720,090 HC claim info | Incidence rates, anti-TNF Rx rates, ICD-9 & 10 codes | F | - | C |
| [275] | 2019 | Sreenivasan | 20 early-stage drug-naïve PD,,16 HC | Clinical, imaging (e.g., MRI, fMRI) | F | A | C |
| [123] | 2020 | Yu | 93 PD, 95 HC | Clinical, serum VK2 levels, genetic | F | A | C |
| [276] | 2021 | Wu | 5,998 PD or ET DBS patients [283 centers] | Medicare Claims Files (eg., reoperation rate) | O | A | C |
| [277] | 2021 | Zhang | 60,000 dialogues(40,000 patients & 3000 practitioners), 2895 Demographics | Demographics, patient descriptions of symptoms | O(SM)* | A | C |
| [278] | 2021 | De Micco | 147 drug-naïve PD, 38 HC | Clinical, imaging (e.g., rs-fMRI), demographics | F | A | C |
| [191] | 2022 | Monte-Rubio | 216 PD & 87 HC [4 centers] | Imaging(MRI from multiple sites) | F | Mix | C |
| [279] | 2022 | Loh | 75 PD DBS candidates | Demographic,clinical, imaging (e.g., MRI, rs-fMRI) | F | A | C |
We have classified the example citations [116, 120, 123, 140, 141, 144, 180, 191, 265–279] with the classic 5 V’s definition. However, these are not always clearly defined in the prospective studies, retrospective studies, or review articles. For Volume: We focused on the size of patient cohorts. For Variety: We indicate the different data and specimen types derived from the cohorts (note, Variety can also be seen in patient type, tabulated in Volume; and vice versa the data type is indicative of volume indicated in Variety). For Velocity: We reported the data Velocity as either ‘F’ for Fixed studies (analyzing data from databases or studies which are no longer acquiring data) or ‘O’ for Ongoing studies (analyzing data from databases or clinical studies that are still acquiring data, although it should be noted that the reported results of the studies are based on analysis of a fixed data set with the noted volume at the time of the publication). We also indicate if any “real-time” data was or will be gathered as part of the study (ApD Mobile App Realtime Dependent; SM Social Media Dependent). Where any type of velocity information is given, and a velocity calculation can be made, it is provided in the Additional file 1: Table S4 (and noted herein with a *). For Veracity: M Manual verification; A Data verified through automated analytical process (AI, statistical methods); and Mix Automated Analytical and Manual (or semi-automated). However, all experimental data veracity is dependent on the methodological limitations of the core studies; thus, we also provide examples of variability or error in the Additional file 1: Table S4. For Value: As neither study costs are disclosed, health economics assessments completed, nor a monetary cost assigned in the sale or purchase of any of the above data sets, we report "P" for Preclinical or “Cl” for Clinical value, dependent on the study species and data use. The limitations to these definitions and study information availability are described in the text (e.g., see “Proposed Solutions”). In the Additional file Section, Additional file 1: Table S4, we also include information on the tools used, database source(s), and methodological limitations. For Year we indicate the year of the earliest publication
SUD and Opioid Use Disorder (OUD)
The economic and social burden associated with SUDs is enormous. OUD is the leading cause of overdoses due to substance abuse disorders, where death rates have drastically increased, with over 68,000 people in 2020 [155]. The US economic cost of OUD alone and fatal opioid overdoses was $471 billion and $550 billion, respectively, in 2017 [156]. Treatments focus on replacement (e.g., nicotine and opioid replacement) and abstinence and are often combined with self-help groups or psychotherapy [157, 158].
Like PD, the increasing impact of Big Data in SUD and OUD research and patients care can be measured by the increased number of papers published in Pubmed over the past decade (Fig. 3). Several national initiatives have been aimed at building public databases to facilitate SUD research. For example, since 2009, the ENIGMA project includes a working group specifically focused on addiction, which has gathered genetic, epigenetic, and/or imaging data from 1000’s of SUD subjects from 33 sites as of 2020 [37]. As part of this research, Mackey et al. have been investigating the association between dependence and regional brain volumes, both substance-specific and general [159]. Similarly, studies implementing data sets from the UK BioBank and 23andMe (representing > 140,000 subjects) have been used for developing the Alcohol Use Disorder Identification Test (AUDIT) to identify the genetic basis of alcohol consumption and alcohol use disorder [160]. Big Data is also being used to devise strategies for retaining patients on medication for OUD, as roughly 50% of persons discontinue OUD therapy within a year [158]. The Veterans Health Administration is spearheading such an initiative based on data (including clinical, insurance claim, imaging, and genetic data) from > 9 M veterans [158]. Social media is also emerging as a method to monitor substance abuse and related behaviors. For example, Cuomo et al. reported on the results of an analysis of geo-localized Big Data collected in 2015 via 10 M tweets from Twitter regressed with Indiana State Department of Health data on non-fatal opioid-related hospitalizations and new “HIV cases from the US Centers for Disease Control and Prevention" to examine the transition from "opioid prescription abuse to heroin injection and HIV transmission risk” [161]. Leveraging Big Data from online content is likely to aid public health practitioners in monitoring SUD. Table 5 and Additional file 1: Table S5 summarize Big Data research in SUD and OUD.
Table 5.
Sample of SUD and OUD “Big Data” Studies
| Refs | Year | Author | Vol | Var | Vel | Ver | Val |
|---|---|---|---|---|---|---|---|
| [280] | 2016 | Kohno | 39 methamphetamine (MA)-dependent subjects and 44 HC | Clinical, Imaging (e.g., rs-fMRI, PET) | F | A | C |
| [203] | 2016 | Mackey | > 10,000 subjects (review) | Imaging (e.g., MRI), genetic | O | A | C |
| [16] | 2017 | Kim | NA | Social media-based metrics (e.g., number of likes on Facebook groups) | NA | NA | C |
| [160] | 2017 | Sanchez-Roige | > 120,000 patients | Alcohol Use Disorders Identification Test (AUDIT), genetics | F | A | C |
| [281] | 2018 | Ipser | 46 MA-dependent subjects and 26 HC | Clinical, Imaging (e.g., rs-fMRI) | F | A | C |
| [282] | 2018 | Lisdahl | 12,000 youth (21 US sites) [283] | Cognitive, clinical (SUD focus), culture & environment, imaging (e.g., MRI), and bioassays | O | A | C |
| [284] | 2018 | Sun | 78 heroin abusers and 79 HC | Imaging (e.g., DTI), clinical, and genetic | F | A | C |
| [159] | 2019 | Mackey | 23 labs, 2,140 SUD, 1100 HC | Imaging (e.g., MRI), clinical for alcohol, nicotine, cocaine, methamphetamine, or cannabis dependent patients | O | A | C |
| [285] | 2019 | Yip | 74 methadone-maintained, cocaine-dependent subjects | Imaging (e.g., fMRI), data from Monetary Incentive Delay task, clinical | F | A | C |
| [286] | 2019 | Young | NA-This is a viewpoint paper | Social media posts, location, cannabis outcomes | NA | NA | C |
| [161] | 2020 | Cuomo | 10 M tweets- > 257 tweets about opioids, IV Drug Use or HIV hospitalizations and HIV cases | Twitter data, hospitalizations, and new HIV cases | F(SM) | Mix | C |
| [287] | 2020 | Segal | “10 M medical insurance claims” “from 550,000 patient records” | Diagnosis & procedures, medications, episode counts | O | A | C |
| [122] | 2020 | Slade | 11,778,912 records, 118,063 with adolescent ADHD medication | Longitudinal clinical and medication hx, demographics | F | A | PC |
| [288] | 2020 | Zhou |
> 10,000 European ancestry OUD; > 70,000 opioid-exposed control > 5000 African ancestry OUD; > 25,000 opioid-exposed control |
Genetic, clinical | O | A | |
| [37] | 2020 | Thompson | 33 sites, 12,347 individuals (including 2277 adults with SUD (alcohol, nicotine, cocaine, MA, or cannabis) | Imaging (e.g., MRI), clinical, genetic, and epigenetic | O | A | C |
| [289] | 2021 | Flores | 19,721 tweets identified with opioid keywords across 7 US cities | Tweets, geolocation | O(SM) | Mix | C |
| [290] | 2021 | Gelernter | NA | Clinical, genetics | NA | NA | C |
| [291] | 2021 | Liu | 31 heroin users | Clinical, imaging (e.g., fMRI during visual cues) | F | A | C |
| [292] | 2021 | Purushothaman | “56,464 Instagram posts and comments”, including 719 posts containing “suicide, substance use and/or mental health” | Instagram posts | O(SM)* | Mix | C |
| [293] | 2021 | Rosetti | 660 Alcohol Dependence, 326 controls | Imaging (e.g., DTI, MRI), clinical (e.g., drug use) | O | A | C |
| [294] | 2021 | Tretter | NA | NA | NA | NA | C |
| [158] | 2022 | Hayes | > 9 M veterans | Clinical, insurance claims, imaging (e.g., fMRI), genetics | O | A | C |
| [295] | 2022 | Li | 46 MA-dependent subjects and 40 HC | Clinical, imaging (e.g., rs-fMRI) | F | A | C |
| [296] | 2022 | Ottino-Gonzalez | > 700 subjects (cocaine (n = 147), MA (n = 132) nicotine (n = 189), and HC = 333) | Imaging (DTI, MRI), clinical (e.g., drug use) | O | A | C |
We have classified the example citations [16, 122, 159–161, 203, 280–282, 284–297] with the classic 5 V’s definition. However, these are not always clearly defined in the prospective studies, retrospective studies, or review articles. For Volume (Vol): We focused on the size of patient cohorts. For Variety: We indicate the different data and specimen types derived from the cohorts (note, Variety can also be seen in patient type, tabulated in Volume; and vice versa the data type is indicative of volume indicated in Variety). For Velocity (Vol): We reported the data Velocity as either ‘F’ for Fixed studies (analyzing data from databases or studies which are no longer acquiring data) or ‘O’ for Ongoing studies (analyzing data from databases or clinical studies that are still acquiring data, although it should be noted that the reported results of the studies are based on analysis of a fixed data set with the noted volume at the time of the publication). We also indicate if any “real-time” data was or will be gathered as part of the study (SM Social Media Dependent). Where any type of velocity information is given, and a velocity calculation can be made, it is provided in the Additional file 1: Table S5 (and noted herein with a *). For Veracity (Vol): M Manual verification, A Data verified through automated analytical process (AI, statistical methods), and Mix Automated Analytical and Manual (or semi-automated). However, all experimental data veracity is dependent on the methodological limitations of the core studies; thus, we also provide examples of variability or error in the Additional file 1: Table S5. For Value (Vol): As neither study costs are disclosed, health economics assessments completed, nor a monetary cost assigned in the sale or purchase of any of the above data sets, we report “P” for Preclinical, “C” for Clinical value or “PC” for Preclinical and Clinical, dependent on the study species and data use. The limitations to these definitions and study information availability are described in the text (e.g., see “Proposed Solutions”). In the Additional file 1, Additional file 1: Table S5, we also include information on the tools used, database source(s), and methodological limitations. For Year we indicate the year of the earliest publication. hx history
Pain
Chronic pain is a widespread condition that affects a significant portion of the global population, with an estimated 20% of adults suffering from it and 10% newly diagnosed each year [162]. In the US, this condition is most prevalent and affects over 50 million adults. The most common pain locations are the back, hip, knee, or foot [163], which are chiefly due to neural entrapment syndromes (e.g., Carpal Tunnel Syndrome (CTS)), peripheral neuropathy (such as from diabetes), or unknown causes (such as non-specific chronic Lower Back Pain (LBP)). Pain treatment remains challenging and includes physical therapy, pharmacological and neuromodulation approaches [164]. As in other areas of Neurology, the Big Data revolution has been impacting pain research and management strategies. As reviewed by Zaslansky et al., multiple databases have been created to monitor pain, for example the international acute pain registry PAIN OUT, established in 2009 with EU funds, to improve the management of surgeries [165, 166]. Besides risk factors [167], such as those based on genetic data (e.g., see [168, 169]), pain studies using Big Data mainly focus on management of symptoms and improving therapy outcomes. Large-scale studies aimed at comparing different treatments [170, 171] or at identifying phenotypes in order to classify and diagnose patients (see for example [172]) are particularly common. Table 6 and Additional file 1: Table S6 summarize Big Data research in Pain, while Fig. 3 shows the increasing number of published papers in the field.
Example of Big Data impact on treatments and diagnostics-brain stimulation
In the last twenty years, neurostimulation methods have seen a substantial rise in application for neurological disease treatment [36, 138, 173]. Among the most used approaches are invasive techniques like DBS [173–176], which utilize implanted devices to apply electrical currents directly into the neural tissue and modulate neural activity. Noninvasive techniques, on the other hand, like those applied transcranially, offer stimulation without the risks associated with surgical procedures (such as bleeding or infection) [36]. Both invasive and noninvasive approaches have been used for psychiatric and neurological disorders treatments, including those for depression, PD, addiction, and pain. While High Performance Computing has been used in the field for some time (see Fig. 4), Big Data applications have just recently started to be explored in brain stimulation. For example, structural and functional connectome studies have yielded new insights into the potential targets for stimulation, in the quest to enhance stimulation effectiveness. Although DTI has optimized the definition of targets for DBS and noninvasive stimulation technologies since mid-2000 [177–179], Big Data and advances in computational methods have enabled new venues for DTI to further improve stimulation, which have enhanced clinical results. For example, in 2017, Horn et al. utilized structural and functional connectivity data of open-source connectome databases (including healthy subjects connectome from the Brain Genomics Superstruct Project, the HCP, and PD connectome from the PPMI) to build a computational model to predict outcomes following subthalamic nucleus modulation with DBS in PD. As a result, Big Data allowed the identification of a distinct pattern of functional and structural connectivity, which independently accurately predicted DBS response. Additionally, the findings held external validity as connectivity profiles obtained from one cohort were able to predict clinical outcomes in a separate DBS center’s independent cohort. This work also demonstrated the prospective use of Big Data in Precision Medicine by illustrating how connectivity profiles can be utilized to predict individual patient outcomes [180]. For a more comprehensive review of application of functional connectome studies to DBS, the reader is referred to [142], where Wong et al. discuss application of structural and functional connectivity to phenotyping of patients undergoing DBS treatment and prediction of DBS treatment response. Big Data is also expected to augment current efforts in the pursuit of genetic markers to optimize DBS in PD (e.g., [148, 181, 182]).
Fig. 4.

High Performance Computing solutions for modeling brain stimulation dosing have been explored for well over a decade. The above figure is adapted from [183], where Sinusoidal Steady State Solutions of the electromagnetic fields during TMS and DBS were determined from MRI derived Finite Element Models based on frequency specific tissue electromagnetic properties of head and brain tissue. The sinusoidal steady state solutions were then transformed into the time domain to rebuild the transient solution for the stimulation dose in the targeted brain tissues. These solutions were then coupled with single cell conductance-based models of human motor neurons to explore the electrophysiological response to stimulation. Today, high resolution patient specific models are being developed (see below), implementing more complicated biophysical modeling (e.g., coupled electromechanical field models) and are being explored as part of large heterogenous data sets (e.g., clinical, imaging, and movement kinematic) to optimize/tune therapy
Compared to DBS, studies on NIBS have been sparser. However, the use of Big Data methodologies has facilitated the improvement and standardization of established TMS techniques (i.e., single and paired pulse), which had large inter-subject variability, by identifying factors that affect responses to this stimulation in a multicentric sample [184]. A similar paradigm was followed to characterize theta-burst stimulation [185]. Regarding disease, a large multisite TMS study (n = 1188), showed that resting state connectivity in limbic and frontostriatal networks can be used for neurophysiological subtype classification in depression. Moreover, individual connectivity evaluations predicted TMS therapy responsiveness better than isolated symptomatology in a subset of patients (n = 154) [17].
Proposed solutions
As reviewed above, Big Data has been improving the care of patients with neurological diseases in multiple ways. It has elevated the value of diverse and often incomplete data sources, enhanced data sharing and multicentric studies, streamlined multidisciplinary collaboration, and improved the understanding of neurological disease (diagnosis, prognosis, optimizing current treatment, and helping develop novel therapies). Nevertheless, existing methodologies suffer from several limitations, which have prevented the full realization of Big Data’s potential in Neuroscience and Neurology. Below, we discuss the limitations of current approaches and propose possible solutions.
Full exploitation of available resources
Many Neuroscience and Neurology purported “Big Data” studies do not fully implement the classic 3 V's (i.e., “Volume, Variety, and Velocity”) or 5 V’s (i.e., “Volume, Variety, Velocity, Veracity and Value”) and/or are characterized by the high heterogeneity in which the V’s can be interpreted. For example, in “Big Data” Neuroscience and Neurology studies, Volume sometimes refers to studies with hundreds of thousands of patients’ multidimensional datasets and other times to studies with 10's of patients’ unidimensional datasets. Value, a characteristic of Big Data typically defined in financial terms in other Big Data fields, is not usually considered in Big Data studies in Neuroscience and Neurology. In this paper, across studies and databases, we adopted a measure of clinical or preclinical Value where financial information was not given (see Tables 2–6 and Additional file 1: Tables S2–S6). Data Veracity is not standardized in Neuroscience or Neurology and thus, we focused our analysis on both typical data Veracity measures and potential experimental sources of error in the data sets from studies that we reviewed above. In terms of Variety, few clinical studies make use of large multimodal data sets and even fewer are acquired and processed at a rapid Velocity. Data Velocity information is sparsely reported throughout the literature, but its clear reporting would enable a better understanding and refinement of methodologies through the research community.
While these limitations may be simply labeled as semantics, we believe that these deficits often result in Big Data analytics being underexploited, which limits the potential impact of a study and possibly increases its cost. Thus, aligning studies in Neuroscience and Neurology to the V’s represents an opportunity to leverage the knowledge, technology, analytics, and principles established in fields that have been using Big Data more extensively, thereby improving the Big Data studies in Neurology and Neuroscience. Identifying whether a study is suitable for using Big Data approaches makes it easier to choose the best tools for the study and exploit the plethora of resources (databases, software, models, data management strategies) that are already available (part of which we have reviewed herein, see for example Tables 1–2 and Additional file 1: Tables S1, S2).
Tools for data harmonization
The overall lack of tools for data harmonization (particularly for multimodal datasets used in clinical research and care) is a significant issue of current Big Data studies. Creation of methods for sharing data and open-access databases has been a priority of Big Data initiatives since their inception. Data sharing is required by many funding agencies and scientific journals, and publicly available repositories have been established. While these repositories have become more common and organized (see Sect. “Existing Solutions”), there has been less emphasis on the development of tools for quality control, standardization of data acquisition, visualization, pre-processing, and analysis. With the proliferation of initiatives promoting data sharing and pooling of existing resources, the need for better tools in these areas is becoming increasingly urgent. Despite efforts made by the US Department of Health and Human Service to establish standardized libraries of outcome measures in various areas, such as Depression [186, 187], and by the NIH that has spearheaded Clinical Trials Network (CTN)-recommended Common Data Elements (CDEs) for use in RCTs and EHRs [188], more work is needed to ensure data harmonization across not only clinical endpoints but also across all data types that typically comprise Big Data in Neuroscience and Neurology. For example, in neuroimaging, quality control of acquired images is a long-standing problem. Traditionally, this is performed visually, but in Big Data sets, large volumes make this approach exceedingly expensive and impractical. Thus, methods for automatic quality control have become in high demand [189]. Quality control issues are compounded in collaborative datasets, where variability may stem from multiple sources. In multisite studies, a typical source of variability arises from the use of different MRI scanners (i.e., from different manufacturers, with different field strengths or hardware drifts [190, 191]). Variability can also arise from data pre-processing techniques and pipelines. For example, the pre-processing pipeline of MRI data involves a variety of steps (such as correcting field inhomogeneity and motion, segmentation, and registration) and continues to undergo refinement through algorithm development, ultimately affecting reproducibility/Veracity of study results. As an additional example, while working on data harmonization methods in genome-wide association studies Chen et. al. have noted similar problems where an “aggregation of controls from multiple sources is challenging due to batch effects, difficulty in identifying genotyping errors and the use of different genotyping platforms” [192].
Some progress towards harmonization of data and analysis procedures [193] has been enabled by the availability of free software packages that incorporate widely accepted sets of best practices, see, e.g., Statistical Parametric Mapping (SPM), FreeSurfer, FMRIB Software Library (FSL), Analysis of Functional NeuroImages (AFNI), or their combination (such as Fusion of Neuroimaging Processing (FuNP) [194]). In addition, open-access pre-processed datasets have been made available (see Table 2 and Additional file 1: Table S2); for example, the Preprocessed Connectome Project has been systematically pre-processing the data from the International Neuroimaging Data-sharing Initiative and 1000 Functional Connectomes Project [195, 196] or GWAS Central (Genome-wide association study Central) which “provides a centralized compilation of summary level findings from genetic association studies” [197]. As another example, EU-funded NeuGRID and neuGRID4You projects included a set of analysis tools and services for neuroimaging analysis [106]. Development of software like Combat (which was initially created to eliminate batch effects in genomic data [198] and subsequently adapted to handle DTI, cortical thickness measurements [199], and functional connectivity matrices [200]) can also help researchers harmonize data from various types of study, regardless of whether they are analyzing newly collected or retrospective data gathered with older standards. For more detailed discussions on efforts to address data harmonization challenges in neuroimaging, the reader is directed to the review papers of Li et al. [12], Pinto et al. [201], and Jovicich et al. [202]. In clinical studies using data different from neuroimaging (and/or biospecimen sources), standardization of clinical assessments and measures of outcome across multiple sites has also proven to be challenging. For example, as shown by the ENIGMA study group, multi-center addiction studies face notable methodological challenges due to the heterogeneity of measurements for substance consumption in the context of genomic studies [203].
Developing tools to harmonize datasets across different sources and data types (e.g., based on machine learning [191]) for Neurology-based clinical studies might allow researchers to exploit Big Data to their full potential. Tools for complex data visualization and interactive manipulation are also needed to allow researchers from different backgrounds to fully understand the significance of their data [204]. For studies that are in the design phase, identifying whether tools for data harmonization are available or developing such tools in an early phase of the study will allow researchers to enhance the Veracity, and ultimately the impact of the study, while cutting costs.
New technologies for augmented study design and patient data collection
Traditional clinical studies are associated with several recognized limitations. However, a few recent Big Data studies have shown potential in mitigating some of these limitations.
First, traditional clinical studies, particularly RCTs which serve as the standard in clinical trials, are often expensive and inefficient. The integration of Big Data, particularly in the form of diverse data types or multicenter trials, can further amplify these issues and lead to exponential increases in costs. Thus, there is a pressing need for tools that can optimize resources and contain expenses. Virtual trials are a promising but underutilized approach that can potentially enhance study design and address cost-related challenges. To achieve this, health economics methods could be used to compare different scenarios, such as recruitment strategies or inclusion criteria, and select the most effective one prior to initiating an actual clinical study. These methods can also assign quantitative values to data sets or methods [205]. For studies testing interventions, virtual experiments that use simulations can be performed. For example, in the area of brain stimulation, virtual DBS is being explored [206] to supplement existing study design. Similarly, for NIBS, our group and others are building biophysics-based models that can be used to personalize interventions [58].
Second, traditional clinical studies, including RCTs, often suffer from limited data and limited generalizability of conclusions. Collected data is often too limited to fully account for highly multidimensional and heterogenous neurological conditions. PD is an example of this, where patients’ clinical presentation, progression and response to different treatment strategies can vary significantly, even within a single day [153]. Limited external validity due to discrepancies between the study design (patient inclusion criteria) and real-world clinical scenarios, as well as limited generalizability of findings to different time points beyond those assessed during the study are other known limitations. Relaxing study criteria and increasing timepoints could provide more data, but often at the expense of increased patient burden and study cost. Mobile applications can potentially help overcome some of these limitations while offering other advantages. For example, by allowing a relatively close monitoring of patients mobile applications may help capture features of symptoms not easily observable during hospital visits. This richer dataset could be used to design algorithms for patient classification/phenotyping or medication tuning. However, data collected via mobile technology is often limited to questionnaires or by the type of data that can be collected with sensors that can be embedded in mobile/wearable devices (typically accelerometers in motor disorders studies). Leveraging Big Data in this context would require the development of technology to monitor patients outside the time and space constraints of a traditional clinical study/RCT (e.g., home, or other unstructured environments); such technology should be sufficiently inexpensive to be useful at scale, while still providing reliable and clinically valuable data. Other related approaches include additional nontraditional data sources, such as information gathered from Payer Databases, EHR, or social media particular to a disease and treatment to support conventional findings. For example, the FDA is poised to pursue Big Data approaches to continue to assess products through their life cycle to "fill knowledge gaps and inform FDA regulatory decision-making" [207].
Finally, clinical studies might be subject to bias due to important clinical information being missing. This is particularly true for studies that rely on databases for billing or claim purposes, part of which we have reviewed herein, as they use data which were not collected primarily for research (see Additional file 1: Tables S4–S6). A possible way to overcome this limitation is to more directly couple payer data with clinical data and correlating the results. This approach is still mostly theoretical: modern patient tracking systems like Epic are beginning to offer billing code data within the EHR, but the system was not designed for population-based analysis. Ideally, information such as payer data can be used for exploration purposes and results of the analysis can guide the design of more rigorous studies aimed at testing specific clinical hypotheses.
Tools for facilitating interdisciplinary research
As the use of Big Data continues to expand across various fields, there is a growing need for better tools that can facilitate collaborations among professionals with different backgrounds. A project that exemplifies this need is the American Heart Association (AHA) Precision Medicine Platform [208]. This platform aims to "realize precision cardiovascular and stroke medicine" by merging large, varying datasets and providing analytical tools and tutorials for clinicians and researchers. Despite the strong technological and community-based support of this platform, major challenges related to scalability, security, privacy, and ease of use have prevented it from being integrated into mainstream medicine, subsequently obstructing its full exploitation.
Creating tools to visualize and interactively manipulate multidimensional data (e.g., borrowing from fields such as virtual or augmented reality that already use these tools [209]) might help overcome this type of issue.
Future directions
We have identified current limitations in the application of Big Data to Neuroscience and Neurology and have proposed general solutions to overcome them. One area where the limitations in Big Data, as currently defined and implemented, could be addressed, and make a major impact is in the development of personalized therapies and Precision Medicine. In this field, the acceleration Big Data could enable has not yet occurred [210]. Unlike a traditional one-size-fits-all approach, Precision Medicine seeks to optimize patient care based on individual patient characteristics, including genetic makeup, environmental factors, and lifestyle. This approach can help in preventing, diagnosing, or treating diseases. Precision oncology has been a driver of Precision Medicine for approximately two decades [211] and exploited availability of big, multi-omics data to develop data-driven approaches to predict risk of developing a disease, help diagnosis, identify patient phenotypes, and identify new therapeutic targets. In Neurology, availability of large neuroimaging, connectivity, and genetics datasets has opened the possibility for data-driven approaches in Precision Medicine. However, these approaches have not yet been fully integrated with clinical decision making and personalized care. Diagnosis and treatment are still often guided by only clinical symptoms. Currently, there are no widely used platforms, systems, or projects that analytically combine personalized data, either to generate personalized treatment plans or assist physicians with diagnostics. However, the AHA Precision Medicine Platform [208] aims to address this gap by providing a means to supplement treatment plans with personalized analytics. Despite the strong technological and community-based support of this platform, integration of the software into mainstream medicine has been challenging, as discussed above (see SubSect. “Future Directions” in Sect. “Proposed Solutions").
As a potential way to acquire large real-time multimodal data sets for use in personalized care in the movement disorder, pain, and rehabilitation spaces we have been developing an Integrated Motion Analysis Suite (IMAS), which combines motion capture technology, inertial sensors (gyroscope/accelerometers), and force sensors to assess patient movement kinematics from multiple body joints as well as kinetics. The hardware system for movement kinematic and kinetic data capture is underpinned with an AI driven computational system with algorithms for data reduction, modeling, and prediction of clinical scales, prognostic potential for motor recovery (e.g., in the case of injury such as stroke), and response to treatment. Ultimately, the low-cost hardware package is coupled to computational packages to holistically aid clinicians in motor symptom assessments. The system is currently being investigated as part of a stroke study [212] and supporting other studies in the movement disorder [213] and Chronic Pain [214, 215] spaces. As for the Big Data component, the system has been designed for different data streams and systems to be networked and interconnected. As a result, data such as multiple patients’ kinematic/kinetic, imaging, EHR, payer database, and clinical data can be longitudinally assessed and analyzed to develop a continually improving model of patient disease progression. This approach also serves as a method to personalize and optimize therapy delivery and/or predict response to therapy (see below).
Our group is also developing a new form of NIBS, electrosonic stimulation (ESStim™) [138], and testing it in multiple areas (e.g., diabetic neuropathic pain [215], LBP, CTS pain [214], PD [138], and OUD [216]). While the RCTs that are being conducted for the device are based on classic safety and efficacy endpoints, several of our studies are also focused on developing models of stimulation efficacy through combined imaging data, clinical data, kinematic data, and/or patient specific biophysical models of stimulation dose at the targeted brain sites to identify best responders to therapy (e.g., in PD, OUD, and Pain). These computational models are being developed with the goal of not only identifying the best responders but as a future means to personalize therapy based on the unique characteristics of the individual patients [58] and multimodal disease models. It is further planned that the IMAS system, with its Big Data backbone, will be integrated with the ESStim™ system to further aid in personalizing patient stimulation dose in certain indications (e.g., PD, CTS pain).
Finally, our group is working on developing a trial optimization tool based on health economics modeling (e.g., Cost Effective Analysis (CEA)) [205, 217]. The software we are generating allows for a virtual trial design and the predicting of the cost effectiveness of the trial. We anticipate that the software could also be implemented to quantify data set values in health economic terms or used to quantify non-traditional data for use in RCT design or assessment (e.g., for the OUD patient population CEA methodologies could be used to quantify the impact of stigma on the patient, caregiver, or society with traditional (e.g., biospecimen) and non-traditional data sets (e.g., EHR, social media)). Ultimately, we see all these systems being combined into a personalized treatment suite, based on a Big Data infrastructure, whereby the multimodal data sets (e.g., imaging, biophysical field-tissue interaction models, clinical, and biospecimen data) are coupled rapidly to personalize brain stimulation-based treatments in diverse and expansive patient cohorts (see Fig. 5).
Fig. 5.

Schematic of our suite under development for delivering personalized treatments based on a Big Data infrastructure, whereby multimodal data sets (e.g., imaging, biophysical field-tissue interaction models, clinical, biospecimen data) can be coupled to deliver personalized brain stimulation-based treatments in a diverse and expansive patient cohort. Each integrated step can be computationally intensive (e.g., see Fig. 4 for simplified dosing example for exemplary electromagnetic brain stimulation devices)
Elaboration
The Section “Existing Solutions” has reviewed the influence of Big Data on Neuroscience and Neurology, specifically in the context of advancing treatments for neurological diseases. Our analysis spans the last few decades and includes a diverse selection of cutting-edge projects in Neuroscience and Neurology that illustrate the continuing shift towards a Big Data-driven paradigm; also, it reveals that certain areas of neurological treatment development have not fully embraced the potential of the Big Data revolution, as demonstrated through our comprehensive review of clinical literature in Sect. “Proposed Solutions”.
One sign of this gap is that there are differences between the definition of Big Data and the use the 3 V's or 5 V’s across studies that are considered “Big Data” studies in Neuroscience and Neurology literature. Several definitions can be found in the literature from these fields. For example, van den Heuvel et al. noted that the term “Big Data” includes many data types, such as “observational study data, large datasets, technology-generated outcomes (e.g., from wearable sensors), passively collected data, and machine-learning generated algorithms” [153]; Muller-Wirtz and Volk stated that “Big Data can be defined as Extremely large datasets to be analyzed computationally to reveal patterns, trends, and associations, especially relating to human behavior and interactions” [166]; and Eckardt et al. referred to Big Data science as the “application of mathematical techniques to large data sets to infer probabilities for prediction and find novel patterns to enable data driven decisions” [218]. Other definitions also include the techniques required for data analysis. For example, van den Heuvel et al. stated that “these information assets (characterized by high Volume, Velocity, and Variety) require specific technology and analytical methods for its transformation into Value” [153]; and according to Banik and Bandyopadhyay, the term “Big Data encompassed massive data sets having large, more varied, and complex structure with the difficulties of storing, analyzing, and visualizing for further processes or results” [219]. Thus, what constitutes Big Data in Neuroscience and Neurology is not established nor always aligned with the definition of Big Data outside of these fields.
In addition, in the fields of Neuroscience and Neurology, often some V’s are incompletely considered or even dismissed. At present, Neuroscience study data from “Big Data” studies are often just big and sometimes multimodal, and Neurology studies with "Big Data" are often characterized by small multimodal datasets. Incorporating all the V’s into studies might spur innovation. The area of research focused on OUD treatments is a particularly salient example. Adding “Volume” to OUD studies by integrating OUD patient databases, as it has been done for other diseases, could lead to better use of Big Data techniques and ultimately help understand the underlying disease and develop new treatments (e.g., see the work of Slade et. al. discussed above [122]). Similarly, adding “Velocity” to OUD studies by developing technology for increasing dataflow (e.g., integrating clinical data collected during hospital visits with home monitoring signals collected with mobile apps) might lead to using Big Data techniques for uncovering data patterns that could ultimately translate into development of new, personalized OUD treatments. In this vein, Variety in OUD studies could significantly add to the clinical toolbox of caregivers or researchers developing new technologies. For example, infovelliance of social media combined with machine learning algorithms, such as those developed for use during the COVID Pandemic [220], could be used to assess the stigma associated with potential treatment options for OUD patients, and quantify potential methods to lower patient treatment hesitancy. As for data Veracity, additional metrics of veracity could be garnered from clinical data sets to further assessment of the internal and external validity of trial results. For example, in OUD, Big Data sets could be used to assess the validity of self-reported opioid use, such as data gathered from drug diaries, in reference to other components of the Data Set (e.g., social media presence, sleep patterns, biospecimens, etc.). Finally, while we characterized Value herein as direct or indirect in terms of clinical utility, one could assign economic value to the Neuroscience and Neurology data sets through health economics methods. For example, in the OUD patient population, CEA or cost benefit analysis methodologies could be used to quantify the value of the data in health economics terms and guide policy makers in the design of studies or programs for aiding OUD treatment.
Finally, the rapid growth of Big Data in Neuroscience and Neurology has brought to the forefront ethical considerations that must be addressed [221, 222]. For example, a perennial concern is data security and how to best manage patient confidentiality [223]. In the US, current laws and regulations require that SUD treatment information be kept separate from patient’s EHR, which can limit Big Data approaches for improving OUD treatment [158]. The cost versus benefit of making the information more accessible poses ethical challenges as there are risks to trying to acquire such sensitive protected health information (PHI). As of November 28, 2022, the US Health and Human Services Department, through the Office for Civil Rights (OCR) and the Substance Abuse and Mental Health Services Administration (SAMHSA) put forth proposed modifications to rules and has requested public comments on the issue [224]. Ultimately, as the use of Big Data in the treatment of neurological patients progresses, such challenges will need to be addressed in a manner which provides the most benefit to the patient with minimal risks [225, 226].
Conclusion
This paper has provided a comprehensive analysis of how Big Data has influenced Neuroscience and Neurology, with an emphasis on the clinical treatment of a broad sample of neurological disorders. It has highlighted emerging trends, identified limitations of current approaches, and proposed possible methodologies to overcome these limitations. Such a comprehensive review can foster further innovation by enabling readers to identify unmet needs and fill them with a Mendeleyevization-based approach; to compare how different (but related) areas have been advancing and assess whether a solution from an area can be applied to another (Cross-disciplinarization); or to use Big Data to enhance traditional solutions to a problem (Implantation) [227]. This paper has also tackled the issue of the application of the classic 5 V’s or 3 V’s definitions of Big Data in Neuroscience and Neurology, an aspect that has been overlooked in previous literature. Review of the literature under this perspective has contributed to highlight the limitations of current Big Data studies which, as a result, rarely take advantage of AI methods typical of Big Data analytics. This can significantly impact treatment of neurological disorders, which are highly heterogeneous in both symptom presentation and etiology, and would benefit significantly from the application of these methods. At the same time, assessing the missing V’s of Big Data can provide the basis to improve study design. In light of our findings, we recommend that future research should focus on the following areas:
-
A)
Augment and standardize the way the 5 V’s are currently defined and implemented, since not all "Big Data" studies are truly "Big Data" studies.
-
B)
Encourage collaborative, multi-center studies: especially in clinical research, adding Volume might help overcome the limitations of classical RCTs (e.g., type II error).
-
C)
Leverage new technologies for real-time data collection: for diseases characterized by time-varying patterns of symptoms, higher data Velocity such as implemented in home monitoring or wearables might help personalize treatments and/or improve treatment effectiveness.
-
D)
Diversify data types collected in the clinic and/or home: as data Variety can help uncover patterns in patients subtypes or treatment responses.
-
E)
Enforce protocols for data harmonization to improve Veracity.
-
F)
Consider each V in terms of Value and identify ways to categorize and increase Value out of a study, since adding V’s might amplify study costs (and not all data is preclinically or clinically meaningful).
-
G)
Funding agencies should encourage initiatives aimed at educating junior and established scientists on the methods, tools, and resources that Big Data challenges require.
It often happens that when new methods/techniques/technologies are developed or simply get the attention of researchers in a field, that field changes trajectory. In Neuroscience and Neurology, the use of Big Data has been an evolving trend, as evident from our review of over 300 papers and 120 databases. We discussed how Big Data is altering the course of these fields by leveraging computational tools to develop innovative treatments for neurological diseases, a major global health concern. While our analysis has identified significant advancements made in the fields, we also note that the use of Big Data remains fragmented. Nevertheless, we view this as an opportunity for progress in these rapidly developing fields, which can ultimately benefit patients with improved diagnosis and treatment options.
Supplementary Information
Additional file 1: Table S1. Sample of national projects that spurred on the big data revolution. Table S2. Sample of neurology and neuroscience databases. Table S3. Sample of connectome studies and evolving big data use. Table S4. Sample of PD "Big Data" studies. Table S5. Sample of SUD and OUD "Big Data" studies. Table S6. Sample of pain "Big Data" studies.
Acknowledgements
Not applicable.
Abbreviations
- AI
Artificial Intelligence
- MS
Multiple Sclerosis
- US
United States
- NIH
National Institutes of Health
- 5 V’s
Volume, Variety, Velocity, Veracity, and Value
- AD
Alzheimer’s Disease
- PD
Parkinson’s Disease
- SUD
Substance Use Disorder
- Brain/MINDS
Brain Mapping by Integrated Neurotechnologies for Disease Studies
- HCP
Human Connectome Project
- MGH
Massachusetts General Hospital
- UCLA
University of California Los Angeles
- BAM
Brain Activity Map Project
- ADNI
Alzheimer’s Disease Neuroimaging Initiative
- ENIGMA
Enhancing Neuroimaging Genetics through Meta-Analysis
- EM
Electron Microscopy
- 2P
Two-photon Fluorescence Microscopy
- MRI
Magnetic Resonance Imaging
- DTI
Diffusion Tensor Imaging
- fMRI
Functional Magnetic Resonance Imaging
- rs-MR
Resting State Magnetic Resonance Imaging
- tfMRI
Task Functional Magnetic Resonance Imaging
- dMRI
Diffusion Magnetic Resonance Imaging
- MEG
Magnetoencephalography
- EEG
Electroencephalography
- PET
Positron Emission Technology
- CSF
Cerebrospinal Fluid
- MDD
Major Depressive Disorder
- TMS
Transcranial Magnetic Stimulation
- RCT
Randomized Controlled Trial
- IBD
Inflammatory Bowel Disease
- anti-TNF
Anti-Tumor Necrosis Factor
- ADHD
Attention Deficit Hyperactivity Disorder
- VK2
Vitamin K2
- FDA
Food and Drug Administration
- EHRs
Electronic Health Records
- HPC
High Performance Computing
- RWE
Real World Evidence
- DBS
Deep Brain Stimulation
- NIBS
Non-Invasive Brain Stimulation
- PPMI
Parkinson’s Progression Markers Initiative
- EU
European Union
- OUD
Opioid Use Disorder
- AUDIT
Alcohol Use Disorder Identification Test
- CTS
Carpal Tunnel Syndrome
- LBP
Lower Back Pain
- 3 V’s
Volume, Variety, and Velocity
- CTN
Clinical Trials Network
- CDE
Common Data Elements
- SPM
Statistical Parametric Mapping
- AFNI
Analysis of Functional NeuroImages
- FSL
FMRIB Software Library (FSL)
- FuNP
Fusion of Neuroimaging Processing
- GWAS
Genome-Wide Association Study
- NeuGRID
A grid-based e-Infrastructure for neuroimaging research
- AHA
American Heart Association
- IMAS
Integrated Motion Analysis Suite
- ESStim™
Electrosonic Stimulation
- CEA
Cost Effective Analysis
- PHI
Protected Health Information
- OCR
Office for Civil Rights
- SAMHSA
Substance Abuse and Mental Health Services Administration
- CH
Switzerland
- IL
Israel
- NO
Norway
- UK
United Kingdom
- KR
South Korea
- CA
Canada
- AU
Australia
- CN
China
- JP
Japan
- Vol
Volume
- H
Healthy
- P
Pathology
- HP
Healthy and Pathology
- CBP
Chronic Back Pain
- FM
Fibromyalgia
- IBS
Irritable Bowel Syndrome
- Vlvd
Vulvodynia
- ND
Neurodegenerative Disease
- CP
Cerebral Palsy
- Mo
Mouse
- Var
Variety
- CT
Computed Tomography
- SPECT
Single-Photon Emission Computerized Tomography
- SC
Second Capture
- SMA
Spinal Muscular Atrophy
- sMRI
Structural Magnetic Resonance Imaging
- ADRD
Alzheimer’s Disease and Related Dementias
- ECoG
Electro-Corticography
- MEG
Magnetoencephalography
- ERP
Event Related Potential
- iEEG
Intracranial Electroencephalography
- EMG
Electromyography
- CNS
Central Nervous System
- ASD
Autism Spectrum Disorder
- ASL
Arterial Spin Labeling
- ISH
In Situ Hybridization
- ICU
Intensive Care Unit
- NSF
National Science Foundation
- Vel
Velocity
- O
Ongoing
- F
Fixed Studies
- FUA
Fixed (Updates Anticipated)
- O/C
Open/Closed To Uploads
- Val
Value
- P
Pre-Clinical
- C
Clinical
- P&C
Pre-Clinical and Clinical
- MB
Mushroom Body
- A
Data verified through automated analytical process (AI, statistical methods)
- M
Manual Verification
- DML
Dependent on Methodological Limitations
- Ref
Reference
- ApD
Mobile App Realtime Dependent
- SM
Social Media Dependent
- hx
History
- HD
Hospital upload Dependent
- SCS
Spinal Cord Stimulation
- OA
Osteoarthritis
- IC
Interstitial Cystitis
- BPS
Bladder Pain Syndrome
- VAS
Visual Analog Scale
- NIA
National Institute of Aging
- NIDDK
National Institute of Diabetes and Digestive and Kidney Diseases
- NINDS
National Institute of Neurological Disorders and Stroke
- NIAMS
National Institute of Arthritis and Musculoskeletal and Skin Diseases
- NIDA
National Institute on Drug Abuse
Author contributions
LD crafted the idea for the manuscript and wrote the initial manuscript. TW, PGM, JR, LHZ, and CR contributed to multiple sections of the manuscript. RM contributed to ethics component. LD, TW, JR, PGM, LHZ, and RM helped compile and/or review the tabular material. TW, LHZ, and LD generated the graphics. All authors read and approved the final manuscript.
Funding
Work reported in this publication are or were supported in part by the National Institute of Health NIA (Award Number R44AG055360), NIDDK (Award Number DK117710), NINDS (Award Number 1R44NS110237, R43NS113737, and R01NS125307), NIAMS (Award Number 1R44AR076885), and NIDA (Award Number 4R44DA049685). The content is solely the responsibility of the authors and does not necessarily represent the official views of the National Institutes of Health.
Availability of data and materials
Data sharing is not applicable to this survey article as no primary research datasets were generated during the survey (further, all data survey material is included in the manuscript and/or Additional file 1).
Declarations
Ethics approval and consent to participate
Not applicable.
Consent for publication
Not applicable.
Competing interests
"TW and LD are officers at Highland Instruments, a medical device company. They have patents pending or issued, personally or as officers in the company, related to imaging, brain stimulation, diagnostics, modeling, and simulation."
Footnotes
Publisher's Note
Springer Nature remains neutral with regard to jurisdictional claims in published maps and institutional affiliations.
Change history
7/28/2023
The clean version of ESM has been updated.
References
- 1.Massachusetts Institute of Technology DoDC. Neurosciences Research Program Records, AC-0107, box X (Schmitt, Francis Otto). 1986 [Available from: https://archivesspace.mit.edu/repositories/2/resources/83].
- 2.Trappenberg TP. Fundamentals of Computational Neuroscience. United States: Oxford University Press; 2010. [Google Scholar]
- 3.Reed JL, Kaas JH. Statistical analysis of large-scale neuronal recording data. Neural Netw. 2010;23(6):673–684. doi: 10.1016/j.neunet.2010.04.005. [DOI] [PMC free article] [PubMed] [Google Scholar]
- 4.Ikegaya Y, Aaron G, Cossart R, Aronov D, Lampl I, Ferster D, et al. Synfire chains and cortical songs: temporal modules of cortical activity. Science. 2004;304(5670):559–564. doi: 10.1126/science.1093173. [DOI] [PubMed] [Google Scholar]
- 5.Chung JE, Sellers KK, Leonard MK, Gwilliams L, Xu D, Dougherty ME, et al. High-density single-unit human cortical recordings using the Neuropixels probe. Neuron. 2022;110(15):2409–2421. doi: 10.1016/j.neuron.2022.05.007. [DOI] [PubMed] [Google Scholar]
- 6.Pnevmatikakis EA, Soudry D, Gao Y, Machado TA, Merel J, Pfau D, et al. Simultaneous denoising, deconvolution, and demixing of calcium imaging data. Neuron. 2016;89(2):285–299. doi: 10.1016/j.neuron.2015.11.037. [DOI] [PMC free article] [PubMed] [Google Scholar]
- 7.Scheffer LK, Xu CS, Januszewski M, Lu Z, Takemura SY, Hayworth KJ, et al. A connectome and analysis of the adult Drosophila central brain. Elife. 2020 Sep 7;9:e57443. [DOI] [PMC free article] [PubMed]
- 8.Glasser MF, Sotiropoulos SN, Wilson JA, Coalson TS, Fischl B, Andersson JL, et al. The minimal preprocessing pipelines for the Human Connectome Project. Neuroimage. 2013;80:105–124. doi: 10.1016/j.neuroimage.2013.04.127. [DOI] [PMC free article] [PubMed] [Google Scholar]
- 9.Elam JS, Glasser MF, Harms MP, Sotiropoulos SN, Andersson JLR, Burgess GC, et al. The human connectome project: a retrospective. Neuroimage. 2021;244:118543. doi: 10.1016/j.neuroimage.2021.118543. [DOI] [PMC free article] [PubMed] [Google Scholar]
- 10.Kumar DR, Aslinia F, Yale SH, Mazza JJ. Jean-Martin charcot: the father of neurology. Clin Med Res. 2011;9(1):46–49. doi: 10.3121/cmr.2009.883. [DOI] [PMC free article] [PubMed] [Google Scholar]
- 11.Didi-Huberman G. Invention of Hysteria: Charcot and the Photographic Iconography of the Salpêtrière. Cambridge, MA: MIT Press; 2003. p. 373. [Google Scholar]
- 12.Li X, Guo N, Li Q. Functional neuroimaging in the New Era of Big Data. Genomics Proteomics Bioinform. 2019;17(4):393–401. doi: 10.1016/j.gpb.2018.11.005. [DOI] [PMC free article] [PubMed] [Google Scholar]
- 13.Bethlehem RAI, Seidlitz J, White SR, Vogel JW, Anderson KM, Adamson C, et al. Brain charts for the human lifespan. Nature. 2022;604(7906):525–533. doi: 10.1038/s41586-022-04554-y. [DOI] [PMC free article] [PubMed] [Google Scholar]
- 14.Veitch DP, Weiner MW, Aisen PS, Beckett LA, DeCarli C, Green RC, et al. Using the Alzheimer’s Disease neuroimaging initiative to improve early detection, diagnosis, and treatment of Alzheimer’s disease. Alzheimers Dement. 2022;18(4):824–857. doi: 10.1002/alz.12422. [DOI] [PMC free article] [PubMed] [Google Scholar]
- 15.Demro C, Mueller BA, Kent JS, Burton PC, Olman CA, Schallmo MP, et al. The psychosis human connectome project: an overview. Neuroimage. 2021;241:118439. doi: 10.1016/j.neuroimage.2021.118439. [DOI] [PMC free article] [PubMed] [Google Scholar]
- 16.Kim SJ, Marsch LA, Hancock JT, Das AK. Scaling Up research on drug abuse and addiction through social media Big Data. J Med Internet Res. 2017;19(10):e353. doi: 10.2196/jmir.6426. [DOI] [PMC free article] [PubMed] [Google Scholar]
- 17.Drysdale AT, Grosenick L, Downar J, Dunlop K, Mansouri F, Meng Y, et al. Resting-state connectivity biomarkers define neurophysiological subtypes of depression. Nat Med. 2017;23(1):28–38. doi: 10.1038/nm.4246. [DOI] [PMC free article] [PubMed] [Google Scholar]
- 18.Xia M, Liu J, Mechelli A, Sun X, Ma Q, Wang X, et al. Connectome gradient dysfunction in major depression and its association with gene expression profiles and treatment outcomes. Mol Psychiatry. 2022;27(3):1384–1393. doi: 10.1038/s41380-022-01519-5. [DOI] [PubMed] [Google Scholar]
- 19.Wheatley M. Google’s latest AI tools help doctors read medical records faster. 2020 [cited 2022]. Available from: https://siliconangle.com/2020/11/10/googles-latest-ai-tools-help-doctors-read-medical-records-faster/.
- 20.Nasralah T, El-Gayar O, Wang Y. Social media text mining framework for drug abuse: development and validation study with an opioid crisis case analysis. J Med Internet Res. 2020;22(8):e18350. doi: 10.2196/18350. [DOI] [PMC free article] [PubMed] [Google Scholar]
- 21.Elements of this image (Figure 1) and Figure 5 were developed from images sourced under Public Domain, Creative Commons, Wikimedia Commons, and/or GNU Free Documentation License from Public Domain, Wikipedia, Wikimedia Commons, and Freesvg.org sources.
- 22.Glickstein M. Golgi and Cajal: the neuron doctrine and the 100th anniversary of the 1906 Nobel Prize. Curr Biol. 2006;16(5):R147–R151. doi: 10.1016/j.cub.2006.02.053. [DOI] [PubMed] [Google Scholar]
- 23.Schwiening CJ. A brief historical perspective: Hodgkin and Huxley. J Physiol. 2012;590(11):2571–2575. doi: 10.1113/jphysiol.2012.230458. [DOI] [PMC free article] [PubMed] [Google Scholar]
- 24.McCulloch WS, Pitts W. A logical calculus of the ideas immanent in nervous activity. Bull Math Biol. 1990;52(1–2):99–115. doi: 10.1016/S0092-8240(05)80006-0. [DOI] [PubMed] [Google Scholar]
- 25.Fornito A, Zalesky A, Breakspear M. The connectomics of brain disorders. Nat Rev Neurosci. 2015;16(3):159–172. doi: 10.1038/nrn3901. [DOI] [PubMed] [Google Scholar]
- 26.Galenus. Galeni Opera Librorum Sexta Classis De Cucurbitulis, Scarificationibus, Hirudinibus, & Phlebotomia praecipuo artis remedio tradit. Iunta; 1586; 6.
- 27.Tremblay P, Dick AS. Broca and Wernicke are dead, or moving past the classic model of language neurobiology. Brain Lang. 2016;162:60–71. doi: 10.1016/j.bandl.2016.08.004. [DOI] [PubMed] [Google Scholar]
- 28.Hosny A, Parmar C, Quackenbush J, Schwartz LH, Aerts H. Artificial intelligence in radiology. Nat Rev Cancer. 2018;18(8):500–510. doi: 10.1038/s41568-018-0016-5. [DOI] [PMC free article] [PubMed] [Google Scholar]
- 29.Nadgir R, Yousem DM. Neuroradiology: The Requisites. 4. Amsterdam: Elsevier; 2016. [Google Scholar]
- 30.Van Essen DC, Ugurbil K. The future of the human connectome. Neuroimage. 2012;62(2):1299–1310. doi: 10.1016/j.neuroimage.2012.01.032. [DOI] [PMC free article] [PubMed] [Google Scholar]
- 31.Bota M, Dong HW, Swanson LW. From gene networks to brain networks. Nat Neurosci. 2003;6(8):795–799. doi: 10.1038/nn1096. [DOI] [PubMed] [Google Scholar]
- 32.Connectome Coordination Facility. Human Connectome Project: What is the Connectome Coordination Facility? 2011 [cited 2022]. Available from: https://www.humanconnectome.org.
- 33.Zheng Z, Lauritzen JS, Perlman E, Robinson CG, Nichols M, Milkie D, et al. A complete electron microscopy volume of the brain of adult drosophila melanogaster. Cell. 2018;174(3):730–743. doi: 10.1016/j.cell.2018.06.019. [DOI] [PMC free article] [PubMed] [Google Scholar]
- 34.Damasio H, Grabowski T, Frank R, Galaburda AM, Damasio AR. The return of phineas gage: clues about the brain from the skull of a famous patient. Science. 1994;264(5162):1102–1105. doi: 10.1126/science.8178168. [DOI] [PubMed] [Google Scholar]
- 35.Lewis J. Something hidden : a Biography of Wilder Penfield. 1st ed. Toronto, Ont. Garden City, N.Y.: Doubleday Canada; 1981. xiv, 311.
- 36.Wagner T, Valero-Cabre A, Pascual-Leone A. Noninvasive human brain stimulation. Annu Rev Biomed Eng. 2007 doi: 10.1146/annurev.bioeng.9.061206.133100. [DOI] [PubMed] [Google Scholar]
- 37.Thompson PM, Jahanshad N, Ching CRK, Salminen LE, Thomopoulos SI, Bright J, et al. ENIGMA and global neuroscience: a decade of large-scale studies of the brain in health and disease across more than 40 countries. Transl Psychiatry. 2020;10(1):100. doi: 10.1038/s41398-020-0705-1. [DOI] [PMC free article] [PubMed] [Google Scholar]
- 38.NIH. Hope Through Research [cited 2022]. https://www.ninds.nih.gov/health-information/patient-caregiver-education/hope-through-research.
- 39.Feigin VL. The evolution of neuroepidemiology: marking the 40-year anniversary of publishing studies on epidemiology of neurological disorders. Neuroepidemiology. 2022;56(1):2–3. doi: 10.1159/000521586. [DOI] [PubMed] [Google Scholar]
- 40.Fregnac Y. Big data and the industrialization of neuroscience: a safe roadmap for understanding the brain? Science. 2017;358(6362):470–477. doi: 10.1126/science.aan8866. [DOI] [PubMed] [Google Scholar]
- 41.Landhuis E. Neuroscience: Big brain, big data. Nature. 2017;541(7638):559–561. doi: 10.1038/541559a. [DOI] [PubMed] [Google Scholar]
- 42.Chen S, He Z, Han X, He X, Li R, Zhu H, et al. How Big Data and high-performance computing drive brain science. Genomics Proteomics Bioinform. 2019;17(4):381–392. doi: 10.1016/j.gpb.2019.09.003. [DOI] [PMC free article] [PubMed] [Google Scholar]
- 43.Van Horn JD. Bridging the brain and data sciences. Big Data. 2021;9(3):153–187. doi: 10.1089/big.2020.0065. [DOI] [PMC free article] [PubMed] [Google Scholar]
- 44.Bassett DS, Sporns O. Network neuroscience. Nat Neurosci. 2017;20(3):353–364. doi: 10.1038/nn.4502. [DOI] [PMC free article] [PubMed] [Google Scholar]
- 45.Liu Y, Luo Y, Naidech AM. Big Data in stroke: how to use big data to make the next management decision. Neurotherapeutics. 2023 doi: 10.1007/s13311-023-01358-4. [DOI] [PMC free article] [PubMed] [Google Scholar]
- 46.Helwegen K, Libedinsky I, van den Heuvel MP. Statistical power in network neuroscience. Trends Cogn Sci. 2023;27(3):282–301. doi: 10.1016/j.tics.2022.12.011. [DOI] [PubMed] [Google Scholar]
- 47.Tang Y, Chen D, Li X. Dimensionality reduction methods for brain imaging data analysis. ACM Comput Surveys. 2021;54(4):1–36. doi: 10.1145/3448302. [DOI] [Google Scholar]
- 48.Choudhury S, Fishman JR, McGowan ML, Juengst ET. Big data, open science and the brain: lessons learned from genomics. Front Hum Neurosci. 2014;8:239. doi: 10.3389/fnhum.2014.00239. [DOI] [PMC free article] [PubMed] [Google Scholar]
- 49.Ferguson AR, Nielson JL, Cragin MH, Bandrowski AE, Martone ME. Big data from small data: data-sharing in the ‘long tail’ of neuroscience. Nat Neurosci. 2014;17(11):1442–1447. doi: 10.1038/nn.3838. [DOI] [PMC free article] [PubMed] [Google Scholar]
- 50.The impact of the NIH BRAIN Initiative. Nat Methods. 2018;15(11):839. [DOI] [PubMed]
- 51.Rethinking the brain. Nature. 2015;519(7544):389. [DOI] [PubMed]
- 52.Mahfoud T. Visions of unification and integration: building brains and communities in the European human brain project. New Media Soc. 2021;23(2):322–343. doi: 10.1177/1461444820929576. [DOI] [Google Scholar]
- 53.Okano H, Sasaki E, Yamamori T, Iriki A, Shimogori T, Yamaguchi Y, et al. Brain/MINDS: a japanese national brain project for marmoset neuroscience. Neuron. 2016;92(3):582–590. doi: 10.1016/j.neuron.2016.10.018. [DOI] [PubMed] [Google Scholar]
- 54.Auger SD, Jacobs BM, Dobson R, Marshall CR, Noyce AJ. Big data, machine learning and artificial intelligence: a neurologist’s guide. Pract Neurol. 2020;21(1):4–11. doi: 10.1136/practneurol-2020-002688. [DOI] [PMC free article] [PubMed] [Google Scholar]
- 55.Vu MT, Adali T, Ba D, Buzsaki G, Carlson D, Heller K, et al. A shared vision for machine learning in neuroscience. J Neurosci. 2018;38(7):1601–1607. doi: 10.1523/JNEUROSCI.0508-17.2018. [DOI] [PMC free article] [PubMed] [Google Scholar]
- 56.Nenning KH, Langs G. Machine learning in neuroimaging: from research to clinical practice. Radiologie. 2022;62(Suppl 1):1–10. doi: 10.1007/s00117-022-01051-1. [DOI] [PMC free article] [PubMed] [Google Scholar]
- 57.Dinsdale NK, Bluemke E, Sundaresan V, Jenkinson M, Smith SM, Namburete AIL. Challenges for machine learning in clinical translation of big data imaging studies. Neuron. 2022;110(23):3866–3881. doi: 10.1016/j.neuron.2022.09.012. [DOI] [PubMed] [Google Scholar]
- 58.Dipietro L, Elkin-Frankston S, Ramos-Estebanez C, Wagner T. Supercomputing in the Study and Stimulation of the Brain. In: Milutinović V, Kotlar M, editors. Handbook of Research on Methodologies and Applications of Supercomputing. Pennsylvania: IGI Global; 2021. [Google Scholar]
- 59.Briscoe J, Marin O. Looking at neurodevelopment through a big data lens. Science. 2020 doi: 10.1126/science.aaz8627. [DOI] [PubMed] [Google Scholar]
- 60.Sporns O, Tononi G, Kotter R. The human connectome: a structural description of the human brain. PLoS Comput Biol. 2005;1(4):e42. doi: 10.1371/journal.pcbi.0010042. [DOI] [PMC free article] [PubMed] [Google Scholar]
- 61.Abbott A. How the world's biggest brain maps could transform neuroscience. Nature. 2021;598(7879):22–25. doi: 10.1038/d41586-021-02661-w. [DOI] [PubMed] [Google Scholar]
- 62.Sporns O. The human connectome: a complex network. Ann N Y Acad Sci. 2011;1224:109–125. doi: 10.1111/j.1749-6632.2010.05888.x. [DOI] [PubMed] [Google Scholar]
- 63.Connectome NP. Connectome. Proc Natl Acad Sci USA. 2013;110(15):5739. doi: 10.1073/pnas.1304921110. [DOI] [PMC free article] [PubMed] [Google Scholar]
- 64.Alivisatos AP, Chun M, Church GM, Greenspan RJ, Roukes ML, Yuste R. The brain activity map project and the challenge of functional connectomics. Neuron. 2012;74(6):970–974. doi: 10.1016/j.neuron.2012.06.006. [DOI] [PMC free article] [PubMed] [Google Scholar]
- 65.Alivisatos AP, Chun M, Church GM, Deisseroth K, Donoghue JP, Greenspan RJ, et al. Neuroscience. Brain Activity Map Sci. 2013;339(6125):1284–1285. doi: 10.1126/science.1236939. [DOI] [PMC free article] [PubMed] [Google Scholar]
- 66.White JG, Southgate E, Thomson JN, Brenner S. The structure of the nervous system of the nematode Caenorhabditis elegans. Philos Trans R Soc Lond B Biol Sci. 1986;314(1165):1–340. doi: 10.1098/rstb.1986.0056. [DOI] [PubMed] [Google Scholar]
- 67.Scannell JW, Blakemore C, Young MP. Analysis of connectivity in the cat cerebral cortex. J Neurosci. 1995;15(2):1463–1483. doi: 10.1523/JNEUROSCI.15-02-01463.1995. [DOI] [PMC free article] [PubMed] [Google Scholar]
- 68.Felleman DJ, Van Essen DC. Distributed hierarchical processing in the primate cerebral cortex. Cereb Cortex. 1991;1(1):1–47. doi: 10.1093/cercor/1.1.1. [DOI] [PubMed] [Google Scholar]
- 69.Young MP. Objective analysis of the topological organization of the primate cortical visual system. Nature. 1992;358(6382):152–155. doi: 10.1038/358152a0. [DOI] [PubMed] [Google Scholar]
- 70.Wanner AA, Friedrich RW. Whitening of odor representations by the wiring diagram of the olfactory bulb. Nat Neurosci. 2020;23(3):433–442. doi: 10.1038/s41593-019-0576-z. [DOI] [PMC free article] [PubMed] [Google Scholar]
- 71.Ohyama T, Schneider-Mizell CM, Fetter RD, Aleman JV, Franconville R, Rivera-Alba M, et al. A multilevel multimodal circuit enhances action selection in Drosophila. Nature. 2015;520(7549):633–639. doi: 10.1038/nature14297. [DOI] [PubMed] [Google Scholar]
- 72.van den Heuvel MP, Sporns O. Rich-club organization of the human connectome. J Neurosci. 2011;31(44):15775–15786. doi: 10.1523/JNEUROSCI.3539-11.2011. [DOI] [PMC free article] [PubMed] [Google Scholar]
- 73.Connectome Coordination Facility. HCP Lifespan Studies [cited 2022. Available from: https://www.humanconnectome.org/lifespan-studies].
- 74.Van Essen DC, Donahue CJ, Coalson TS, Kennedy H, Hayashi T, Glasser MF. Cerebral cortical folding, parcellation, and connectivity in humans, nonhuman primates, and mice. Proc Natl Acad Sci USA. 2019;116(52):26173–26180. doi: 10.1073/pnas.1902299116. [DOI] [PMC free article] [PubMed] [Google Scholar]
- 75.Mueller SG, Weiner MW, Thal LJ, Petersen RC, Jack C, Jagust W, et al. The Alzheimer’s disease neuroimaging initiative. Neuroimaging Clin N Am. 2005;15(4):869–877. doi: 10.1016/j.nic.2005.09.008. [DOI] [PMC free article] [PubMed] [Google Scholar]
- 76.Weiner MW, Aisen PS, Jack CR, Jr, Jagust WJ, Trojanowski JQ, Shaw L, et al. The Alzheimer’s disease neuroimaging initiative: progress report and future plans. Alzheimers Dement. 2010;6(3):202–211. doi: 10.1016/j.jalz.2010.03.007. [DOI] [PMC free article] [PubMed] [Google Scholar]
- 77.Alzheimer’s Disease Neuroimaging Initiative. About ADNI 2017 [cited 2022. Available from: https://adni.loni.usc.edu/about/].
- 78.Toga AW, Crawford KL. The Alzheimer’s disease neuroimaging initiative informatics core: a decade in review. Alzheimers Dement. 2015;11(7):832–839. doi: 10.1016/j.jalz.2015.04.004. [DOI] [PMC free article] [PubMed] [Google Scholar]
- 79.Weiner MW, Veitch DP. Introduction to special issue: overview of Alzheimer’s disease neuroimaging initiative. Alzheimers Dement. 2015;11(7):730–733. doi: 10.1016/j.jalz.2015.05.007. [DOI] [PMC free article] [PubMed] [Google Scholar]
- 80.Association As. Alzheimer’s Association Takes On Leadership Role In Landmark Alzheimer’s Biomarker Study—Known As ADNI4—To Convene Private Partner Scientific Board Chicago: Alzheimer’s Association 2022 https://www.alz.org/news/2022/alzheimers-association-takes-on-leadership-role-in [Accessed from 14 Oct 2022].
- 81.(NCIRE) NCIfRaE. Major study of Alzheimer’s disease to focus on including people from underrepresented communities 2022 https://www.ncire.org/research-news.
- 82.Thompson PM, Jahanshad N, Schmaal L, Turner JA, Winkler AM, Thomopoulos SI, et al. The enhancing neuroimaging genetics through meta-analysis consortium: 10 years of global collaborations in human brain mapping. Hum Brain Mapp. 2022;43(1):15–22. doi: 10.1002/hbm.25672. [DOI] [PMC free article] [PubMed] [Google Scholar]
- 83.Bearden CE, Thompson PM. Emerging global initiatives in neurogenetics: the enhancing neuroimaging genetics through meta-analysis (ENIGMA) consortium. Neuron. 2017;94(2):232–236. doi: 10.1016/j.neuron.2017.03.033. [DOI] [PMC free article] [PubMed] [Google Scholar]
- 84.Stein JL, Medland SE, Vasquez AA, Hibar DP, Senstad RE, Winkler AM, et al. Identification of common variants associated with human hippocampal and intracranial volumes. Nat Genet. 2012;44(5):552–561. doi: 10.1038/ng.2250. [DOI] [PMC free article] [PubMed] [Google Scholar]
- 85.Hibar DP, Adams HHH, Jahanshad N, Chauhan G, Stein JL, Hofer E, et al. Novel genetic loci associated with hippocampal volume. Nat Commun. 2017;8:13624. doi: 10.1038/ncomms13624. [DOI] [PMC free article] [PubMed] [Google Scholar]
- 86.Schmaal L, Hibar DP, Samann PG, Hall GB, Baune BT, Jahanshad N, et al. Cortical abnormalities in adults and adolescents with major depression based on brain scans from 20 cohorts worldwide in the ENIGMA major depressive disorder working group. Mol Psychiatry. 2017;22(6):900–909. doi: 10.1038/mp.2016.60. [DOI] [PMC free article] [PubMed] [Google Scholar]
- 87.Hibar DP, Westlye LT, Doan NT, Jahanshad N, Cheung JW, Ching CRK, et al. Cortical abnormalities in bipolar disorder: an MRI analysis of 6503 individuals from the ENIGMA bipolar disorder working group. Mol Psychiatry. 2018;23(4):932–942. doi: 10.1038/mp.2017.73. [DOI] [PMC free article] [PubMed] [Google Scholar]
- 88.Sun BB, Loomis SJ, Pizzagalli F, Shatokhina N, Painter JN, Foley CN, et al. Genetic map of regional sulcal morphology in the human brain from UK biobank data. Nat Commun. 2022;13(1):6071. doi: 10.1038/s41467-022-33829-1. [DOI] [PMC free article] [PubMed] [Google Scholar]
- 89.Zhao B, Luo T, Li T, Li Y, Zhang J, Shan Y, et al. Genome-wide association analysis of 19,629 individuals identifies variants influencing regional brain volumes and refines their genetic co-architecture with cognitive and mental health traits. Nat Genet. 2019;51(11):1637–1644. doi: 10.1038/s41588-019-0516-6. [DOI] [PMC free article] [PubMed] [Google Scholar]
- 90.Smith SM, Douaud G, Chen W, Hanayik T, Alfaro-Almagro F, Sharp K, et al. An expanded set of genome-wide association studies of brain imaging phenotypes in UK Biobank. Nat Neurosci. 2021;24(5):737–745. doi: 10.1038/s41593-021-00826-4. [DOI] [PMC free article] [PubMed] [Google Scholar]
- 91.Brainstorm C, Anttila V, Bulik-Sullivan B, Finucane HK, Walters RK, Bras J, et al. Analysis of shared heritability in common disorders of the brain. Science. 2018 doi: 10.1126/science.aap8757. [DOI] [PMC free article] [PubMed] [Google Scholar]
- 92.Cao M, Wang Z, He Y. Connectomics in psychiatric research: advances and applications. Neuropsychiatr Dis Treat. 2015;11:2801–2810. doi: 10.2147/NDT.S63470. [DOI] [PMC free article] [PubMed] [Google Scholar]
- 93.Bullmore E, Sporns O. Complex brain networks: graph theoretical analysis of structural and functional systems. Nat Rev Neurosci. 2009;10(3):186–198. doi: 10.1038/nrn2575. [DOI] [PubMed] [Google Scholar]
- 94.He Y, Evans A. Graph theoretical modeling of brain connectivity. Curr Opin Neurol. 2010;23(4):341–350. doi: 10.1097/WCO.0b013e32833aa567. [DOI] [PubMed] [Google Scholar]
- 95.Chong CD, Schwedt TJ, Hougaard A. Brain functional connectivity in headache disorders: a narrative review of MRI investigations. J Cereb Blood Flow Metab. 2019;39(4):650–669. doi: 10.1177/0271678X17740794. [DOI] [PMC free article] [PubMed] [Google Scholar]
- 96.Yang J, Gohel S, Vachha B. Current methods and new directions in resting state fMRI. Clin Imaging. 2020;65:47–53. doi: 10.1016/j.clinimag.2020.04.004. [DOI] [PMC free article] [PubMed] [Google Scholar]
- 97.Alyass A, Turcotte M, Meyre D. From big data analysis to personalized medicine for all: challenges and opportunities. BMC Med Genomics. 2015;8:33. doi: 10.1186/s12920-015-0108-y. [DOI] [PMC free article] [PubMed] [Google Scholar]
- 98.Lozano AM, Lipsman N. Probing and regulating dysfunctional circuits using deep brain stimulation. Neuron. 2013;77(3):406–424. doi: 10.1016/j.neuron.2013.01.020. [DOI] [PubMed] [Google Scholar]
- 99.Sun R, Sohrabpour A, Worrell GA, He B. Deep neural networks constrained by neural mass models improve electrophysiological source imaging of spatiotemporal brain dynamics. Proc Natl Acad Sci USA. 2022;119(31):e2201128119. doi: 10.1073/pnas.2201128119. [DOI] [PMC free article] [PubMed] [Google Scholar]
- 100.Xiao M, Li Q, Feng H, Zhang L, Chen Y. Neural vascular mechanism for the cerebral blood flow autoregulation after hemorrhagic stroke. Neural Plast. 2017;2017:5819514. doi: 10.1155/2017/5819514. [DOI] [PMC free article] [PubMed] [Google Scholar]
- 101.Field D, Ammouche Y, Peña J-M, Jérusalem A. Machine learning based multiscale calibration of mesoscopic constitutive models for composite materials: application to brain white matter. Comput Mech. 2021;67(6):1629–1643. doi: 10.1007/s00466-021-02009-1. [DOI] [Google Scholar]
- 102.Tamura H, Prokott KE, Fleming RW. Distinguishing mirror from glass: a “Big Data” approach to material perception. J Vis. 2022;22(4):4. doi: 10.1167/jov.22.4.4. [DOI] [PMC free article] [PubMed] [Google Scholar]
- 103.Tian Y-h, Chen X-l, Xiong H-k, Li H-l, Dai L-r, Chen J, et al. Towards human-like and transhuman perception in AI 2.0: a review. Front Informa Technol Elec Eng. 2017;18(1):58–67. doi: 10.1631/FITEE.1601804. [DOI] [Google Scholar]
- 104.Santuz A, Ekizos A, Janshen L, Mersmann F, Bohm S, Baltzopoulos V, et al. Modular control of human movement during running: an open access data set. Front Physiol. 2018;9:1509. doi: 10.3389/fphys.2018.01509. [DOI] [PMC free article] [PubMed] [Google Scholar]
- 105.Levey DF, Stein MB, Wendt FR, Pathak GA, Zhou H, Aslan M, et al. Bi-ancestral depression GWAS in the Million Veteran Program and meta-analysis in >1.2 million individuals highlight new therapeutic directions. Nat Neurosci. 2021;24(7):954–963. doi: 10.1038/s41593-021-00860-2. [DOI] [PMC free article] [PubMed] [Google Scholar]
- 106.Munir K, Ramón-Fernández Ad, Iqbal S, Javaid N. Neuroscience patient identification using big data and fuzzy logic–an Alzheimer’s disease case study. Expert Syst Appl. 2019;136:410–425. doi: 10.1016/j.eswa.2019.06.049. [DOI] [Google Scholar]
- 107.Eshaghi A, Young AL, Wijeratne PA, Prados F, Arnold DL, Narayanan S, et al. Identifying multiple sclerosis subtypes using unsupervised machine learning and MRI data. Nat Commun. 2021;12(1):2078. doi: 10.1038/s41467-021-22265-2. [DOI] [PMC free article] [PubMed] [Google Scholar]
- 108.Mitelpunkt A, Galili T, Kozlovski T, Bregman N, Shachar N, Markus-Kalish M, et al. Novel Alzheimer’s disease subtypes identified using a data and knowledge driven strategy. Sci Rep. 2020;10(1):1327. doi: 10.1038/s41598-020-57785-2. [DOI] [PMC free article] [PubMed] [Google Scholar]
- 109.Wu J, Gao Y, Malik V, Gao X, Shan R, Lv J, et al. Prevalence and risk factors of MRI-defined brain infarcts among Chinese adults. Front Neurol. 2022;13:967077. doi: 10.3389/fneur.2022.967077. [DOI] [PMC free article] [PubMed] [Google Scholar]
- 110.Ma C, Zhang W, Mao L, Zhang G, Shen Y, Chang H, et al. Hyperhomocysteinemia and intracranial aneurysm: a mendelian randomization study. Front Neurol. 2022;13:948989. doi: 10.3389/fneur.2022.948989. [DOI] [PMC free article] [PubMed] [Google Scholar]
- 111.Wu W, Zhang Y, Jiang J, Lucas MV, Fonzo GA, Rolle CE, et al. An electroencephalographic signature predicts antidepressant response in major depression. Nat Biotechnol. 2020;38(4):439–447. doi: 10.1038/s41587-019-0397-3. [DOI] [PMC free article] [PubMed] [Google Scholar]
- 112.Barbanti P, Egeo G, Aurilia C, Fiorentini G, Proietti S, Tomino C, et al. The first report of the Italian Migraine Registry (I-GRAINE) Neurol Sci. 2022;43(9):5725–5728. doi: 10.1007/s10072-022-06214-5. [DOI] [PubMed] [Google Scholar]
- 113.McCarthy A. The biomarker future is digital. Inside Prec Med. 2020 doi: 10.1089/clinomi.07.01.19. [DOI] [Google Scholar]
- 114.Kiral-Kornek I, Roy S, Nurse E, Mashford B, Karoly P, Carroll T, et al. Epileptic seizure prediction using big data and deep learning: toward a mobile system. EBioMedicine. 2018;27:103–111. doi: 10.1016/j.ebiom.2017.11.032. [DOI] [PMC free article] [PubMed] [Google Scholar]
- 115.Bot BM, Suver C, Neto EC, Kellen M, Klein A, Bare C, et al. The mPower study, Parkinson disease mobile data collected using ResearchKit. Sci Data. 2016;3:160011. doi: 10.1038/sdata.2016.11. [DOI] [PMC free article] [PubMed] [Google Scholar]
- 116.Prince J, Arora S, de Vos M. Big data in Parkinson’s disease: using smartphones to remotely detect longitudinal disease phenotypes. Physiol Meas. 2018;39(4):044005. doi: 10.1088/1361-6579/aab512. [DOI] [PubMed] [Google Scholar]
- 117.Mayo CS, Matuszak MM, Schipper MJ, Jolly S, Hayman JA, Ten Haken RK. Big Data in designing clinical trials: opportunities and challenges. Front Oncol. 2017;7:187. doi: 10.3389/fonc.2017.00187. [DOI] [PMC free article] [PubMed] [Google Scholar]
- 118.Sackett DL, Rosenberg WM, Gray JA, Haynes RB, Richardson WS. Evidence based medicine: what it is and what it isn't. BMJ. 1996;312(7023):71–72. doi: 10.1136/bmj.312.7023.71. [DOI] [PMC free article] [PubMed] [Google Scholar]
- 119.Hemphill JC., 3rd Pro: neurocritical care Big Data and AI: it’s about expertise. Neurocrit Care. 2022;37(Suppl 2):160–162. doi: 10.1007/s12028-021-01434-7. [DOI] [PubMed] [Google Scholar]
- 120.Peter I, Dubinsky M, Bressman S, Park A, Lu C, Chen N, et al. Anti-Tumor necrosis factor therapy and incidence of Parkinson disease among patients with inflammatory bowel disease. JAMA Neurol. 2018;75(8):939–946. doi: 10.1001/jamaneurol.2018.0605. [DOI] [PMC free article] [PubMed] [Google Scholar]
- 121.Olsen AL, Riise T, Scherzer CR. Discovering new benefits from old drugs with Big Data-promise for parkinson disease. JAMA Neurol. 2018;75(8):917–920. doi: 10.1001/jamaneurol.2018.0345. [DOI] [PubMed] [Google Scholar]
- 122.Slade E, Dwoskin LP, Zhang GQ, Talbert JC, Chen J, Freeman PR, et al. Integrating data science into the translational science research spectrum: a substance use disorder case study. J Clin Transl Sci. 2020;5(1):e29. doi: 10.1017/cts.2020.521. [DOI] [PMC free article] [PubMed] [Google Scholar]
- 123.Yu YX, Yu XD, Cheng QZ, Tang L, Shen MQ. The association of serum vitamin K2 levels with Parkinson's disease: from basic case-control study to big data mining analysis. Aging. 2020;12(16):16410–16419. doi: 10.18632/aging.103691. [DOI] [PMC free article] [PubMed] [Google Scholar]
- 124.FDA. Unleashing the Power of Data Washington D.C. [updated 9/6/22. Available from: https://www.fda.gov/science-research/focus-areas-regulatory-science-report/unleashing-power-data].
- 125.Mikailov M, Weizhe L, Petrick N, Guo Y, Xu L, Weaver J, et al. High Performance Computing Techniques for Big Data Processing: FDA; 2021 [cited 2022. Available from: https://www.fda.gov/science-research/fda-science-forum/high-performance-computing-techniques-big-data-processing].
- 126.Desai RJ, Matheny ME, Johnson K, Marsolo K, Curtis LH, Nelson JC, et al. Broadening the reach of the FDA Sentinel system: a roadmap for integrating electronic health record data in a causal analysis framework. NPJ Digit Med. 2021;4(1):170. doi: 10.1038/s41746-021-00542-0. [DOI] [PMC free article] [PubMed] [Google Scholar]
- 127.FDA. Sentinel Initative 2022 https://www.fda.gov/safety/fdas-sentinel-initiative.
- 128.Warby SC, Wendt SL, Welinder P, Munk EG, Carrillo O, Sorensen HB, et al. Sleep-spindle detection: crowdsourcing and evaluating performance of experts, non-experts and automated methods. Nat Methods. 2014;11(4):385–392. doi: 10.1038/nmeth.2855. [DOI] [PMC free article] [PubMed] [Google Scholar]
- 129.Doubal FN, Ali M, Batty GD, Charidimou A, Eriksdotter M, Hofmann-Apitius M, et al. Big data and data repurposing—using existing data to answer new questions in vascular dementia research. BMC Neurol. 2017;17(1):72. doi: 10.1186/s12883-017-0841-2. [DOI] [PMC free article] [PubMed] [Google Scholar]
- 130.Agoston DV, Langford D. Big Data in traumatic brain injury; promise and challenges. Concussion. 2017 doi: 10.2217/cnc-2016-0013. [DOI] [PMC free article] [PubMed] [Google Scholar]
- 131.Vrenken H, Jenkinson M, Pham DL, Guttmann CRG, Pareto D, Paardekooper M, et al. Opportunities for understanding MS mechanisms and progression with MRI using large-scale data sharing and artificial intelligence. Neurology. 2021;97(21):989–999. doi: 10.1212/WNL.0000000000012884. [DOI] [PMC free article] [PubMed] [Google Scholar]
- 132.Rodger JA. Discovery of medical Big Data analytics: improving the prediction of traumatic brain injury survival rates by data mining patient informatics processing software hybrid hadoop hive. Inform Med Unlocked. 2015 doi: 10.1016/j.imu.2016.01.002. [DOI] [Google Scholar]
- 133.Hamza TH, Chen H, Hill-Burns EM, Rhodes SL, Montimurro J, Kay DM, et al. Genome-wide gene-environment study identifies glutamate receptor gene GRIN2A as a Parkinson’s disease modifier gene via interaction with coffee. PLoS Genet. 2011;7(8):e1002237. doi: 10.1371/journal.pgen.1002237. [DOI] [PMC free article] [PubMed] [Google Scholar]
- 134.de Lau LM, Breteler MM. Epidemiology of Parkinson’s disease. Lancet Neurol. 2006;5(6):525–535. doi: 10.1016/S1474-4422(06)70471-9. [DOI] [PubMed] [Google Scholar]
- 135.Parkinson’s Foundation. Parkinson’s Foundation: Better Live’s Together Available from: https://www.parkinson.org.
- 136.Tysnes OB, Storstein A. Epidemiology of Parkinson’s disease. J Neural Transm. 2017;124(8):901–905. doi: 10.1007/s00702-017-1686-y. [DOI] [PubMed] [Google Scholar]
- 137.Fox SH, Katzenschlager R, Lim SY, Barton B, de Bie RMA, Seppi K, et al. International Parkinson and movement disorder society evidence-based medicine review: update on treatments for the motor symptoms of Parkinson’s disease. Mov Disord. 2018;33(8):1248–1266. doi: 10.1002/mds.27372. [DOI] [PubMed] [Google Scholar]
- 138.Wagner T, Dipietro L. Novel Methods of Transcranial Stimulation: Electrosonic Stimulation. In: Neuromodulation: Comprehensive Textbook of Principles, Technologies, and Therapies. Editors: Krames P, Peckham H, Rezai A. Elsevier; 2018. p. 1619–26.
- 139.LONI, MJ Fox Foundation. Parkinson’s Progression Markers Initiative Available from: https://www.ppmi-info.org/.
- 140.Dinov ID, Heavner B, Tang M, Glusman G, Chard K, Darcy M, et al. Predictive Big Data analytics: a study of Parkinson’s disease using large, complex, heterogeneous, incongruent, multi-source and incomplete observations. PLoS ONE. 2016;11(8):e0157077. doi: 10.1371/journal.pone.0157077. [DOI] [PMC free article] [PubMed] [Google Scholar]
- 141.Nalls MA, Pankratz N, Lill CM, Do CB, Hernandez DG, Saad M, et al. Large-scale meta-analysis of genome-wide association data identifies six new risk loci for Parkinson’s disease. Nat Genet. 2014;46(9):989–993. doi: 10.1038/ng.3043. [DOI] [PMC free article] [PubMed] [Google Scholar]
- 142.Wong JK, Middlebrooks EH, Grewal SS, Almeida L, Hess CW, Okun MS. A Comprehensive review of brain connectomics and imaging to improve deep brain stimulation outcomes. Mov Disord. 2020;35(5):741–751. doi: 10.1002/mds.28045. [DOI] [PMC free article] [PubMed] [Google Scholar]
- 143.Hansen C, Sanchez-Ferro A, Maetzler W. How mobile health technology and electronic health records will change care of patients with Parkinson’s disease. J Parkinsons Dis. 2018;8(s1):S41–S45. doi: 10.3233/JPD-181498. [DOI] [PMC free article] [PubMed] [Google Scholar]
- 144.Burton A. Smartphones versus Parkinson’s disease: i-PROGNOSIS. Lancet Neurol. 2020;19(5):385–386. doi: 10.1016/S1474-4422(20)30115-0. [DOI] [PubMed] [Google Scholar]
- 145.Zhao M, Yang CC. Drug repositioning to accelerate drug development using social media data: computational study on parkinson disease. J Med Internet Res. 2018;20(10):e271. doi: 10.2196/jmir.9646. [DOI] [PMC free article] [PubMed] [Google Scholar]
- 146.Kuusimaki T, Sainio J, Kurki S, Vahlberg T, Kaasinen V. Prediagnostic expressions in health records predict mortality in Parkinson’s disease: a proof-of-concept study. Parkinsonism Relat Disord. 2022;95:35–39. doi: 10.1016/j.parkreldis.2021.12.015. [DOI] [PubMed] [Google Scholar]
- 147.Harrison PJ, Luciano S. Incidence of Parkinson's disease, dementia, cerebrovascular disease and stroke in bipolar disorder compared to other psychiatric disorders: an electronic health records network study of 66 million people. Bipolar Disord. 2021;23(5):454–462. doi: 10.1111/bdi.13022. [DOI] [PubMed] [Google Scholar]
- 148.Chen W, Kirkby L, Kotzev M, Song P, Gilron R, Pepin B. The role of large-scale data infrastructure in developing next-generation deep brain stimulation therapies. Front Hum Neurosci. 2021;15:717401. doi: 10.3389/fnhum.2021.717401. [DOI] [PMC free article] [PubMed] [Google Scholar]
- 149.Wardell K, Nordin T, Vogel D, Zsigmond P, Westin CF, Hariz M, et al. Deep Brain stimulation: emerging tools for simulation, data analysis, and visualization. Front Neurosci. 2022;16:834026. doi: 10.3389/fnins.2022.834026. [DOI] [PMC free article] [PubMed] [Google Scholar]
- 150.Hallett M, de Haan W, Deco G, Dengler R, Di Iorio R, Gallea C, et al. Human brain connectivity: Clinical applications for clinical neurophysiology. Clin Neurophysiol. 2020;131(7):1621–1651. doi: 10.1016/j.clinph.2020.03.031. [DOI] [PubMed] [Google Scholar]
- 151.Tinaz S. Functional connectome in Parkinson’s disease and Parkinsonism. Curr Neurol Neurosci Rep. 2021;21(6):24. doi: 10.1007/s11910-021-01111-4. [DOI] [PMC free article] [PubMed] [Google Scholar]
- 152.Buckley C, Alcock L, McArdle R, Rehman RZU, Del Din S, Mazza C, et al. The role of movement analysis in diagnosing and monitoring neurodegenerative conditions: insights from gait and postural control. Brain Sci. 2019 doi: 10.3390/brainsci9020034. [DOI] [PMC free article] [PubMed] [Google Scholar]
- 153.van den Heuvel L, Dorsey RR, Prainsack B, Post B, Stiggelbout AM, Meinders MJ, et al. Quadruple decision making for Parkinson’s disease patients: combining expert opinion, patient preferences, scientific evidence, and Big Data approaches to reach precision medicine. J Parkinsons Dis. 2020;10(1):223–231. doi: 10.3233/JPD-191712. [DOI] [PMC free article] [PubMed] [Google Scholar]
- 154.Shen B, Lin Y, Bi C, Zhou S, Bai Z, Zheng G, et al. Translational informatics for parkinson's disease: from big biomedical data to small actionable alterations. Genomics Proteomics Bioinform. 2019;17(4):415–429. doi: 10.1016/j.gpb.2018.10.007. [DOI] [PMC free article] [PubMed] [Google Scholar]
- 155.NIDA. Overdose Death Rates 2022 https://nida.nih.gov/research-topics/trends-statistics/overdose-death-rates.
- 156.Luo F, Li M, Florence C. State-Level economic costs of opioid use disorder and fatal opioid overdose—United States, 2017. Morb Mortal Weekly Rep (MMWR). 2021;70(15):541–546. doi: 10.15585/mmwr.mm7015a1. [DOI] [PMC free article] [PubMed] [Google Scholar]
- 157.Volkow ND, Jones EB, Einstein EB, Wargo EM. Prevention and treatment of opioid misuse and addiction: a review. JAMA Psychiat. 2019;76(2):208–216. doi: 10.1001/jamapsychiatry.2018.3126. [DOI] [PubMed] [Google Scholar]
- 158.Hayes CJ, Cucciare MA, Martin BC, Hudson TJ, Bush K, Lo-Ciganic W, et al. Using data science to improve outcomes for persons with opioid use disorder. Subst Abus. 2022;43(1):956–963. doi: 10.1080/08897077.2022.2060446. [DOI] [PMC free article] [PubMed] [Google Scholar]
- 159.Mackey S, Allgaier N, Chaarani B, Spechler P, Orr C, Bunn J, et al. Mega-Analysis of gray matter volume in substance dependence: general and substance-specific regional effects. Am J Psychiatry. 2019;176(2):119–128. doi: 10.1176/appi.ajp.2018.17040415. [DOI] [PMC free article] [PubMed] [Google Scholar]
- 160.Sanchez-Roige S, Palmer AA, Fontanillas P, Elson SL, Adams MJ, et al. Genome-wide association study meta-analysis of the alcohol use disorders identification test (AUDIT) in two population-based cohorts. Am J Psychiatry. 2019;176(2):107–118. doi: 10.1176/appi.ajp.2018.18040369. [DOI] [PMC free article] [PubMed] [Google Scholar]
- 161.Cuomo RE, Cai M, Shah N, Li J, Chen WH, Obradovich N, et al. Characterising communities impacted by the 2015 Indiana HIV outbreak: a Big Data analysis of social media messages associated with HIV and substance abuse. Drug Alcohol Rev. 2020;39(7):908–913. doi: 10.1111/dar.13091. [DOI] [PMC free article] [PubMed] [Google Scholar]
- 162.Goldberg DS, McGee SJ. Pain as a global public health priority. BMC Public Health. 2011;11:770. doi: 10.1186/1471-2458-11-770. [DOI] [PMC free article] [PubMed] [Google Scholar]
- 163.Yong RJ, Mullins PM, Bhattacharyya N. Prevalence of chronic pain among adults in the United States. Pain. 2022;163(2):e328–e332. doi: 10.1097/j.pain.0000000000002291. [DOI] [PubMed] [Google Scholar]
- 164.Nijs J, Malfliet A, Ickmans K, Baert I, Meeus M. Treatment of central sensitization in patients with ‘unexplained’ chronic pain: an update. Expert Opin Pharmacother. 2014;15(12):1671–1683. doi: 10.1517/14656566.2014.925446. [DOI] [PubMed] [Google Scholar]
- 165.Zaslansky R, Rothaug J, Chapman CR, Backstrom R, Brill S, Fletcher D, et al. PAIN OUT: the making of an international acute pain registry. Eur J Pain. 2015;19(4):490–502. doi: 10.1002/ejp.571. [DOI] [PubMed] [Google Scholar]
- 166.Muller-Wirtz LM, Volk T. Big Data in studying acute pain and regional anesthesia. J Clin Med. 2021 doi: 10.3390/jcm10071425. [DOI] [PMC free article] [PubMed] [Google Scholar]
- 167.Mukasa D, Sung J. A prediction model of low back pain risk: a population based cohort study in Korea. Korean J Pain. 2020;33(2):153–165. doi: 10.3344/kjp.2020.33.2.153. [DOI] [PMC free article] [PubMed] [Google Scholar]
- 168.Lotsch J, Lippmann C, Kringel D, Ultsch A. Integrated computational analysis of genes associated with human hereditary insensitivity to pain a drug repurposing perspective. Front Mol Neurosci. 2017 doi: 10.3389/fnmol.2017.00252/full. [DOI] [PMC free article] [PubMed] [Google Scholar]
- 169.Ultsch A, Kringel D, Kalso E, Mogil JS, Lotsch J. A data science approach to candidate gene selection of pain regarded as a process of learning and neural plasticity. Pain. 2016;157(12):2747–2757. doi: 10.1097/j.pain.0000000000000694. [DOI] [PubMed] [Google Scholar]
- 170.Wu J, Zhang J, Xu T, Pan Y, Cui B, Wei W, et al. The necessity or not of the addition of fusion to decompression for lumbar degenerative spondylolisthesis patients: a PRISMA compliant meta-analysis. Medicine. 2021;100(14):e24775. doi: 10.1097/MD.0000000000024775. [DOI] [PMC free article] [PubMed] [Google Scholar]
- 171.Lin Z, He L. Intra-Articular injection of PRP in the treatment of knee osteoarthritis using Big Data. J Healthc Eng. 2021;2021:4504155. doi: 10.1155/2021/4504155. [DOI] [PMC free article] [PubMed] [Google Scholar] [Retracted]
- 172.Rossi-deVries J, Pedoia V, Samaan MA, Ferguson AR, Souza RB, Majumdar S. Using multidimensional topological data analysis to identify traits of hip osteoarthritis. J Magn Reson Imaging. 2018;48(4):1046–1058. doi: 10.1002/jmri.26029. [DOI] [PMC free article] [PubMed] [Google Scholar]
- 173.Perlmutter JS, Mink JW. Deep brain stimulation. Annu Rev Neurosci. 2006 doi: 10.1146/annurev.neuro.29.051605.112824. [DOI] [PMC free article] [PubMed] [Google Scholar]
- 174.Tehovnik EJ. Electrical stimulation of neural tissue to evoke behavioral responses. J Neurosci Methods. 1996;65(1):1–17. doi: 10.1016/0165-0270(95)00131-X. [DOI] [PubMed] [Google Scholar]
- 175.Yeomans JS. Principles of Brain Stimulation. London: Oxford University Press; 1990. p. 182. [Google Scholar]
- 176.McIntyre CC, Mori S, Sherman DL, Thakor NV, Vitek JL. Electric field and stimulating influence generated by deep brain stimulation of the subthalamic nucleus. Clin Neurophysiol. 2004;115(3):589–595. doi: 10.1016/j.clinph.2003.10.033. [DOI] [PubMed] [Google Scholar]
- 177.Wagner T, Zahn M, Wedeen VJ, Grodzinsky A, Pascual-Leone A. Transcranial Magnetic Stimulation: High Resolution Tracking of the Induced Current Density in the Individual Human Brain. 12th Annual Meeting of Human Brain mapping; 2006; Florence, Italy: OHBM.
- 178.Sillery E, Bittar RG, Robson MD, Behrens TE, Stein J, Aziz TZ, et al. Connectivity of the human periventricular-periaqueductal gray region. J Neurosurg. 2005;103(6):1030–1034. doi: 10.3171/jns.2005.103.6.1030. [DOI] [PubMed] [Google Scholar]
- 179.Riva-Posse P, Choi KS, Holtzheimer PE, McIntyre CC, Gross RE, Chaturvedi A, et al. Defining critical white matter pathways mediating successful subcallosal cingulate deep brain stimulation for treatment-resistant depression. Biol Psychiatry. 2014;76(12):963–969. doi: 10.1016/j.biopsych.2014.03.029. [DOI] [PMC free article] [PubMed] [Google Scholar]
- 180.Horn A, Reich M, Vorwerk J, Li N, Wenzel G, Fang Q, et al. Connectivity predicts deep brain stimulation outcome in Parkinson disease. Ann Neurol. 2017;82(1):67–78. doi: 10.1002/ana.24974. [DOI] [PMC free article] [PubMed] [Google Scholar]
- 181.Weiss D, Landoulsi Z, May P, Sharma M, Schupbach M, You H, et al. Genetic stratification of motor and QoL outcomes in Parkinson’s disease in the EARLYSTIM study. Parkinsonism Relat Disord. 2022;103:169–174. doi: 10.1016/j.parkreldis.2022.08.025. [DOI] [PubMed] [Google Scholar]
- 182.Artusi CA, Dwivedi AK, Romagnolo A, Pal G, Kauffman M, Mata I, et al. Association of subthalamic deep brain stimulation with motor, functional, and pharmacologic outcomes in patients with monogenic Parkinson disease: a systematic review and meta-analysis. JAMA Netw Open. 2019;2(2):e187800. doi: 10.1001/jamanetworkopen.2018.7800. [DOI] [PMC free article] [PubMed] [Google Scholar]
- 183.Wagner T, Eden U, Rushmore J, Russo CJ, Dipietro L, Fregni F, et al. Impact of brain tissue filtering on neurostimulation fields: a modeling study. Neuroimage. 2014;85(Pt 3):1048–1057. doi: 10.1016/j.neuroimage.2013.06.079. [DOI] [PMC free article] [PubMed] [Google Scholar]
- 184.Corp DT, Bereznicki HGK, Clark GM, Youssef GJ, Fried PJ, Jannati A, et al. Large-scale analysis of interindividual variability in single and paired-pulse TMS data. Clin Neurophysiol. 2021;132(10):2639–2653. doi: 10.1016/j.clinph.2021.06.014. [DOI] [PubMed] [Google Scholar]
- 185.Corp DT, Bereznicki HGK, Clark GM, Youssef GJ, Fried PJ, Jannati A, et al. Large-scale analysis of interindividual variability in theta-burst stimulation data: results from the ‘Big TMS Data Collaboration’. Brain Stimul. 2020;13(5):1476–1488. doi: 10.1016/j.brs.2020.07.018. [DOI] [PMC free article] [PubMed] [Google Scholar]
- 186.Quality AfHRa. Development of Harmonized Outcome Measures for Use in Patient Registries and Clinical Practice: Methods and Lessons Learned. U.S. Department of Health and Human Services; 2020 2020. [PubMed]
- 187.ASPE. Harmonization of Clinical Data Element Definitions for Outcome Measures in Registries https://aspe.hhs.gov/harmonization-clinical-data-element-definitions-outcome-measures-registries.
- 188.NIH. Data Harmonization Projects 2014 https://nida.nih.gov/research/research-data-measures-resources/data-harmonization-projects.
- 189.Esteban O, Birman D, Schaer M, Koyejo OO, Poldrack RA, Gorgolewski KJ. MRIQC: Advancing the automatic prediction of image quality in MRI from unseen sites. PLoS ONE. 2017;12(9):e0184661. doi: 10.1371/journal.pone.0184661. [DOI] [PMC free article] [PubMed] [Google Scholar]
- 190.Takao H, Hayashi N, Ohtomo K. Effect of scanner in longitudinal studies of brain volume changes. J Magn Reson Imaging. 2011;34(2):438–444. doi: 10.1002/jmri.22636. [DOI] [PubMed] [Google Scholar]
- 191.Monte-Rubio GC, Segura B, Strafella AP, van Eimeren T, Ibarretxe-Bilbao N, Diez-Cirarda M, et al. Parameters from site classification to harmonize MRI clinical studies: application to a multi-site Parkinson’s disease dataset. Hum Brain Mapp. 2022;43(10):3130–3142. doi: 10.1002/hbm.25838. [DOI] [PMC free article] [PubMed] [Google Scholar]
- 192.Chen D, Tashman K, Palmer DS, Neale B, Roeder K, Bloemendal A, et al. A data harmonization pipeline to leverage external controls and boost power in GWAS. Hum Mol Genet. 2022;31(3):481–489. doi: 10.1093/hmg/ddab261. [DOI] [PMC free article] [PubMed] [Google Scholar]
- 193.Gliklich RE, Leavy MB, Dreyer NA, editors. Tools and Technologies for Registry Interoperability, Registries for Evaluating Patient Outcomes: A User’s Guide, 3rd Edition, Addendum 2 (https://www.ncbi.nlm.nih.gov/books/NBK551879/). AHRQ Methods for Effective Health Care. Rockville (MD) 2019. [PubMed]
- 194.Park BY, Byeon K, Park H. FuNP (Fusion of Neuroimaging Preprocessing) pipelines: a fully automated preprocessing software for functional magnetic resonance imaging. Front Neuroinform. 2019;13:5. doi: 10.3389/fninf.2019.00005. [DOI] [PMC free article] [PubMed] [Google Scholar]
- 195.Biswal BB, Mennes M, Zuo XN, Gohel S, Kelly C, Smith SM, et al. Toward discovery science of human brain function. Proc Natl Acad Sci USA. 2010;107(10):4734–4739. doi: 10.1073/pnas.0911855107. [DOI] [PMC free article] [PubMed] [Google Scholar]
- 196.Mennes M, Biswal BB, Castellanos FX, Milham MP. Making data sharing work: the FCP/INDI experience. Neuroimage. 2013;82:683–691. doi: 10.1016/j.neuroimage.2012.10.064. [DOI] [PMC free article] [PubMed] [Google Scholar]
- 197.GWAS. GWAS Central [cited 2022. Available from: https://www.gwascentral.org].
- 198.Johnson WE, Li C, Rabinovic A. Adjusting batch effects in microarray expression data using empirical Bayes methods. Biostatistics. 2007;8(1):118–127. doi: 10.1093/biostatistics/kxj037. [DOI] [PubMed] [Google Scholar]
- 199.Fortin JP, Cullen N, Sheline YI, Taylor WD, Aselcioglu I, Cook PA, et al. Harmonization of cortical thickness measurements across scanners and sites. Neuroimage. 2018;167:104–120. doi: 10.1016/j.neuroimage.2017.11.024. [DOI] [PMC free article] [PubMed] [Google Scholar]
- 200.Yu M, Linn KA, Cook PA, Phillips ML, McInnis M, Fava M, et al. Statistical harmonization corrects site effects in functional connectivity measurements from multi-site fMRI data. Hum Brain Mapp. 2018;39(11):4213–4227. doi: 10.1002/hbm.24241. [DOI] [PMC free article] [PubMed] [Google Scholar]
- 201.Pinto MS, Paolella R, Billiet T, Van Dyck P, Guns PJ, Jeurissen B, et al. Harmonization of brain diffusion MRI: concepts and methods. Front Neurosci. 2020;14:396. doi: 10.3389/fnins.2020.00396. [DOI] [PMC free article] [PubMed] [Google Scholar]
- 202.Jovicich J, Barkhof F, Babiloni C, Herholz K, Mulert C, van Berckel BNM, et al. Harmonization of neuroimaging biomarkers for neurodegenerative diseases: a survey in the imaging community of perceived barriers and suggested actions. Alzheimers Dement. 2019;11:69–73. doi: 10.1016/j.dadm.2018.11.005. [DOI] [PMC free article] [PubMed] [Google Scholar]
- 203.Mackey S, Kan KJ, Chaarani B, Alia-Klein N, Batalla A, Brooks S, et al. Genetic imaging consortium for addiction medicine: from neuroimaging to genes. Prog Brain Res. 2016;224:203–223. doi: 10.1016/bs.pbr.2015.07.026. [DOI] [PMC free article] [PubMed] [Google Scholar]
- 204.Dash S, Shakyawar SK, Sharma M, Kaushik S. Big data in healthcare: management, analysis and future prospects. J Big Data. 2019;6(1):54. doi: 10.1186/s40537-019-0217-0. [DOI] [Google Scholar]
- 205.Rafferty H, Rocha E, Gonzalez-Mego P, Ramos CL, El-Hagrassy MM, Gunduz ME, et al. Cost-Effectiveness analysis to inform randomized controlled trial design in chronic pain research: methods for guiding decisions on the addition of a run-in period. Princ Pract Clin Res. 2022;8(2):31–42. doi: 10.21801/ppcrj.2022.82.5. [DOI] [PMC free article] [PubMed] [Google Scholar]
- 206.Meier JM, Perdikis D, Blickensdorfer A, Stefanovski L, Liu Q, Maith O, et al. Virtual deep brain stimulation: multiscale co-simulation of a spiking basal ganglia model and a whole-brain mean-field model with The Virtual Brain. Exp Neurol. 2022;354:114111. doi: 10.1016/j.expneurol.2022.114111. [DOI] [PubMed] [Google Scholar]
- 207.FDA. Unleashing the Power of Data Washington D.C. [updated 9/6/22. Available from: https://www.fda.gov/science-research/focus-areas-regulatory-science-report/unleashing-power-data].
- 208.Kass-Hout TA, Stevens LM, Hall JL. American heart association precision medicine platform. Circulation. 2018;137(7):647–649. doi: 10.1161/CIRCULATIONAHA.117.032041. [DOI] [PMC free article] [PubMed] [Google Scholar]
- 209.Olshannikova E, Ometov A, Koucheryavy Y, Olsson T. Visualizing Big Data with augmented and virtual reality: challenges and research agenda. Journal of Big Data. 2015;2(1):22. doi: 10.1186/s40537-015-0031-2. [DOI] [Google Scholar]
- 210.Collins FS, Varmus H. A new initiative on precision medicine. N Engl J Med. 2015;372(9):793–795. doi: 10.1056/NEJMp1500523. [DOI] [PMC free article] [PubMed] [Google Scholar]
- 211.Subbiah V, Kurzrock R. Debunking the delusion that precision oncology is an illusion. Oncologist. 2017;22(8):881–882. doi: 10.1634/theoncologist.2017-0040. [DOI] [PMC free article] [PubMed] [Google Scholar]
- 212.Clinicaltrials.gov. IMAS Optimization and Applicability in an Acute Stroke Setting 2022 [cited 2022. Available from: https://clinicaltrials.gov/ct2/show/NCT05469438].
- 213.Clinicaltrials.gov. Parkinson's Disease: Enhancing Physical Therapy With Brain Stimulation for Treating Postural Instability 2022 [cited 2022. Available from: https://clinicaltrials.gov/ct2/show/NCT03981055].
- 214.Clinicaltrials.gov. Noninvasive Brain Stimulation for Treating Carpal Tunnel Syndrome 2022 [cited 2022. Available from: https://clinicaltrials.gov/ct2/show/NCT04206215].
- 215.Sukpornchairak P, Shah Aka Khandelwal K, Hayek S, Connor C, Gonzalez-Mego P, Chitturu G, et al. Non-Invasive Brain Stimulation For Diabetic Neuropathic Pain. American Academy of Neurology Annual Meeting; 2022; Seattle.
- 216.Clinicaltrials.gov. Optimization of NIBS for Treatment of Addiction 2022 [cited 2022. Available from: https://clinicaltrials.gov/ct2/show/NCT04379115.]
- 217.Wagner T, Ramos-Estebanez C, Hayek S, Parran T, Sukpornchairak P, Gonzalez-Mego P, et al. Noninvasive Brain Stimulation for Treating Chronic Pain and Addiction. Third Annual NIH HEAL Initiative Investigator Meeting; 2022 4/11/2022; Virtual NIH Conference.
- 218.Eckardt P, Bailey D, DeVon HA, Dougherty C, Ginex P, Krause-Parello CA, et al. Opioid use disorder research and the council for the advancement of nursing science priority areas. Nurs Outlook. 2020;68(4):406–416. doi: 10.1016/j.outlook.2020.02.001. [DOI] [PMC free article] [PubMed] [Google Scholar]
- 219.Banik A, Bandyopadhyay SK. Big-Data—a review on analysing 3Vs. J Sci Eng Res. 2016;3(1):21–24. [Google Scholar]
- 220.Mackey T, Purushothaman V, Li J, Shah N, Nali M, Bardier C, et al. Machine learning to detect self-reporting of symptoms, testing access, and recovery associated With COVID-19 on Twitter: retrospective big data infoveillance study. JMIR Public Health Surveill. 2020;6(2):e19509. doi: 10.2196/19509. [DOI] [PMC free article] [PubMed] [Google Scholar]
- 221.Ramos KM, Grady C, Greely HT, Chiong W, Eberwine J, Farahany NA, et al. The NIH BRAIN initiative: integrating neuroethics and neuroscience. Neuron. 2019;101(3):394–398. doi: 10.1016/j.neuron.2019.01.024. [DOI] [PubMed] [Google Scholar]
- 222.Ienca M, Ferretti A, Hurst S, Puhan M, Lovis C, Vayena E. Considerations for ethics review of big data health research: a scoping review. PLoS ONE. 2018;13(10):e0204937. doi: 10.1371/journal.pone.0204937. [DOI] [PMC free article] [PubMed] [Google Scholar]
- 223.Ferretti A, Ienca M, Sheehan M, Blasimme A, Dove ES, Farsides B, et al. Ethics review of big data research: what should stay and what should be reformed? BMC Med Ethics. 2021;22(1):51. doi: 10.1186/s12910-021-00616-4. [DOI] [PMC free article] [PubMed] [Google Scholar]
- 224.HHS Proposes New Protections to Increase Care Coordination and Confidentiality for Patients With Substance Use Challenges [press release]. November 28, 2022 2022.
- 225.Emerging Issues Task Force INS Neuroethics at 15: the current and future environment for neuroethics. AJOB Neurosci. 2019;10(3):104–110. doi: 10.1080/21507740.2019.1632958. [DOI] [PubMed] [Google Scholar]
- 226.Fothergill BT, Knight W, Stahl BC, Ulnicane I. Responsible data governance of neuroscience Big Data. Front Neuroinform. 2019;13:28. doi: 10.3389/fninf.2019.00028. [DOI] [PMC free article] [PubMed] [Google Scholar]
- 227.Blagojević V, Bojić D, Bojović M, Cvetanović M, Đorđević J, Đurđević Đ, et al. Chapter One—A Systematic Approach to Generation of New Ideas for PhD Research in Computing. In: Hurson AR, Milutinović V, et al., editors. Advances in Computers. Amsterdam: Elsevier; 2017. [Google Scholar]
- 228.Mueller SG, Weiner MW, Thal LJ, Petersen RC, Jack CR, Jagust W, et al. Ways toward an early diagnosis in Alzheimer’s disease: the Alzheimer’s disease Neuroimaging Initiative (ADNI) Alzheimers Dement. 2005;1(1):55–66. doi: 10.1016/j.jalz.2005.06.003. [DOI] [PMC free article] [PubMed] [Google Scholar]
- 229.Markram H. The blue brain project. Nat Rev Neurosci. 2006;7(2):153–160. doi: 10.1038/nrn1848. [DOI] [PubMed] [Google Scholar]
- 230.Glasser MF, Smith SM, Marcus DS, Andersson JL, Auerbach EJ, Behrens TE, et al. The human connectome project’s neuroimaging approach. Nat Neurosci. 2016;19(9):1175–1187. doi: 10.1038/nn.4361. [DOI] [PMC free article] [PubMed] [Google Scholar]
- 231.Van Essen DC, Smith SM, Barch DM, Behrens TE, Yacoub E, Ugurbil K, et al. The WU-Minn Human Connectome Project: an overview. Neuroimage. 2013;80:62–79. doi: 10.1016/j.neuroimage.2013.05.041. [DOI] [PMC free article] [PubMed] [Google Scholar]
- 232.Van Essen DC, Ugurbil K, Auerbach E, Barch D, Behrens TE, Bucholz R, et al. The human connectome project: a data acquisition perspective. Neuroimage. 2012;62(4):2222–2231. doi: 10.1016/j.neuroimage.2012.02.018. [DOI] [PMC free article] [PubMed] [Google Scholar]
- 233.Jabalpurwala I. Brain Canada: one brain one community. Neuron. 2016;92(3):601–606. doi: 10.1016/j.neuron.2016.10.049. [DOI] [PubMed] [Google Scholar]
- 234.Insel TR, Landis SC, Collins FS. Research priorities. NIH BRAIN Initiative Sci. 2013;340(6133):687–688. doi: 10.1126/science.1239276. [DOI] [PMC free article] [PubMed] [Google Scholar]
- 235.Normile D. China’s big brain project is finally gathering steam. Science. 2022;377(6613):1368–1369. doi: 10.1126/science.ade9806. [DOI] [PubMed] [Google Scholar]
- 236.Jeong SJ, Lee H, Hur EM, Choe Y, Koo JW, Rah JC, et al. Korea brain initiative: integration and control of brain functions. Neuron. 2016;92(3):607–611. doi: 10.1016/j.neuron.2016.10.055. [DOI] [PubMed] [Google Scholar]
- 237.Richards LR, Michie PT, Badcock DR, Bartlett PF, Bekkers JM, Bourne JA, Castles A, Egan GF, Fornito A, Hannan AJ, Hickie IB, Mattingley JB, Schofield PR. Australian Brain Alliance. Neuron. 2016;92(3):597–600. doi: 10.1016/j.neuron.2016.10.038. [DOI] [PubMed] [Google Scholar]
- 238.Menard C, Siddiqui TJ, Sargin D, Lawson A, De Koninck Y, Illes J. The canadian brain research strategy: a focus on early career researchers. Can J Neurol Sci. 2022;49(2):168–170. doi: 10.1017/cjn.2021.81. [DOI] [PubMed] [Google Scholar]
- 239.The LN. The international brain initiative: collaboration in progress. Lancet Neurol. 2021;20(12):969. doi: 10.1016/S1474-4422(21)00384-7. [DOI] [PubMed] [Google Scholar]
- 240.Ngai J. BRAIN 2.0: transforming neuroscience. Cell. 2022;185(1):4–8. doi: 10.1016/j.cell.2021.11.037. [DOI] [PubMed] [Google Scholar]
- 241.Appukuttan S, Bologna LL, Schurmann F, Migliore M, Davison AP. EBRAINS Live papers—interactive resource sheets for computational studies in neuroscience. Neuroinformatics. 2022 doi: 10.1007/s12021-022-09598-z. [DOI] [PMC free article] [PubMed] [Google Scholar]
- 242.Young MP. The organization of neural systems in the primate cerebral cortex. Proc Biol Sci. 1993;252(1333):13–18. doi: 10.1098/rspb.1993.0040. [DOI] [PubMed] [Google Scholar]
- 243.Stephan KE, Kamper L, Bozkurt A, Burns GA, Young MP, Kotter R. Advanced database methodology for the collation of connectivity data on the macaque brain (CoCoMac) Philos Trans R Soc Lond B Biol Sci. 2001;356(1412):1159–1186. doi: 10.1098/rstb.2001.0908. [DOI] [PMC free article] [PubMed] [Google Scholar]
- 244.Bota M, Dong HW, Swanson LW. Combining collation and annotation efforts toward completion of the rat and mouse connectomes in BAMS. Front Neuroinform. 2012;6:2. doi: 10.3389/fninf.2012.00002. [DOI] [PMC free article] [PubMed] [Google Scholar]
- 245.Modha DS, Singh R. Network architecture of the long-distance pathways in the macaque brain. Proc Natl Acad Sci USA. 2010;107(30):13485–13490. doi: 10.1073/pnas.1008054107. [DOI] [PMC free article] [PubMed] [Google Scholar]
- 246.Bock DD, Lee WC, Kerlin AM, Andermann ML, Hood G, Wetzel AW, et al. Network anatomy and in vivo physiology of visual cortical neurons. Nature. 2011;471(7337):177–182. doi: 10.1038/nature09802. [DOI] [PMC free article] [PubMed] [Google Scholar]
- 247.Briggman KL, Helmstaedter M, Denk W. Wiring specificity in the direction-selectivity circuit of the retina. Nature. 2011;471(7337):183–188. doi: 10.1038/nature09818. [DOI] [PubMed] [Google Scholar]
- 248.Harriger L, van den Heuvel MP, Sporns O. Rich club organization of macaque cerebral cortex and its role in network communication. PLoS ONE. 2012;7(9):e46497. doi: 10.1371/journal.pone.0046497. [DOI] [PMC free article] [PubMed] [Google Scholar]
- 249.Jarrell TA, Wang Y, Bloniarz AE, Brittin CA, Xu M, Thomson JN, et al. The connectome of a decision-making neural network. Science. 2012;337(6093):437–444. doi: 10.1126/science.1221762. [DOI] [PubMed] [Google Scholar]
- 250.Takemura SY, Bharioke A, Lu Z, Nern A, Vitaladevuni S, Rivlin PK, et al. A visual motion detection circuit suggested by Drosophila connectomics. Nature. 2013;500(7461):175–181. doi: 10.1038/nature12450. [DOI] [PMC free article] [PubMed] [Google Scholar]
- 251.Markov NT, Ercsey-Ravasz MM, Ribeiro Gomes AR, Lamy C, Magrou L, Vezoli J, et al. A weighted and directed interareal connectivity matrix for macaque cerebral cortex. Cereb Cortex. 2014;24(1):17–36. doi: 10.1093/cercor/bhs270. [DOI] [PMC free article] [PubMed] [Google Scholar]
- 252.Ingalhalikar M, Smith A, Parker D, Satterthwaite TD, Elliott MA, Ruparel K, et al. Sex differences in the structural connectome of the human brain. Proc Natl Acad Sci USA. 2014;111(2):823–828. doi: 10.1073/pnas.1316909110. [DOI] [PMC free article] [PubMed] [Google Scholar]
- 253.Deligianni F, Centeno M, Carmichael DW, Clayden JD. Relating resting-state fMRI and EEG whole-brain connectomes across frequency bands. Front Neurosci. 2014;8:258. doi: 10.3389/fnins.2014.00258. [DOI] [PMC free article] [PubMed] [Google Scholar]
- 254.Bota M, Sporns O, Swanson LW. Architecture of the cerebral cortical association connectome underlying cognition. Proc Natl Acad Sci USA. 2015;112(16):E2093–E2101. doi: 10.1073/pnas.1504394112. [DOI] [PMC free article] [PubMed] [Google Scholar]
- 255.Ryan K, Lu Z, Meinertzhagen IA. The CNS connectome of a tadpole larva of Ciona intestinalis (L.) highlights sidedness in the brain of a chordate sibling. Elife. 2016 doi: 10.7554/eLife.16962. [DOI] [PMC free article] [PubMed] [Google Scholar]
- 256.Hildebrand DGC, Cicconet M, Torres RM, Choi W, Quan TM, Moon J, et al. Whole-brain serial-section electron microscopy in larval zebrafish. Nature. 2017;545(7654):345–349. doi: 10.1038/nature22356. [DOI] [PMC free article] [PubMed] [Google Scholar]
- 257.Vishwanathan A, Daie K, Ramirez AD, Lichtman JW, Aksay ERF, Seung HS. Electron microscopic reconstruction of functionally identified cells in a neural integrator. Curr Biol. 2017;27(14):2137–2147. doi: 10.1016/j.cub.2017.06.028. [DOI] [PMC free article] [PubMed] [Google Scholar]
- 258.Ardesch DJ, Scholtens LH, Li L, Preuss TM, Rilling JK, van den Heuvel MP. Evolutionary expansion of connectivity between multimodal association areas in the human brain compared with chimpanzees. Proc Natl Acad Sci USA. 2019;116(14):7101–7106. doi: 10.1073/pnas.1818512116. [DOI] [PMC free article] [PubMed] [Google Scholar]
- 259.Ashaber M, Tomina Y, Kassraian P, Bushong EA, Kristan WB, Ellisman MH, et al. Anatomy and activity patterns in a multifunctional motor neuron and its surrounding circuits. Elife. 2021 doi: 10.7554/eLife.61881. [DOI] [PMC free article] [PubMed] [Google Scholar]
- 260.Scholl B, Thomas CI, Ryan MA, Kamasawa N, Fitzpatrick D. Cortical response selectivity derives from strength in numbers of synapses. Nature. 2021;590(7844):111–114. doi: 10.1038/s41586-020-03044-3. [DOI] [PMC free article] [PubMed] [Google Scholar]
- 261.Brittin CA, Cook SJ, Hall DH, Emmons SW, Cohen N. A multi-scale brain map derived from whole-brain volumetric reconstructions. Nature. 2021;591(7848):105–110. doi: 10.1038/s41586-021-03284-x. [DOI] [PMC free article] [PubMed] [Google Scholar]
- 262.Sorrentino P, Seguin C, Rucco R, Liparoti M, Troisi Lopez E, Bonavita S, et al. The structural connectome constrains fast brain dynamics. Elife. 2021 doi: 10.7554/eLife.67400. [DOI] [PMC free article] [PubMed] [Google Scholar]
- 263.Scholl B, Tepohl C, Ryan MA, Thomas CI, Kamasawa N, Fitzpatrick D. A binocular synaptic network supports interocular response alignment in visual cortical neurons. Neuron. 2022;110(9):1573–1584. doi: 10.1016/j.neuron.2022.01.023. [DOI] [PMC free article] [PubMed] [Google Scholar]
- 264.Chen Z, Zhang R, Huo H, Liu P, Zhang C, Feng T. Functional connectome of human cerebellum. Neuroimage. 2022;251:119015. doi: 10.1016/j.neuroimage.2022.119015. [DOI] [PubMed] [Google Scholar]
- 265.Rosenthal LS, Drake D, Alcalay RN, Babcock D, Bowman FD, Chen-Plotkin A, et al. The NINDS Parkinson’s disease biomarkers program. Mov Disord. 2016;31(6):915–923. doi: 10.1002/mds.26438. [DOI] [PMC free article] [PubMed] [Google Scholar]
- 266.Ofori E, Du G, Babcock D, Huang X, Vaillancourt DE. Parkinson’s disease biomarkers program brain imaging repository. Neuroimage. 2016;124(Pt B):1120–1124. doi: 10.1016/j.neuroimage.2015.05.005. [DOI] [PMC free article] [PubMed] [Google Scholar]
- 267.https://pdbp.ninds.nih.gov/.
- 268.Cohen S, Bataille LR, Martig AK. Enabling breakthroughs in Parkinson’s disease with wearable technologies and big data analytics. Mhealth. 2016;2:20. doi: 10.21037/mhealth.2016.04.02. [DOI] [PMC free article] [PubMed] [Google Scholar]
- 269.https://www.age-platform.eu/project/i-prognosis.
- 270.Hadjidimitriou S, Charisis V, Kyritsis K, Konstantinidis E, Delopoulos, A, Bamidis P, Bostantjopoulou S, Rizos A, Trivedi D, Chaudhuri R, Klingelhoefer L, Reichmann H, Wadoux J, De Craecker N, Karayiannis F, Fagerberg P, Ioakeimidis I, Stadtschnitzer M, Esser A, Grammalidis N, Dimitropoulos K, Dias SB, Diniz JA, da Silva HP, Lyberopoulos G, Theodoropoulou E, Hadjileontiadis LJ. Active and healthy ageing for Parkinson’s disease patients’ support: a user’s perspective within the i-PROGNOSIS framework. 1st International Conference on Technology and Innovation in Sports, Health and Wellbeing (TISHW). 2016. p. 1–8.
- 271.Hadjidimitriou SI, Charisis D, Hadjileontiadis LJ. On Capturing Older Adults’ Smartphone Keyboard Interaction as a Means for Behavioral Change Under Emotional Stimuli Within i-PROGNOSIS Framework. In: Antona M, Stephanidis C, editors. Universal Access in Human-Computer Interaction Design and Development Approaches and Methods. Cham: Springer International Publishing; 2017. [Google Scholar]
- 272.European Commission. Intelligent Parkinson eaRly detectiOn Guiding NOvel Supportive InterventionS [cited 2022. Available from: https://cordis.europa.eu/project/id/690494].
- 273.Suo X, Lei D, Li N, Cheng L, Chen F, Wang M, et al. Functional brain connectome and its relation to hoehn and yahr stage in Parkinson disease. Radiology. 2017;285(3):904–913. doi: 10.1148/radiol.2017162929. [DOI] [PubMed] [Google Scholar]
- 274.SenthilarumugamVeilukandammal MN, S.; Ganapathysubramanian, B.; Anantharam, V.; Kanthasamy, A.; Willette, A.A., editor Big Data and Parkinson’s Disease: exploration, analyses, and data challenges. Proceedings of the 51st Hawaii International Conference on System Sciences; 2018.
- 275.Sreenivasan K, Mishra V, Bird C, Zhuang X, Yang Z, Cordes D, et al. Altered functional network topology correlates with clinical measures in very early-stage, drug-naive Parkinson’s disease. Parkinsonism Relat Disord. 2019;62:3–9. doi: 10.1016/j.parkreldis.2019.02.001. [DOI] [PMC free article] [PubMed] [Google Scholar]
- 276.Wu C, Nagel SJ, Agarwal R, Potter-Nerger M, Hamel W, Sharan AD, et al. Reduced risk of reoperations with modern deep brain stimulator systems: big data analysis from a united states claims database. Front Neurol. 2021;12:785280. doi: 10.3389/fneur.2021.785280. [DOI] [PMC free article] [PubMed] [Google Scholar]
- 277.Zhang H, Meng F, Li X, Ning Y, Cai M. Social listening—revealing Parkinson’s disease over day and night. BMC Neurol. 2021;21(1):2. doi: 10.1186/s12883-020-02024-4. [DOI] [PMC free article] [PubMed] [Google Scholar]
- 278.De Micco R, Agosta F, Basaia S, Siciliano M, Cividini C, Tedeschi G, et al. Functional connectomics and disease progression in drug-naive Parkinson’s disease patients. Mov Disord. 2021;36(7):1603–1616. doi: 10.1002/mds.28541. [DOI] [PubMed] [Google Scholar]
- 279.Loh A, Boutet A, Germann J, Al-Fatly B, Elias GJB, Neudorfer C, et al. A functional connectome of Parkinson’s disease patients prior to deep brain stimulation: a tool for disease-specific connectivity analyses. Front Neurosci. 2022;16:804125. doi: 10.3389/fnins.2022.804125. [DOI] [PMC free article] [PubMed] [Google Scholar]
- 280.Kohno M, Okita K, Morales AM, Robertson CL, Dean AC, Ghahremani DG, et al. Midbrain functional connectivity and ventral striatal dopamine D2-type receptors: link to impulsivity in methamphetamine users. Mol Psychiatry. 2016;21(11):1554–1560. doi: 10.1038/mp.2015.223. [DOI] [PMC free article] [PubMed] [Google Scholar]
- 281.Ipser JC, Uhlmann A, Taylor P, Harvey BH, Wilson D, Stein DJ. Distinct intrinsic functional brain network abnormalities in methamphetamine-dependent patients with and without a history of psychosis. Addict Biol. 2018;23(1):347–358. doi: 10.1111/adb.12478. [DOI] [PubMed] [Google Scholar]
- 282.Lisdahl KM, Sher KJ, Conway KP, Gonzalez R, Feldstein Ewing SW, Nixon SJ, et al. Adolescent brain cognitive development (ABCD) study: Overview of substance use assessment methods. Dev Cogn Neurosci. 2018;32:80–96. doi: 10.1016/j.dcn.2018.02.007. [DOI] [PMC free article] [PubMed] [Google Scholar]
- 283.NIMH. ABCD Data Repository: NIMH; [2022]. Available from: https://nda.nih.gov/abcd/.
- 284.Sun Y, Zhang Y, Zhang D, Chang S, Jing R, Yue W, et al. GABRA2 rs279858-linked variants are associated with disrupted structural connectome of reward circuits in heroin abusers. Transl Psychiatry. 2018;8(1):138. doi: 10.1038/s41398-018-0180-0. [DOI] [PMC free article] [PubMed] [Google Scholar]
- 285.Yip SW, Scheinost D, Potenza MN, Carroll KM. Connectome-based prediction of cocaine abstinence. Am J Psychiatry. 2019;176(2):156–164. doi: 10.1176/appi.ajp.2018.17101147. [DOI] [PMC free article] [PubMed] [Google Scholar]
- 286.Young SD, Padwa H, Bonar EE. Social big data as a tool for understanding and predicting the impact of cannabis legalization. Front Public Health. 2019;7:274. doi: 10.3389/fpubh.2019.00274. [DOI] [PMC free article] [PubMed] [Google Scholar]
- 287.Segal Z, Radinsky K, Elad G, Marom G, Beladev M, Lewis M, et al. Development of a machine learning algorithm for early detection of opioid use disorder. Pharmacol Res Perspect. 2020;8(6):e00669. doi: 10.1002/prp2.669. [DOI] [PMC free article] [PubMed] [Google Scholar]
- 288.Zhou H, Rentsch CT, Cheng Z, Kember RL, Nunez YZ, Sherva RM, et al. Association of OPRM1 functional coding variant with opioid use disorder: a genome-wide association study. JAMA Psychiat. 2020;77(10):1072–1080. doi: 10.1001/jamapsychiatry.2020.1206. [DOI] [PMC free article] [PubMed] [Google Scholar]
- 289.Flores L, Young SD. Regional variation in discussion of opioids on social media. J Addict Dis. 2021;39(3):316–321. doi: 10.1080/10550887.2021.1874804. [DOI] [PMC free article] [PubMed] [Google Scholar]
- 290.Gelernter J, Polimanti R. Genetics of substance use disorders in the era of big data. Nat Rev Genet. 2021;22(11):712–729. doi: 10.1038/s41576-021-00377-1. [DOI] [PMC free article] [PubMed] [Google Scholar]
- 291.Liu S, Wang S, Zhang M, Xu Y, Shao Z, Chen L, et al. Brain responses to drug cues predict craving changes in abstinent heroin users: a preliminary study. Neuroimage. 2021;237:118169. doi: 10.1016/j.neuroimage.2021.118169. [DOI] [PubMed] [Google Scholar]
- 292.Purushothaman V, Li J, Mackey TK. Detecting suicide and self-harm discussions among opioid substance users on instagram using machine learning. Front Psychiatry. 2021;12:551296. doi: 10.3389/fpsyt.2021.551296. [DOI] [PMC free article] [PubMed] [Google Scholar]
- 293.Rossetti MG, Patalay P, Mackey S, Allen NB, Batalla A, Bellani M, et al. Gender-related neuroanatomical differences in alcohol dependence: findings from the ENIGMA Addiction Working Group. NeuroImage Clinical. 2021;30:102636. doi: 10.1016/j.nicl.2021.102636. [DOI] [PMC free article] [PubMed] [Google Scholar]
- 294.Tretter F, Loeffler-Stastka H. How does the ‘environment’ come to the person? The ‘ecology of the person’ and addiction. World J Psychiatry. 2021;11(11):915–936. doi: 10.5498/wjp.v11.i11.915. [DOI] [PMC free article] [PubMed] [Google Scholar]
- 295.Li Y, Cheng P, Liang L, Dong H, Liu H, Shen W, et al. Abnormal resting-state functional connectome in methamphetamine-dependent patients and its application in machine-learning-based classification. Front Neurosci. 2022;16:1014539. doi: 10.3389/fnins.2022.1014539. [DOI] [PMC free article] [PubMed] [Google Scholar]
- 296.Ottino-Gonzalez J, Uhlmann A, Hahn S, Cao Z, Cupertino RB, Schwab N, et al. White matter microstructure differences in individuals with dependence on cocaine, methamphetamine, and nicotine: findings from the ENIGMA-Addiction working group. Drug Alcohol Depend. 2022;230:109185. doi: 10.1016/j.drugalcdep.2021.109185. [DOI] [PMC free article] [PubMed] [Google Scholar]
- 297.https://nda.nih.gov/abcd/.
- 298.Kim CH, Chung CK, Park CS, Choi B, Kim MJ, Park BJ. Reoperation rate after surgery for lumbar herniated intervertebral disc disease: nationwide cohort study. Spine. 2013;38(7):581–590. doi: 10.1097/BRS.0b013e318274f9a7. [DOI] [PubMed] [Google Scholar]
- 299.European Commission. Improvement in Postoperative PAIN OUTcome [cited 2022. Available from: https://cordis.europa.eu/project/id/223590/reporting].
- 300.Pain-OUT. About Pain-OUT [cited 2022. Available from: http://pain-out.med.uni-jena.de/about-pain-out].
- 301.Taghva A, Karst E, Underwood P. Clinical paresthesia atlas illustrates likelihood of coverage based on spinal cord stimulator electrode location. Neuromodulation. 2017;20(6):582–588. doi: 10.1111/ner.12594. [DOI] [PubMed] [Google Scholar]
- 302.Nijs J, Clark J, Malfliet A, Ickmans K, Voogt L, Don S, et al. In the spine or in the brain? Recent advances in pain neuroscience applied in the intervention for low back pain. Clin Exp Rheumatol. 2017;35(5):108–115. [PubMed] [Google Scholar]
- 303.Nomura ATG, de Abreu AM, Pruinelli L. Information model on pain management: an analysis of Big Data. J Nurs Scholarsh. 2021;53(3):270–277. doi: 10.1111/jnu.12638. [DOI] [PubMed] [Google Scholar]
- 304.Min J, Osborne V, Kowalski A, Prosperi M. Reported adverse events with painkillers: data mining of the US food and drug administration adverse events reporting system. Drug Saf. 2018;41(3):313–320. doi: 10.1007/s40264-017-0611-5. [DOI] [PubMed] [Google Scholar]
- 305.Bomberg H, Wetjen L, Wagenpfeil S, Schope J, Kessler P, Wulf H, et al. Risks and benefits of ultrasound, nerve stimulation, and their combination for guiding peripheral nerve blocks: a retrospective registry analysis. Anesth Analg. 2018;127(4):1035–1043. doi: 10.1213/ANE.0000000000003480. [DOI] [PubMed] [Google Scholar]
- 306.Kwon JW, Ha JW, Lee TS, Moon SH, Lee HM, Park Y. Comparison of the prevalence of low back pain and related spinal diseases among smokers and nonsmokers: using korean national health insurance database. Clin Orthop Surg. 2020;12(2):200–208. doi: 10.4055/cios19095. [DOI] [PMC free article] [PubMed] [Google Scholar]
- 307.Schnabel A, Yahiaoui-Doktor M, Meissner W, Zahn PK, Pogatzki-Zahn EM. Predicting poor postoperative acute pain outcome in adults: an international, multicentre database analysis of risk factors in 50,005 patients. Pain Rep. 2020;5(4):e831. doi: 10.1097/PR9.0000000000000831. [DOI] [PMC free article] [PubMed] [Google Scholar]
- 308.Yu Y, Cui L, Qian L, Lei M, Bao Q, Zeng Q, et al. Efficacy of perioperative intercostal analgesia via a multimodal analgesic regimen for chronic post-thoracotomy pain during postoperative follow-up: a big-data, intelligence platform-based analysis. J Pain Res. 2021;14:2021–2028. doi: 10.2147/JPR.S303610. [DOI] [PMC free article] [PubMed] [Google Scholar]
- 309.Huie JR, Ferguson AR, Kyritsis N, Pan JZ, Irvine KA, Nielson JL, et al. Machine intelligence identifies soluble TNFa as a therapeutic target for spinal cord injury. Sci Rep. 2021;11(1):3442. doi: 10.1038/s41598-021-82951-5. [DOI] [PMC free article] [PubMed] [Google Scholar]
- 310.Kringel D, Ultsch A, Zimmermann M, Jansen JP, Ilias W, Freynhagen R, et al. Emergent biomarker derived from next-generation sequencing to identify pain patients requiring uncommonly high opioid doses. Pharmacogenomics J. 2017;17(5):419–426. doi: 10.1038/tpj.2016.28. [DOI] [PMC free article] [PubMed] [Google Scholar]
- 311.Anis O, Kridin K, Cohen AD, Levmore M, Yaron S, Valdman-Grinshpoun Y, et al. Chronic spontaneous urticaria in patients with interstitial cystitis/bladder pain syndrome: insights from big data analyses. Urology. 2022 doi: 10.1016/j.urology.2022.10.017. [DOI] [PubMed] [Google Scholar]
Associated Data
This section collects any data citations, data availability statements, or supplementary materials included in this article.
Supplementary Materials
Additional file 1: Table S1. Sample of national projects that spurred on the big data revolution. Table S2. Sample of neurology and neuroscience databases. Table S3. Sample of connectome studies and evolving big data use. Table S4. Sample of PD "Big Data" studies. Table S5. Sample of SUD and OUD "Big Data" studies. Table S6. Sample of pain "Big Data" studies.
Data Availability Statement
Data sharing is not applicable to this survey article as no primary research datasets were generated during the survey (further, all data survey material is included in the manuscript and/or Additional file 1).