

Abstract
Introduction
The objective of the study was to compare the accuracy of the ductus venosus pulsatility index (DV PI) with that of the cerebroplacental ratio (CPR) for the prediction of adverse perinatal outcome at two gestational ages: <34 and ≥34 weeks' gestation.
Material and methods
This was a retrospective study of 169 high‐risk pregnancies (72 < 34 and 97 ≥ 34 weeks) that underwent an ultrasound examination of CPR, DV Doppler and estimated fetal weight at 22–40 weeks. The CPR and DV PI were converted into multiples of the median, and the estimated fetal weight into centiles according to local references. Adverse perinatal outcome was defined as a composite of abnormal cardiotocogram, intrapartum pH requiring cesarean delivery, 5′ Apgar score <7, neonatal pH <7.10 and admission to neonatal intensive care unit. Values were plotted according to the interval to labor to evaluate progression of abnormal Doppler values, and their accuracy was evaluated at both gestational periods, alone and combined with clinical data, by means of univariable and multivariable models, using the Akaike information criteria (AIC) and the area under the curve (AUC).
Results
Prior to 34 weeks' gestation, DV PI was the latest parameter to become abnormal. However, it was a poor predictor of adverse perinatal outcome (AUC 0.56, 95% CI: 0.40–0.71, AIC 76.2, p > 0.05), and did not improve the predictive accuracy of CPR for adverse perinatal outcome (AUC 0.88, 95% CI: 0.79–0.97, AIC 52.9, p < 0.0001). After 34 weeks' gestation, the chronology of the DV PI and CPR anomalies overlapped, but again DV PI was a poor predictor for adverse perinatal outcome (AUC 0.62, 95% CI: 0.49–0.74, AIC 120.6, p > 0.05), that did not improve the CPR ability to predict adverse perinatal outcome (AUC 0.80, 95% CI: 0.67–0.92, AIC 106.8, p < 0.0001). The predictive accuracy of CPR prior to 34 weeks persisted when the gestational age at delivery was included in the model (AUC 0.91, 95% CI: 0.81–1.00, AIC 46.3, p < 0.0001, vs AUC 0.86, 95% CI: 0.72–1, AIC 56.1, p < 0.0001), and therefore was not determined by prematurity.
Conclusions
CPR predicts adverse perinatal outcome better than DV PI, regardless of gestational age. Larger prospective studies are needed to delineate the role of ultrasound tools of fetal wellbeing assessment in predicting and preventing adverse perinatal outcome.
Keywords: adverse perinatal outcome, cerebroplacental ratio, ductus venosus Doppler, fetal Doppler
The best prediction of adverse perinatal outcome before and after 34 weeks is achieved evaluating the cerebroplacental ratio. The ductus venosus Doppler does not improve the predictive accuracy. However, prior to 34 weeks, it might provide useful chronological information about fetal hemodynamic progression.

Abbreviations
- AIC
Akaike information criteria
- APO
adverse perinatal outcome
- AUC
area under the curve
- CPR
cerebroplacental ratio
- CS‐IFC
cesarean section for intrapartum fetal compromise
- DV PI
ductus venosus pulsatility index
- EFW
estimated fetal weight
- EO‐FGR
early‐onset fetal growth restriction
- GA
gestational age
- LO‐FGR
late‐onset fetal growth restriction
- MCA
middle cerebral artery
- MoM
multiples of the median
- NICU
Neonatal Intensive Care Unit
- SGA
small for gestational age
Key message.
The best prediction of adverse perinatal outcome both prior to and beyond 34 weeks' gestation was achieved by means of cerebroplacental ratio multiples of the median evaluation. Addition of ductus venosus Doppler did not improve the predictive accuracy. However, prior to 34 weeks, it might provide useful information about fetal hemodynamic progression.
1. INTRODUCTION
Current consensus indicates that late‐onset fetal growth restriction (LO‐FGR) is caused by an imbalance between fetal demands and placental supply, 1 , 2 , 3 in which hemodynamic anomalies occur regardless of fetal weight. 4 , 5 , 6 , 7 , 8 , 9 , 10 , 11 In pregnancies complicated by LO‐FGR, adverse perinatal outcome (APO) is optimally predicted with the cerebroplacental ratio (CPR), that reflects the degree of cerebral vasodilation in response to placental relative insufficiency. Conversely, early‐onset fetal growth restriction (EO‐FGR) is caused by a progressive placental failure where prediction of APO is achieved using the estimated fetal weight (EFW) 12 and umbilical artery (UA) Doppler, 13 , 14 although with progressive hemodynamic deterioration, cerebral vasodilation also occurs, making CPR a potentially useful tool for the prediction of APO, along with EFW. 1
In pregnancies complicated by EO‐FGR, the ductus venosus (DV) Doppler has been considered as a marker of progression, but not in fetuses with LO‐FGR, in which hemodynamic progression does not reach such degrees of severity. A drawback of this approach has been the paucity of information concerning the role of the DV Doppler at the end of pregnancy. Moreover, no study has clearly evaluated and compared the ability of the DV Doppler along with CPR in the prediction of APO prior to and beyond 34 weeks' gestation. Finally, even though the DV Doppler might be the last hemodynamic parameter to be altered, this does not necessarily make it the most accurate parameter for the prediction of APO, such that the veracity of such assertion remains to be proved.
The aim of this study was to compare the predictive accuracy of ductus venosus pulsatility index (DV PI) and CPR in the prediction of APO alone and combined with other sonographic or clinical parameters.
2. MATERIAL AND METHODS
This was a retrospective study of 169 high risk pregnancies who attended La Fe public tertiary maternity hospital, between 2012 and 2022. These included cases with chronic hypertension, pre‐eclampsia, previous stillbirth and reduced fetal growth. Other pregnancies were considered at risk for different reasons, such as reduced amniotic fluid, advanced maternal age, assisted reproduction, and reduced fetal movements.
The ultrasound examinations were performed between 22 and 41 weeks' gestation (72 prior to 34 and 97 at or beyond 34 weeks) and included an EFW, a Doppler evaluation of the UA and middle cerebral artery (MCA) pulsatility indices (PI), and an evaluation of the DV PI. The UA, MCA and DV were recorded for fetal surveillance using color and pulse Doppler according to earlier descriptions 15 , 16 , 17 and the cerebroplacental ratio (CPR) was calculated as the ratio between the MCA PI and the UA PI. 18 Only one (the last) examination per fetus was included. Pregnancies were followed until the onset of spontaneous labor, induction of labor or elective cesarean section for obstetric indications. Management of fetuses, hospital protocols, and rate of inductions and cesarean sections did not change during the study period.
EFW and birthweight values were converted into centiles, 19 while CPR and DV PI values were converted into multiples of median (MoM) dividing each value by the 50th centile at each gestational age as earlier described. 15 , 16 CPR and DV PI medians (50th centile) were calculated using these equations adjusting for GA (GA):
Doppler assessment was performed by the first author, a certified expert in obstetric ultrasound by the Spanish Society of Obstetrics and Gynecology, using General Electric Voluson (E8/E6/730) ultrasound machines with 2–8 MHz convex probes, during fetal quiescence (behabioural states 1F and 2F), in the absence of fetal tachycardia, and keeping the insonation angle with the examined vessels as small as possible.
GA was determined according to the crown‐rump length in the first trimester. Multiple pregnancies and those complicated by fetal abnormalities or aneuploidy were excluded from the study. Demographic and pregnancy characteristics including, maternal age, parity, pre‐pregnancy weight and height, were collected at the time of ultrasound assessment. Pregnancy outcomes including birthweight, mode of delivery, Apgar scores, cord arterial pH and admission to the neonatal ward or neonatal intensive care unit, were collected after birth to evaluate APO. This was considered when the outcome was adverse for any of these four components: (1) Cesarean section for abnormal intrapartum fetal heart rate (also called cesarean section for intrapartum fetal compromise, CS‐IFC) 20 or intrapartum fetal scalp pH <7.20 requiring urgent cesarean section, (2) neonatal umbilical cord pH <7.10, (3) five minute Apgar score <7 and (4) postpartum admission to neonatal unit or neonatal death. All fetuses were managed according to their progression in labor according to the hospital protocol. Of note, cases with abnormal intrapartum fetal heart rate resulting in vaginal instrumental delivery were not included as APO if fetal scalp pH or neonatal pH were within the normal limits.
2.1. Statistical analyses
Descriptive statistics were performed evaluating maternal age, parity, GA at examination in weeks, GA at delivery in weeks, interval between ultrasound and delivery, EFW, EFW centile, cerebroplacental ratio multiples of the median (CPR MoM), ductus venosus pulsatility index multiples of the median (DV PI MoM), fetal gender, onset of labor (elective cesarean section, induction of labor and spontaneous onset of labor), mode of delivery (cesarean section for abnormal cardiotocogram, failure to progress or elective, assisted delivery and spontaneous delivery), Apgar scores at 5 min, neonatal cord arterial pH, and whether the newborn was admitted to maternity ward, neonatal ward or neonatal intensive care unit. Continuous variables are presented as median and interquartile range (IQR), while categorical variables are presented as absolute numbers and relative frequencies.
The accuracies of the CPR MoM, DV PI MoM and EFW centile for the detection of APO were evaluated using univariable logistic regression analysis, describing the estimate, odds ratio, p‐value, receiver operating characteristic (ROC) curve with the area under the curve (AUC), Akaike information criterion (AIC), and negative and positive predictive values. However, to improve the predictive accuracy, we also applied multivariable logistic regression analysis, combining Doppler values with EFW centiles and clinical parameters (maternal age and parity) to create models in which the same statistical parameters were calculated.
To assess the validity of results and ensure consistency, additional analyses were performed adjusting with GA at delivery to rule out the effect of prematurity, while other analyses evaluated the studied parameters for the prediction of CS‐IFC, in appropriate and small for gestational age (SGA) fetuses.
Comparisons were made using Mann–Whitney and Fisher's exact tests. It is important to underline that AIC was used to select the best prediction model by means of a lower AIC, which indicated the presence of a higher accuracy (a difference in the AIC of 2 units indicated significant differences and a difference of 2–4 units indicated highly significant differences). 21 There is generally a tradeoff between goodness of fit and parsimony: low parsimony models (i.e., models with many parameters) tend to have a better fit than high parsimony models. However, adding more parameters usually results in a good model fit for the data at hand, but that same model will probably be less useful in other populations. The AIC allows a good balance between parsimony and goodness of fit. 22 In addition, its purpose is not to inform about the quality of a model but to indicate in similar models the amount of lost information trying to mimic reality. This characteristic made the AIC a convenient method to compare our predictions models by selecting the model with the lowest loss of information (lowest AIC).
Statistical analysis and graphs were carried out using the Graph Pad Prism, Mac version 9.0.1, and Stat Plus Mac Pro version 8.0.1.s. Significance level was considered with a p‐value of less than 0.05. IRB permission from the Instituto de Investigación Sanitaria La Fe (IIISLaFe) was obtained for this study (reference 2014/0063). The authors report no conflicts of interest.
2.2. Ethics statement
Institutional Review Board permission from the Instituto de Investigación Sanitaria La Fe (IIISLaFe) was obtained for this study on April 8, 2014 (reference 2014/0063).
3. RESULTS
Table 1 lists the characteristics of the pregnancies according to the gestational period in which they were examined. In summary, fetuses examined prior to 34 weeks' gestation had significantly longer assessment‐delivery intervals (p < 0.0001), lower EFW and birthweight centiles (p < 0.001), more abnormal CPR MoM and DV PI MoM values (p < 0.0001), and a higher number of APO (p < 0.0001). In addition, they were more frequently delivered via elective cesarean section, and admitted to neonates ward (p < 0.0001) and Neonatal Intensive Care Unit (p < 0.01). Only 10 (13.8%) were delivered beyond 34 weeks.
TABLE 1.
Descriptive statistics of the two groups of fetuses: Left: Examined prior to 34 weeks, and right: Examined at or beyond 34 weeks' gestation.
| Prior to 34 weeks | At or beyond 34 weeks | p‐value | |||
|---|---|---|---|---|---|
| (n = 72) | (n = 97) | ||||
| Mean (SD) | Median (1st, 3rd Quartile) | Mean (SD) | Median (1st, 3rd Quartile) | ||
| Maternal age (years) | 33.6 (5.6) | 33.5 (30, 37.7) | 33.15 (5.6) | 34.0 (30, 37) | NS |
| Maternal pre‐pregnancy weight (kg) | 60.1 (13.9) | 58 (51.7, 64.2) | 60.3 (9.4) | 58 (53, 67) | NS |
| Maternal height (cm) | 162 (6.1) | 161 (157, 167) | 161 (6.4) | 160 (157, 165) | NS |
| Maternal body mass index | 23.3 (4.9) | 21.5 (20.4, 24.5) | 22.8 (3.5) | 22.1 (20.3, 24.8) | NS |
| GA at examination (weeks) | 30.2 (2.8) | 31 (28.5, 32.3) | 37.21 (1.6) | 37.14 (36.2, 38.5) | <0.0001 |
| EFW (hadlock‐4) (g) | 1125 (367.9) | 1106 (814, 1405) | 2319 (475) | 2250 (1967, 2682) | <0.0001 |
| EFW centile a | 9.35 (23.9) | 0 (0, 4) | 10.8 (18.7) | 3 (1, 11) | <0.001 |
| CPR MoM | 0.57 (0.33) | 0.53 (0.31, 0.76) | 0.84 (0.35) | 0.84 (0.60, 1) | <0.0001 |
| DV PIV MoM | 1.37 (0.88) | 1.2 (0.91, 1.52) | 1.29 (0.57) | 1.24 (0.96, 1.55) | <0.0001 |
| GA at labor (weeks) | 33.1 (4.05) | 33.4 (30.0, 36.9) | 38.6 (1.61) | 38.86 (37.5, 39.79) | <0.0001 |
| Interval exam‐labor (days) | 20.5 (24.7) | 7 (2, 36.5) | 9.7 (8.9) | 8 (3, 14) | <0.0001 |
| Birthweight (g) | 1559 (767.7) | 1348 (900, 1991) | 2491 (507) | 2500 (2100, 2775) | <0.0001 |
| BW centile a | 9 (22.2) | 0 (0, 4.2) | 10.7 (19.5) | 2 (0, 12) | <0.001 |
| Apgar at 5 min | 9.2 (2) | 10 (9, 10) | 9.81 (0.46) | 10 (10, 10) | <0.05 |
| Arterial cord pH | 7.04 (1.27) | 7.27 (7.23, 7.30) | 7.19 (0.76) | 7.27 (7.22, 7.32) | NS |
| N (%) 72 | N (%) 97 | ||
|---|---|---|---|
| Adverse perinatal outcome | 57 (79.2) | 29 (29.9) | <0.0001 |
| Nulliparous | 45 (62.5) | 55 (56.7) | NS |
| Gender male | 41 (57) | 51 (52.6) | NS |
| Apgar 5 min <7 | 0 (0) | 0 (0) | NS |
| Arterial cord pH <7.10 | 3 (4.2) | 4 (4.12) | NS |
| Onset of labor | |||
| Spontaneous onset of labor | 9 (12.5) | 24 (24.7) | NS |
| Induction of labor | 15 (20.8) | 56 (57.7) | <0.0001 |
| Fetal demise (>22 weeks) b | 1 (1.4) | 0 (0) | NS |
| TOP (≤22 weeks) b | 1 (1.4) | 0 (0) | NS |
| Elective cesarean section | 47 (65.3) | 17 (17.5) | <0.0001 |
| Via of labor | |||
| Spontaneous vaginal delivery | 15 (20.8) | 46 (47.4) | <0.001 |
| Assisted vaginal delivery | 2 (2.8) | 15 (15.4) | <0.01 |
| Cesarean section abnormal CTG | 3 (4.2) | 6 (6.2) | NS |
| Cesarean section dystocia | 5 (6.9) | 13 (13.4) | NS |
| Elective cesarean section | 47 (65.3) | 17 (17.5) | <0.0001 |
| Neonate destiny | |||
| Maternal ward | 15 (20.8) | 71 (73.2) | <0.0001 |
| Neonates ward | 48 (66.6) | 26 (26.8) | <0.0001 |
| NICU | 7 (9.7) | 0 (0) | <0.01 |
| Postmortem study | 2 (2.8) | 0 (0) | NS |
Abbreviations: BW, birthweight; CPR, cerebroplacental ratio; EFW, estimated fetal weight; FGR, fetal growth restriction; GA, gestational age; MoM, multiples of the median; SD, standard deviation; TOP, voluntary termination of pregnancy according to Spanish law.
Centiles according to local population references (Hospital Clinic de Barcelona, Spain population references); CTG, cardiotocography, NICU, Neonatal Intensive Care Unit,
These fetuses died prior to labor and went sent to postmortem study. One was a 26 weeks stillbirth, and the other a voluntary TOP at 22 weeks.
Figure 1 shows the three sonographic parameters examined at or beyond 34 weeks' gestation plotted against the interval to delivery. Interpolation curves and 95% confidence intervals (CI) showed a poor R 2 and did not suggest a clear chronology of progression to abnormality.
FIGURE 1.
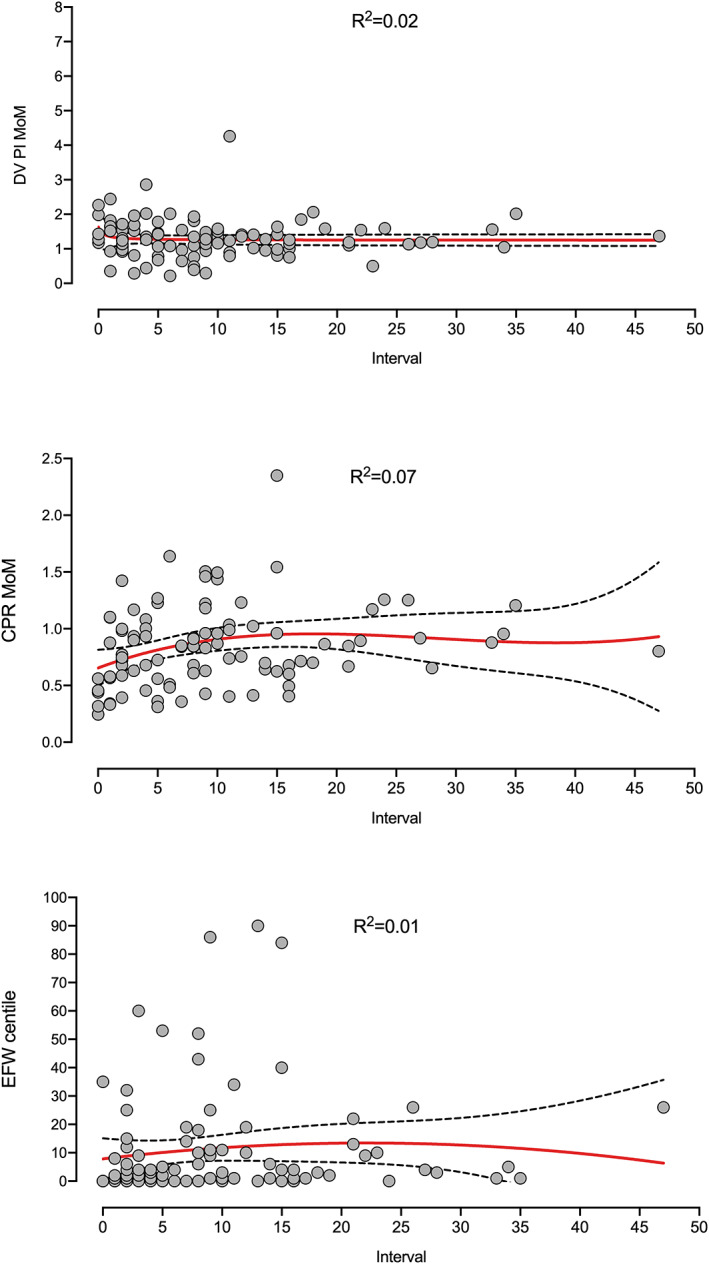
Ductus venosus (DV) pulsatility index (PI) multiples of median (MoM), cerebroplacental ratio (CPR) MoM and estimated fetal weight (EFW) centile values examined at, or beyond, 34 weeks' gestation, plotted against the interval to delivery. Interpolation curves and 95% confidence intervals (CI) showed a poor R 2 and did not suggest a clear chronology of progression to abnormality.
Table 2 and Figure 3 show a comparison of different models for the prediction of APO at or beyond 34 weeks' gestation. Prediction of APO by means of DV PI, either alone (model 8) (AUC 0.62, 95% CI: 0.49–0.74, AIC 120.6, p > 0.05) or combined with EFW centile (model 7) (AUC 0.76, 95% CI: 0.66–0.87, AIC 113.7, p < 0.0001) was poor. Overall, the best individual prediction model (lowest AIC) was obtained evaluating the CPR MoM, either alone (model 10) (AUC 0.80, 95% CI: 0.67–0.92, AIC 106.8, p < 0.0001) or combined with EFW centile (Model 6: AUC 0.80, 95% CI: 0.69–0.92, AIC 103.7, p < 0.0001). The model combining CPR MoM, EFW centile and parity (model 11) (AUC 0.81, 95% CI: 0.70–0.91, AIC 102.4, p < 0.0001) obtained the lowest AIC of all, although AIC differences with model 6 were not significant. Finally, addition of the DV PI MoM information (models 1–5) did not improve prediction of the above‐mentioned models that included CPR MoM.
TABLE 2.
Logistic regression models for the prediction of adverse perinatal outcome at or beyond 34 weeks, N = 97.
| Model 1 | ||||||||
| CPR MoM + DV PI MoM + EFW centile + maternal age + parity | ||||||||
| AUC (95% CI) 0.81 (0.71–0.92) | ||||||||
| AIC | 104.7 | Intercept | CPR MoM | DV PI MoM | EFW centile | Maternal age | Parity | |
| p‐value | <0.0001 | p‐value | <0.01 | NS | <0.05 | NS | NS | |
| NPP (%) | 84 | Estimate | −0,05404 | −311 271 | 0,53 171 | −0,06484 | 0,02993 | 0,51 439 |
| PPP (%) | 77.3 | OR | 0.04 | 1.70 | 0.94 | 1.03 | 1.67 | |
| Model 2 | ||||||||
| CPR MoM + DV PI MoM + EFW centile + maternal age | ||||||||
| AUC (95% CI) 0.81 (0.70–0.92) | ||||||||
| AIC | 105.4 | Intercept | CPR MoM | DV PI MoM | EFW centile | Maternal age | ||
| p‐value | <0.0001 | p‐value | NS | <0.01 | NS | NS | NS | |
| NPP (%) | 83.5 | Estimate | −0,58 288 | −285 467 | 0,40 924 | −0,05411 | 0,05309 | |
| PPP (%) | 88.9 | OR | 0.05 | 1.50 | 0.95 | 1.05 | ||
| Model 3 | ||||||||
| CPR MoM + DV PI MoM + EFW centile + parity | ||||||||
| AUC (95% CI) 0.82 (0.71–0.92) | ||||||||
| AIC | 102.8 | Intercept | CPR MoM | DV PI MoM | EFW centile | Parity | ||
| p‐value | <0.0001 | p‐value | <0.01 | NS | <0.05 | NS | ||
| NPP (%) | 84 | Estimate | 0,86 065 | −314 105 | 0,58 634 | −0,06576 | 0,56 529 | |
| PPP (%) | 77.3 | OR | 0.04 | 1.80 | 0.94 | 1.76 | ||
| Model 4 | ||||||||
| CPR MoM + DV PI MoM + EFW centile | ||||||||
| AUC (95% CI) 0.82 (0.71–0.93) | ||||||||
| AIC | 104.5 | Intercept | CPR MoM | DV PI MoM | EFW centile | |||
| p‐value | <0.0001 | p‐value | <0.01 | NS | NS | |||
| NPP (%) | 84.8 | Estimate | 105 050 | −283 510 | 0,49 229 | −0,05299 | ||
| PPP (%) | 94.4 | OR | 0.059 | 1.63 | 0.95 | |||
| Model 5 | ||||||||
| CPR MoM + DV PI MoM | ||||||||
| AUC (95% CI) 0.80 (0.68–0.93) | ||||||||
| AIC | 107.1 | Intercept | CPR MoM | DV PI MoM | ||||
| p‐value | <0.0001 | p‐value | <0.001 | NS | ||||
| NPP (%) | 85 | Estimate | 0,93 528 | −326 355 | 0,54 752 | |||
| PPP (%) | 100 | OR | 0.038 | 1.73 | ||||
| Model 6 | ||||||||
| CPR MoM + EFW centile | ||||||||
| AUC (95% CI) 0.80 (0.69–0.92) | ||||||||
| AIC | 103.7 | Intercept | CPR MoM | EFW centile | ||||
| p‐value | <0.0001 | p‐value | <0.01 | NS | ||||
| NPP (%) | 84.1 | Estimate | 165 302 | −274 606 | −0,05559 | |||
| PPP (%) | 94.4 | OR | 0.064 | 0.94 | ||||
| Model 7 | ||||||||
| DV PI MoM + EFW centile | ||||||||
| AUC (95% CI) 0.76 (0.66–0.87) | ||||||||
| AIC | 113.7 | Intercept | DV PI MoM | EFW centile | ||||
| p‐value | <0.0001 | p‐value | NS | <0.05 | ||||
| NPP (%) | 70.2 | Estimate | −0,95 396 | 0,42 648 | −0,06849 | |||
| PPP (%) | 33.3 | OR | 1.53 | 0.93 | ||||
| Model 8 | ||||||||
| DV PI MoM | ||||||||
| AUC (95% CI) 0.62 (0.49–0.74) | ||||||||
| AIC | 120.6 | Intercept | DV PI MoM | |||||
| p‐value | NS | p‐value | NS | |||||
| NPP (%) | 69.8 | Estimate | −154 861 | 0,52 628 | ||||
| PPP (%) | 0 | OR | 1.69 | |||||
| Model 9 | ||||||||
| EFW centile | ||||||||
| AUC (95% CI) 0.79 (0.68–0.90) | ||||||||
| AIC | 112.6 | Intercept | EFW centile | |||||
| p‐value | <0.0001 | p‐value | <0.05 | |||||
| NPP (%) | 70.1 | Estimate | −0,37 012 | −0,07225 | ||||
| PPP (%) | — | OR | 0.93 | |||||
| Model 10 | ||||||||
| CPR MoM | ||||||||
| AUC (95% CI) 0.80 (0.67–0.92) | ||||||||
| AIC | 106.8 | Intercept | CPR MoM | |||||
| p‐value | <0.0001 | p‐value | <0.001 | |||||
| NPP (%) | 85 | Estimate | 163 424 | −323 053 | ||||
| PPP (%) | 100 | OR | 0.039 | |||||
| Model 11 | ||||||||
| CPR MoM + EFW centile + parity | ||||||||
| AUC (95% CI) 0.81 (0.70–0.91) | ||||||||
| AIC | 102.4 | Intercept | CPR MoM | EFW centile | Parity | |||
| p‐value | <0.0001 | p‐value | <0.01 | <0.05 | NS | |||
| NPP (%) | 84 | Estimate | 158 168 | −300 601 | −0,06839 | 0,50 961 | ||
| PPP (%) | 77 | OR | 0.049 | 0.93 | 1.66 | |||
Abbreviations: AIC, Akaike information criteria; AUC, area under the curve; CPR MoM, cerebroplacental ratio multiples of the median; DV MoM, ductus venosus pulsatility index multiples of the median; EFW, estimated fetal weight; GA at delivery, gestational age at delivery; NPP, negative predictive power; OR, odds ratio; PPP, positive predictive power.
FIGURE 3.
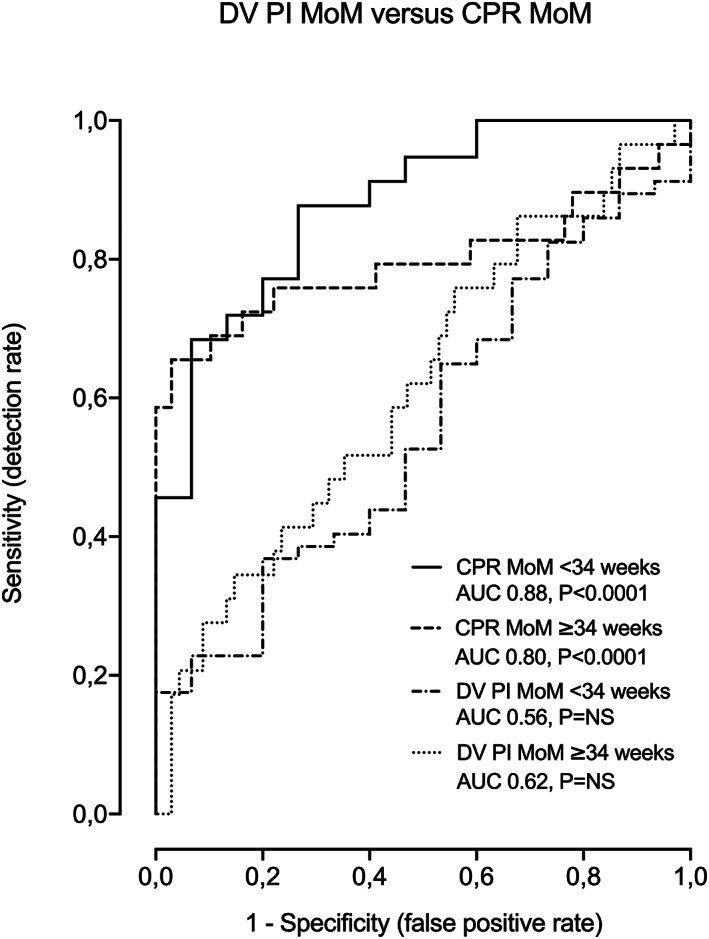
Comparison between DV PI MoM and CPR MoM for the prediction of APO at both gestational periods (<34 and ≥34 weeks).
Figure 2 shows the three sonographic parameters examined prior to 34 weeks' gestation plotted against the interval to delivery. Interpolation curves and 95% CIs showed a moderate R 2 and suggested a chronology in the progression to abnormality. DV PI values became abnormal prior to labor (still normal values one week before birth), while progression to abnormality in case of the CPR MoM and EFW centiles started sooner and was progressively reduced (values fell from normality two and 3 months before birth).
FIGURE 2.
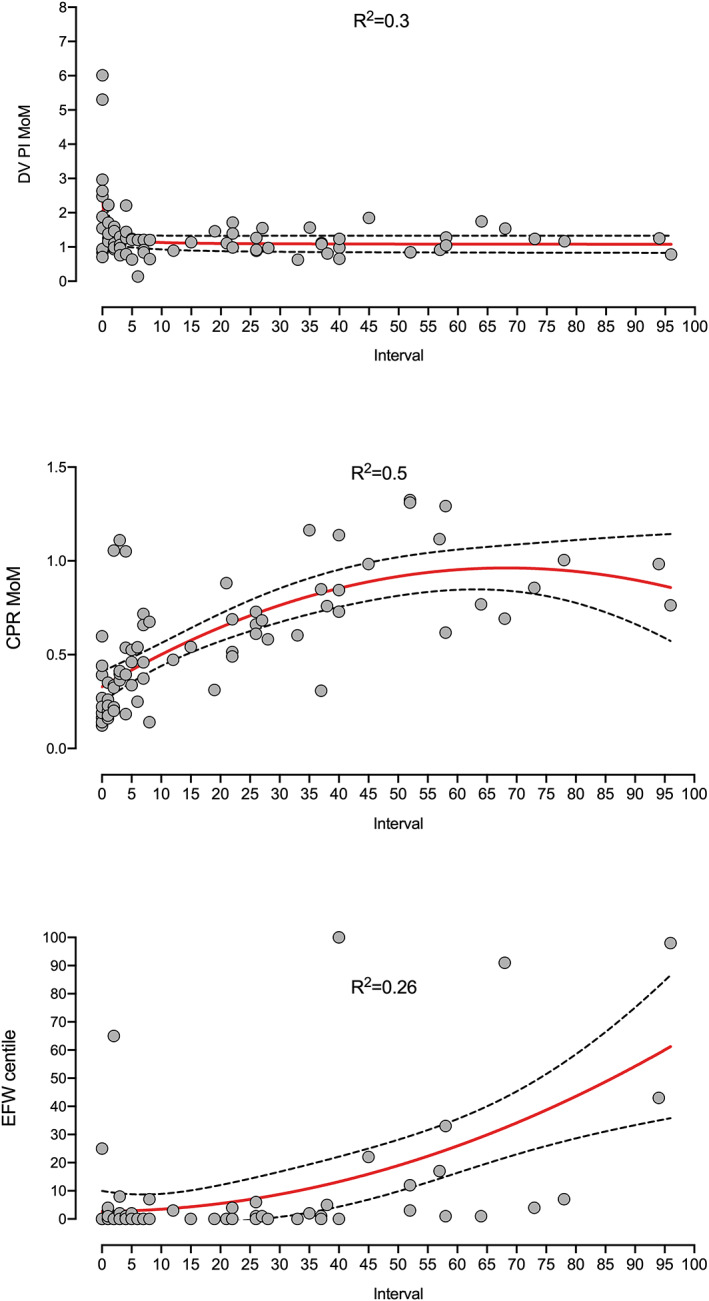
Ductus venosus (DV) pulsatility index (PI) multiples of median (MoM), cerebroplacental ratio (CPR) MoM and estimated fetal weight (EFW) centile values examined prior to 34 weeks, plotted against the interval to delivery. Interpolation curves and 95% CIs showed a moderate R 2 and suggested a chronology in the progression to abnormality. DV PI values became abnormal prior to labor (still normal values one week before birth), while progression to abnormality in case of the CPR MoM and EFW centiles started sooner and was progressively reduced (values fall from normality two and 3 months before birth).
Table 3 and Figure 3 show a comparison of different models for the prediction of APO prior to 34 weeks' gestation. Prediction of APO by means of DV PI, alone (AUC 0.56, 95% CI: 0.40–0.71, AIC 76.2, p > 0.05) or combined with EFW (AUC 0.68, 95% CI: 0.51–0.85, AIC 73.7, p < 0.05) was poor. Overall, the best model (lowest AIC) was obtained using the CPR MoM alone, (model 10) (AUC 0.88, 95% CI: 0.79–0.97, AIC 52.9, p < 0.0001) or combined with EFW centile (model 6) (AUC 0.88, 95% CI: 0.79–0.97, AIC 54.8, p < 0.0001). In this case, parity (model 11) (AUC 0.88, 95% CI: 0.79–0.97, AIC 57, p < 0.0001) did not improve prediction of any of both models. Finally, addition of the DV PI MoM information (models 1–5) did not improve prediction of the above‐mentioned models that included CPR MoM.
TABLE 3.
Logistic regression models for the prediction of adverse perinatal outcome prior to 34 weeks, N = 72.
| Model 1 | ||||||||
| CPR MoM + DV PI MoM + EFW centile + maternal age + parity | ||||||||
| AUC (95% CI) 0.88 (0.78–0.97) | ||||||||
| AIC | 61.6 | Intercept | CPR MoM | DV PI MoM | EFW centile | Maternal age | Parity | |
| p‐value | <0.0001 | p‐value | <0.001 | NS | NS | NS | NS | |
| NPP (%) | 66.7 | Estimate | 488 185 | −503 696 | 0,21 585 | −0,00623 | −0,00391 | −0,12 940 |
| PPP (%) | 88.3 | OR | 0.006 | 1.24 | 0.99 | 0.97 | 0.88 | |
| Model 2 | ||||||||
| CPR MoM + DV PI MoM + EFW centile + maternal age | ||||||||
| AUC (95% CI) 0.88 (0.79–0.97) | ||||||||
| AIC | 59.3 | Intercept | CPR MoM | DV PI MoM | EFW centile | Maternal age | ||
| p‐value | <0.0001 | p‐value | <0.001 | NS | NS | NS | ||
| NPP (%) | 66.7 | Estimate | 496 640 | −507 991 | 0,20 756 | −0,00608 | −0,00725 | |
| PPP (%) | 88.3 | OR | 0.006 | 1.23 | 0.99 | 0.99 | ||
| Model 3 | ||||||||
| CPR MoM + DV PI MoM + EFW centile + parity | ||||||||
| AUC (95% CI) 0.88 (0.79–0.97) | ||||||||
| AIC | 59.2 | Intercept | CPR MoM | DV PI MoM | EFW centile | Parity | ||
| p‐value | <0.0001 | p‐value | <0.001 | NS | NS | NS | ||
| NPP (%) | 66.7 | Estimate | 475 573 | −504 539 | 0,21 519 | −0,00609 | −0,13 400 | |
| PPP (%) | 88.3 | OR | 0.006 | 1.24 | 0.99 | 0.87 | ||
| Model 4 | ||||||||
| CPR MoM + DV PI MoM + EFW centile | ||||||||
| AUC (95% CI) 0.87 (0.78–0.97) | ||||||||
| AIC | 57 | Intercept | CPR MoM | DV PI MoM | EFW centile | |||
| p‐value | <0.0001 | p‐value | <0.001 | NS | NS | |||
| NPP (%) | 66.7 | Estimate | 472 989 | −509 787 | 0,20 625 | −0,00582 | ||
| PPP (%) | 88.3 | OR | 0.006 | 1.23 | 0.99 | |||
| Model 5 | ||||||||
| CPR MoM + DV PI MoM | ||||||||
| AUC (95% CI) 0.87 (0.78–0.96) | ||||||||
| AIC | 55 | Intercept | CPR MoM | DV PI MoM | ||||
| p‐value | <0.0001 | p‐value | <0.001 | NS | ||||
| NPP (%) | 66.7 | Estimate | 476 576 | −528 666 | 0,21 398 | |||
| PPP (%) | 88.3 | OR | 0.0051 | 1.24 | ||||
| Model 6 | ||||||||
| CPR MoM + EFW centile | ||||||||
| AUC (95% CI) 0.88 (0.79–0.97) | ||||||||
| AIC | 54.8 | Intercept | CPR MoM | EFW centile | ||||
| p‐value | <0.0001 | p‐value | <0.001 | NS | ||||
| NPP (%) | 66.7 | Estimate | 499 560 | −512 469 | −0,00588 | |||
| PPP (%) | 88.3 | OR | 0.006 | 0.99 | ||||
| Model 7 | ||||||||
| DV PI MoM + EFW centile | ||||||||
| AUC (95% CI) 0.68 (0.51–0.85) | ||||||||
| AIC | 73.7 | Intercept | DV PI MoM | EFW centile | ||||
| p‐value | <0.05 | p‐value | NS | <0.05 | ||||
| NPP (%) | 50 | Estimate | 0,88 690 | 0,58 415 | −0,02291 | |||
| PPP (%) | 81 | OR | 1.79 | 0.98 | ||||
| Model 8 | ||||||||
| DV PI MoM | ||||||||
| AUC (95% CI) 0.56 (0.40–0.71) | ||||||||
| AIC | 76.2 | Intercept | DV PI MoM | |||||
| p‐value | NS | p‐value | NS | |||||
| NPP (%) | — | Estimate | 0,53 629 | 0,63 787 | ||||
| PPP (%) | 79.2 | OR | 1.89 | |||||
| Model 9 | ||||||||
| EFW centile | ||||||||
| AUC (95% CI) 0.83 (0.72–0.94) | ||||||||
| AIC | 72.7 | Intercept | EFW centile | |||||
| p‐value | <0.0001 | p‐value | <0.05 | |||||
| NPP (%) | 50 | Estimate | 162 739 | −0,02391 | ||||
| PPP (%) | 81 | OR | 0.98 | |||||
| Model 10 | ||||||||
| CPR MoM | ||||||||
| AUC (95% CI) 0.88 (0.79–0.97) | ||||||||
| AIC | 52.9 | Intercept | CPR MoM | |||||
| p‐value | <0.0001 | p‐value | <0.0001 | |||||
| NPP (%) | 66.7 | Estimate | 503 977 | −531 471 | ||||
| PPP (%) | 88.3 | OR | 0.0049 | |||||
| Model 11 | ||||||||
| CPR MoM + EFW centile + parity | ||||||||
| AUC (95% CI) 0.88 (0.79–0.97) | ||||||||
| AIC | 57 | Intercept | CPR MoM | EFW centile | Parity | |||
| p‐value | <0.0001 | p‐value | <0.001 | NS | NS | |||
| NPP (%) | 61.5 | Estimate | 502 893 | −507 038 | −0,00616 | −0,13 068 | ||
| PPP (%) | 88.1 | OR | 0.0063 | 0.99 | 0.88 | |||
Abbreviations: AIC, Akaike information criteria; AUC, area under the curve; CPR MoM, cerebroplacental ratio multiples of the median; DV MoM, ductus venosus pulsatility index multiples of the median; EFW, estimated fetal weight; GA at delivery, gestational age at delivery; NPP, negative predictive power; OR, odds ratio; PPP, positive predictive power.
To address the potential confounding effect of prematurity on APO prior to 34 weeks' gestation, we performed a secondary analysis in which we added the information of GA at delivery to the multivariable analysis (Table 4, models 12–15). The AUC and AIC notably improved (best model was model 15: AUC 0.91, 95% CI: 0.81–1.00, AIC 46.3, p < 0.0001). Furthermore, for all models CPR MoM and GA at delivery were the only significant parameters for the prediction of APO. No significant effect was observed for the DV PI. This proved that the advantage of CPR MoM over DV PI prior to 34 weeks' gestation was not determined by prematurity.
TABLE 4.
Logistic regression models for the prediction of adverse perinatal outcome prior to 34 weeks, adjusting for gestational age (GA) at delivery to address the potential confounding effect of prematurity (N = 72).
| Model 12 | |||||||||
|---|---|---|---|---|---|---|---|---|---|
| CPR MoM + DV PI MoM + EFW centile + Parity + Gestational age at delivery | |||||||||
| AUC (95% CI) 0.92 (0.83–1.00) | |||||||||
| AIC | 52.4 | Intercept | CPR MoM | DV PI MoM | EFW centile | Parity | GA at delivery | ||
| p‐value | <0.0001 | p‐Value | <0.05 | NS | NS | NS | <0.01 | ||
| NPP (%) | 90 | Estimate | 16.82272 | −4.46523 | −0.02886 | −0.01216 | −0.01564 | −0.34724 | |
| PPP (%) | 90.3 | OR | 0.011 | 0.971 | 0.988 | 0.984 | 0.706 | ||
| Model 13 | |||||||||
|---|---|---|---|---|---|---|---|---|---|
| CPR MoM + DV PI MoM + EFW centile + Gestational age at delivery | |||||||||
| AUC (95% CI) 0.91 (0.82–1.00) | |||||||||
| AIC | 50 | Intercept | CPR MoM | DV PI MoM | EFW centile | GA at delivery | |||
| p‐value | <0.0001 | p‐Value | <0.05 | NS | NS | <0.01 | |||
| NPP (%) | 90 | Estimate | 16.84045 | −4.47772 | −0.03294 | −0.01211 | −0.34759 | ||
| PPP (%) | 90.3 | OR | 0.011 | 0.968 | 0.988 | 0.706 | |||
| Model 14 | |||||||||
|---|---|---|---|---|---|---|---|---|---|
| DV PI MoM + Gestational age at delivery | |||||||||
| AUC (95% CI) 0.86 (0.72–1.00) | |||||||||
| AIC | 56.1 | Intercept | DV PI MoM | GA at delivery | |||||
| p‐value | <0.0001 | p‐Value | NS | <0.001 | |||||
| NPP (%) | 90.9 | Estimate | 18.36535 | 0.03008 | −0.48877 | ||||
| PPP (%) | 91.8 | OR | 1.030 | 0.613 | |||||
| Model 15 | |||||||||
|---|---|---|---|---|---|---|---|---|---|
| CPR MoM + Gestational age at delivery a | |||||||||
| AUC (95% CI) 0.91 (0.81–1.00) | |||||||||
| AIC | 46.3 | Intercept | CPR MoM | GA at delivery | |||||
| p‐value | <0.0001 | p‐Value | <0.01 | <0.01 | |||||
| NPP (%) | 81.8 | Estimate | 16.25033 | −4.98471 | −0.32732 | ||||
| PPP (%) | 90.2 | OR | 0.007 | 0.721 | |||||
Abbreviations: AIC, Akaike information criteria; AUC, area under the curve; CPR MoM, cerebroplacental ratio multiples of the median; DV MoM, Ductus venosus pulsatility index multiples of the median; EFW, estimated fetal weight; GA at delivery, gestational age at delivery; NPP, negative predictive power; OR, odds ratio; PPP, positive predictive power.
This model obtained the best accuracy for the prediction of APO.
Finally, to increase the consistency of the results, DV PI MoM and CPR MoM were compared discarding elective cesarean sections for the prediction of CS‐IFC at all GAs (Table 5). Model 16 (N = 103) studied AGA and SGA, while model 17 evaluated SGA. These models also included GA to adjust for the effect of prematurity. In fact, this effect was doubly discarded by studying CS‐IFC instead of APO, as neonatal admission is frequently linked with this condition. In all cases the results persisted, and CPR remained as the only significant parameter for the prediction of CS‐IFC (p < 0.01 and p < 0.05).
TABLE 5.
Logistic regression models for the prediction of CS‐IFC, adjusting for gestational age (GA) at delivery to address the potential confounding effect of prematurity. To increase the consistency of the results, DV PI MoM and CPR MoM were compared at all gestational ages discarding elective cesarean sections. Model 16 (N = 103) included AGA and SGA, while model 17(N = 74) included SGA.
| Model 16 | ||||||||
|---|---|---|---|---|---|---|---|---|
| CPR MoM + DV PI MoM + EFW centile + Parity + Gestational age at delivery | ||||||||
| AUC (95% CI) 0.8558 (0.70–1.00) | ||||||||
| AIC | 56.81 | Intercept | CPR MoM | DV PI MoM | EFW centile | GA at delivery | ||
| p‐value | <0.001 | p‐Value | <0.01 | NS | NS | NS | ||
| NPP (%) | 92 | Estimate | 9.898 | −4.731 | −0.6667 | −0.01344 | −0.2133 | |
| PPP (%) | 50 | OR | 0.008815 | 0.5134 | 0.9867 | 0.8079 | ||
| Model 17 | ||||||||
|---|---|---|---|---|---|---|---|---|
| CPR MoM + DV PI MoM + EFW centile + Gestational age at delivery | ||||||||
| AUC (95% CI) 0.83 (0.67–1.00) | ||||||||
| AIC | 69 | Intercept | CPR MoM | DV PI MoM | EFW centile | GA at delivery | ||
| p‐value | <0.05 | p‐Value | <0.05 | NS | NS | NS | ||
| NPP (%) | 88.9 | Estimate | 10.92 | −4.042 | −0.8083 | 0.008906 | −0.2452 | |
| PPP (%) | 50.0 | OR | 0.01756 | 0.4456 | 1.009 | 0.7826 | ||
Note: Model 16, N = 103.
Multivariable model for the prediction of cesarean section for intrapartum fetal compromise in AGA and SGA fetuses at 22–41 weeks. Gestational age at delivery was included to discard the effect of prematurity. Elective cesarean sections were discarded.
Model 17, N = 74, 22–41 weeks.
Multivariable model for the prediction of cesarean section for intrapartum fetal compromise in SGA fetuses at 22–41 weeks. Gestational age at delivery was included to discard the effect of prematurity. Elective cesarean sections were discarded.
Abbreviations: AGA, appropriate for gestational age; AIC, Akaike information criteria; AUC, area under the curve; CPR MoM, cerebroplacental ratio multiples of the median; DV MoM, Ductus venosus pulsatility index multiples of the median; EFW, estimated fetal weight; GA at delivery, gestational age at delivery; NPP, negative predictive power; OR, odds ratio; PPP, positive predictive power; SGA, small for gestational age.
4. DISCUSSION
According to our results, the DV PI was a poor predictor of APO before and after 34 weeks' gestation, while the best individual prediction was achieved measuring the CPR MoM. These results persisted even when considering the potential confounding effects of prematurity.
Our results were consistent with previous findings showing that early in pregnancy the DV PI tended to be the last hemodynamic parameter to become abnormal. 23 , 24 , 25 Conversely, in the last weeks of pregnancy, no clear chronology of progression to abnormality could be detected. Unfortunately, the progression of DV doppler anomalies according to the interval to labor has not been evaluated in the third trimester, so we did not find references to support these data.
Our results were also consistent with previous studies demonstrating the poor predictive accuracy of DV PI (AUC 0.66–0.67). 26 , 27 Moreover, another study 28 did not provide AUC values but described the accuracy of the DV PI as moderate (sensitivity 0.61, specificity 0.81). Interestingly, no study has compared the CPR MoM with the DV PI for the prediction of APO. However, one study has demonstrated the importance of the MCA PI/DV PI ratio in comparison with the UA PI/DV PI ratio (AUC 0.57 vs. 0.64). 29 Of note, most studies suggesting a strong relation with APO have studied extreme categorical DV abnormalities (absent or reversed a wave) because at this degree of severity the association is probably stronger. 30 , 31 , 32 However, some cases of fetal death occurred without preceding DV PI anomalies. 33
Perhaps the most important study evaluating the DV PI Doppler in relation with APO was the TRUFFLE study. 34 , 35 , 36 However, comparisons with our study are difficult due to the different methodology, aims and conclusions: The TRUFFLE study was based on the comparison of categorical and z‐score data according to outcome, aimed to find the best strategy to end the pregnancy to avoid long‐term neurocognitive impairment, and advocated delivery according to the presence of extreme DV Doppler abnormalities, suggesting that late CPR values were not useful to influence that decision. 37 Conversely, our study applied multivariable logistic regression analysis to create prediction models that were evaluated by means of AUC and AIC, aimed to compare the predictive accuracy of DV PI and CPR MoM for APO and CS‐IFC, and suggested that CPR MoM might be better than DV PI in the prediction of APO, although was not designed to conclude when to plan delivery.
According to our findings from this and previous studies, 38 , 39 , 40 the EFW had worse predictive accuracy than CPR MoM. This is in line with recent reports describing EFW as a poor APO determinant, especially when is taken as a standalone parameter. 41 In this regard, and despite the CPR MoM supremacy, the best prediction is probably achieved combining the information provided by both ultrasound parameters.
Previous studies have demonstrated that abnormalities in the DV PI represent the last stage of the fetal hemodynamic failure in pregnancies complicated by EO‐FGR. 22 , 23 , 24 Moreover, these DV abnormalities tend to appear after the umbilical and middle cerebral arteries Doppler have progressively deteriorated. In this situation, it is tempting to think that the last anomaly to appear should be the one with the highest correlation with adverse outcome. However, that is not necessarily true, and the association with APO might be higher in those vessels with earlier anomalies, especially if Doppler parameters are combined. Later in pregnancy, the situation differs as the hemodynamic failure pivots on cerebral vasodilation, 25 and the DV PI is usually not measured, prompting the study of the DV Doppler at this GA. Our study aimed to address these issues, clarifying the role of the DV compared to CPR MoM at different gestational periods.
Consistent with recent studies, 42 our findings showed that the predictive accuracy of DV Doppler might not be as a good as previously thought, prompting future analysis to clarify its role in the prediction of APO at early and late gestational periods. Of note, our results persisted even when the models were adjusted for GA, studied only SGA fetuses, or evaluated CS‐IFC instead of APO. This proved that conclusions were consistent.
The strengths of this study included a robust statistical approach, applying continuous data and multivariable analysis, while the limitations included the fact that clinicians were not blinded to the examination, the lack of long‐term follow up, the presence of occasional long examination‐delivery intervals, the heterogeneity of the studied population, and the possibility of bias due to the potential confounding effect of prematurity. Some of these issues deserve a brief commentary. First, although for ethical reasons clinicians were not blinded to the examination, we tried to diminish this influence with additional analysis that discarded elective cesarean deliveries. Second, not only the DV Doppler, but also the CPR performs better with short intervals to labor. 43 Third, to adjust for the effect of prematurity, additional multivariable analyses were performed, including GA to rule out the effect of prematurity, or evaluating only CS‐IFC to discard unspecific neonatal admissions. In all cases the results persisted, and CPR remained as the only significant parameter for the prediction of APO or CS‐IFC.
5. CONCLUSION
The best prediction of APO both prior to and beyond 34 weeks' gestation was achieved by means of CPR MoM evaluation. Addition of DV Doppler did not improve the predictive accuracy. However, prior to 34 weeks, it might provide useful information about fetal hemodynamic progression. Future studies are needed to determine if CPR evaluation might be useful in determining the ideal timing of delivery in pregnancies complicated by FGR.
AUTHOR CONTRIBUTIONS
José Morales‐Roselló designed the study, performed the ultrasound examinations, did the statistical analysis, and wrote the manuscript. Asma Khalil supervised the final manuscript and made notable contributions to the final text. Rohan Bhate and Nashwa Eltaweel suggested valuable inputs to the text.
CONFLICT OF INTEREST STATEMENT
The authors report no conflict of interests.
Morales‐Roselló J, Bhate R, Eltaweel N, Khalil A. Comparison of ductus venosus Doppler and cerebroplacental ratio for the prediction of adverse perinatal outcome in high‐risk pregnancies before and after 34 weeks. Acta Obstet Gynecol Scand. 2023;102:891‐904. doi: 10.1111/aogs.14570
REFERENCES
- 1. Figueras F, Gratacós E. Update on the diagnosis and classification of fetal growth restriction and proposal of a stage‐based management protocol. Fetal Diagn Ther. 2014;36:86‐98. [DOI] [PubMed] [Google Scholar]
- 2. Figueras F, Caradeux J, Crispi F, Eixarch E, Peguero A, Gratacos E. Diagnosis and surveillance of late‐onset fetal growth restriction. Am J Obstet Gynecol. 2018;218:S790‐S802.e1. [DOI] [PubMed] [Google Scholar]
- 3. Figueras F, Gratacos E. An integrated approach to fetal growth restriction. Best Pract Res Clin Obstet Gynaecol. 2017;38:48‐58. [DOI] [PubMed] [Google Scholar]
- 4. Bligh LN, Al Solai A, Greer RM, Kumar S. Diagnostic performance of cerebroplacental ratio thresholds at term for prediction of low birthweight and adverse intrapartum and neonatal outcomes in a term. Low‐Risk Population Fetal Diagn Ther. 2018;43:191‐198. [DOI] [PubMed] [Google Scholar]
- 5. Bligh LN, Alsolai AA, Greer RM, Kumar S. Cerebroplacental ratio thresholds measured within 2 weeks before birth and risk of cesarean section for intrapartum fetal compromise and adverse neonatal outcome. Ultrasound Obstet Gynecol. 2018;52:340‐346. [DOI] [PubMed] [Google Scholar]
- 6. Prior T, Mullins E, Bennett P, Kumar S. Prediction of intrapartum fetal compromise using the cerebroumbilical ratio: a prospective observational study. Am J Obstet Gynecol. 2013;208:124.e1‐124.e6. [DOI] [PubMed] [Google Scholar]
- 7. Prior T, Paramasivam G, Bennett P, Kumar S. Are fetuses that fail to achieve their growth potential at increased risk of intrapartum compromise? Ultrasound Obstet Gynecol. 2015;46:460‐464. [DOI] [PubMed] [Google Scholar]
- 8. Morales‐Roselló J, Khalil A, Morlando M, Papageorghiou A, Bhide A, Thilaganathan B. Changes in fetal doppler indices as a marker of failure to reach growth potential at term. Ultrasound Obstet Gynecol. 2014;43:303‐310. [DOI] [PubMed] [Google Scholar]
- 9. Morales‐Roselló J, Khalil A. Fetal cerebral redistribution: a marker of compromise regardless of fetal size. Ultrasound Obstet Gynecol. 2015;46:385‐388. [DOI] [PubMed] [Google Scholar]
- 10. Morales‐Roselló J, Khalil A, Fornés‐Ferrer V, Perales‐Marín A. Accuracy of the fetal cerebroplacental ratio for the detection of intrapartum compromise in non small fetuses. J Matern Fetal Neonatal Med. 2018;21:1‐11. [DOI] [PubMed] [Google Scholar]
- 11. Kalafat E, Morales‐Rosello J, Thilaganathan B, Tahera F, Khalil A. Risk of operative delivery for intrapartum fetal compromise in small‐for‐gestational‐age fetuses at term: an internally validated prediction model. Am J Obstet Gynecol. 2018;218:134.e1‐134.e8. [DOI] [PubMed] [Google Scholar]
- 12. Rasmussen S, Kiserud T, Albrechtsen S. Foetal size and body proportion at 17–19 weeks of gestation and neonatal size, proportion, and outcome. Early Hum Dev. 2006;82:683‐690. [DOI] [PubMed] [Google Scholar]
- 13. Ogunyemi D, Stanley R, Lynch C, Edwards D, Fukushima T. Umbilical artery velocimetry in predicting perinatal outcome with intrapartum fetal distress. Obstet Gynecol. 1992;80:377‐380. [PubMed] [Google Scholar]
- 14. Morris RK, Malin G, Robson SC, Kleijnen J, Zamora J, Khan KS. Fetal umbilical artery doppler to predict compromise of fetal/neonatal wellbeing in a high‐risk population: systematic review and bivariate meta‐analysis. Ultrasound Obstet Gynecol. 2011;37:135‐142. [DOI] [PubMed] [Google Scholar]
- 15. Kessler J, Rasmussen S, Hanson M, Kiserud T. Longitudinal reference ranges for ductus venosus flow velocities and waveform indices. Ultrasound Obstet Gynecol. 2006;28:890‐898. [DOI] [PubMed] [Google Scholar]
- 16. Morales‐Roselló J, Khalil A, Morlando M, Hervás‐Marín D, Perales‐Marín A. Doppler reference values of the fetal vertebral and middle cerebral arteries, at 19–41 weeks gestation. J Matern Fetal Neonatal Med. 2015;28:338‐343. [DOI] [PubMed] [Google Scholar]
- 17. Acharya G, Wilsgaard T, Berntsen GK, et al. Reference ranges for serial measurements of umbilical artery doppler indices in the second half of pregnancy. Am J Obstet Gynecol. 2005;192:937‐944. [DOI] [PubMed] [Google Scholar]
- 18. Baschat AA, Gembruch U. The cerebroplacental doppler ratio revisited. Ultrasound Obstet Gynecol. 2003;21:124‐127. [DOI] [PubMed] [Google Scholar]
- 19. Figueras F, Meler E, Iraola A, et al. Customized birthweight standards for a Spanish population. Eur J Obstet Gynecol Reprod Biol. 2008;136:20‐24. [DOI] [PubMed] [Google Scholar]
- 20. Ayres‐de‐Campos D, Spong CY, Chandraharan E. FIGO intrapartum fetal monitoring expert consensus panel. FIGO consensus guidelines on intrapartum fetal monitoring: cardiotocography. Int J Gynaecol Obstet. 2015;131:13‐24. [DOI] [PubMed] [Google Scholar]
- 21. Bevans R. Akaike Information Criterion | when & how to Use it (Example). 2022. Scribbr. https://www.scribbr.com/statistics/akaike‐information‐criterion/
- 22. Burnham KP, Anderson DR. Multimodel inference: understanding AIC and BIC in model selection. Sociol Methods Res. 2004;33:261‐304. [Google Scholar]
- 23. Morales‐Roselló J, Khalil A, Fornés‐Ferrer V, et al. Progression of doppler changes in early‐onset small for gestational age fetuses. How frequent are the different progression sequences? J Matern Fetal Neonatal Med. 2018;31:1000‐1008. [DOI] [PubMed] [Google Scholar]
- 24. Baschat AA, Gembruch U, Harman CR. The sequence of changes in doppler and biophysical parameters as severe fetal growth restriction worsens. Ultrasound Obstet Gynecol. 2001;18:571‐577. [DOI] [PubMed] [Google Scholar]
- 25. Turan OM, Turan S, Gungor S, et al. Progression of doppler abnormalities in intrauterine growth restriction. Ultrasound Obstet Gynecol. 2008;32:160‐167. [DOI] [PubMed] [Google Scholar]
- 26. Baschat AA, Güclü S, Kush ML, Gembruch U, Weiner CP, Harman CR. Venous doppler in the prediction of acid‐base status of growth‐restricted fetuses with elevated placental blood flow resistance. Am J Obstet Gynecol. 2004;191:277‐284. [DOI] [PubMed] [Google Scholar]
- 27. Hung JH, Fu CY, Hung J. Combination of fetal doppler velocimetric resistance values predict acidemic growth‐restricted neonates. J Ultrasound Med. 2006;25:957‐962. [DOI] [PubMed] [Google Scholar]
- 28. Morris RK, Selman TJ, Verma M, Robson SC, Kleijnen J, Khan KS. Systematic review and meta‐analysis of the test accuracy of ductus venosus doppler to predict compromise of fetal/neonatal wellbeing in high risk pregnancies with placental insufficiency. Eur J Obstet Gynecol Reprod Biol. 2010;152:3‐12. [DOI] [PubMed] [Google Scholar]
- 29. Carvalho FH, Moron AF, Mattar R, et al. Venous‐arterial doppler ratios in the prediction of acidemia at birth in pregnancies with placental insufficiency. Fetal Diagn Ther. 2006;21:418‐423. [DOI] [PubMed] [Google Scholar]
- 30. Caradeux J, Martinez‐Portilla RJ, Basuki TR, Kiserud T, Figueras F. Risk of fetal death in growth‐restricted fetuses with umbilical and/or ductus venosus absent or reversed end‐diastolic velocities before 34 weeks of gestation: a systematic review and meta‐analysis. Am J Obstet Gynecol. 2018;218:S774‐S782.e21. [DOI] [PubMed] [Google Scholar]
- 31. Francisco RP, Miyadahira S, Zugaib M. Predicting pH at birth in absent or reversed end‐diastolic velocity in the umbilical arteries. Obstet Gynecol. 2006;107:1042‐1048. [DOI] [PubMed] [Google Scholar]
- 32. Baschat AA, Cosmi E, Bilardo CM, et al. Predictors of neonatal outcome in early‐onset placental dysfunction. Obstet Gynecol. 2007;109:253‐261. [DOI] [PubMed] [Google Scholar]
- 33. Frauenschuh I, Frambach T, Karl S, Dietl J, Müller T. Ductus venosus blood flow prior to intrauterine foetal death in severe placental insufficiency can be unaffected as shown by doppler sonography. Z Geburtshilfe Neonatol. 2014;218:218‐222. [DOI] [PubMed] [Google Scholar]
- 34. Frusca T, Todros T, Lees C, Bilardo CM, TRUFFLE Investigators . Outcome in early‐onset fetal growth restriction is best combining computerized fetal heart rate analysis with ductus venosus doppler: insights from the trial of umbilical and fetal flow in Europe. Am J Obstet Gynecol. 2018;218:S783‐S789. [DOI] [PubMed] [Google Scholar]
- 35. Lees C, Marlow N, Arabin B, et al. Perinatal morbidity and mortality in early‐onset fetal growth restriction: cohort outcomes of the trial of randomized umbilical and fetal flow in Europe (TRUFFLE). Ultrasound Obstet Gynecol. 2013;42:400‐408. [DOI] [PubMed] [Google Scholar]
- 36. Lees CC, Marlow N, van Wassenaer‐Leemhuis A, et al. 2 year neurodevelopmental and intermediate perinatal outcomes in infants with very preterm fetal growth restriction (TRUFFLE): a randomised trial. Lancet. 2015;30(385):2162‐2172. [DOI] [PubMed] [Google Scholar]
- 37. Stampalija T, Arabin B, Wolf H, Bilardo CM, Lees C, TRUFFLE investigators . Is middle cerebral artery doppler related to neonatal and 2‐year infant outcome in early fetal growth restriction? Am J Obstet Gynecol. 2017;216:521.e1‐521.e13. [DOI] [PubMed] [Google Scholar]
- 38. Morales‐Roselló J, Cañada Martínez AJ, Scarinci E, Perales MA. Comparison of cerebroplacental ratio, intergrowth‐21st standards, customized growth, and local population references for the prediction of fetal compromise: which is the best approach? Fetal Diagn Ther. 2019;46:341‐352. [DOI] [PubMed] [Google Scholar]
- 39. Morales‐Roselló J, Loscalzo G, Buongiorno S, Perales‐Marín A. Cerebroplacental ratio and estimated fetal weight, the 2 different yardsticks. Am J Obstet Gynecol. 2019;221:664‐665. [DOI] [PubMed] [Google Scholar]
- 40. Morales‐Roselló J, Khalil A, Alberola‐Rubio J, et al. Neonatal Acid‐Base status in term fetuses: mathematical models investigating cerebroplacental ratio and birth weight. Fetal Diagn Ther. 2015;38:55‐60. [DOI] [PubMed] [Google Scholar]
- 41. Meler E, Martinez‐Portilla RJ, Caradeux J, et al. Severe smallness as predictor of adverse perinatal outcome in suspected late small‐for‐gestational‐age fetuses: systematic review and meta‐analysis. Ultrasound Obstet Gynecol. 2022;60:328‐337. [DOI] [PubMed] [Google Scholar]
- 42. Meler E, Mazarico E, Peguero A, et al. Death and severe morbidity in isolated periviable small‐for‐gestational‐age fetuses. BJOG. 2023;130:485‐493. [DOI] [PubMed] [Google Scholar]
- 43. Morales‐Roselló J, Khalil A, Loscalzo G, et al. Cerebroplacental ratio prediction of intrapartum fetal compromise according to the interval to delivery. Fetal Diagn Ther. 2022;49:196‐205. [DOI] [PubMed] [Google Scholar]