Abstract
Artificial sweeteners are widely-used sugar substitutes, but little is known about their long-term effects on cardiometabolic disease risks. Here, we examined the commonly-used sugar substitute erythritol and atherothrombotic disease risk. In initial untargeted metabolomics studies in patients undergoing cardiac risk assessment (n=1,157; discovery cohort, NCT00590200), circulating levels of multiple polyol sweeteners, especially erythritol, were associated with incident (3 year) risk for major adverse cardiovascular events (MACE; includes death or non-fatal myocardial infarction or stroke). Subsequent targeted metabolomics analyses in independent US (n=2,149, NCT00590200) and European (n=833, DRKS00020915) validation cohorts of stable patients undergoing elective cardiac evaluation confirmed this association (4th vs. 1st quartile adjusted HR [95% CI], 1.80 [1.18–2.77] and 2.21 [1.20 – 4.07], respectively). At physiological levels, erythritol enhanced platelet reactivity in vitro and thrombosis formation in vivo. Finally, in a prospective pilot intervention study (NCT04731363), erythritol ingestion in healthy volunteers (n=8) induced marked and sustained (>2 days) increases in plasma erythritol levels well above thresholds associated with heightened platelet reactivity and thrombosis potential in in vitro and in vivo studies. Our findings reveal that erythritol is both associated with incident MACE risk and fosters enhanced thrombosis. Studies assessing the long-term safety of erythritol are warranted.
Introduction
Artificial sweeteners have been widely introduced into the food chain over the past few decades to reduce sugar and calorie intake. With the growing obesity epidemic worldwide1, artificial sweeteners are increasingly common ingredients in soft drinks, processed foods, and personal care products2. In fact, artificial sweeteners have even been detected in ground and tap water3. Though they are generally considered safe by regulatory agencies (e.g. US Food and Drug Administration (FDA)4 and European Union5), little is known about the long-term health effects of artificial sweeteners.
Patients with metabolic diseases, including type 2 diabetes and obesity, are frequently advised that the use of artificial sweeteners in place of sugar can improve glycemic control and help achieve weight loss6–8. However, there is growing epidemiological evidence linking the consumption of artificial sweeteners to adverse cardiometabolic phenotypes, such as weight gain9, insulin resistance10, type 2 diabetes11, and cardiovascular disease (CVD), including atherothrombotic complications12 and cardiovascular mortality13,14. Randomized clinical trials examining the long-term safety of consuming artificial sweeteners have not been performed (even for more early adopted forms such as aspartame and sucralose). Indeed, despite the growing incorporation of artificial sweeteners into the food chain, their cardiovascular risks have seldom been investigated15.
Erythritol is a 4-carbon sugar alcohol (a polyol) that is commonly used as a sugar substitute. It is naturally present in low amounts in fruits and vegetables16, but when incorporated into processed foods, it is typically added at levels 1000-fold higher than endogenous levels (e.g. up to 60% of food weight in some creams or pastry products17,18) due to lower sweetness compared to sucrose16. The daily intake of erythritol in the total US population has been estimated to reach up to 30 g per day in some subjects based on 2013–2014 National Health and Nutrition Examination Survey (NHANES) data and FDA filings18.
Upon ingestion, erythritol is poorly metabolized and mostly excreted in the urine19,20. Consequently, erythritol is characterized as both a ‘zero-calorie’ or ‘non-nutritive’ sweetener, and a ‘natural’ sweetener, leading to its rapidly rising popularity and predicted doubling in market share within the sweetener sector in the next 5 years21. Nevertheless, little is known about circulating erythritol levels and cardiometabolic risks. Early studies have implied potential benefits, including reported antioxidant potential in animal models of diabetes22, as well as improvement in endothelial function after a 4-week ingestion of an erythritol containing drink in patients with diabetes23. However, in a small prospective study, plasma levels of erythritol among freshman college students were associated with incident (9 month) central adiposity weight gain20. In another study, erythritol levels were associated with onset of type 2 diabetes24. Like all polyols, separation of erythritol from its structural isomer is difficult, hindering its analysis and quantification. A detailed examination of the relationship between erythritol and both CVD and atherothrombotic complications has not yet been reported.
Here, after initial untargeted metabolomics studies suggested circulating levels of multiple polyols, especially erythritol, were associated with incident (3 year) risk for major adverse cardiovascular events (MACE=death, myocardial infarction, stroke), we quantitatively examined the relationship between plasma levels of erythritol and incident MACE in distinct US and European validation cohorts. We also examined the impact of erythritol on platelet function in humans at levels observed following ingestion of an artificially sweetened drink, and on in vivo thrombosis potential in animal models of arterial injury.
RESULTS
Untargeted metabolomics and MACE, discovery cohort
We first performed untargeted metabolomics studies in a discovery cohort (n=1,157) comprised of sequential stable patients undergoing elective diagnostic cardiac evaluation with longitudinal (3 years) outcome data (Table 1 and S1 show baseline characteristics). Among known compounds in plasma that were associated with MACE, we identified multiple polyols, including several that are commonly used as artificial sweeteners in food (Extended Data Fig. 1). One of the most widely-used artificial sweeteners with rapidly increasing prevalence in processed and “keto” related foods, erythritol, was among the very top MACE-associated candidate molecules identified (HR 3.22 [95% CI 1.91–5.41], P<0.0001) (Extended Data Fig. 1 and Figure 1).
Table 1:
Clinic characteristics of the discovery and validation cohorts.
| Characteristics | Discovery cohort (n=1157) |
US cohort (n=2149) |
European cohort (n=833) |
|---|---|---|---|
| Age (yr) | 65.0(55–72) | 62.9(55–71) | 75.0(66–81) |
| Male (%) | 63.6 | 64.0 | 70.1 |
| BMI (kg/m2) | 29.2(25.5–32.2) | 29.4(25.4–32.1) | NA |
| Diabetes mellitus (%) | 22.0 | 22.1 | 27.9 |
| Hypertension (%) | 72.2 | 70.4 | 80.4 |
| Current smoking (%) | 13.7 | 12.7 | 16.8 |
| Coronary artery disease (%) | 75.5 | 75.0 | 69.3 |
| Heart failure (%) | 16.7 | 19.4 | 17.8 |
| History of myocardial infarction (%) | 46.3 | 39.5 | 49.6 |
| Low-density lipoprotein (mg/dl) | 96.0(80.0–115.0) | 96.0(77.0–117.0) | 91.5(69.0–122.0) |
| High-density lipoprotein (mg/dl) | 34.3(28.5–41.2) | 34.3(28.2–41.7) | 48.0(39.0–60.0) |
| Total cholesterol (mg/dl) | 163.8(142.7–188.2) | 160.8(138.5–187.4) | 161.0(134.8–195.0) |
| Triglycerides (mg/dl) | 122.0(84.0–171.0) | 114.0(84–163) | 118.0(89.0–167.0) |
The baseline characteristics of participants in the discovery cohort, and both validation cohorts (US, and European) are shown. Continuous data are presented as median (25th and 75th percentiles). Categorical variables are presented as %.
Figure 1. Kaplan–Meier estimates and forest plots indicating the risks of Major Adverse Cardiovascular Events (MACE), according to erythritol quartile level.
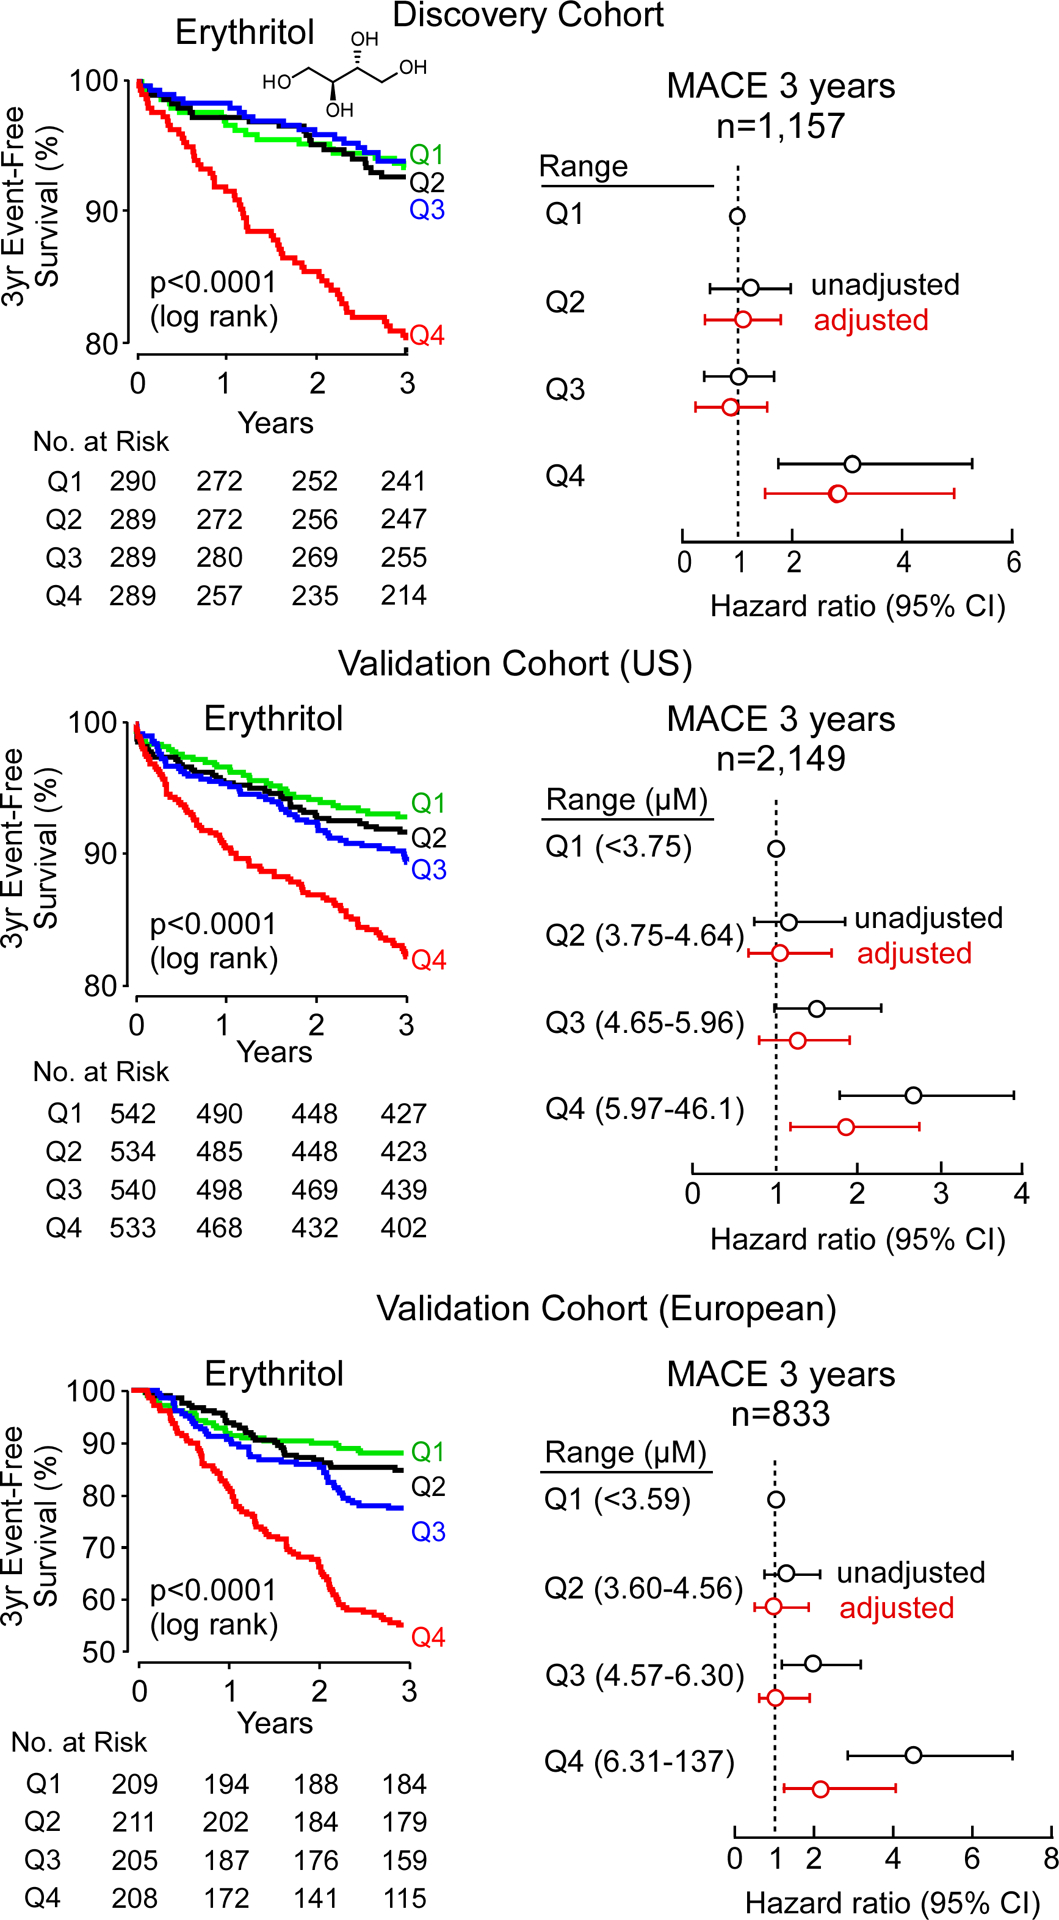
Data shown are for the discovery cohort (upper panel), and two validation cohorts (US cohort, middle panel and European cohort, lower panel). The adjustment in discovery and US cohort included age, sex, type 2 diabetes, systolic blood pressure, body mass index (BMI), low-density and high-density lipoprotein cholesterol, triglyceride, and current smoking status. In the European Cohort, the adjustment included all of the aforementioned variables except for BMI (not available), and instead of systolic blood pressure, hypertension was used. Hazard ratios are indicated by data points in the centre (open circles). The 5–95% confidence interval is indicated by line length.
Targeted metabolomics analyses of erythritol, Validation cohorts
Many polyols are structural isomers of one another, sharing the same molecular weight and elemental composition, and only differing in stereochemistry, making the separation and quantification of these compounds challenging. Since untargeted metabolomics studies are only semi-quantitative and were not optimized to distinguish between structural isomers, we sought to confirm the identification of erythritol as a candidate metabolite associated with MACE risk. We thus developed a stable isotope dilution LC/MS/MS assay specifically to separate and quantify erythritol from its structural isomer (threitol) (Extended Data Fig. 2). Then, we used this method to examine two independent validation cohorts comprised of subjects with longitudinal cardiovascular outcome data – namely, a US cohort (n=2,149) and a European cohort (n=833) (Table 1, S2 and S3). Both cohorts were enrolled at quaternary referral centers with large catchment areas with high prevalence of CVD and risk factor burden, including type 2 diabetes and obesity (i.e. individuals for whom avoidance of sweets and weight reduction efforts are routinely recommended). In both validation cohorts, plasma levels of erythritol were higher among individuals with prevalent CVD (P<0.0001 each; Extended Data Fig. 3); higher levels of erythritol were also observed among those who experienced an incident MACE over the ensuing 3 years of follow-up (P<0.0001 each; Extended Data Fig. 3). Further, in both cohorts, higher incident event risk was observed with higher levels of erythritol in Kaplan-Meier analyses (Figure 1). In Cox proportional hazard regression analyses, compared to participants in the lowest quartile of erythritol levels, those in the highest quartile had a significantly increased incident event risk in both validation cohorts (HR [95% CI] = 2.64 [1.79 – 3.90] and 4.48 [2.86 – 7.02] for US cohort and European cohort, respectively, p<0.0001 each, Figure 1). Consistent with the results observed within the discovery cohort (adjusted HR 2.95 [1.70–5.12], p<0.001, Figure 1, Table S4), the association between erythritol levels (4th quartile versus 1st quartile) and incident MACE risk remained significant in both US and European validation cohorts following adjustments for cardiovascular risk factors (adjusted HR [95% CI], 1.80 [1.18–2.77] and 2.21 [1.20 – 4.07], P=0.007 and P=0.010, respectively) (Figure 1, Table S5 and S6). The addition of history of coronary artery disease to the model (i.e. coronary artery disease plus traditional CVD risk factors) did not materially change the association of erythritol with incident MACE (HR 1.79 [1.17–2.74] and 2.14 [1.15–3.98], P=0.007 and P=0.016 for the US and European validation cohort, respectively). Further, the association between erythritol and MACE risk was observed in both males and females alike (Table S7, S8 and S9), and was also observed to hold true among multiple different subgroups in both US and European validation cohorts (Figure 2, Table S10 and S11). In adjusted Cox regression models where erythritol was treated as a continuous variable, erythritol was independently associated with MACE in all 3 observational cohorts (discovery, and both US and European validation cohorts, Table S12, S13 and S14). Specifically, per 1 μM increase in erythritol levels, there was a 21% and 16% increase in the adjusted HR for MACE in the US and European validation cohorts, respectively (P <0.001 and P=0.005; Table S13 and S14).
Figure 2. Long term risk of Major Adverse Cardiovascular Events (MACE) among patient subgroups.
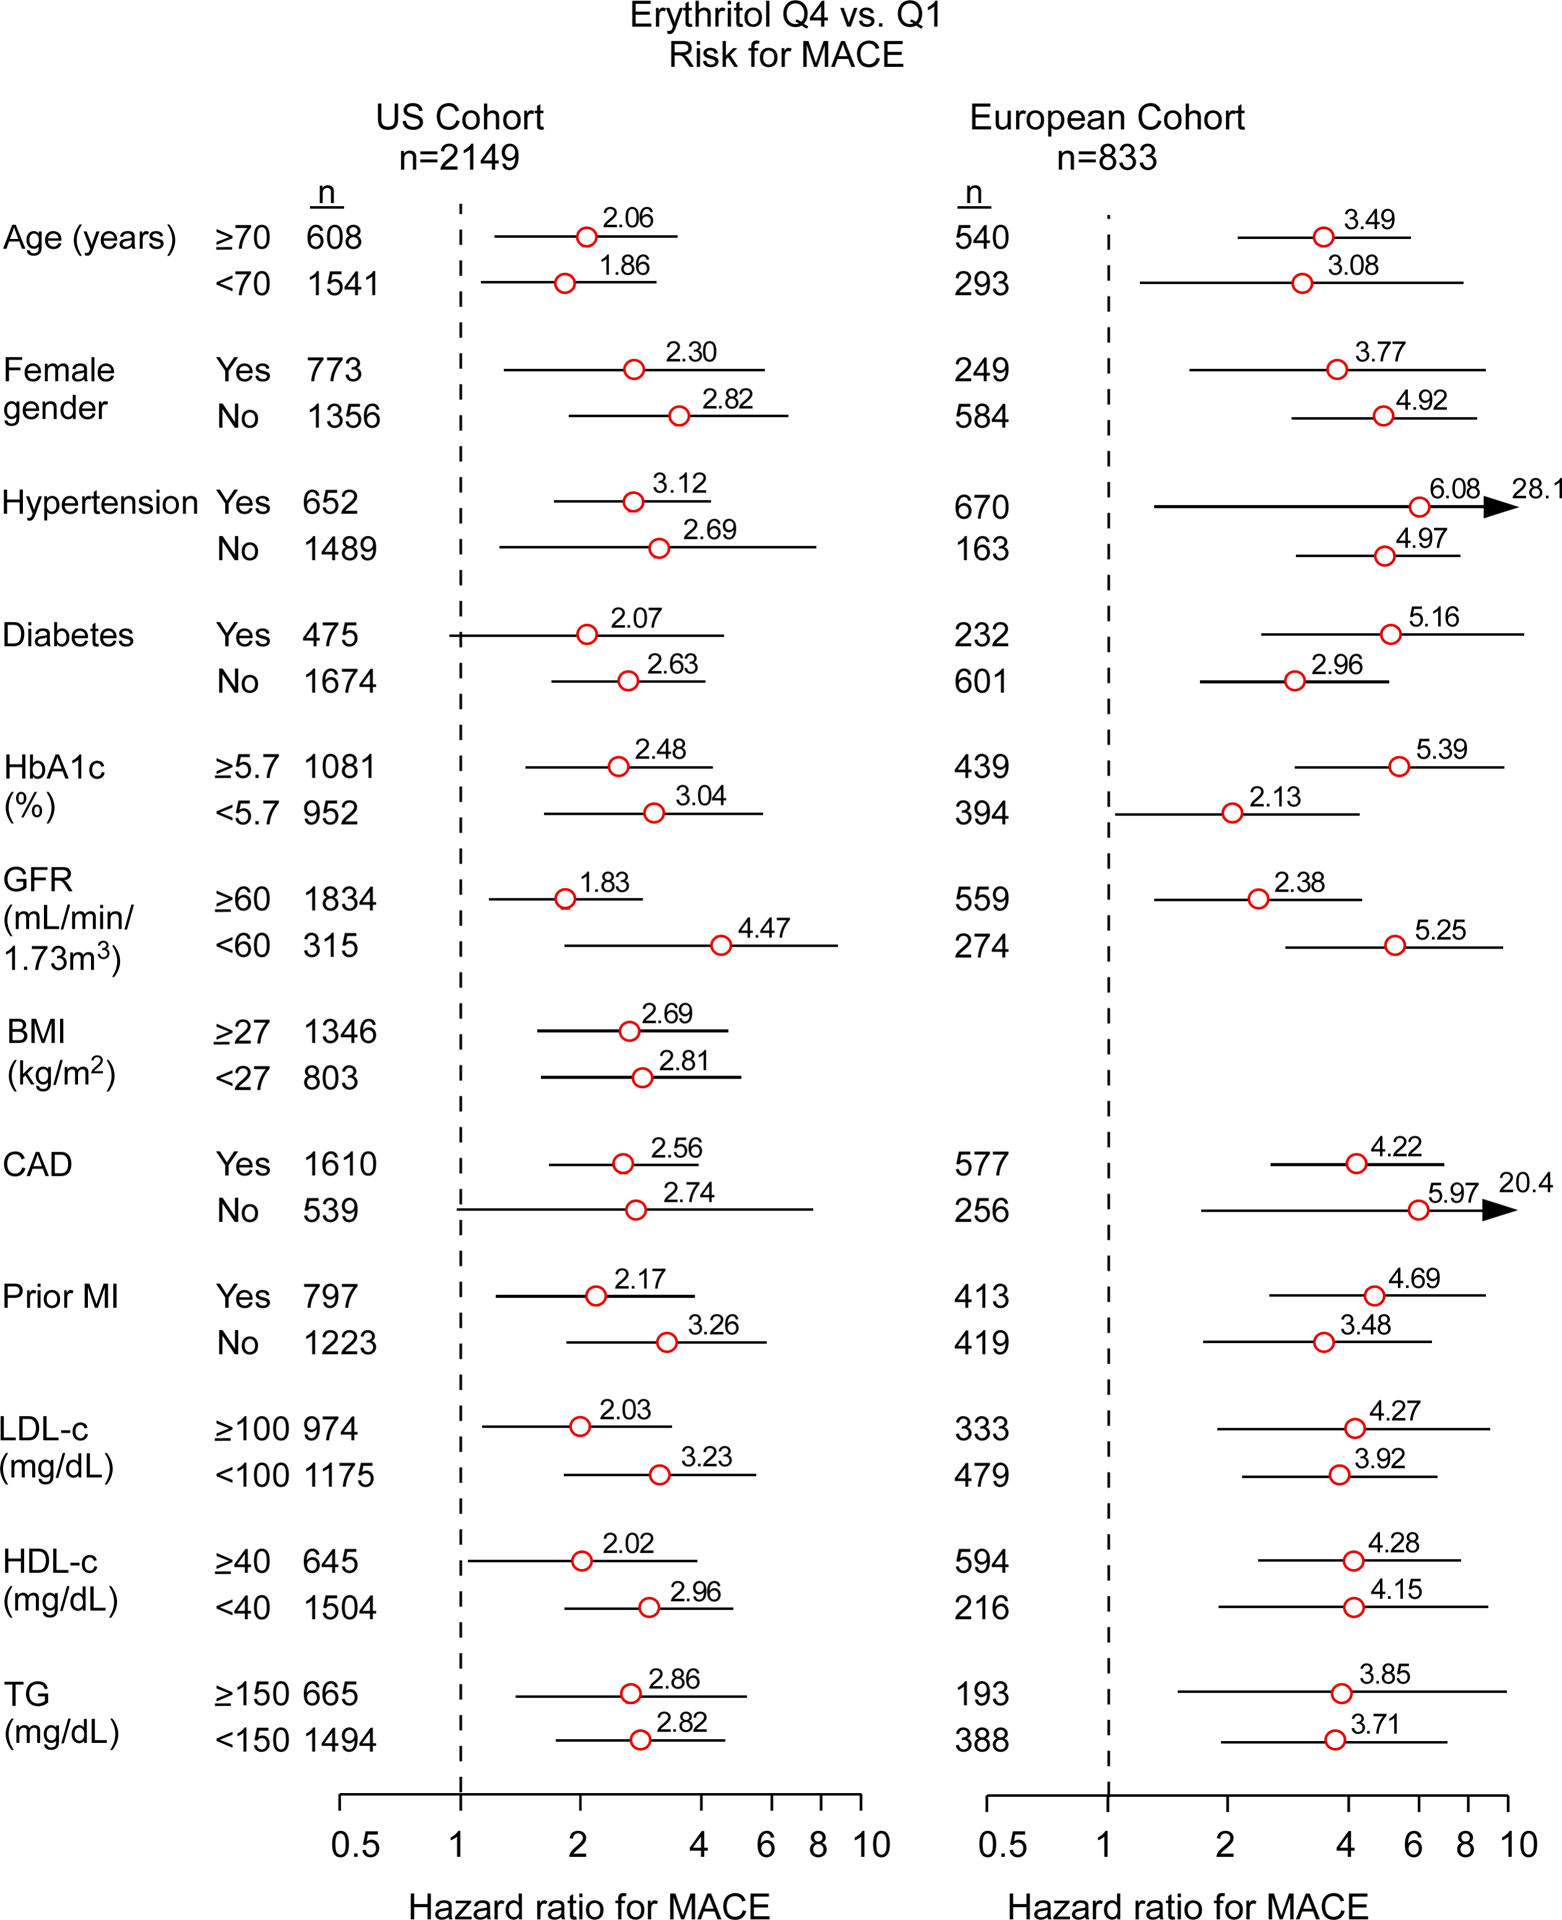
Hazard ratios (HR) for 3 year MACE based on Cox proportional-hazards regression analysis compare top to bottom quartiles (Q) for the US cohort (left panel) and European cohort (right panel). Data points (open circles) in the centre indicate HR (with point estimates shown to the right), 95% confidence intervals are represented by line length. N numbers for each subgroup are indicated. P values for interaction with the groups and tabular data are shown in TableS10 and S11.
Erythritol exposure and platelet responsiveness
The positive association observed between circulating erythritol levels and incident thrombotic event risk led us to explore whether erythritol impacted platelet function. In these initial studies, we were careful to use erythritol concentrations within the range observed among the fasting samples examined in subjects from the US and European validation cohorts. Incubation of human platelet-rich plasma (PRP) recovered from healthy volunteers with a physiological level of erythritol versus vehicle resulted in a significant increase (i.e. leftward shift in dose response curve of different agonists) in stimulus-dependent platelet aggregation response to submaximal concentrations of two known platelet agonists: adenosine diphosphate (ADP) and thrombin receptor-activated peptide (TRAP6) (Figure 3A and Extended Data Fig. 4). In parallel experiments, a fixed submaximal dose of platelet agonist (ADP or TRAP6) was used, and the effect of increasing erythritol levels on platelet aggregometry response was monitored. Across the physiologically relevant concentration range observed in fasting plasma samples, erythritol dose-dependently enhanced platelet aggregation in PRP (Figure 3A). In contrast, no effect on platelet aggregation responses was observed with either glucose, the most common polyol, or 1,5-anhydroglucitol (AHG), a well-established polyol surrogate of glycemic control (Extended Data Fig. 5 and 6A). Incidentally, we note that 1,5-AHG was negatively associated with cardiovascular event risks in our initial untargeted metabolomics studies (discovery cohort, Extended Data Fig. 1), as well as in prior reports from large epidemiological studies25. Because aggregation responses in platelet rich plasma can be influenced by factors independent of platelets, and to directly test whether erythritol impacts platelet function, we isolated platelets from healthy volunteers and then examined the effect of brief (30 min) exposure to physiological levels of erythritol versus either vehicle control or 1,5-AHG as a control on multiple indices of platelet functional responses. Notably, erythritol, but not 1,5-AHG, enhanced intracellular cytosolic Ca2+ concentrations in washed human platelets following exposure to submaximal (0.02 U/mL) thrombin (Figure 3B, Extended Data Fig. 6B). Similarly, exposure of washed human platelets to erythritol, but not vehicle, glucose, or 1,5-AHG, caused a dose-dependent enhancement in multiple platelet activation phenotypes, including ADP-stimulated P-selectin surface expression and glycoprotein α2β3 (GP IIb/IIIa) activation (Figure 3B and 3C, Extended Data Fig. 7).
Figure 3. Erythritol enhances platelet responsiveness.
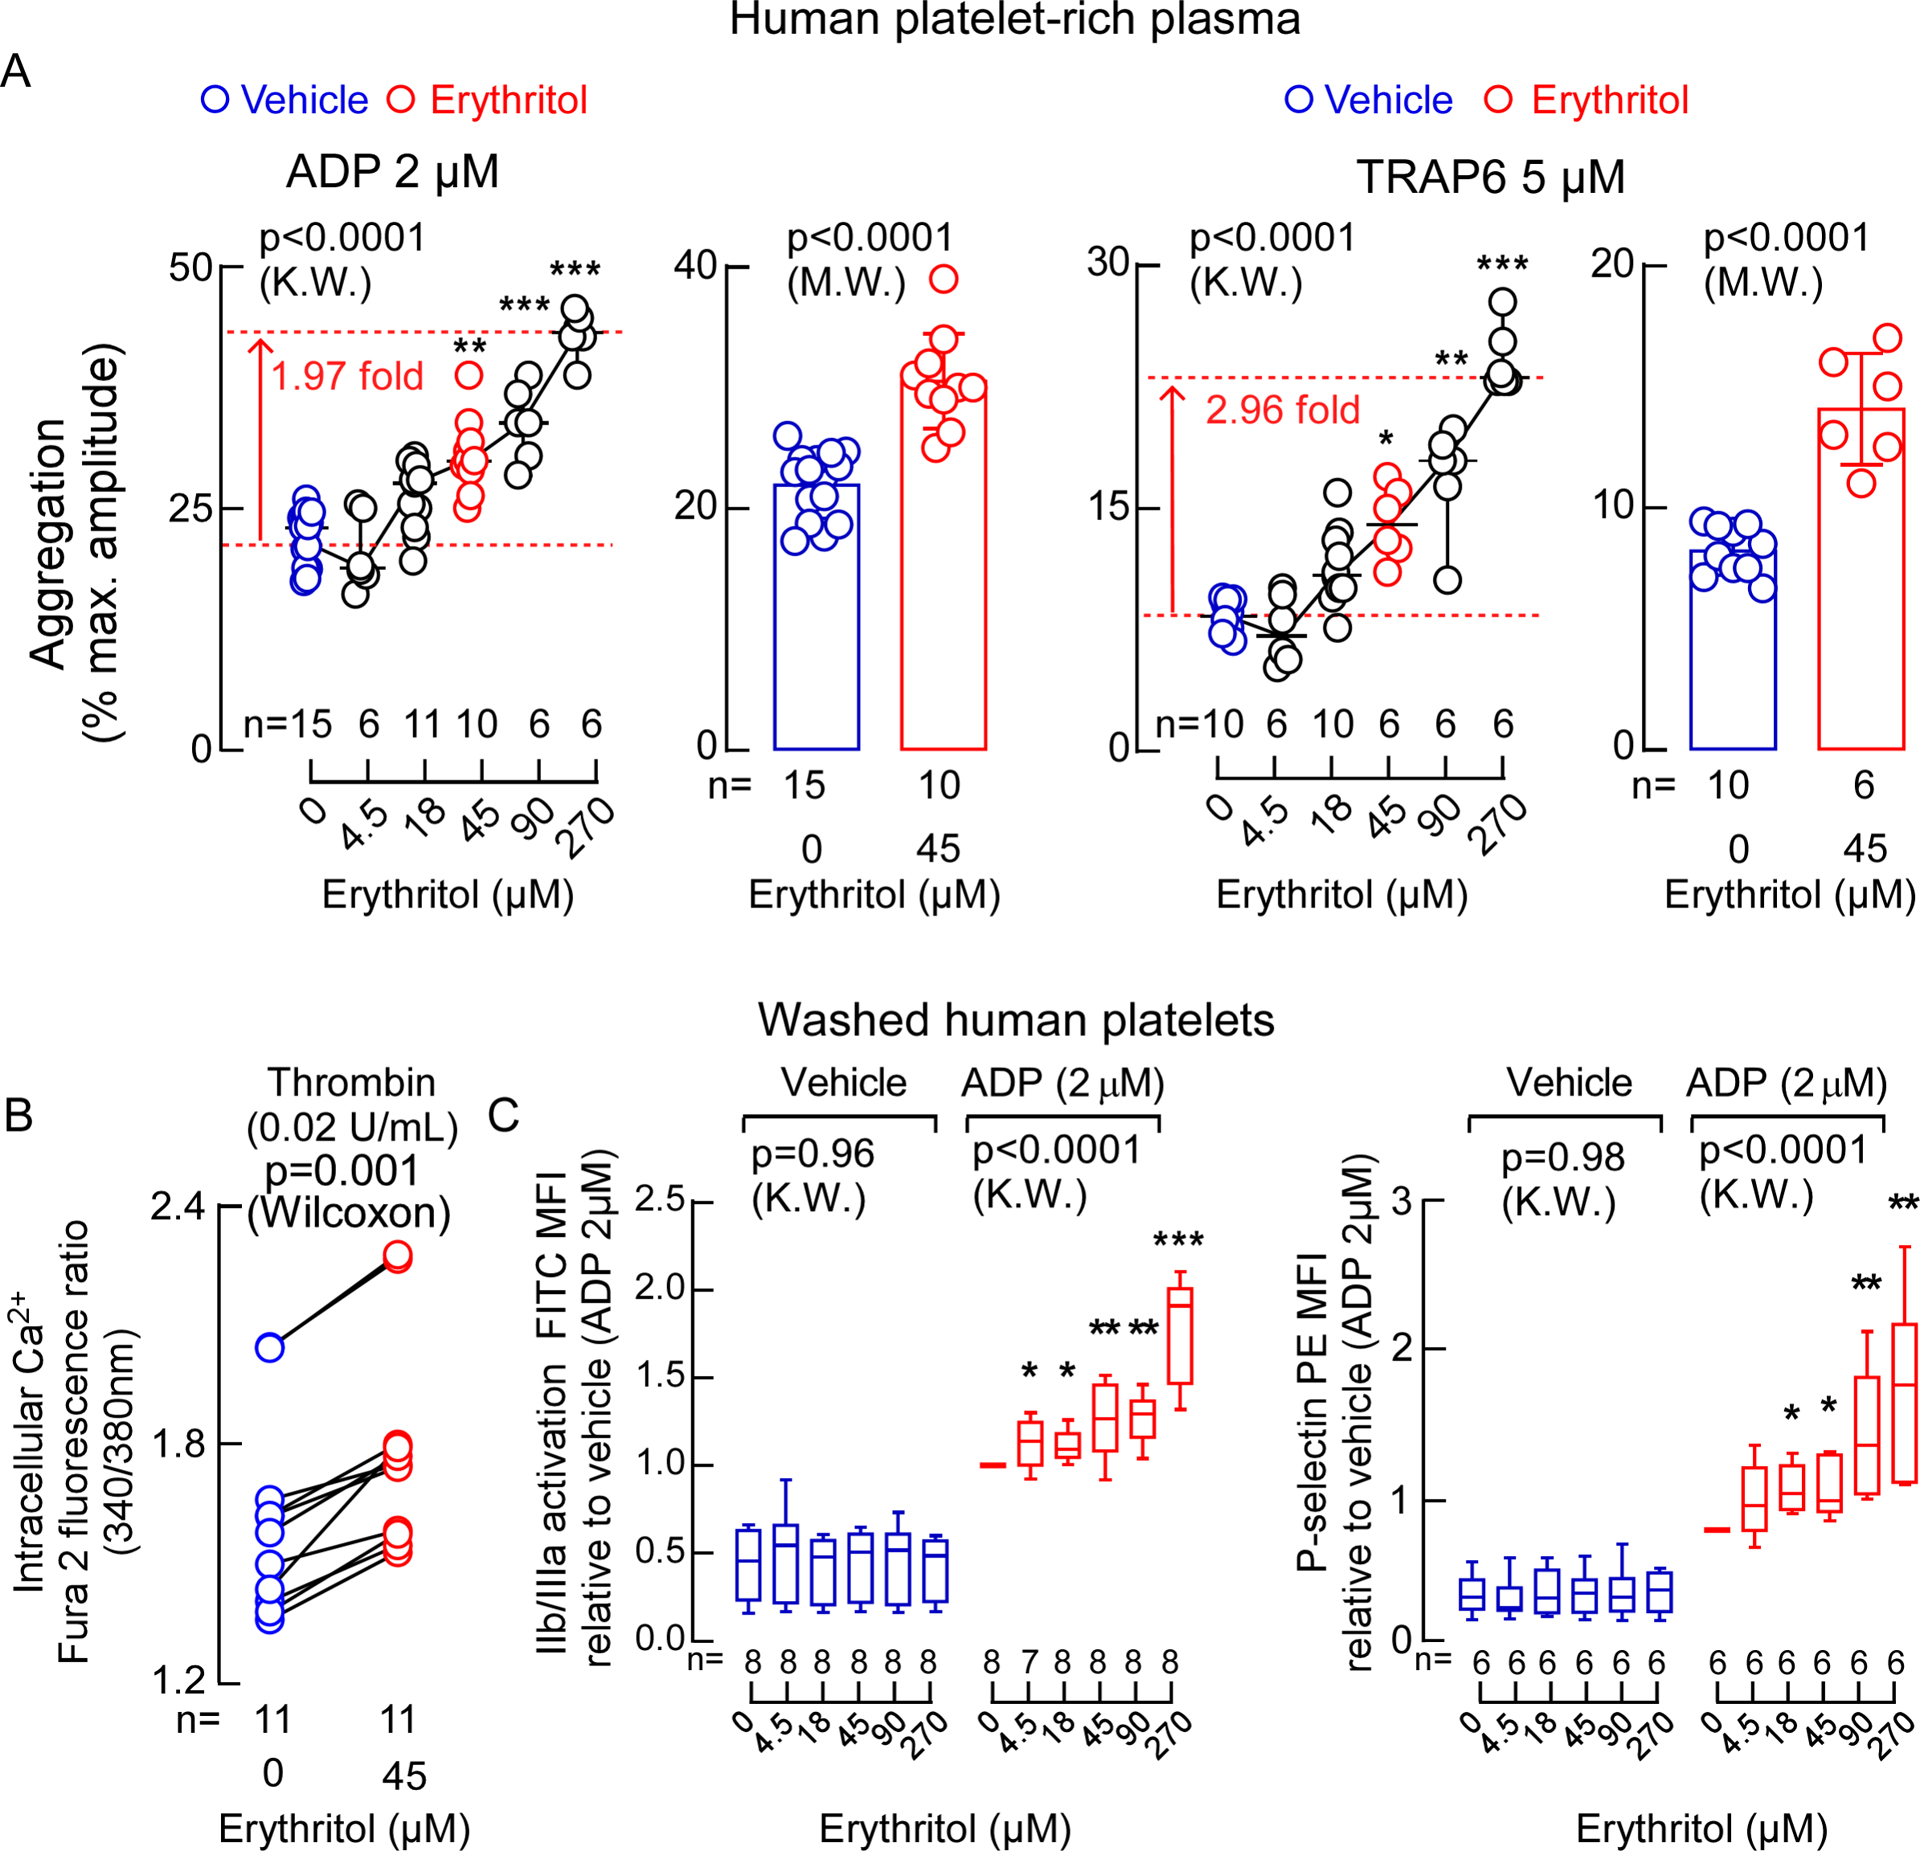
A. Bar graphs show submaximal ADP-stimulated (2 μM) and Thrombin receptor-activating peptide 6 (TRAP6)-stimulated (5 μM) platelet aggregometry responses of human platelet-rich plasma following incubation with erythritol (45 μM, red) versus normal saline (vehicle, blue). Data are represented as means (±SD), and P values were calculated by two-tailed Mann Whitney Test. Scatter plots show aggregometry with varying concentrations of erythritol and fixed submaximal level of ADP (2 μM) or TRAP6 (5 μM) including the data that is used in the bar graphs. P values were calculated by two-sided Kruskal Wallis test with Dunn’s post hoc test. For ADP-stimulated PRP, n=15 for vehicle, n=6 for Erythritol 4.5 μM, n=11 for Erythritol 18 μM, n=10 for Erythritol 45 μM, n=6 for Erythritol 90 and 270 μM. For TRAP6-stimulated PRP, n=10 for vehicle, n= 6 for Erythritol 4.5 μM, n=10 for Erythritol 18 μM, n=6 for Erythritol 45, 90 and 270 μM. (*p < 0.05; **p < 0.01; ***p < 0.001). Dunn’s adjusted P values for ADP-stimulated PRP (Erythritol vs. vehicle): Erythritol 45 μM P=0.002, Erythritol 90 μM P=0.0008, Erythritol 270 μM P<0.0001. Dunn’s adjusted P values for TRAP6-stimulated PRP (Erythritol vs. vehicle): Erythritol 45 μM P=0.02, Erythritol 90 μM P=0.002, Erythritol 270 μM P<0.0001. B. Thrombin-induced (0.02 U) changes in intracellular calcium concentration [Ca2+] in Fura 2-filled washed human platelets incubated with erythritol. P values were calculated by two-sided Wilcoxon matched-pairs signed rank test. n=11 per group. C. ADP-induced changes in GP IIb/IIIa (PAC-1 antibody staining) and P-selectin surface expression in washed human platelets pre-incubated with the indicated concentrations of erythritol. Boxes show 25th and 75th percentiles. The line in the box (centre) is the median, whiskers represent minimum and maximum values. P values were calculated by two-sided Kruskal Wallis test with Dunn’s post hoc test for all samples. For GP IIb/IIIa activation, n=7 for ADP-stimulated PRP exposed to erythritol 4.5 μM, for all other conditions n=8 per group. For P-selectin surface expression n=8 per group. (*p < 0.05; **p < 0.01; ***p < 0.001). Dunn’s adjusted P values for GP IIb/IIIa activation (Erythritol vs. vehicle): Erythritol 4.5 μM P=0.04, Erythritol 18 μM P=0.02, Erythritol 45 μM P=0.003, Erythritol 90 μM P=0.002, Erythritol 270 μM P<0.0001. Dunn’s adjusted P values for P-selectin surface expression (Erythritol vs. vehicle): Erythritol 18 μM P=0.03, Erythritol 45 μM P=0.04, Erythritol 90 μM P=0.005, Erythritol 270 μM P=0.001. Each data point represents an individual measurement or the average of multiple measurments of a distinct sample. There were no repeated measurements within the data shown.
Erythritol and thrombosis potential in human whole blood, and in vivo
We further examined the effect of erythritol on platelet adhesion, the initial step in clot formation, in human whole blood under physiological shear conditions using a microfluidics device. Erythritol elicited significant enhancement in the rate of collagen-dependent platelet adhesion and thrombus formation (Figure 4A). The impact of erythritol on in vivo thrombosis potential was further examined in mice by monitoring both the rate of clot formation and the time to cessation of blood flow using a FeCl3-induced carotid artery injury model26. Notably, when compared to either saline (vehicle) or 1,5-AHG, elevation of circulating erythritol levels elicited marked enhancement in the rate of thrombus formation, as well as significant reduction in the time to cessation of blood flow following arterial injury (Figure 4B).
Figure 4. Erythritol enhances in vivo thrombosis formation.
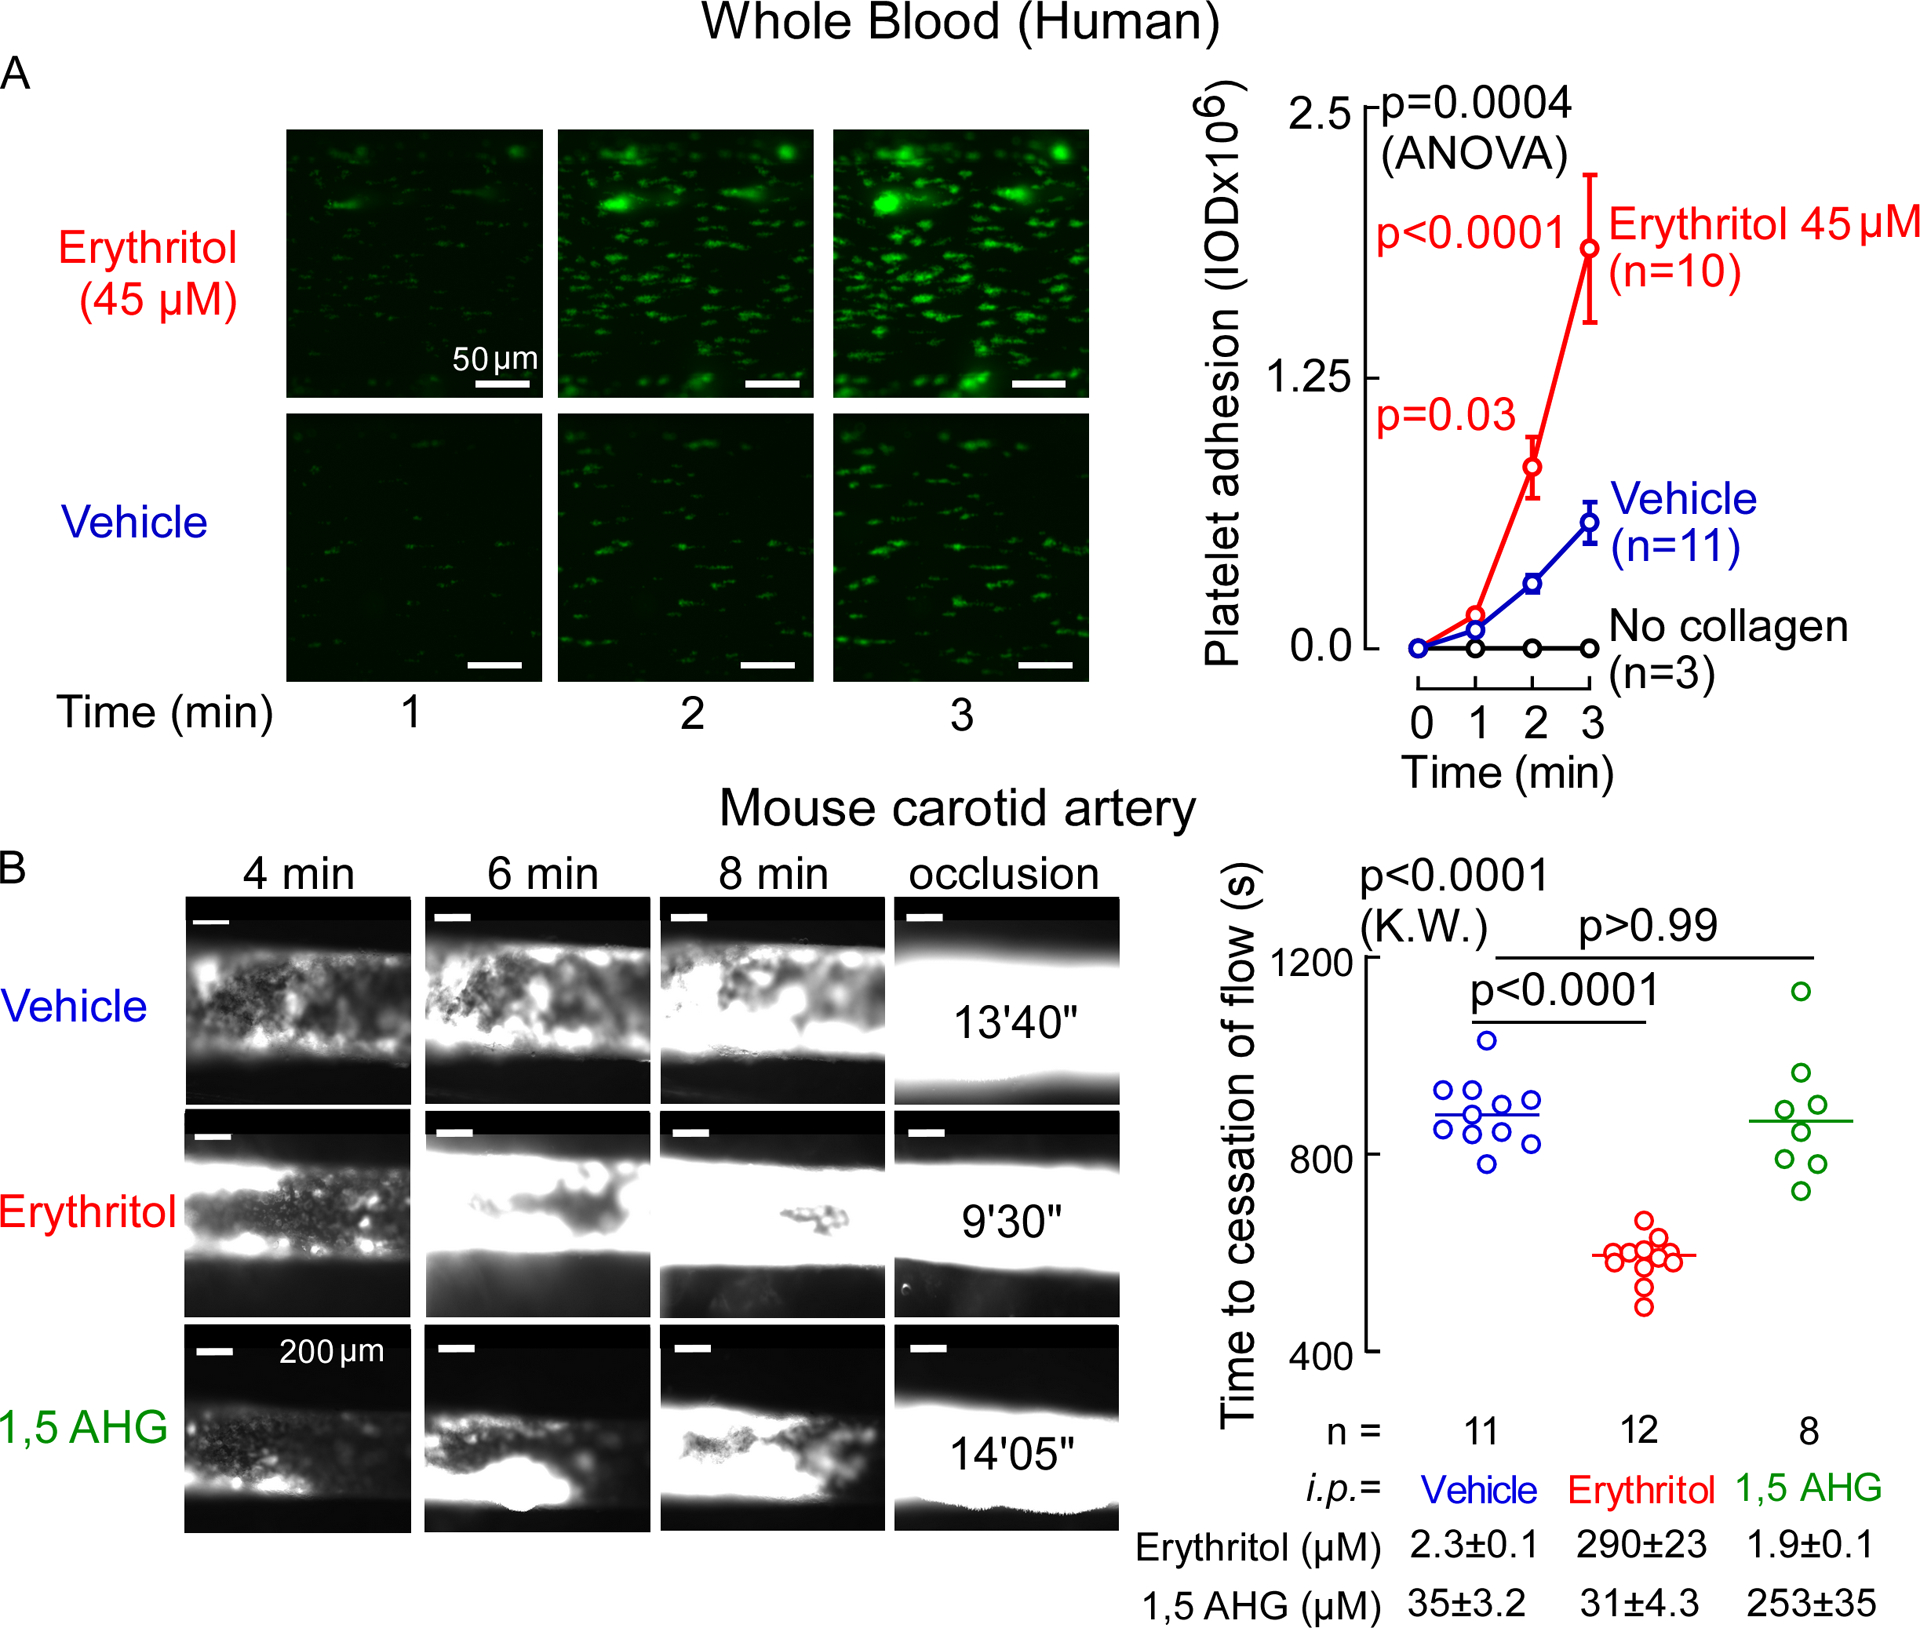
A. Human platelet adhesion in whole blood to a collagen-coated microfluidic chip surface under physiological shear conditions ± erythritol. Individual biological samples we used and followed over 3 min. Representative images of platelet (green) adhesion at the indicated times (scale bar, 50 μm). P values were calculated by 2-way repeated measures analysis of variance with Sidák’s post hoc test. Overall P value (erythritol effect) is shown in black, Sidák’s post hoc test P values are shown in red over the 3 follow-up times. Data is represented as means (±SEM). n= 10 for erythritol, n=11 for vecihle, n=3 for no collagen control. B. Representative micrographs of carotid artery thrombus formation at the indicated time points following FeCl3-induced carotid artery injury (scale bar, 200 μm) and time to cessation of blood flow in mice from indicated groups i.p. injected with vehicle or erythritol. Bars represent means, two-sided P values were calculated by Kruskal Wallis test with Dunn’s post hoc test. n=11 for vehicle, n=12 for erythritol, n=8 for 1,5 anhydroglucitol(AHG).
Postprandial levels of erythritol in healthy individuals
Since numerous “zero calorie” or “keto” friendly prepared foods and beverages can possess relatively large quantities of erythritol17,18, we thought it would be of interest to assess the physiological range in circulating erythritol levels observed following a relevant dietary exposure. We thus examined postprandial erythritol plasma levels in healthy participants (n=8) following an erythritol-sweetened drink (30 g), an erythritol exposure comparable to a single can of commercially available artificially sweetened beverage, a pint of keto ice cream, or other foods or beverages containing erythritol. While plasma levels of erythritol were low at baseline (median [25th and 75th percentiles], 3.84 [3.27–4.14] μM), they remained 1000-fold higher (millimolar levels) for hours after ingestion (e.g. at 30 min, 5.85 [4.30–7.68] mM), and remained significantly elevated for over 2 days in all participants examined (Figure 5). Notably, the elevation in erythritol levels observed remained well above thresholds observed for concentrations of erythritol that elicit significant increases in multiple indices of platelet function, including stimulus-dependent (thrombin) increases in intracellular calcium (45 μM, Figure 3), ADP- or thrombin-stimulated aggregometry responses (18 μM each, Extended Data Fig. 8), and stimulus-dependent enhancement in P-selectin or activated GP IIbIIIa surface expression (18 μM and 4.5 μM, respectively, Figure 3).
Figure 5. Effects of an Erythritol challenge on mean plasma levels.
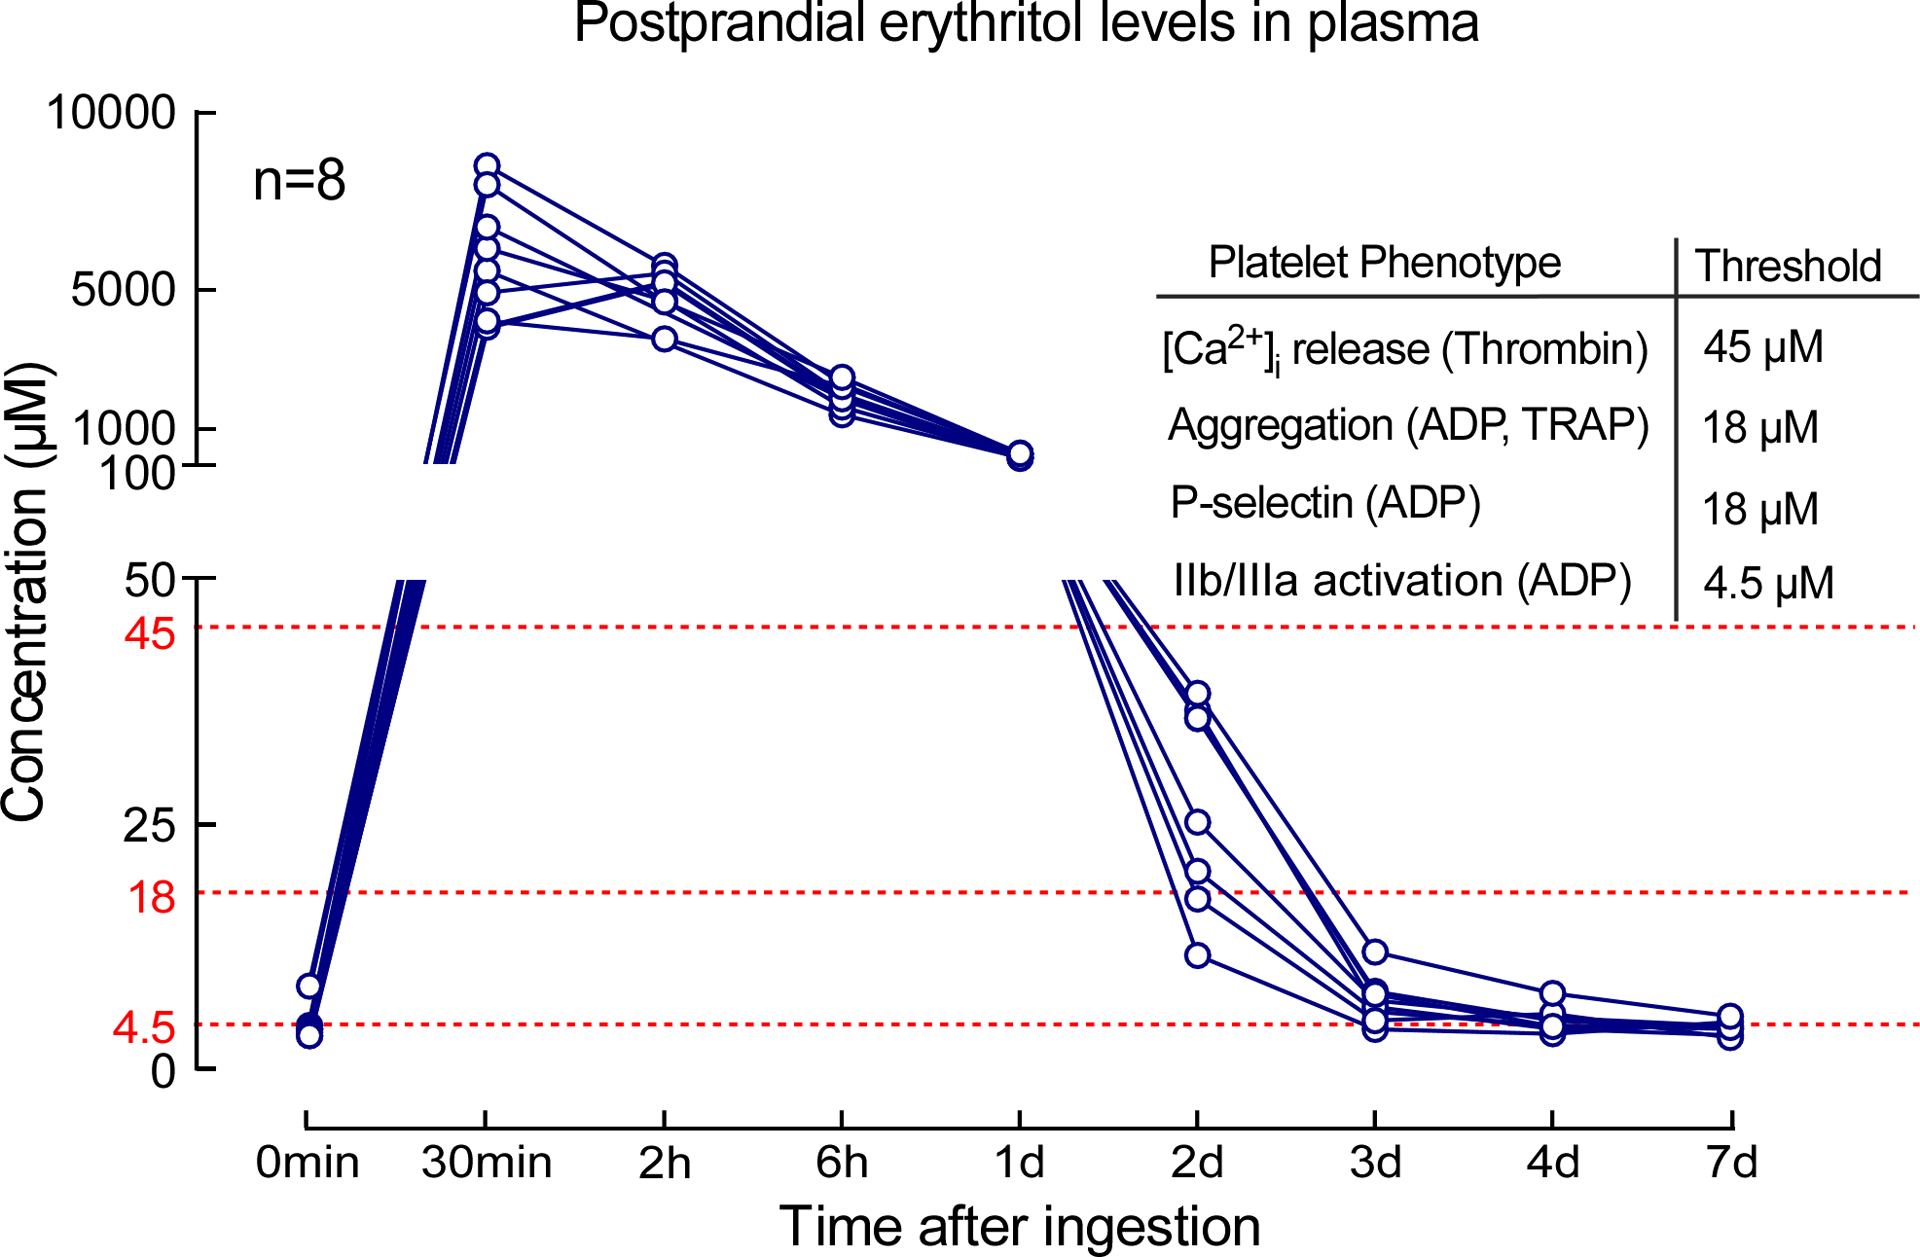
Study participants (n=8) were given 30 g of erythritol in a drink, and plasma levels were measured over the course of 7 days. Thresholds indicated (red) represent the erythritol concentrations noted in dose-response studies where significant increase in the indicated measure of platelet responsiveness was observed.
Discussion
In the present studies, we used an initial untargeted metabolomics approach as a discovery platform to identify circulating metabolites associated with incident CVD event risk. While untargeted metabolomics is only semi-quantitative in nature, these qualitative results suggested that multiple polyols in general, and erythritol specifically, are associated with incident CVD risks. Across both US and European validation cohorts, we confirmed that circulating levels of erythritol were associated with incident adverse cardiovascular event risk independent of traditional CVD risk factors. Sensitivity analyses showed that this association remained significant in multiple different subgroups across both cohorts. Furthermore, through mechanistic studies, multiple lines of evidence indicate that elevated erythritol levels can directly contribute to heightened platelet reactivity and thrombosis risk by enhancing platelet intracellular calcium release and aggregation in response to multiple agonists. Specifically, the use of a preclinical in vivo thrombosis model similarly indicates higher rates of clot formation and increased thrombosis potential following arterial injury when plasma erythritol levels are elevated. Our findings suggest the need for further safety studies examining the long-term effects of artificial sweeteners in general, and erythritol specifically, on risks for heart attack and stroke, particularly in subjects at higher risk for CVD.
Erythritol is endogenously produced by the pentose phosphate pathway20,27, and the metabolite is readily observed in circulation. We speculate that erythritol levels in both validation cohorts originate from a combination of ingestion and endogenous production . While fasting samples in the US validation cohort (where enrollment largely preceded proliferation of erythritol in processed foods) likely reflect endogenous levels, our intervention study clearly shows prolonged elevation of erythritol after ingestion. So even in fasting individuals, erythritol levels may reflect post-prandial levels (e.g. in the more recently recruited EU validation cohort that enrolled participants well into 2018).
Since the discovery of microbial fermentation processes that allowed for large-scale industrial production of erythritol in the 1990s, the sweetener has increasingly been added to processed foods, with rapid approval for its use in many countries around the world (and applications are still increasing)28. Potential benefits of erythritol’s use as an artificial sweetener that contribute to its rapidly growing market penetration include a high digestive tolerance (a daily dose up to 1 g/kg is well tolerated), presumed non-carcinogenic and antioxidant effects, and perceived qualitative sweetness improvements that make erythritol commercially used to sweeten food both alone and as a bulk sweetener in combination with other high intensity sweeteners16,22,29,30. Studies report erythritol has no short-term insulinemic or glycemic effects, therefore it has been considered well-suited for patients with impaired glucose control or obesity30. Erythritol’s safety has been assessed by short-term animal toxicity studies and reported human clinical studies with ingestion up to 4 weeks23,31. Based on these studies, along with its natural occurrence both endogenously in human tissues and in food (albeit at levels 1000-fold lower than used as additive to processed foods), erythritol is “generally recognized as safe” by both the EU and the FDA17,18. The World Health Organization (WHO)/ Food and Agriculture Organization of the United Nations (FAO) Expert Committee on Food Additives assigned an acceptable daily intake that is “not specified”17. The FDA does not require disclosure of erythritol content in food products, making its levels in foods as an additive hard to track. Many observational epidemiological studies report that artificial sweetener use is associated with various adverse health outcomes including CVD mortality9–11,13,14,32–35, while others do not36,37. One possible explanation for these conflicting findings is the difficulty in reliably quantifying dietary artificial sweetener consumption. In addition, “artificial sweeteners” are often (typically) reported in aggregate due to non-disclosure policies on food-labels. This limits the specification of individual sweeteners on labels, and also the ability to monitor adverse long-term outcomes with individual sweeteners in clinical studies. Further, this has led to difficulties in linking the amount of dietary artificial sweetener use with circulating levels. The present results highlight the need to establish reporting requirements, safety profiles, and margins of daily intake amounts given that broad consumption continues to increase. Public policy decisions need to be evidence-based and better informed.
In one randomized intervention study, the artificial sweeteners saccharin and sucralose were linked to impaired glycemic responses in participants38. In a population based prospective cohort study with repeated dietary records, ingestion of multiple artificial sweeteners (e.g. aspartame, acesulfame potassium, and sucralose) was associated with cardiovascular disease risk39. Meta analyses of both the limited number of brief randomized controlled trials (median follow-up of only 3 to 6 month) and observational studies with artificial sweeteners concluded that low calorie sweeteners and non-nutritive sweeteners do not provide the intended benefits, and instead are associated with adverse cardiometabolic phenotypes, including weight gain, increased body fat, type 2 diabetes, and cardiovascular events40,41, while other clinical trials meta analyzed suggested potential small improvements42,43. Meanwhile, intervention safety studies on artificial sweeteners are conducted over relatively short durations, and have been criticized both for inadequately capturing long-term exposure, and for differing from real-life practice44.
A previous study employing untargeted metabolomics specifically reported relative erythritol levels. Using samples from the Atherosclerosis Risk in Communities (ARIC) study, it was proposed that 19 different analytes (one of which was erythritol), when cumulatively included in a risk score, could provide additive predictive value for incident coronary heart disease45. The general lack of reporting of erythritol in the literature might be due in part to difficulties in quantification of erythritol, like other polyols, due to its structural isomers. The present studies suggest that following ingestion of an artificially sweetened food harboring typical levels of erythritol as artificial sweetener, plasma levels of erythritol remain elevated for many days, well above the thresholds necessary to enhance stimulus-dependent platelet reactivity, even amongst healthy volunteers. Our erythritol pharmacokinetics studies served to identify postprandial peak levels and the time course of elimination. Based on these pilot studies in a limited number of people, all subjects included had elevated plasma levels for approximately 2 days (Figure 5). Further studies are needed to more fully examine the impact of elevated post-prandial erythritol levels in subjects, in particular in the presence of impaired renal function, and CVD.
This study has several limitations. Measurement of erythritol in the clinical cohort study was only performed once as an overnight fasting level at time of enrolment. Whether serial measures would provide enhanced prognostic value for incident CVD risks remains unknown. Since patients in our observational cohorts were recruited at quartenary referral centers and show a high prevalence of CVD and traditional risk factors, the translatability of our findings to the general population needs to be determined. However, in our sensitivity analyses, it should be noted that the clinical prognostic value of erythritol was widely observed, including numerous lower risk subgroups. Another limitation of our clinical observational studies is that by design, these studies can only show association, and not causation. We also recognize the possibility of unmodelled confounding (e.g. diet) that may have (directly or indirectly) impacted our results by factors that are not included in our models. However, our numerous in vitro, ex vivo, and preclinical mechanistic studies with erythritol provide evidence that the clinical associations observed arise from an underlying causal connection between erythritol and CVD-relevant phenotypes. We also note that vascular disease and thrombosis are multifactorial phenotypes. The association of circulating erythritol levels with incident CVD event risks and enhanced thrombosis formation in preclincial models may thus involve factors beyond platelet responsiveness.
In summary, the present studies suggest that trials investigating the impact of erythritol specifically, and artificial sweeteners in general, with appropriate duration of follow-up for clinically relevant outcomes, are needed. Following exposure to dietary erythritol, a prolonged period of potentially heightened thrombotic risk may occur. This is of concern given that the very subjects for whom artificial sweeteners are marketed (patients with diabetes, obesity, history of CVD and impaired kidney function) are those typically at higher risk for future CVD events.
Methods
Information and requests for resources and reagents should be directed to and will be fulfilled by the Lead Contact, Stanley L. Hazen (hazens@ccf.org). All unique/stable reagents generated in this study are available from the Lead Contact with a completed Materials Transfer Agreement.
Ethics approvals
Four distinct clinical studies were performed. All human subjects gave written informed consent, and all human studies performed abided by the Declaration of Helsinki. The Institutional Review Board of the Cleveland Clinic, or the ethics committee of Charité-Universitätsmedizin Berlin approved all study protocols (GeneBank IRB 4265, European validation cohort EA1/135/16, COSETTE IRB 21–005, healthy volunteer blood donors for platelet related studies IRB 09–506). All animal model studies were approved by the Institutional Animal Care and Use Committee at the Cleveland Clinic.
Study Design
Discovery cohort
In the first clinical study, untargeted metabolomics analyses were performed on plasma samples from a discovery cohort including stable subjects undergoing elective cardiac catheterization (n=1,157) to identify circulating analytes whose levels in semi-quantitative analyses were associated with incident cardiovascular disease (CVD)-related risks. The discovery cohort consisted of sequential stable adult patients undergoing cardiac risk assessment for symptom evaluation at a quaternary referral center (Cleveland Clinic) between 2001 – 2007. Participants were monitored for MACE (Major Adverse Cardiovascular Event) outcomes adjudicated up to 3 years (GeneBank at the Cleveland Clinic; clinicaltrials.gov identifier: NCT00590200), as previously described46,47.
US validation cohort
In the second clinical study, stable isotope dilution liquid chromatography tandem mass spectrometry (LC/MS/MS) was used to quantify erythritol in serum samples from a non-overlapping cohort of independent subjects (US Cohort, n=2,149) from GeneBank at the Cleveland Clinic (clinicaltrials.gov identifier: NCT0059020)46,47. The subjects enrolled in GeneBank have broad geographic catchment from over 40 states throughout the US. All participants had extensive clinical and longitudinal outcome data collected, including adjudicated adverse cardiovascular events over the ensuing 3 years after enrollment. MACE (Major Adverse Cardiovascular Event) was defined as death, non-fatal myocardial infarction, or nonfatal cerebrovascular accident (stroke) following enrollment. Coronary artery disease (CAD) was defined as any clinical history of myocardial infarction, coronary revascularization (including percutaneous coronary intervention, coronary artery bypass surgery), or angiographic evidence of significant stenosis (≥ 50%) in 1 or more major coronary arteries. Estimated glomerular filtration rate (eGFR) was calculated via CKD-EPI equation48, and in sensitivity analyses, examined above versus below the cut point for chronic kidney disease stage III (<60 mL/min/1.73m2).
European validation cohort
In a third clinical study (the European Cohort, n=833), serum erythritol levels were quantified by stable isotope dilution LC/MS/MS in samples from sequential patients undergoing elective diagnostic coronary angiography due to (suspected) chronic coronary syndromes enrolled in the observational LipidCardio study between 2016–2018 at the Charité University Hospital, Campus Benjamin Franklin (registered under German Clinical Trial Register (drks.de); identifier: DRKS00020915) with a follow-up for 3 years49. As a quaternary referral center, Charité University Hospital is centrally located in Europe, and subjects enrolled in the LipidCardio study have large geographic catchment, with residences throughout Europe. eGFR was calculated via CKD-MDRD equation48. For the European validation cohort, there was a total of 833 samples available with MACE outcome data. All samples were used for the erythritol LC/MS/MS measurement.
The manuscript was prepared in compliance with the STrengthening the Reporting of Observational studies in Epidemiology (STROBE)-Statement50.
Erythritol Intervention Study
In a fourth study, the first phase of the Erythritol Intervention Study (COSETTE, clinicaltrials.gov number: NCT04731363), prospectively recruited healthy volunteers ingested a standard-size artificially sweetened beverage (300 mL) containing 30 g of erythritol with instructions to consume the drink within 2 minutes, and blood samples were collected at scheduled post-prandial time points for erythritol measurement. For each participant in the erythritol intervention study (n=8), baseline blood samples were first obtained after overnight (≥8 hours) fasting. Information provided during the FDA approval processes suggests a daily erythritol consumption of up to >30 g per day in some of the US population based on National Health and Nutrition Examination Survey data18. Therefore, participants were given 30 g erythritol dissolved in 300 mL water. Serial venous blood sampling was performed up to 7d after baseline.
The reported pharmacokinetics data in this manuscript (Figure 5) were acquired as the first part of COSETTE to identify both the timing of peak plasma levels of erythritol after ingestion, and the time course of erythritol elimination. The registration at Clinicaltrials.gov and the IRB protocol for COSETTE also include a distinct non-overlapping second separate study that assesses platelet functional changes after ingestion. These studies are ongoing, and not part of this manuscript. Further information about the study design can be found in the IRB protocol and statistical analysis plan that are provided as supplemental files.
Platelet related studies
For in vitro studies using human platelet-rich plasma, washed platelets or whole blood, healthy adults (n=55 total) with no chronic illness were consented for blood donation using a distinct IRB protocol.
Aggregometry Assay in Platelet-Rich Plasma
Platelet rich plasma (PRP) and platelet poor plasma (PPP) was prepared as previously described with sodium citrate (0.109 M) as anticoagulant51. Platelets were counted and concentrations adjusted to 2×10⁸/mL with PPP. PRPs were pre-incubated with erythritol (Catalogue # E7500, Sigma, St. Louis, MO, USA), glucose (Catalogue # G7021, Sigma, St. Louis, MO, USA) or 1,5-AHG (Catalogue # 29874, Cayman Chemical, Ann Arbor, Michigan, USA) (at indicated concentrations) or vehicle (saline) for 30 min at 22 °C. After pre-incubation PRPs were maintained in suspension with constant stirring (600 rpm) at 37 °C and platelet aggregation was initiated using ADP (up to 5 μM, Catalogue # 384, Chronolog, Havertown, PA, US) or TRAP6 (TFLLR-NH2, up to 10 μM, Catalogue # 464, Tocris, Bristol, UK).
Intracellular Calcium Measurements
Washed platelets for intracellular Ca2+ measurements were prepared by adding 100 nM prostaglandin E1 (PGE-1, Catalogue #P5512, Sigma, St. Louis, MO, USA) to PRP and centrifugation at 500 x g, 20 min at 22 °C as previously described26,51. The platelet pellet was washed with a modified phosphate buffer saline (NaCl (137 mM), KCl (2.7 mM), Na2HPO4 (12 mM), MgCl2 (1 mM), and glucose (5.5 mM), pH 7.4) with PGE-1 (100 nM), and spun again at 500 x g for 20 min. The platelets were re-suspended in modified Hank’s buffered salt solution (HBSS-BSA-glucose; NaCl (0.137 M), KCl (5.4 mM), Na2HPO4 (0.25 mM KH2PO4 (0.44 mM), CaCl2 (1.3 mM), MgSO4 (1.0 mM), NaHCO3 (4.2 mM), glucose (5 mM) and BSA (0.1%)) with 100 nM PGE-1 and incubated with Fura 2-AM (1 mM) at 22 °C for 30 min. Excess Fura 2-AM was removed by additional centrifugation at 500 x g for 30 min. The platelets were then re-suspended in modified Hank’s buffered salt solution and incubated with erythritol or 1,5-AHG at the indicated concentrations or vehicle for 30 min at 22 °C. Intra-cellular calcium release was induced by submaximal concentration of thrombin (0.02 U/mL) and changes monitored via Fura 2-AM fluorescence using 340/380 nm dual-wavelength excitation and an emission of 510 nm.
Platelet Flow Cytometry Assay
Washed platelets and antibody staining for flow cytometry was performed as described previously using sodium citrate (0.109 M) as anti-coagulant51. Washed platelets were separated by centrifugation at 500 x g for 10 min and re-suspended in modified Hank’s buffered salt solution without PGE1. Final platelet suspensions (100 μL; 2×10⁸ platelets/mL) were then pre-incubated with erythritol, glucose or 1,5-AHG (at indicated concentrations) for 30 min at 22 °C. Platelets were then stimulated with 2 μM ADP for 10 min and incubated with PE conjugated anti-P-selectin (CD62P-PE, Catalogue # 555524, BD PharMingen, San Diego, CA, USA; 2.5 μL/100 μL) or Fluorescein isothiocyanate(FITC) conjugated PAC1 (binds only to active conformation of GP IIb/IIIa, Catalogue #3 40507, BD PharMingen, San Diego, CA, USA; 5 μL/100 μL) or isotype control antibody (PE IgG isotype control, Catalogue # 555749 or FITC IgM Isotype control, Catalogue # 555583, BD PharMingen, San Diego, CA, USA) in the dark for 20 min. The platelet suspensions were then fixed with 100 μL of 2% paraformaldehyde. Data was acquired on a flow cytometer (FACS LSR Fortessa, BD Biosciences, Franklin Lakes, New Jersey, USA). Twenty thousand (20,000) events were collected. The data was analyzed with FACSDiva Software (v.9.0) (BD Biosciences). Platelets were gated to exclude doublets (Fig. S1) and the raw mean fluorescent intensity (MFI) of either P-selectin (CD62P) or PAC-1 was quantified.
Whole Blood In Vitro Thrombosis Assay
Microfluidic shear flow experiments were performed using the Cellix Microfluidics System (Cellix, Dublin, Ireland) as previously described51–53. Where indicated, each micro channel of a Vena8 Fluoro+ biochip was coated with type 1 collagen (15 μL; 50 μg/mL). Images were collected using an HC Plan Apo 20X/0.7NA lens on a Leica DMI6000 inverted microscope equipped with an environmental chamber and a Hamamatsu ImagEM cooled CCD camera. Whole blood was incubated with an Alexa Fluor® 488-conjugated anti-human CD42b antibody (catalogue # 303914, Biolegend, San Diego, CA, USA; 5 μL/100 μL blood) and was pretreated with erythritol (45 μM) or normal saline (control) for 30 min at 22 °C. Blood was then perfused over chips coated with or without immobilized type 1 collagen at a physiological shear rate (60 dynes/cm2) using a multi-channel microfluidic device for 3 min. Images of fluorescent platelets adhering to the collagen coating were captured every 5 s during that time. At the end of the experiment, the tube containing the whole blood was removed and the 1X PBS in the biochip reservoir was drawn through the channel at 20 dynes/cm2. Five images were captured along the length of the channel during that time. Platelet activation and adherence to the collagen surface was then quantified with computer assisted tomographic analyses. Briefly, images of CD42b stained thrombi were quantified using Image Pro plus software v7.0.0 (Media Cybernetics, Rockville, Maryland, USA). Intensity threshold was chosen to select for specific staining and quantified for integrated optical density (IOD, Area X Intensity).
Murine Model for Carotid Artery FeCl3 Injury Thrombosis Assay
The common carotid artery FeCl3 induced injury model was performed as previously described54. 12–14 weeks old BL/6J mice were injected with vehicle (normal saline), erythritol (25 mg/kg) or 1,5-AHG (25 mg/kg) and anesthetized with 100 mg/kg ketamine + 10 mg/kg xylazine. Rhodamine 6G (100 μL; 0.5 mg/mL, catalogue # 252433, Sigma, St. Louis, MO, USA) was injected into the right jugular vein to label platelets. The left carotid artery was then injured with a Whatman filter paper of 1 mm2 size containing 10% FeCl3 (Catalogue # 157740, Sigma, St. Louis, MO, USA) for 1 min. Intravital fluorescence microscopy equipped with video recording was used to monitor thrombus formation in real time. Time to cessation of blood flow through clot formation for all studies was determined by visual inspection of captured video by two independent investigators in real time. Data for the in vivo thrombosis were collected by Streampix 7 - Multiple Camera DVR Software (NorPix Inc, Montreal, Canada). Animals were immediately euthanized after data acquisition.
Untargeted GC–MS Analysis of Human Plasma Samples
Sample preparation
1 mL of chilled (−20 °C) extraction solution (acetonitrile/isopropanol/water, 3:3:2, v/v/v) was added to 30 μL plasma aliquots. After vortexing for 10 s and shaking for 5 min at 4 °C, the samples were centrifuged for 2 min at 14,000 rcf. Three aliquots (each 300 μL) were taken: one for GC-MS analysis and two for backup samples. GC-MS aliquots were evaporated to dryness followed by re-suspending with 450 μL 50% acetonitrile. After centrifugation for 2 min at 14,000 rcf the supernatants were pipetted to new Eppendorf tubes followed by evaporation to dryness. A two-step derivatization was used prior to GC-MS analysis. Methoxyamine hydrochloride in pyridine (10 μL; 40 mg/mL) was added to dried samples and shaken for 1.5 hours at 30 °C. Next, 60 μL of N-Methyl-N-(trimethylsilyl)trifluoroacetamide (MSTFA) with fatty acid methyl ester (FAME) mixture was added to each sample and shaken for 0.5 hour at 37 °C. After centrifugation (2 min at 14,000 rcf), the content was submitted to GC-MS analysis.
GC–MS analysis
The system consisted of an MPS2 automatic liner exchange system (Gerstel, Muülheim an der Ruhr, Germany), an Agilent 7890A GC system, and a time-of-flight Pegasus III mass spectrometer (Leco, St. Joseph, MI, USA). Injection parameters were as follows: injection volume, 0.5 μL; injector temperature, 50 °C ramped to 275 °C at a rate of 12 °C/s; helium carrier gas flow, 1 mL/min; splitless period, 25 s. For GC separation a 30 m × 0.25 mm, 0.25 μm Rtx5Sil MS (Restek, Bellefonte, PA, USA) capillary column including an additional 10 m integrated guard column (Restek) was used with an oven temperature program: 50 °C (1 min), 20 °C/min to 330 °C (5 min). MS parameters were as follows: electron ionization, −70 eV; acquisition rate, 17 spectra/s; mass range, m/z 85−500; MS ion source temperature, 250 °C; transfer line temperature, 280 °C. For data acquisition, ChromaTOF 2.32 (Leco) software was used.
Data processing
Raw data files were processed using the metabolomics BinBase database55. All database entries in BinBase were matched against the UC Davis metabolomics center’s mass spectral library.
Targeted Analysis of Selected Polyols in Plasma
Stable-isotope-dilution LC/MS/MS was used for quantification of erythritol, threitol, and 1,5-AHG in human and mouse plasma. Ice cold methanol (800 μL) and internal standards (D6-erythitol and 13C6-1,5-AHG) were added to the plasma samples (20 μL), followed by vortexing and centrifuging (21,000 x g; 4 °C for 15 min). The clear supernatant (800 μL) was transferred into a clean, labeled glass tubes (Borosilicate glass 12×75 mm) and dried in a speed vacuum concentrator (Speed vac plus, SC210, Thermo Sevant). The dry residue was reconstituted in acetic anhydride (100 μL) and 4-Dimethylaminopyridine (DMAP) in pyridine (100 μL; 1 mg/mL), sealed with safety caps, vortexed and heated (45 min at 80 °C) followed with drying under nitrogen. Dried residues were dissolved in HCl in water (0.1 M; 0.5 mL) and extracted wit ethyl acetate (2 mL). Ethyl acetate layer was transferred into a clean glass tubes (Borosilicate glass 12×75 mm) and dried under nitrogen. The dry residue was reconstituted in ammonium formate in a mixture of methanol: water (100 μL; 50:50 v/v with 10 mM ammonium formate), tubes were vortexed and liquid was transferred to glass vials with micro-insets and caped. LC/MS/MS analysis was performed on a chromatographic system consisting of two Shimadzu LC-30 AD pumps (Nexera X2), a CTO 20AC oven operating at 30 °C, and a SIL-30 AC-MP autosampler in tandem with a triple quadruple mass spectrometer (8050 series, Shimadzu Scientific Instruments, Inc., Columbia, MD, USA). For chromatographic separation, a Kinetex C18 column (50 mm × 2.1 mm; 2.6 μm) (Cat # 00B-4462-AN, Phenomenex, Torrance, CA) was used. Solvent A (10 mM ammonium formate and 0.1% formic acid in water) and B (10 mM ammonium formate and 0.1% formic acid in acetonitrile:water 95:5) were run using the following gradient: 0.0 min (0% B); 0.0–11.0 min (25% B); 11.0–14.0 min (25%B→30%B); 14.0–17.0 min (30%B→35%B); 17.0–19.0 min (35%B); 19.0–22.0 min (35%B→40%B); 22.0–22.5 min (100%); 22.5–25 min (100%B); 25.0–26.0 min (100%B→0% B); 26.0–28.0 min (0%B) with flow rate of 0.35 mL/min and an injection volume of 1 μL. Electrospray ionization in the positive mode was used with multiple reaction monitoring (MRM) for detection of endogenous and stable isotope labeled internal standards. The following transitions were used: m/z 308.0 [M+4xC2OH2+NH4]+ →231.0 for threitol and erythritol, m/z 314.0 [M+4xC2OH2+NH4]+→ 237.0 for D6-erythritol; m/z 360.1 [M+4xC2OH2+NH4]+ →273.3 for 1,5AHG; m/z 356.1 [M+4xC2OH2+NH4]+ →279.3 for 13C6-1,5-AHG; The following ion source parameters were applied: nebulizing gas flow, 3 l/min; heating gas flow, 10 L/min; interface temperature, 300 °C; desolvation line temperature, 250 °C; heat block temperature, 400 °C; and drying gas flow, 10 L/min. Limit of detection (LOD) and limit of quantification (LOQ) were as follow: threitol:0.048 and 0.160 μM; erythritol: 0.026 and 0.089 μM; 1,5-AHG: 0.011 and 0.035 μM; respectively. Three quality control samples were run with each batch of samples and inter-batch variations expressed as coefficient of variation (CV) were less than 7% for all analytes monitored. Data were collected and analyzed by LabSolution 5.91 software (Shimadzu).
Statistical analysis
Continuous variables were summarized as median (25th and 75th percentiles), and categorical variables are presented as %. For group comparisons of patient characteristics, Kruskal-Wallis test was performed for numerical data and Chi-Square test for categorical data.
Given the relatively small sample sizes, we did not feel that the assumptions behind parametric approaches we considered (particularly, normality of models’ error terms) were sufficiently well justified and so non-parametric models were preferred for most in vitro and in vivo studies. Mann–Whitney U-test or Wilcoxon matched-pairs signed rank test were applied to continuous variables. Kruskal–Wallis test with Dunn’s post hoc test was used for multiple comparisons. Kaplan–Meier analysis with Cox proportional-hazards regression was used for time-to-event analysis to determine hazard ratios (HR) and 95% confidence intervals (CI) for MACE. Adjustments included traditional cardiovascular risk factors that are known to predict CVD event risk56,57: age, sex, diabetes mellitus, systolic blood pressure (in the European Cohort hypertension), low-density and high-density lipoprotein cholesterol levels, triglyceride levels, and current smoking status. For the discovery cohort and US validation cohort, the adjustment also included body mass index (BMI), in addition to the aforementioned variables. The R built-in cox.zph() function was used to check for proportionality assumptions in Cox models, by using the Schoenfeld residuals against the transformed time. There was no evidence against proportionality. Two-way ANOVA with Sidák’s multiple comparison post hoc test was used for multiple-group comparisons of aggregometry data using different concentrations of agonists. For analysis of collagen-dependent platelet adhesion in whole blood, we performed a two-way repeated measures ANOVA with Sidák’s multiple comparison post hoc test. False discovery rate corrected P values for metabolite levels in the discovery cohort were calculated using the Benjamini-Hochberg method. All reported measurements were taken from distinct samples (for whole blood in vitro thrombosis experiments (Figure 4A) individual biological replicates were followed over 3 min). Data analyses were performed with R software (version 4.0.2) and GraphPad Prism software (version 9.0). All reported P values are two-sided. A two-sided P<0.05 was considered statistically significant.
Extended Data
Extended Display Figure 1: Polyol metabolites and major adverse cardiovascular events (MACE) in untargeted metabolomics analyses of the discovery cohort.
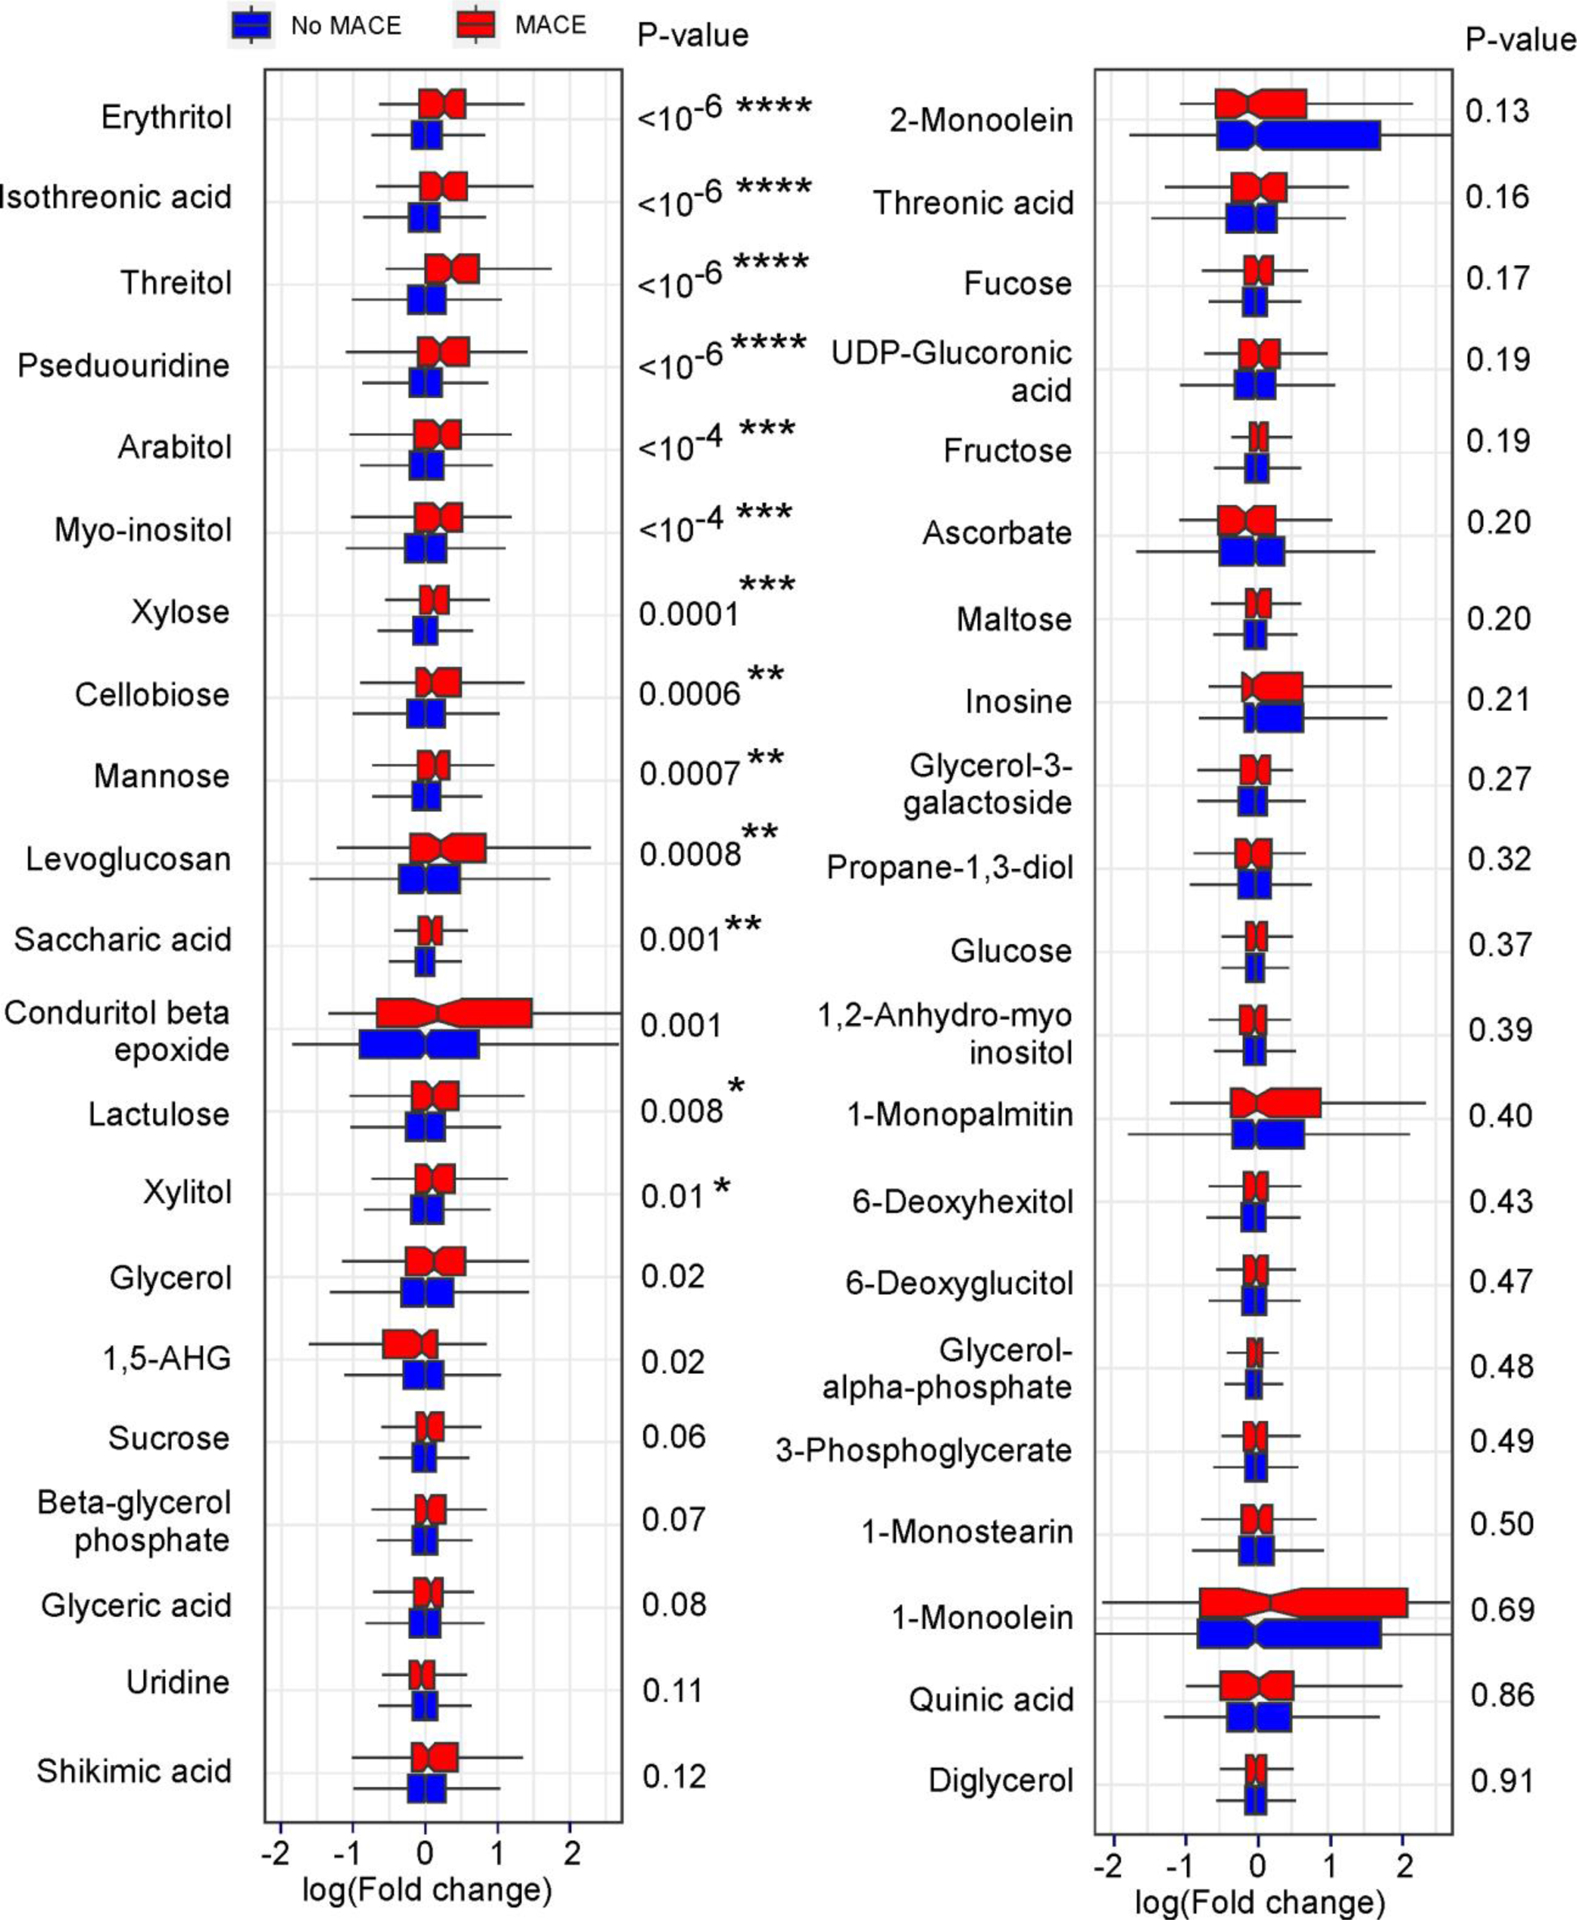
Shown are boxplots with relative levels for the indicated polyol (defined as compounds with two or more hydroxyl groups) area in both patients with (red) and without (blue) incident (3 yr) MACE ranked by Mann Whitney P values. Compound relative areas are shown as log of fold change (no MACE vs. MACE) to facilitate comparison. Boxes represent interquartile ranges (IQR) with the notch indicating the median. Lower whiskers represent smallest observation (≥25% quantile—1.5×IQR) and upper whiskers largest observation (≤75% quantile—1.5×IQR). Two-sided P values were calculated by Mann–Whitney U-test. N for no MACE= 1041, n for MACE= 116. False discovery rate corrected two-sided P values (Benjamini-Hochberg method) are indicated as follows: ****P<0.0001, ***P<0.001, **P<0.01, *P<0.05.
Extended Display Figure 2: Chromatographic separation of erythritol from its structural isomer threitol.
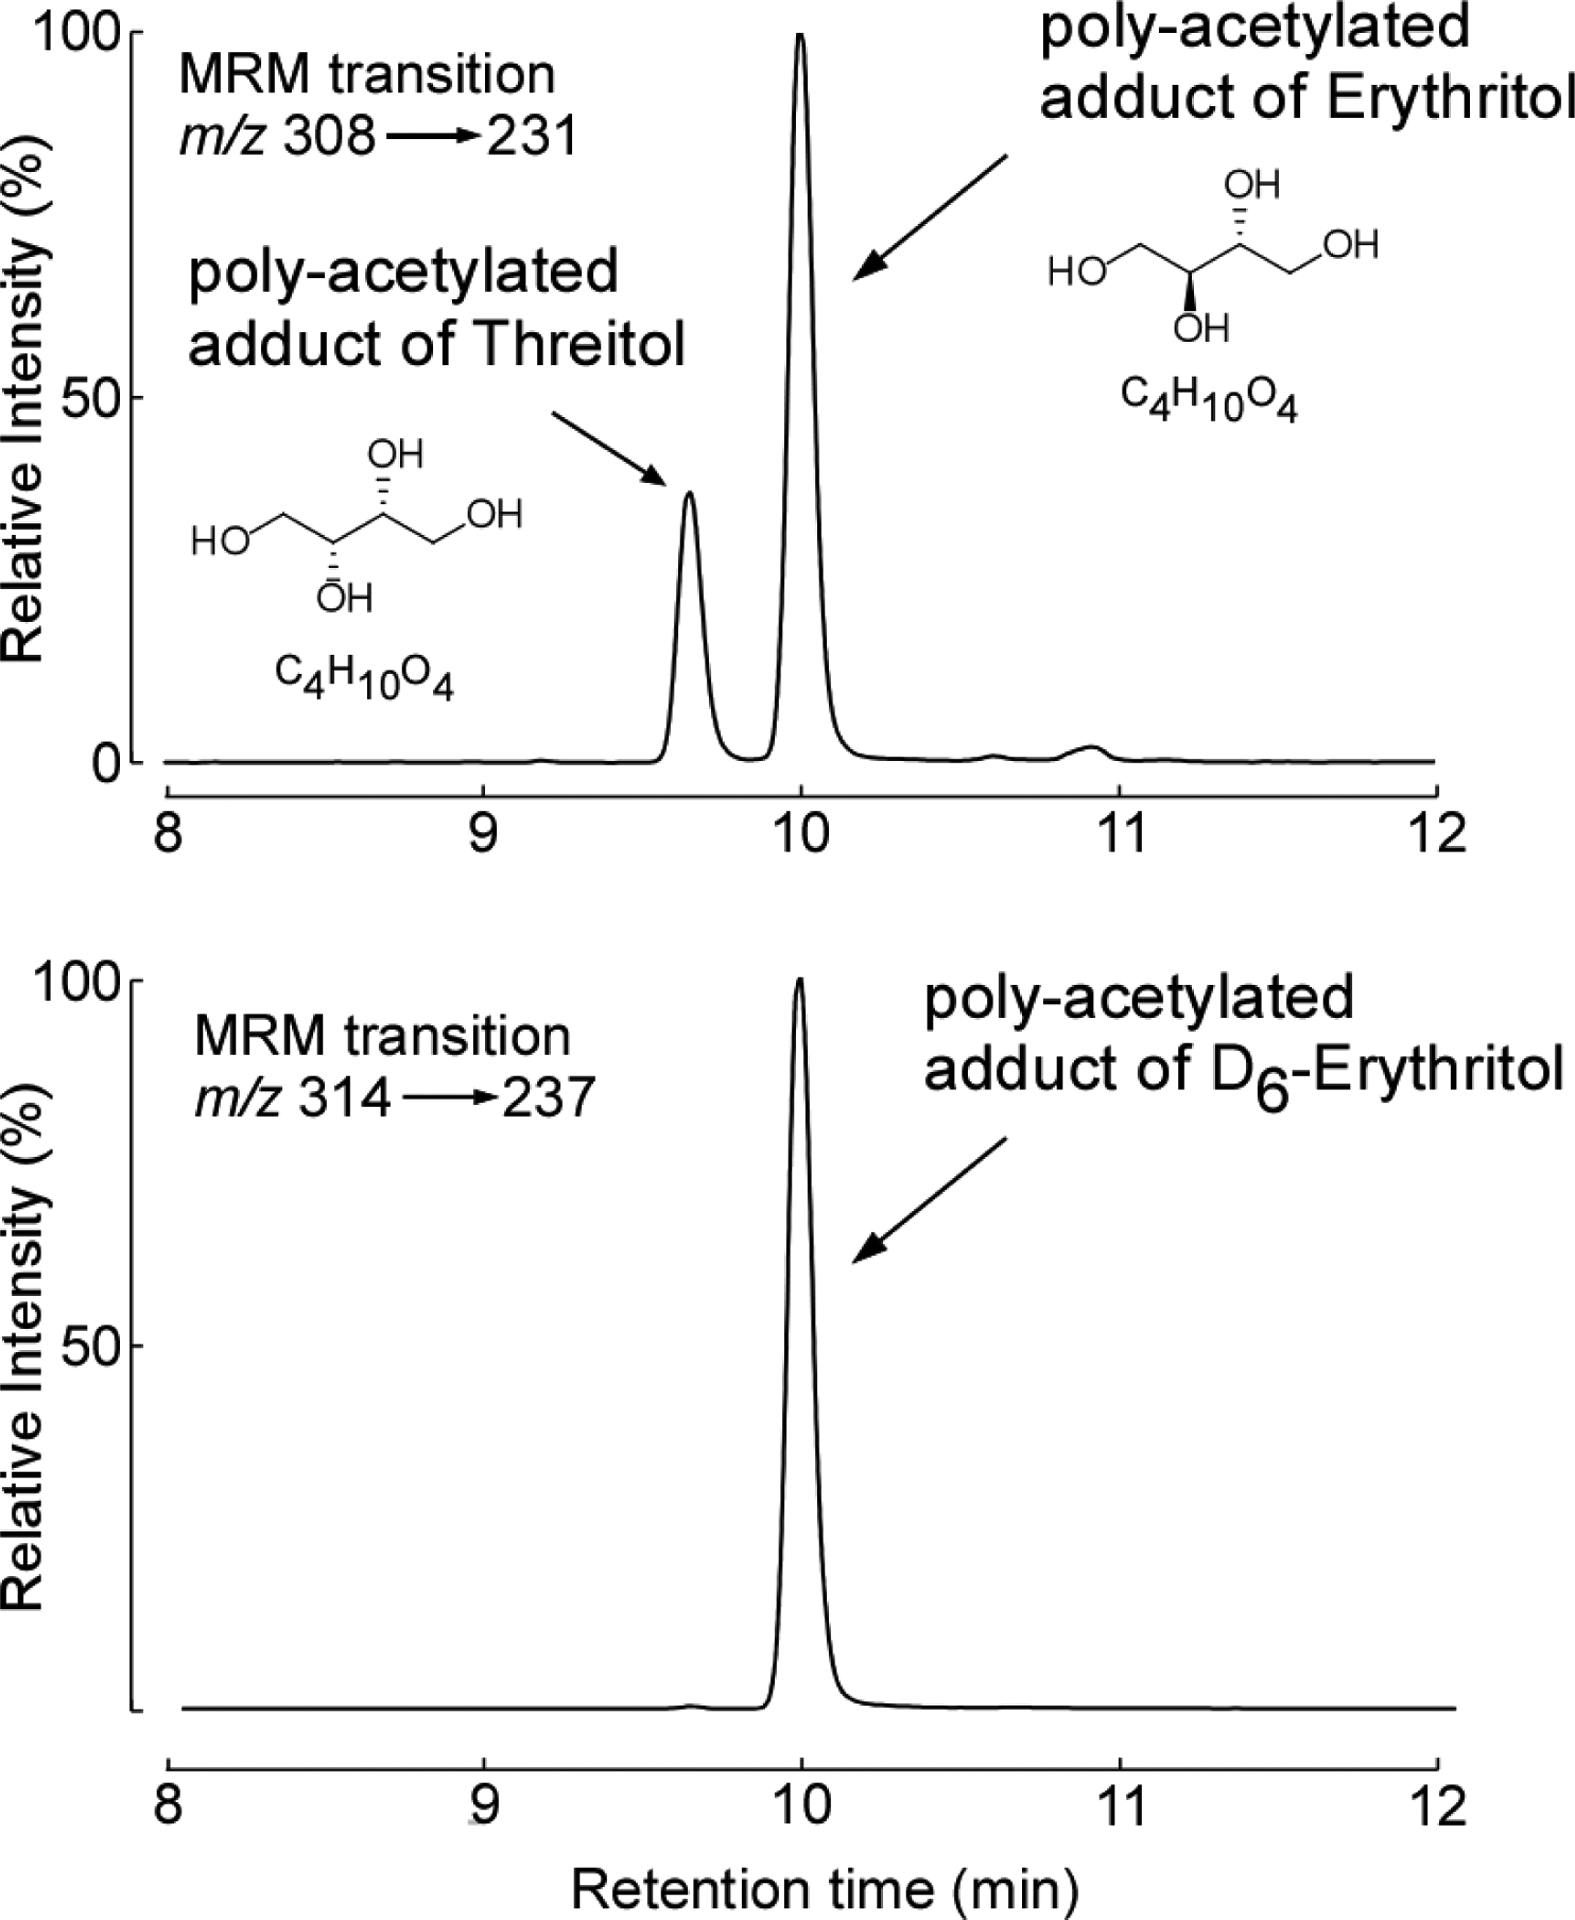
After exhaustive acetylation with acetic acid anhydride, the polyols erythritol and its structural isomer, threitol, were baseline resolved by the HPLC method developed. Shown are the chromatograms generated by multiple reaction monitoring transitions (MRM) for the derivatized plasma analytes (m/z 308; [M+NH4]+) and synthetic isotopically labeled erythritol internal standard (D6-Erythritol; m/z 314; [M+NH4]+). With the column matrix and mobile phase /gradient employed, coupled with the characteristic parent [M+NH4+] —> daughter ion transition used (for both erythritol and threitol), baseline chromatographic resolution of the two structural isomers was achieved.
Extended Display Figure 3. Plasma levels of erythritol are elevated in patients with major adverse cardiovascular events (MACE) and coronary artery disease (CAD) in both US and European validation cohorts.
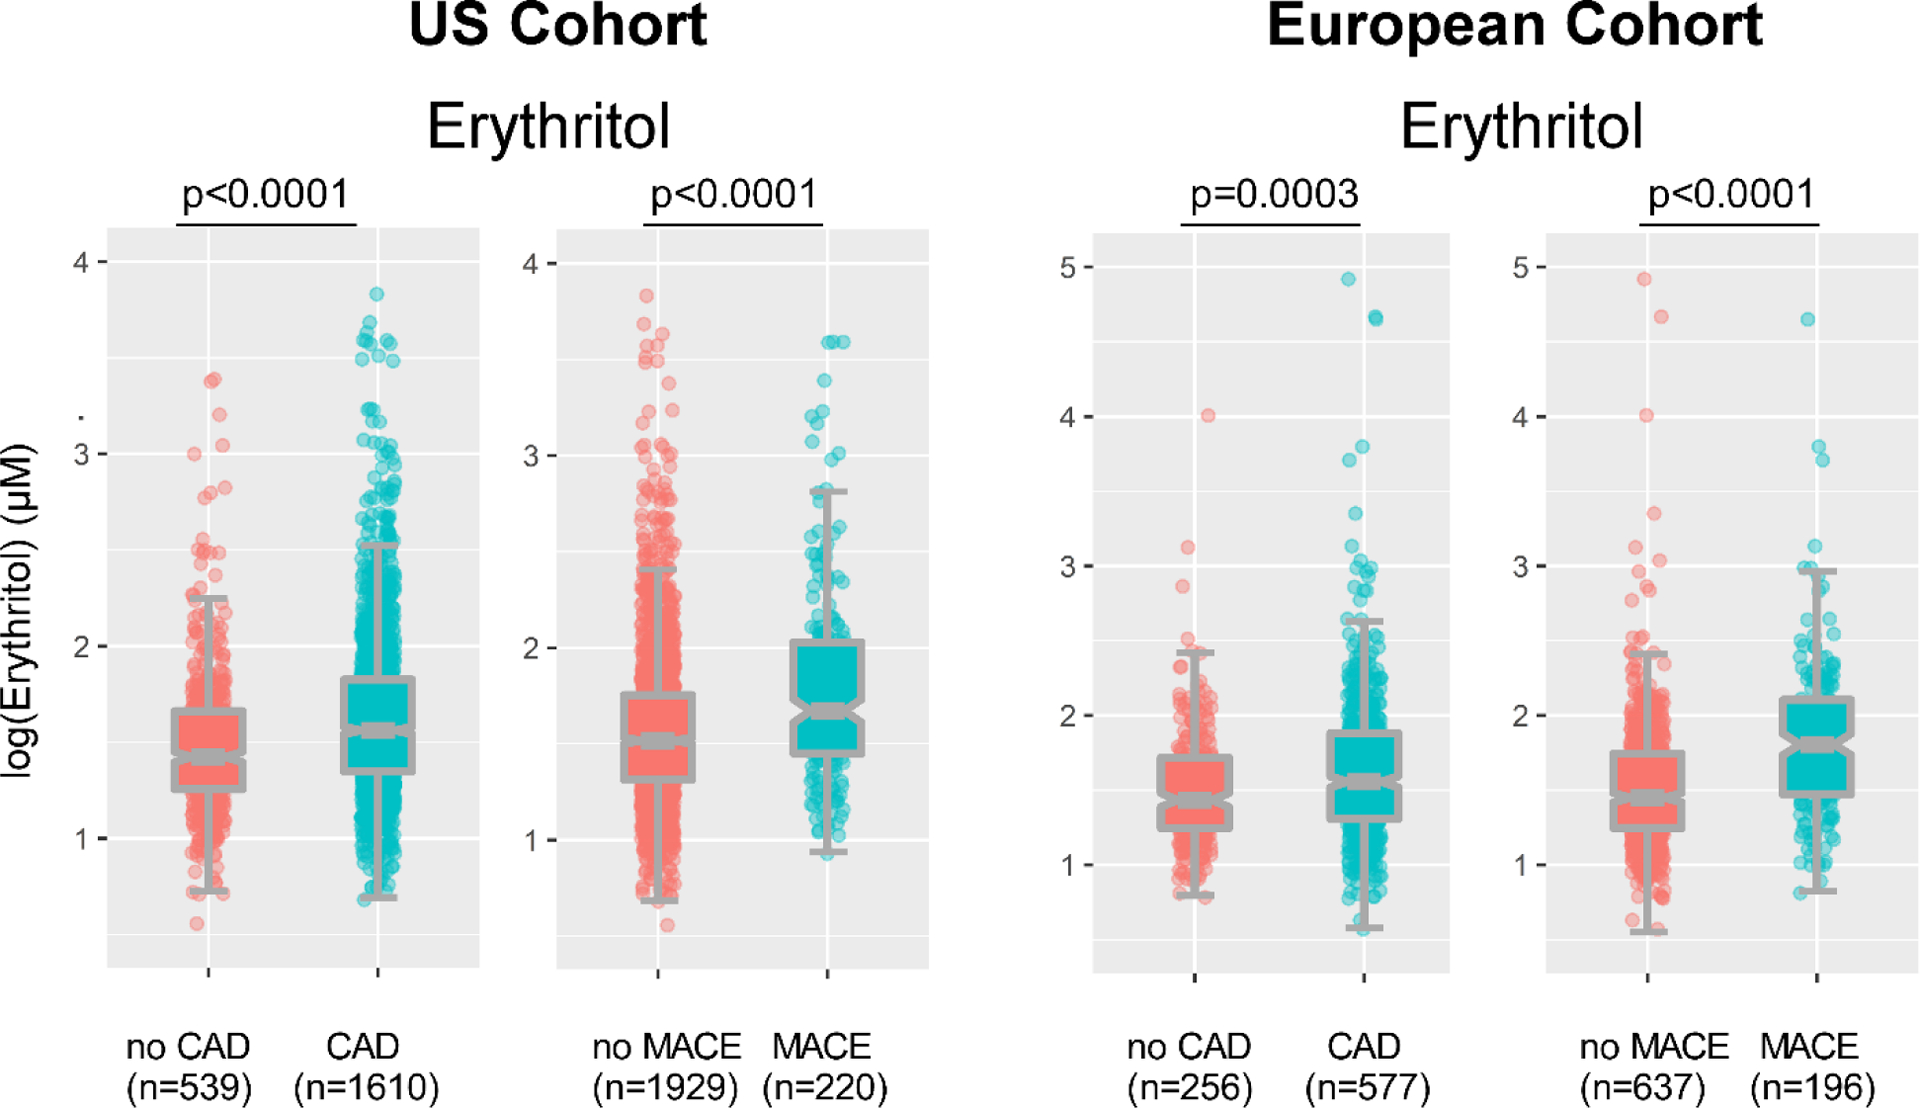
Erythritol levels in patients stratified by presence of (3 year) MACE or CAD. Data are shown as log of plasma Erythritol. Plotted are individual values as dots. Boxes represent interquartile ranges (IQR) with the notch indicating the median. Lower whiskers represent smallest observation (≥25% quantile - 1.5×IQR) and upper whiskers largest observation (≤75% quantile - 1.5×IQR). Two-sided P values were calculated by Mann–Whitney U-test. Numbers of subjects within each group are indicated.
Extended Display Figure 4. Erythritol increases platelet aggregation responses to submaximal concentrations of agonists.
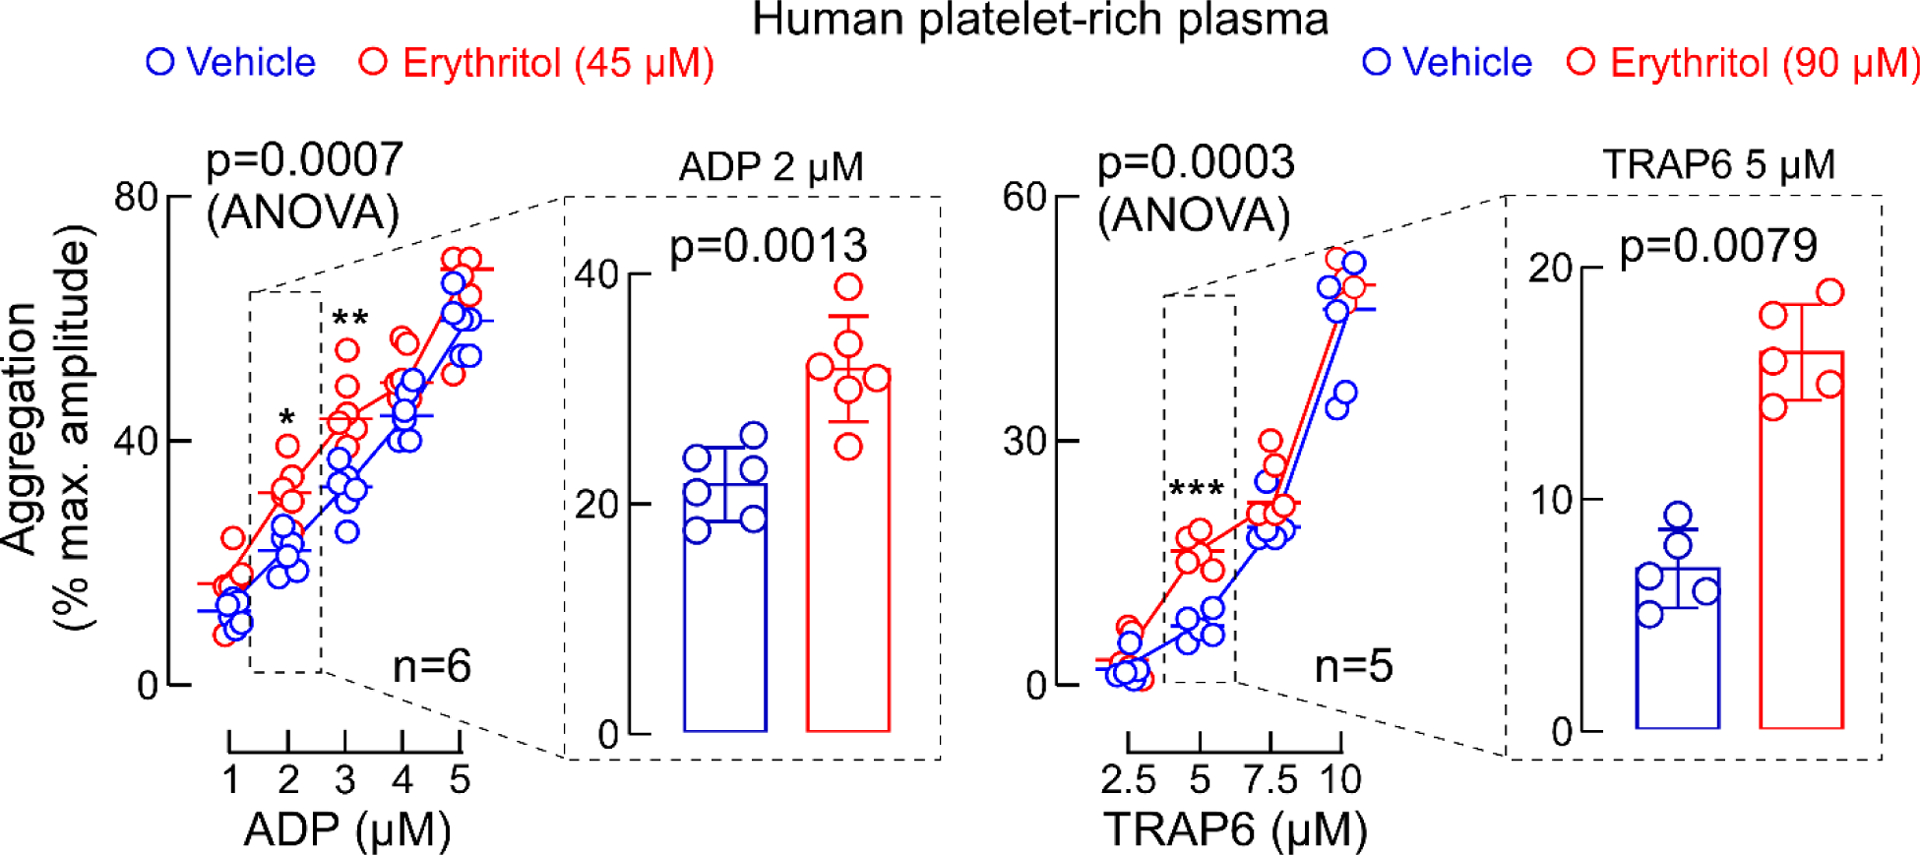
ADP-stimulated and Thrombin receptor-activating peptide(TRAP)6-stimulated platelet aggregometry responses of human platelet-rich plasma with fixed concentration of erythritol (45 or 90 μM, red) versus normal saline (vehicle, blue). Data in bar graphs are represented as means (±SD), and two-sided P values were calculated by Mann Whitney Test (bar graphs) and by 2-way analysis of variance (overall P value is shown for erythritol effect) with Sidák’s post hoc test. Sidák’s adjusted P values for Erythritol 45 μM vs. vehicle: for ADP 2 μM P=0.01, ADP 3 μM P=0.005, for erythritol 90 μM vs. vehicle: TRAP6 5 μM: P=0.0002. Numbers of independent biological replicates (n) are indicated. *P<0.05, ** P<0.01, ***P<0.001.
Extended Display Figure 5. Impact of glucose on platelet aggregation.
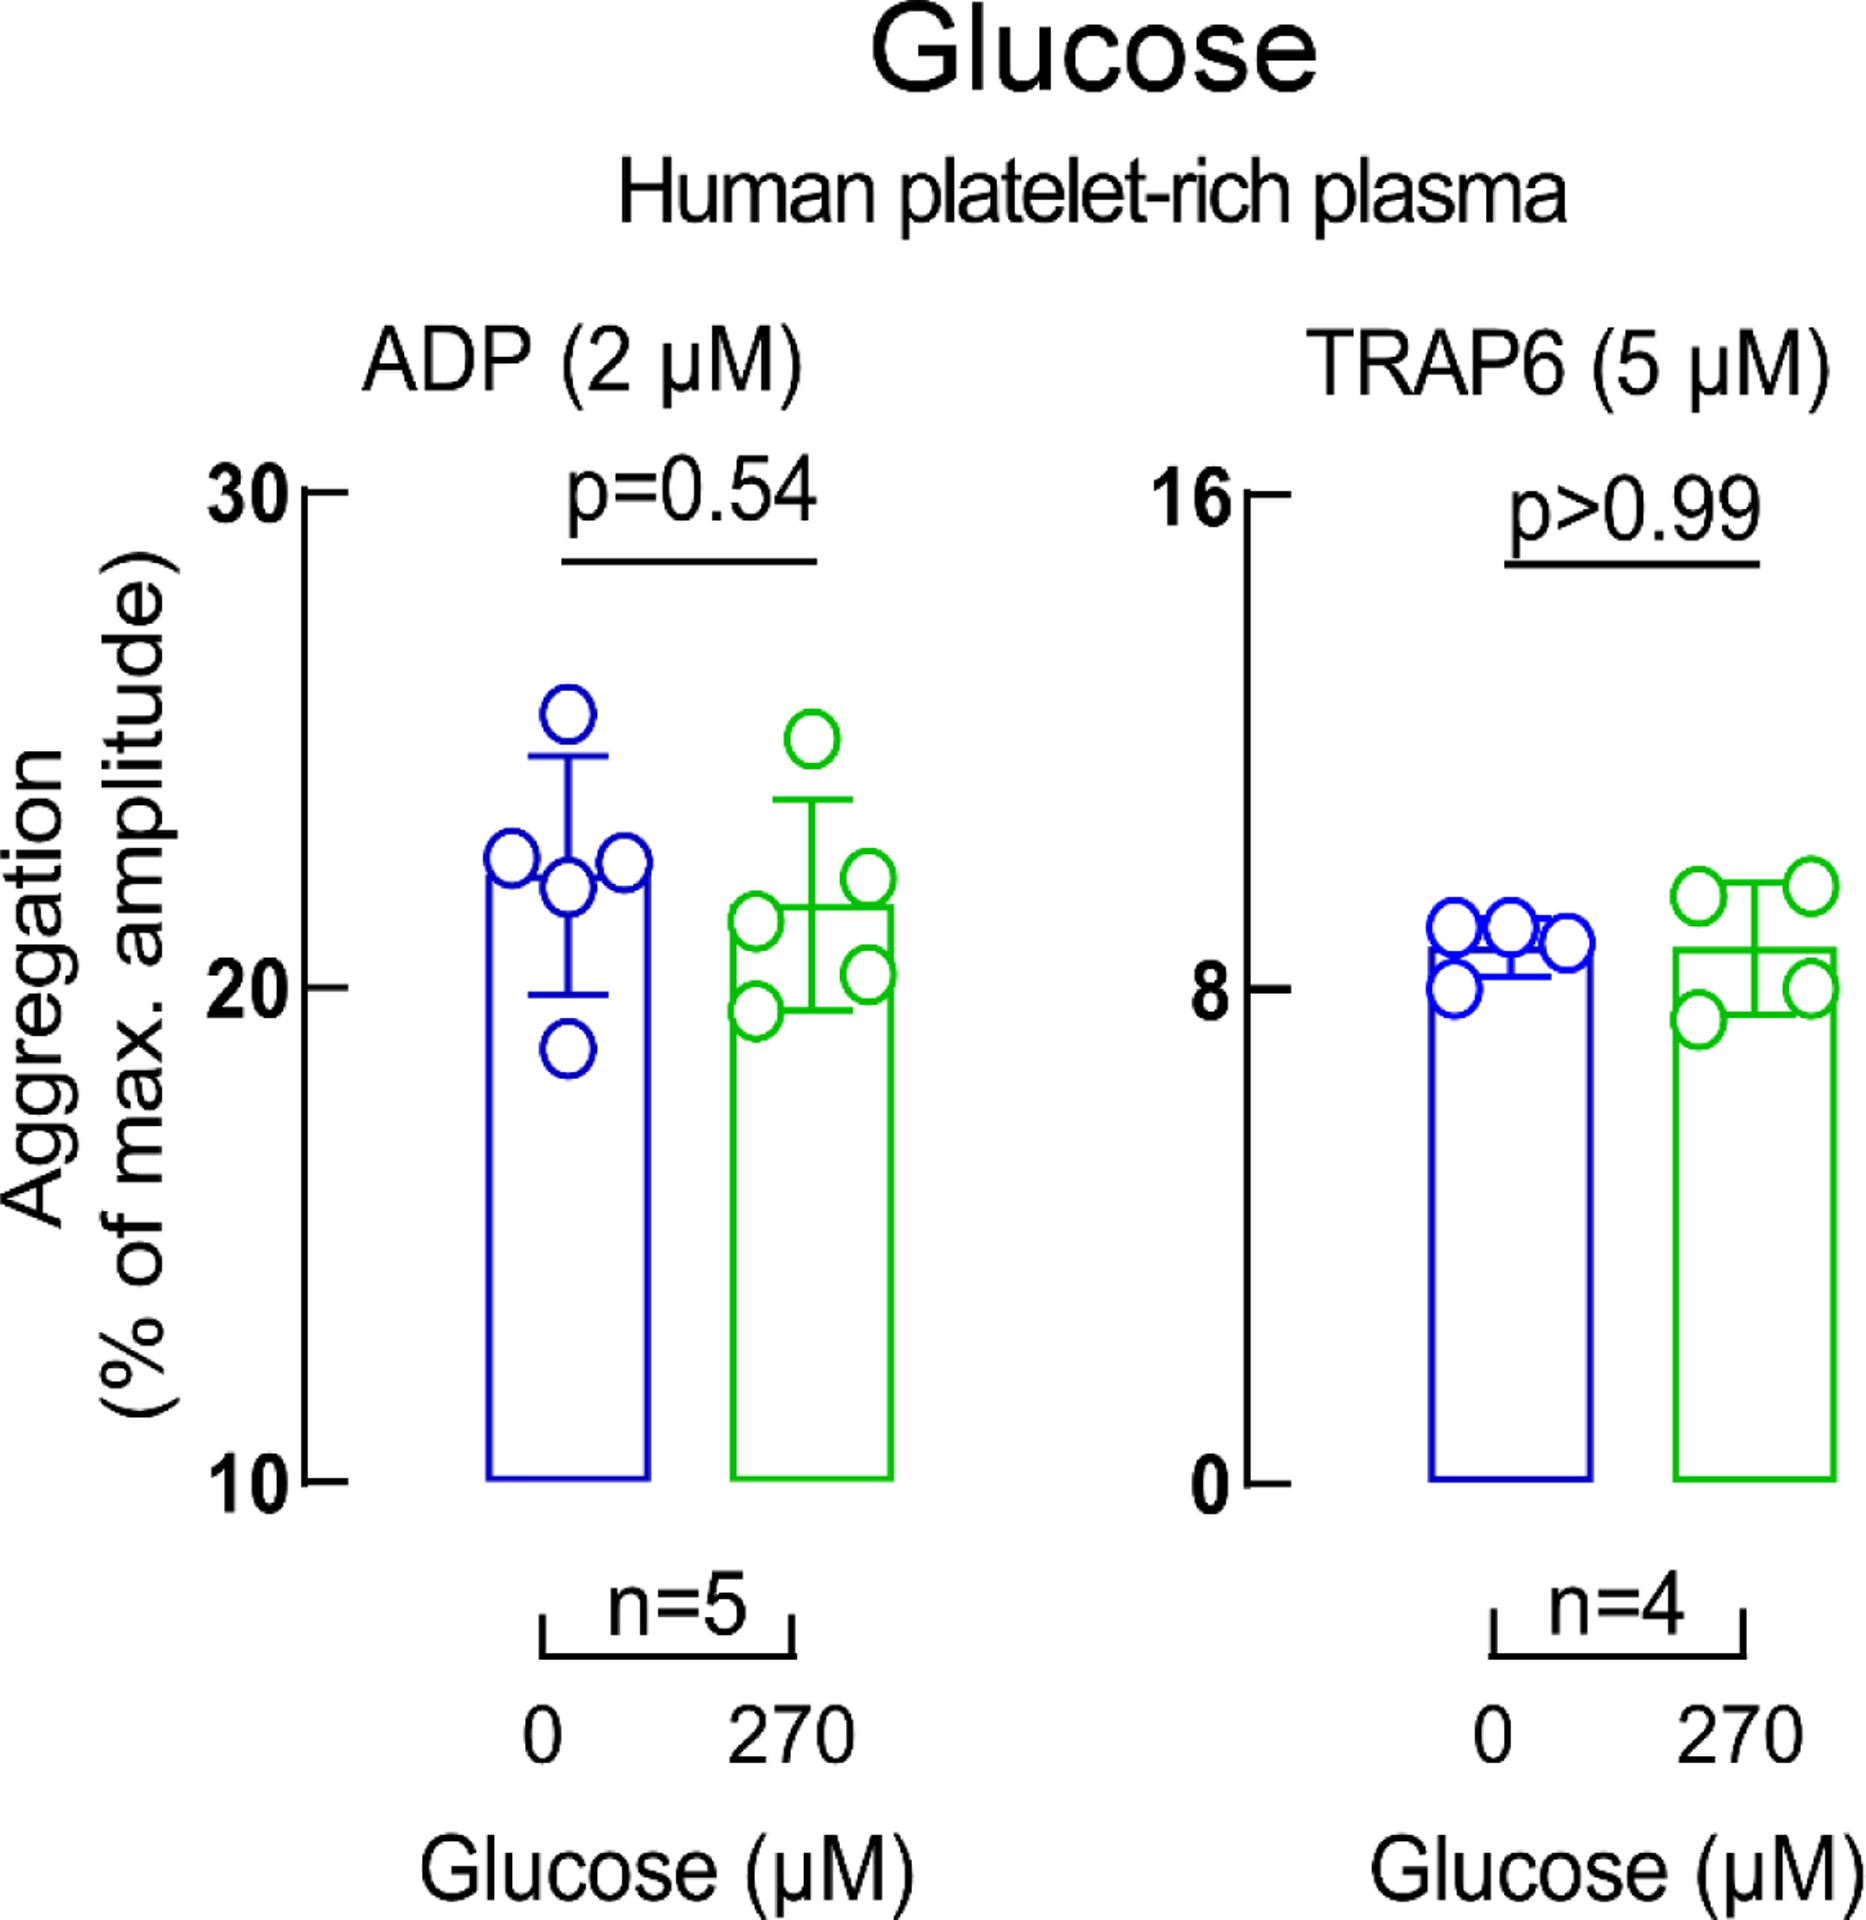
ADP-stimulated (left panel) and Thrombin receptor-activating peptide (TRAP) 6-stimulated (right panel) platelet aggregometry responses in human platelet-rich plasma incubated with glucose (270 μM, green) versus vehicle (saline, blue). Data in bar graphs are represented as means (±SD). Two-sided P values were calculated using Mann–Whitney U-test. Numbers of independent biological replicates (n) are indicated.
Extended Display Figure 6. Impact of 1,5 Anhydroglucitol (AHG) on platelet aggregation and calcium release.
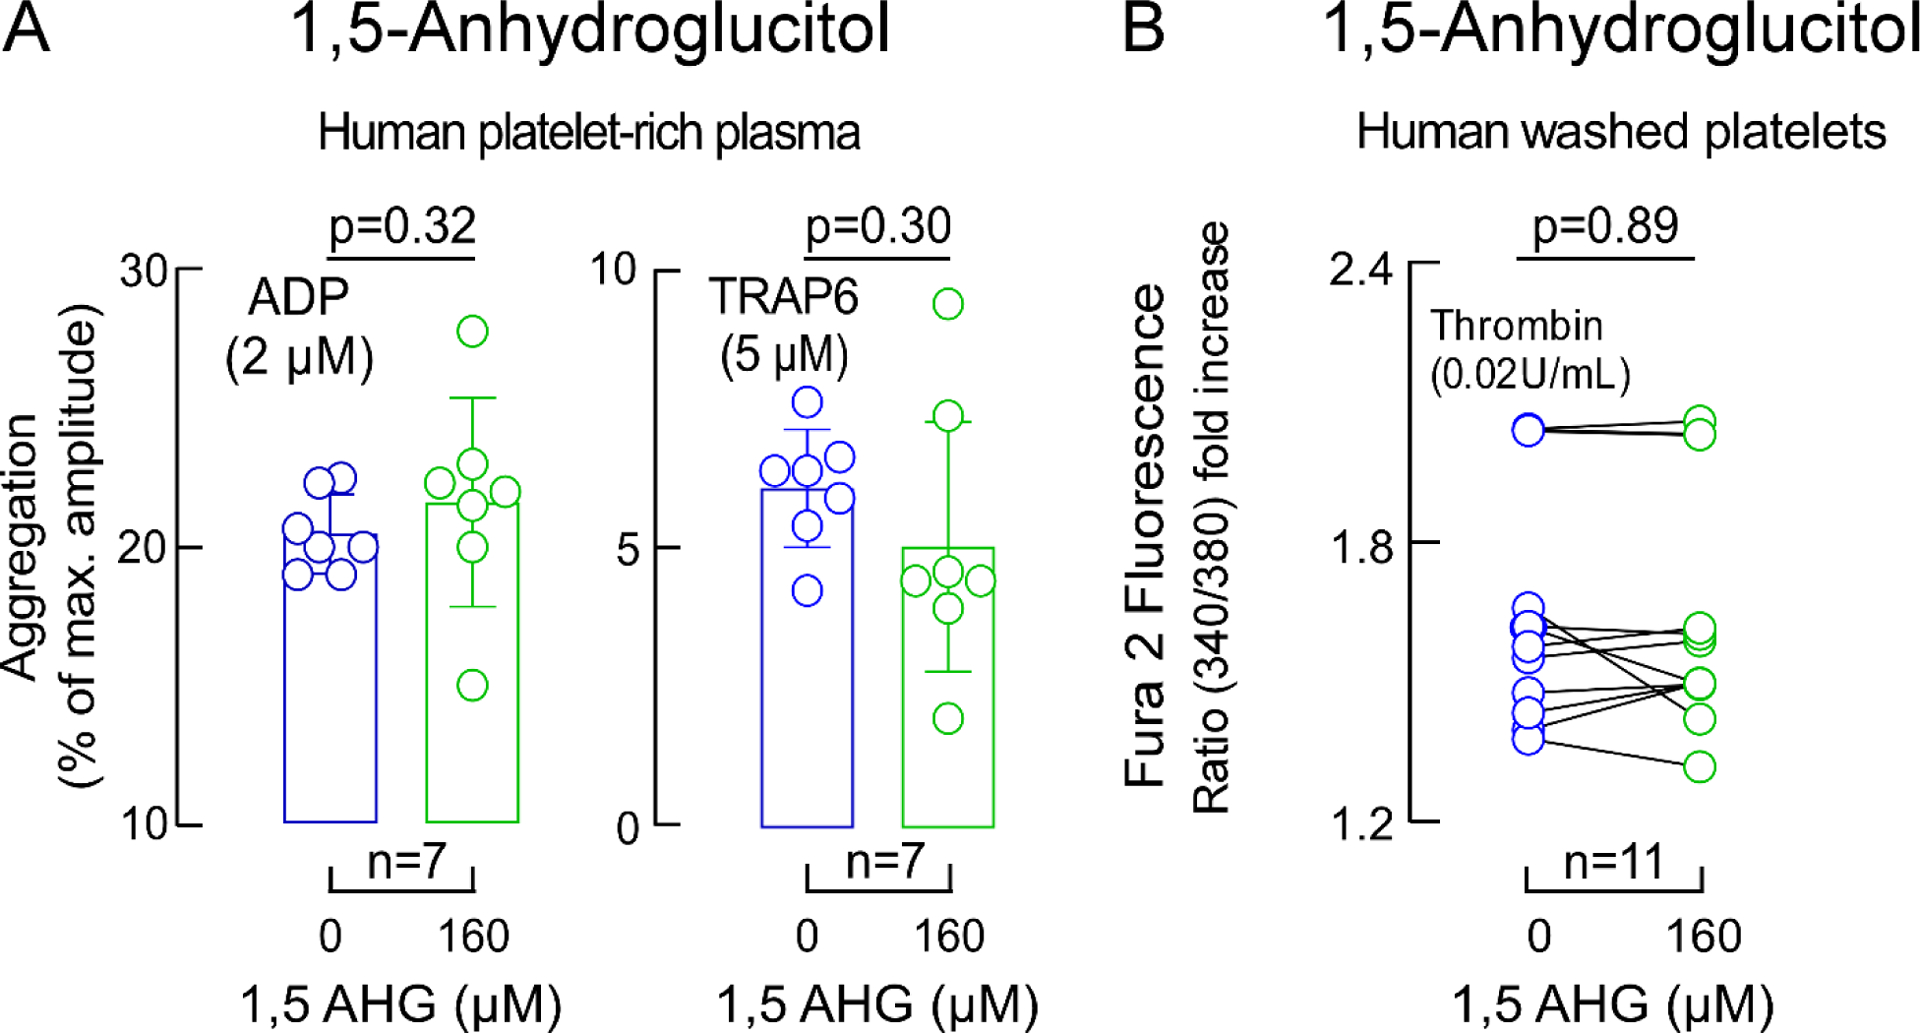
Panel A ADP-stimulated and Thrombin receptor-activating peptide (TRAP)6-stimulated platelet aggregometry responses in human platelet-rich plasma incubated with 1,5-AHG (green) versus vehicle (saline, blue). Two-sided P values were calculated by Mann Whitney Test. For ADP and TRAP6 stimulated platelet-rich plasma n=7. Panel B shows thrombin-induced (0.02 U) changes in intracellular calcium concentration in Fura 2-filled washed human platelets incubated with 1,5-AHG (green) or vehicle (saline, blue). Data represent mean (±SD). Two-sided P values were calculated by Wilcoxon matched-pairs signed rank test. Numbers of independent biological replicates (n) are indicated.
Extended Display Figure 7. Impact of 1,5-Anhydroglucitol (AHG) and glucose on platelet activation.
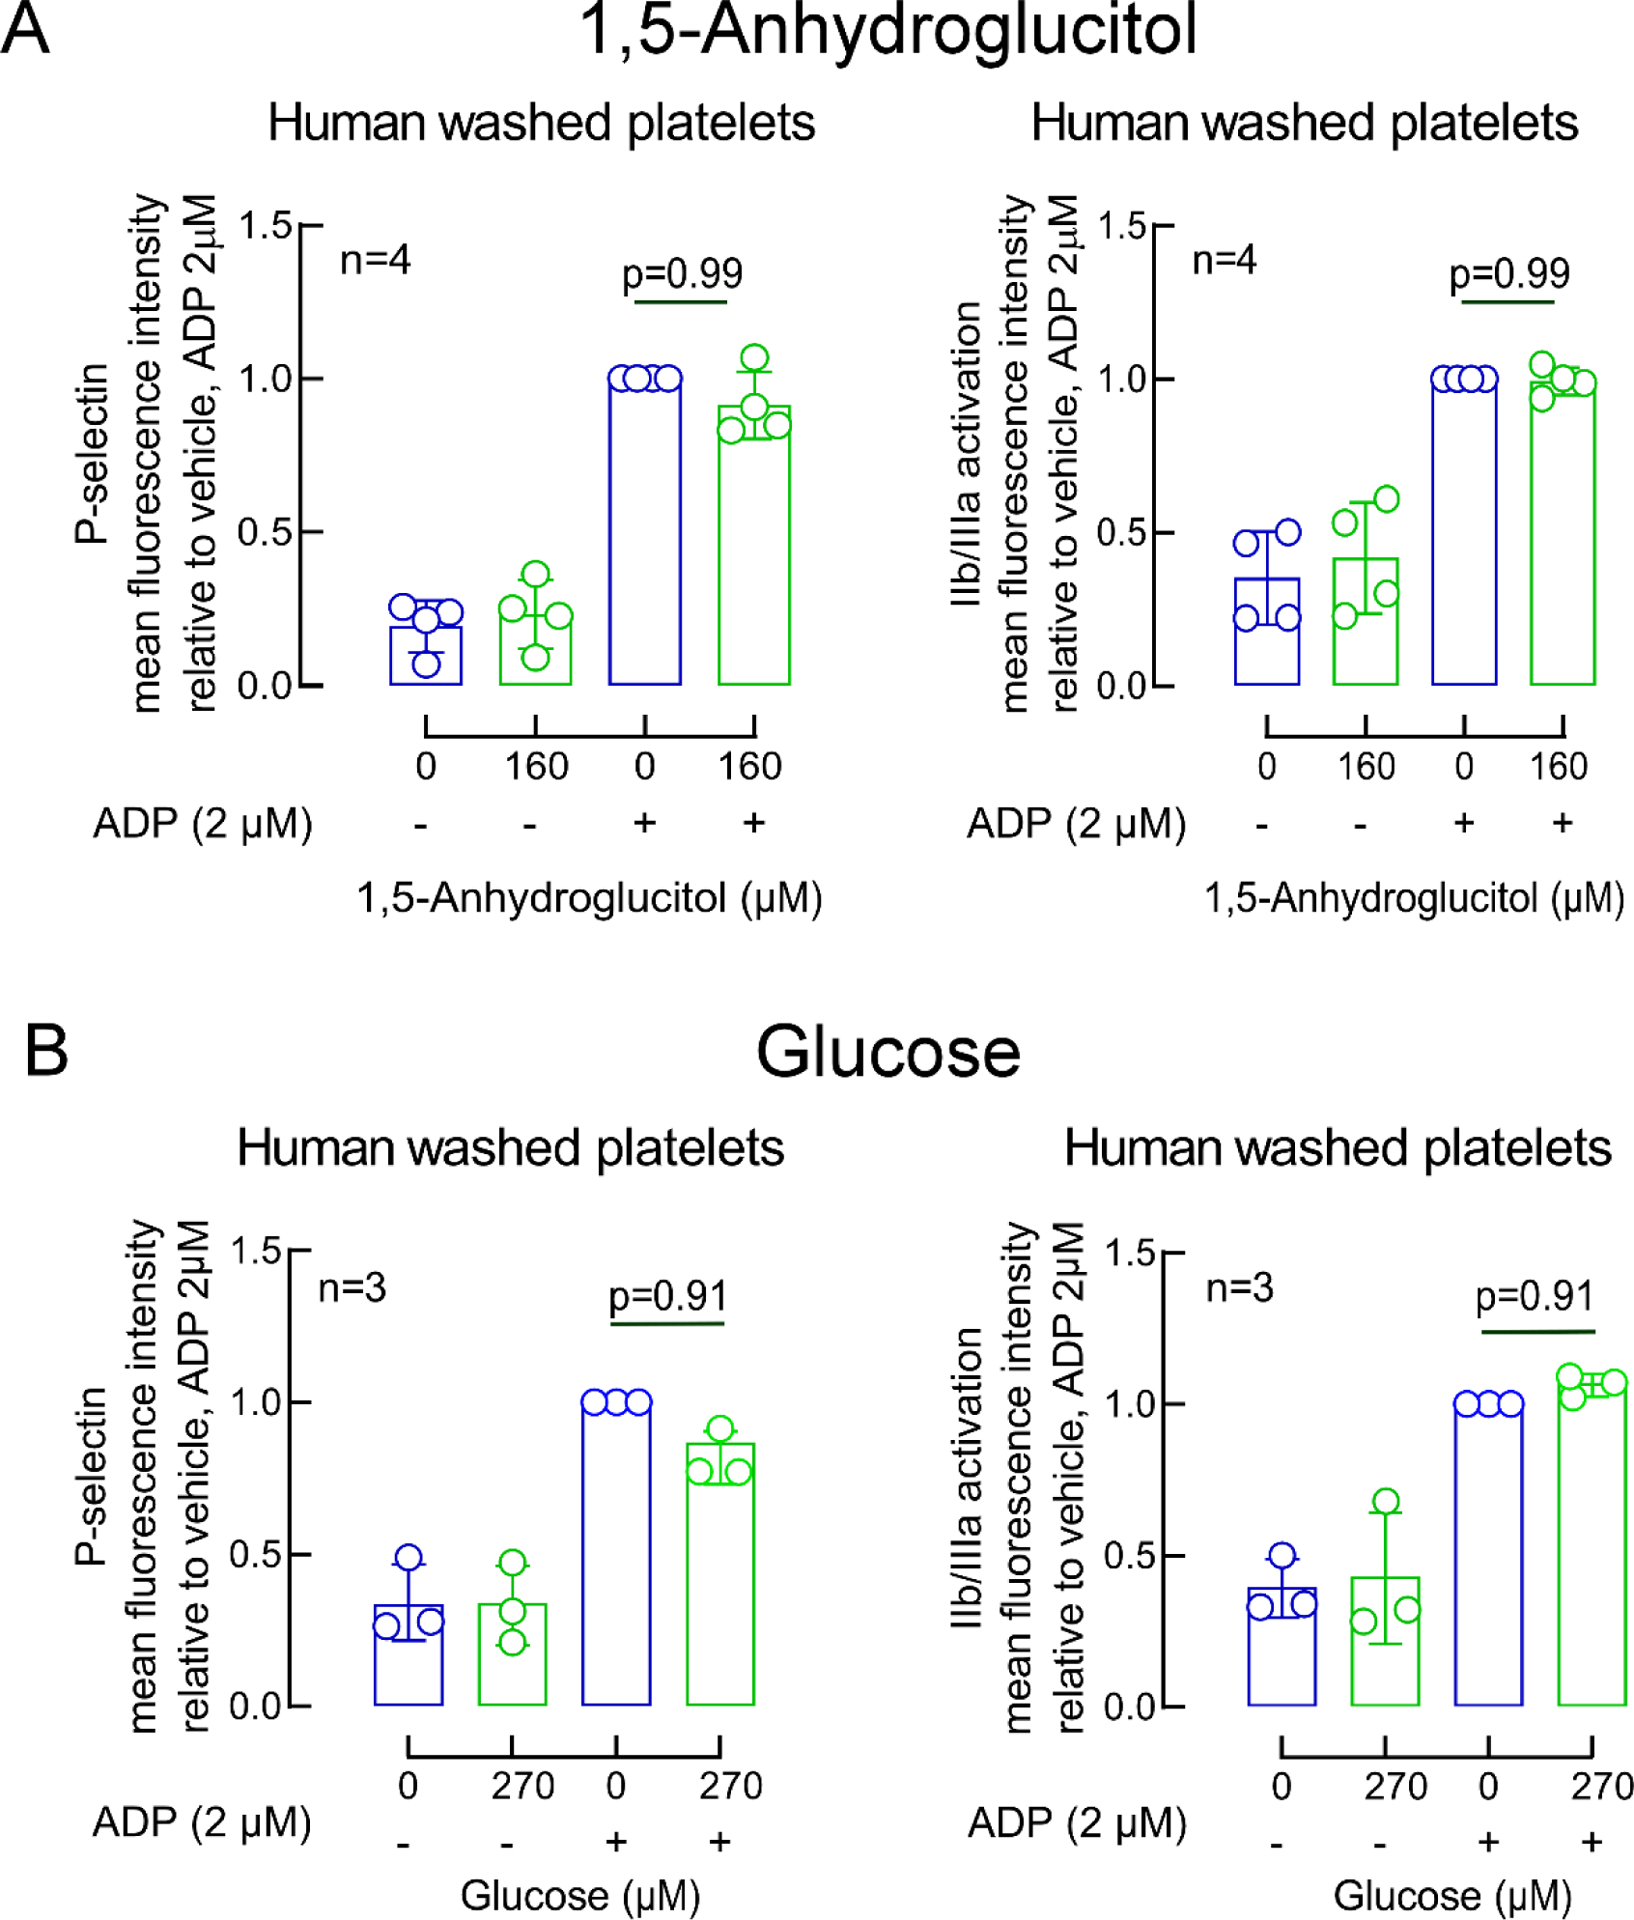
ADP-induced changes in GP IIb/IIIa (PAC-1 antibody staining) and P-selectin surface expression in washed human platelets pre-incubated with vehicle (saline, blue) or the indicated concentrations of either 1,5-AHG (green, panel A) or glucose (green, panel B). Bars represent means (±SD), Two-sided P values were calculated by Kruskal–Wallis test with Dunn’s post hoc test for multiple-group comparisons. Numbers of independent biological replicates (n) are indicated.
Extended Display Figure 8. Impact of erythritol at different physiological concentrations on platelet aggregation responses.
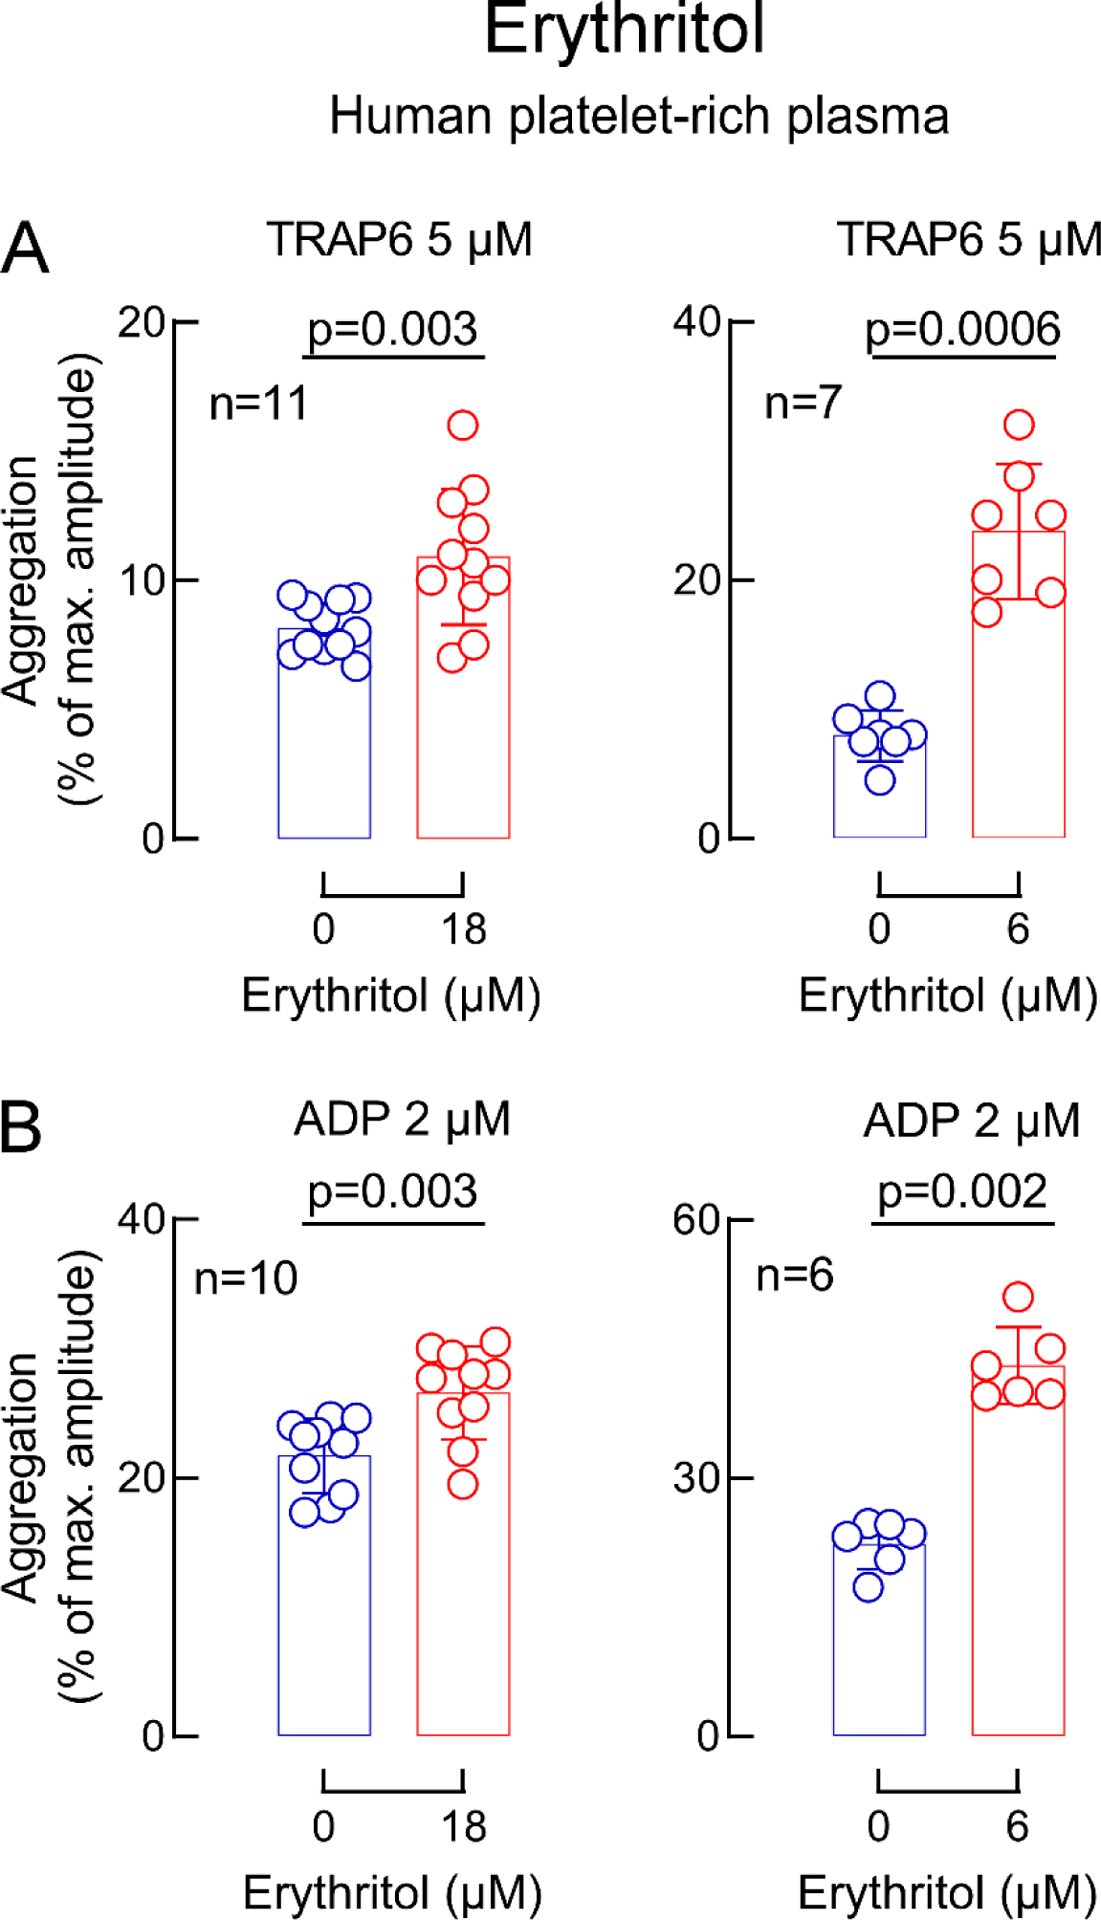
Human platelet-rich plasma was incubated with erythritol (red) at low levels observed in fasting patients (18 μM) and higher concentrations observed after erythritol ingestions (6 mM) versus vehicle (saline, blue). Shown are thrombin receptor-activating peptide(TRAP)6-stimulated (panel A) and ADP-stimulated (panel B) platelet aggregometry responses. Data in bar graphs are represented as means (±SD). Two-sided P values were calculated by Mann Whitney Test. Numbers of independent biological replicates (n) are indicated.
Supplementary Material
Acknowledgements
This work is supported by grants from the NIH and Office of Dietary Supplements P01 HL147823, R01 HL103866 (S.L.H.), the Leducq Foundation #17CVD01 (S.L.H., U.L.) and the Deutsche Forschungsgemeinschaft WI 5229/1-1 (M.W.). A.H. is participant in the BIH-Charité Advanced Clinician Scientist Program funded by the Charité - Universitätsmedizin Berlin and the Berlin Institute of Health. The LipidCardio Study was partially funded by the Sanofi-Aventis Deutschland GmbH (I.D., U.L.). P.P.S. was supported in part by an AHA postdoctoral grant 20POST35210937. The funders had no role in study design, data collection and analysis, decision to publish or preparation of the manuscript.
We thank Dr. Gauravi Deshpande for technical support during whole blood in vitro thrombosis studies. We also thank Marc Ferrell for assistance in data analysis and Taylor Weeks for editing the manuscript.
Competing Interests
Dr. Hazen reports being named as co-inventor on pending and issued patents held by the Cleveland Clinic relating to cardiovascular diagnostics and therapeutics, being a paid consultant formerly for Procter & Gamble and currently with Zehna Therapeutics. He also reports having received research funds from Procter & Gamble, Zehna Therapeutics and Roche Diagnostics, and being eligible to receive royalty payments for inventions or discoveries related to cardiovascular diagnostics or therapeutics from Cleveland HeartLab, a wholly owned subsidiary of Quest Diagnostics, Procter & Gamble and Zehna therapeutics. Dr. Tang reports being a consultant for Sequana Medical A.G., Owkin Inc, Relypsa Inc, and PreCardiac Inc, having received honorarium from Springer Nature for authorship/editorship and American Board of Internal Medicine for exam writing committee participation - all unrelated to the subject and contents of this paper. The other authors have reported that they have no relationships relevant to the contents of this paper to disclose.
Footnotes
Code Availability
Custom R codes used in this manuscript are available at “https://doi.org/10.5281/zenodo.6780497”. The BinBase data base is accessible using the following link “https://bitbucket.org/fiehnlab/binbase/src/master/?”
Data Availability
There are restrictions to the availability of some of the clinical data generated in the present study (Figure 1 and 2), because we do not have permission in our informed consent from research subjects to share data outside our institution without their authorizations. Where permissible, the datasets generated and/or analysed during the present studies are available from the corresponding author Stanley L. Hazen (hazens@ccf.org) on request. An answer can be expected within 14 days.
References
- 1.Abarca-Gómez L, et al. Worldwide trends in body-mass index, underweight, overweight, and obesity from 1975 to 2016: a pooled analysis of 2416 population-based measurement studies in 128·9 million children, adolescents, and adults. The Lancet 390, 2627–2642 (2017). [DOI] [PMC free article] [PubMed] [Google Scholar]
- 2.Sylvetsky AC & Rother KI Trends in the consumption of low-calorie sweeteners. Physiol Behav 164, 446–450 (2016). [DOI] [PMC free article] [PubMed] [Google Scholar]
- 3.Buerge IJ, Buser HR, Kahle M, Müller MD & Poiger T Ubiquitous occurrence of the artificial sweetener acesulfame in the aquatic environment: an ideal chemical marker of domestic wastewater in groundwater. Environ Sci Technol 43, 4381–4385 (2009). [DOI] [PubMed] [Google Scholar]
- 4.Roberts A The safety and regulatory process for low calorie sweeteners in the United States. Physiol Behav 164, 439–444 (2016). [DOI] [PubMed] [Google Scholar]
- 5.Mortensen A Sweeteners permitted in the European Union: safety aspects. Scandinavian Journal of Food and Nutrition 50, 104–116 (2006). [Google Scholar]
- 6.Gardner C, et al. Nonnutritive sweeteners: current use and health perspectives: a scientific statement from the American Heart Association and the American Diabetes Association. Circulation 126, 509–519 (2012). [DOI] [PubMed] [Google Scholar]
- 7.British Dietetic Association. Policy statement-The Use of Artificial Sweeteners. Available at: https://www.bda.uk.com/uploads/assets/11ea5867-96eb-43df-b61f2cbe9673530d/policystatementsweetners.pdf
- 8.Markovic TP, Proietto J, Dixon JB, et al. The Australian Obesity Management Algorithm: A simple tool to guide the management of obesity in primary care. Obes Res Clin Pract 16, 353–363 (2022). doi: 10.1016/j.orcp.2022.08.003 [DOI] [PubMed] [Google Scholar]
- 9.Ruanpeng D, Thongprayoon C, Cheungpasitporn W & Harindhanavudhi T Sugar and artificially sweetened beverages linked to obesity: a systematic review and meta-analysis. Qjm 110, 513–520 (2017). [DOI] [PubMed] [Google Scholar]
- 10.Romo-Romo A, Aguilar-Salinas CA, Brito-Córdova GX, Gómez-Díaz RA & Almeda-Valdes P Sucralose decreases insulin sensitivity in healthy subjects: a randomized controlled trial. Am J Clin Nutr 108, 485–491 (2018). [DOI] [PubMed] [Google Scholar]
- 11.Imamura F, et al. Consumption of sugar sweetened beverages, artificially sweetened beverages, and fruit juice and incidence of type 2 diabetes: systematic review, meta-analysis, and estimation of population attributable fraction. BMJ : British Medical Journal 351, h3576 (2015). [DOI] [PMC free article] [PubMed] [Google Scholar]
- 12.Mossavar-Rahmani Y, et al. Artificially Sweetened Beverages and Stroke, Coronary Heart Disease, and All-Cause Mortality in the Women’s Health Initiative. Stroke 50, 555–562 (2019). [DOI] [PMC free article] [PubMed] [Google Scholar]
- 13.Malik VS, et al. Long-Term Consumption of Sugar-Sweetened and Artificially Sweetened Beverages and Risk of Mortality in US Adults. Circulation 139, 2113–2125 (2019). [DOI] [PMC free article] [PubMed] [Google Scholar]
- 14.Mullee A, et al. Association Between Soft Drink Consumption and Mortality in 10 European Countries. JAMA Internal Medicine 179, 1479–1490 (2019). [DOI] [PMC free article] [PubMed] [Google Scholar]
- 15.Lohner S, Toews I & Meerpohl JJ Health outcomes of non-nutritive sweeteners: analysis of the research landscape. Nutr J 16, 55 (2017). [DOI] [PMC free article] [PubMed] [Google Scholar]
- 16.Ron Perko PD Sweeteners and Sugar Alternatives in Food Technology. in Sweeteners and Sugar Alternatives in Food Technology (ed. Mitchell H) 151–175 (Blackwell Publishing, 2006). [Google Scholar]
- 17.European Food Safety Authority. Statement in relation to the safety of erythritol (E 968) in light of new data, including a new paediatric study on the gastrointestinal tolerability of erythritol. EFSA Journal 8, 1650 (2010). [Google Scholar]
- 18.Food and Drug Administration. GRAS Notice (GRN) No. 789 (2018). Available at: https://www.fda.gov/media/132946/download
- 19.Bornet FR, Blayo A, Dauchy F & Slama G Plasma and urine kinetics of erythritol after oral ingestion by healthy humans. Regul Toxicol Pharmacol 24, S280–285 (1996). [DOI] [PubMed] [Google Scholar]
- 20.Hootman KC, et al. Erythritol is a pentose-phosphate pathway metabolite and associated with adiposity gain in young adults. Proc Natl Acad Sci U S A 114, E4233–e4240 (2017). [DOI] [PMC free article] [PubMed] [Google Scholar]
- 21.Global Erythritol Market Research Report 2020. Available at: https://www.360researchreports.com/global-erythritol-market-15041957 (2020).
- 22.Yokozawa T, Kim HY & Cho EJ Erythritol attenuates the diabetic oxidative stress through modulating glucose metabolism and lipid peroxidation in streptozotocin-induced diabetic rats. J Agric Food Chem 50, 5485–5489 (2002). [DOI] [PubMed] [Google Scholar]
- 23.Flint N, et al. Effects of erythritol on endothelial function in patients with type 2 diabetes mellitus: a pilot study. Acta Diabetol 51, 513–516 (2014). [DOI] [PMC free article] [PubMed] [Google Scholar]
- 24.Rebholz CM, et al. Serum metabolomic profile of incident diabetes. Diabetologia 61, 1046–1054 (2018). [DOI] [PMC free article] [PubMed] [Google Scholar]
- 25.Selvin E, et al. Association of 1,5-Anhydroglucitol With Cardiovascular Disease and Mortality. Diabetes 65, 201–208 (2016). [DOI] [PMC free article] [PubMed] [Google Scholar]
- 26.Zhu W, et al. Gut Microbial Metabolite TMAO Enhances Platelet Hyperreactivity and Thrombosis Risk. Cell 165, 111–124 (2016). [DOI] [PMC free article] [PubMed] [Google Scholar]
- 27.Schlicker L, et al. Unexpected roles for ADH1 and SORD in catalyzing the final step of erythritol biosynthesis. J Biol Chem 294, 16095–16108 (2019). [DOI] [PMC free article] [PubMed] [Google Scholar]
- 28.Regnat K, Mach RL & Mach-Aigner AR Erythritol as sweetener-wherefrom and whereto? Appl Microbiol Biotechnol 102, 587–595 (2018). [DOI] [PMC free article] [PubMed] [Google Scholar]
- 29.Tetzloff W, Dauchy F, Medimagh S, Carr D & Bär A Tolerance to subchronic, high-dose ingestion of erythritol in human volunteers. Regul Toxicol Pharmacol 24, S286–295 (1996). [DOI] [PubMed] [Google Scholar]
- 30.Bornet FR, Blayo A, Dauchy F & Slama G Gastrointestinal response and plasma and urine determinations in human subjects given erythritol. Regul Toxicol Pharmacol 24, S296–302 (1996). [DOI] [PubMed] [Google Scholar]
- 31.Munro IC, et al. Erythritol: an interpretive summary of biochemical, metabolic, toxicological and clinical data. Food Chem Toxicol 36, 1139–1174 (1998). [DOI] [PubMed] [Google Scholar]
- 32.Gardener H, et al. Diet soft drink consumption is associated with an increased risk of vascular events in the Northern Manhattan Study. J Gen Intern Med 27, 1120–1126 (2012). [DOI] [PMC free article] [PubMed] [Google Scholar]
- 33.Narain A, Kwok CS & Mamas MA Soft drinks and sweetened beverages and the risk of cardiovascular disease and mortality: a systematic review and meta-analysis. Int J Clin Pract 70, 791–805 (2016). [DOI] [PubMed] [Google Scholar]
- 34.Vyas A, et al. Diet drink consumption and the risk of cardiovascular events: a report from the Women’s Health Initiative. J Gen Intern Med 30, 462–468 (2015). [DOI] [PMC free article] [PubMed] [Google Scholar]
- 35.Lin J & Curhan GC Associations of sugar and artificially sweetened soda with albuminuria and kidney function decline in women. Clin J Am Soc Nephrol 6, 160–166 (2011). [DOI] [PMC free article] [PubMed] [Google Scholar]
- 36.de Koning L, et al. Sweetened beverage consumption, incident coronary heart disease, and biomarkers of risk in men. Circulation 125, 1735–1741, s1731 (2012). [DOI] [PMC free article] [PubMed] [Google Scholar]
- 37.de Koning L, Malik VS, Rimm EB, Willett WC & Hu FB Sugar-sweetened and artificially sweetened beverage consumption and risk of type 2 diabetes in men. The American Journal of Clinical Nutrition 93, 1321–1327 (2011). [DOI] [PMC free article] [PubMed] [Google Scholar]
- 38.Suez J, et al. Personalized microbiome-driven effects of non-nutritive sweeteners on human glucose tolerance. Cell 185, 3307–3328.e3319 (2022). [DOI] [PubMed] [Google Scholar]
- 39.Debras C, et al. Artificial sweeteners and risk of cardiovascular diseases: results from the prospective NutriNet-Santé cohort. BMJ 378, e071204 (2022). [DOI] [PMC free article] [PubMed] [Google Scholar]
- 40.Toews I, Lohner S, Küllenberg de Gaudry D, Sommer H & Meerpohl JJ Association between intake of non-sugar sweeteners and health outcomes: systematic review and meta-analyses of randomised and non-randomised controlled trials and observational studies. Bmj 364, k4718 (2019). [DOI] [PMC free article] [PubMed] [Google Scholar]
- 41.Azad MB, et al. Nonnutritive sweeteners and cardiometabolic health: a systematic review and meta-analysis of randomized controlled trials and prospective cohort studies. Cmaj 189, E929–e939 (2017). [DOI] [PMC free article] [PubMed] [Google Scholar]
- 42.Miller PE & Perez V Low-calorie sweeteners and body weight and composition: a meta-analysis of randomized controlled trials and prospective cohort studies. Am J Clin Nutr 100, 765–777 (2014). [DOI] [PMC free article] [PubMed] [Google Scholar]
- 43.McGlynn ND, et al. Association of Low- and No-Calorie Sweetened Beverages as a Replacement for Sugar-Sweetened Beverages With Body Weight and Cardiometabolic Risk: A Systematic Review and Meta-analysis. JAMA Netw Open 5, e222092 (2022). [DOI] [PMC free article] [PubMed] [Google Scholar]
- 44.Sylvetsky AC, Blau JE & Rother KI Understanding the metabolic and health effects of low-calorie sweeteners: methodological considerations and implications for future research. Rev Endocr Metab Disord 17, 187–194 (2016). [DOI] [PMC free article] [PubMed] [Google Scholar]
- 45.Wang Z, et al. Metabolomic Pattern Predicts Incident Coronary Heart Disease. Arterioscler Thromb Vasc Biol 39, 1475–1482 (2019). [DOI] [PMC free article] [PubMed] [Google Scholar]
- 46.Tang WH, et al. Intestinal microbial metabolism of phosphatidylcholine and cardiovascular risk. N Engl J Med 368, 1575–1584 (2013). [DOI] [PMC free article] [PubMed] [Google Scholar]
- 47.Wang Z, et al. Gut flora metabolism of phosphatidylcholine promotes cardiovascular disease. Nature 472, 57–63 (2011). [DOI] [PMC free article] [PubMed] [Google Scholar]
- 48.Stevens LA, et al. Comparative performance of the CKD Epidemiology Collaboration (CKD-EPI) and the Modification of Diet in Renal Disease (MDRD) Study equations for estimating GFR levels above 60 mL/min/1.73 m2. Am J Kidney Dis 56, 486–495 (2010). [DOI] [PMC free article] [PubMed] [Google Scholar]
- 49.König M, et al. Cohort profile: role of lipoproteins in cardiovascular disease-the LipidCardio study. BMJ Open 9, e030097 (2019). [DOI] [PMC free article] [PubMed] [Google Scholar]
- 50.STROBE Statement – checklist of items that should be included in reports of observational studies1 (© STROBE Initiative). International Journal of Public Health 53, 3–4 (2008). [DOI] [PubMed] [Google Scholar]
- 51.Nemet I, et al. A Cardiovascular Disease-Linked Gut Microbial Metabolite Acts via Adrenergic Receptors. Cell 180, 862–877.e822 (2020). [DOI] [PMC free article] [PubMed] [Google Scholar]
- 52.Gupta N, Li W & McIntyre TM Deubiquitinases Modulate Platelet Proteome Ubiquitination, Aggregation, and Thrombosis. Arterioscler Thromb Vasc Biol 35, 2657–2666 (2015). [DOI] [PMC free article] [PubMed] [Google Scholar]
- 53.Scavone M, et al. Platelet Adhesion and Thrombus Formation in Microchannels: The Effect of Assay-Dependent Variables. Int J Mol Sci 21, 750 (2020). [DOI] [PMC free article] [PubMed] [Google Scholar]
- 54.Witkowski M, et al. Vascular endothelial tissue factor contributes to trimethylamine N-oxide-enhanced arterial thrombosis. Cardiovascular Research (2021). [DOI] [PMC free article] [PubMed] [Google Scholar]
- 55.Fiehn O, Wohlgemuth G & Scholz M Setup and Annotation of Metabolomic Experiments by Integrating Biological and Mass Spectrometric Metadata. in Data Integration in the Life Sciences (eds. Ludäscher B & Raschid L) 224–239 (Springer Berlin Heidelberg, Berlin, Heidelberg, 2005). [Google Scholar]
- 56.Wilson PW, et al. Prediction of coronary heart disease using risk factor categories. Circulation 97, 1837–1847 (1998). [DOI] [PubMed] [Google Scholar]
- 57.SCORE2 working group and ESC Cardiovascular risk collaboration. SCORE2 risk prediction algorithms: new models to estimate 10-year risk of cardiovascular disease in Europe. European Heart Journal 42, 2439–2454 (2021). [DOI] [PMC free article] [PubMed] [Google Scholar]
Associated Data
This section collects any data citations, data availability statements, or supplementary materials included in this article.
Supplementary Materials
Data Availability Statement
There are restrictions to the availability of some of the clinical data generated in the present study (Figure 1 and 2), because we do not have permission in our informed consent from research subjects to share data outside our institution without their authorizations. Where permissible, the datasets generated and/or analysed during the present studies are available from the corresponding author Stanley L. Hazen (hazens@ccf.org) on request. An answer can be expected within 14 days.


