

Abstract
This cross-sectional study uses data from the National Health Interview Survey to examine the prevalence of and trends in diagnosed learning disability among US children and adolescents from 1997 to 2021.
Learning disability (LD) is a group of heterogeneous disorders manifested by substantial difficulties in listening, speaking, reading, writing, reasoning, or mathematical abilities.1 Research indicates that LD has become a major health concern for children in the US.2 Literature reported that the prevalence of LD among children varied from 8.7% to 9.7% based on data from the National Health Interview Survey (NHIS) from 2004 to 2006 and the 2003 National Survey of Children’s Health, respectively.1,3 However, research on long-term trend over the past decades is lacking. The aim of this cross-sectional study was to estimate the prevalence of LD and its long-term trend among US children and adolescents aged 6 to 17 years from 1997 to 2021.
Methods
Data were obtained from the 1997 to 2021 NHIS, a national representative household survey using multistage stratified sampling to collect information.4 Information about LD diagnosed by a school or health professional was reported by a parent or guardian. The conditional sample child response rate was 85.6% to 93.5% from 1997 to 2021. The Guangdong Pharmaceutical University academic review board deemed the study exempt from review because of the use of deidentified data. The NHIS has been approved by the National Center for Health Statistics ethics review board, and all respondents provided verbal informed consent before participation. The study followed the STROBE reporting guideline.
The weighted prevalence of LD among individuals in the US aged 6 to 17 years from 1997 to 2021 was calculated based on the complex sampling design following NHIS statistical guidelines.5 Statistical analyses were performed using SAS, version 9.4. Two-sided P < .05 was considered statistically significant.
Results
Of 188 449 individuals aged 6 to 17 years (48.39% female; 51.61% male), 8.76% were reported to have a diagnosis of LD from 1997 to 2021. The prevalence of LD was 8.83% (95% CI, 8.65%-9.01%). A significant difference in prevalence was observed in age (12-17 years: 9.78% [95% CI, 9.52%-10.04%]; 6-11 years: 7.86% [95% CI, 7.63%-8.10%]; P < .001), sex (female: 6.56% [95% CI, 6.35%-6.77%]; male: 11.00% [95% CI, 10.72%-11.27%]; P < .001), race and ethnicity (Hispanic: 7.82% [95% CI, 7.49%-8.15%]; non-Hispanic Black: 10.03% [95% CI, 9.53%-10.54%]; non-Hispanic White: 9.25% [95% CI, 9.00%-9.49%]; other: 6.23% [95% CI, 5.75%-6.71%]; P < .001), family income to poverty ratio (<1.00: 13.46% [95% CI, 12.89%-14.03%]; 1.00-1.99: 10.39% [95% CI, 9.97%-10.81%]; 2.00-3.99: 8.17% [95% CI, 7.84%-8.50%]; ≥4.00: (6.59% [95% CI, 6.32%-6.87%]; P < .001), and highest educational level of family members (less than high school: 11.62% [95% CI, 11.06%-12.19%]; high school: 10.05% [95% CI, 9.62%-10.48%]; college or higher: 8.04% [95% CI, 7.84%-8.23%]; P < .001) (Table).
Table. Prevalence of Diagnosed LD Among US Children and Adolescents Aged 6 to 17 Years From 1997 to 2021.
| Characteristic | Participants, No. (%)a | Prevalence of LD, % (95% CI)a | P valueb | |
|---|---|---|---|---|
| With LD | Without LD | |||
| Overall | 16 499 | 171 950 | 8.83 (8.65-9.01) | NA |
| Age, y | ||||
| 6-11 | 6805 (44.30) | 80 876 (50.25) | 7.86 (7.63-8.10) | <.001 |
| 12-17 | 9694 (55.70) | 91 074 (49.75) | 9.78 (9.52-10.04) | |
| Sex | ||||
| Female | 5832 (36.38) | 85 366 (50.14) | 6.56 (6.35-6.77) | <.001 |
| Male | 10 667 (63.62) | 86 584 (49.86) | 11.00 (10.72-11.27) | |
| Race and ethnicityc | ||||
| Hispanic | 3785 (18.18) | 46 276 (20.76) | 7.82 (7.49-8.15) | <.001 |
| Non-Hispanic Black | 2709 (16.07) | 25 390 (13.95) | 10.03 (9.53-10.54) | |
| Non-Hispanic White | 9031 (60.18) | 85 348 (57.18) | 9.25 (9.00-9.49) | |
| Otherd | 974 (5.57) | 14 936 (8.11) | 6.23 (5.75-6.71) | |
| Highest educational level of family members | ||||
| Less than high school | 2912 (16.47) | 23 506 (12.12) | 11.62 (11.06-12.19) | <.001 |
| High school | 3492 (20.43) | 32 098 (17.71) | 10.05 (9.62-10.48) | |
| College or higher | 10 059 (62.91) | 115 444 (69.71) | 8.04 (7.84-8.23) | |
| Missing | 36 (0.19) | 902 (0.46) | 3.86 (2.24-5.49) | |
| Family income to poverty ratioe | ||||
| <1.00 | 3372 (21.71) | 22 586 (13.51) | 13.46 (12.89-14.03) | <.001 |
| 1.00-1.99 | 3566 (21.87) | 30 867 (18.26) | 10.39 (9.97-10.81) | |
| 2.00-3.99 | 4064 (24.34) | 44 751 (26.47) | 8.17 (7.84-8.50) | |
| ≥4.00 | 3080 (17.95) | 42 237 (24.62) | 6.59 (6.32-6.87) | |
| Missing | 2417 (14.13) | 31 509 (17.14) | 7.39 (7.02-7.76) | |
Abbreviations: LD, learning disability; NA, not applicable.
The numbers of participants and prevalence of LD were weighted.
P value for overall differences in prevalence by stratum.
Race and ethnicity were self-reported and classified based on the 1997 Office of Management and Budget standards. They were included in the analysis because different access to health care or language barriers may be associated with differences in LD reported by parents.
Other races and ethnicities included non-Hispanic American Indian or Alaska Native (individual only), non-Hispanic American Indian or Alaska Native and any other group, non-Hispanic Asian (individual only), and other single and multiple races or declined to respond, no response, or unknown.
The ratio is the total family income divided by the poverty threshold.
Prevalence had no significant mean annual change from 8.98% (95% CI, 8.48%-9.48%) in 1997 and 1998 to 8.31% (95% CI, 7.46%-9.17%) in 2021 (P = .94 for trend). Prevalence among Hispanic youths increased from 7.24% in 1997 and 1998 to 8.24% in 2021 (P = .003 for trend) (Figure).
Figure. Trends in the Prevalence of Learning Disability (LD) Among Children and Adolescents Aged 6 to 17 Years, 1997 to 2021.
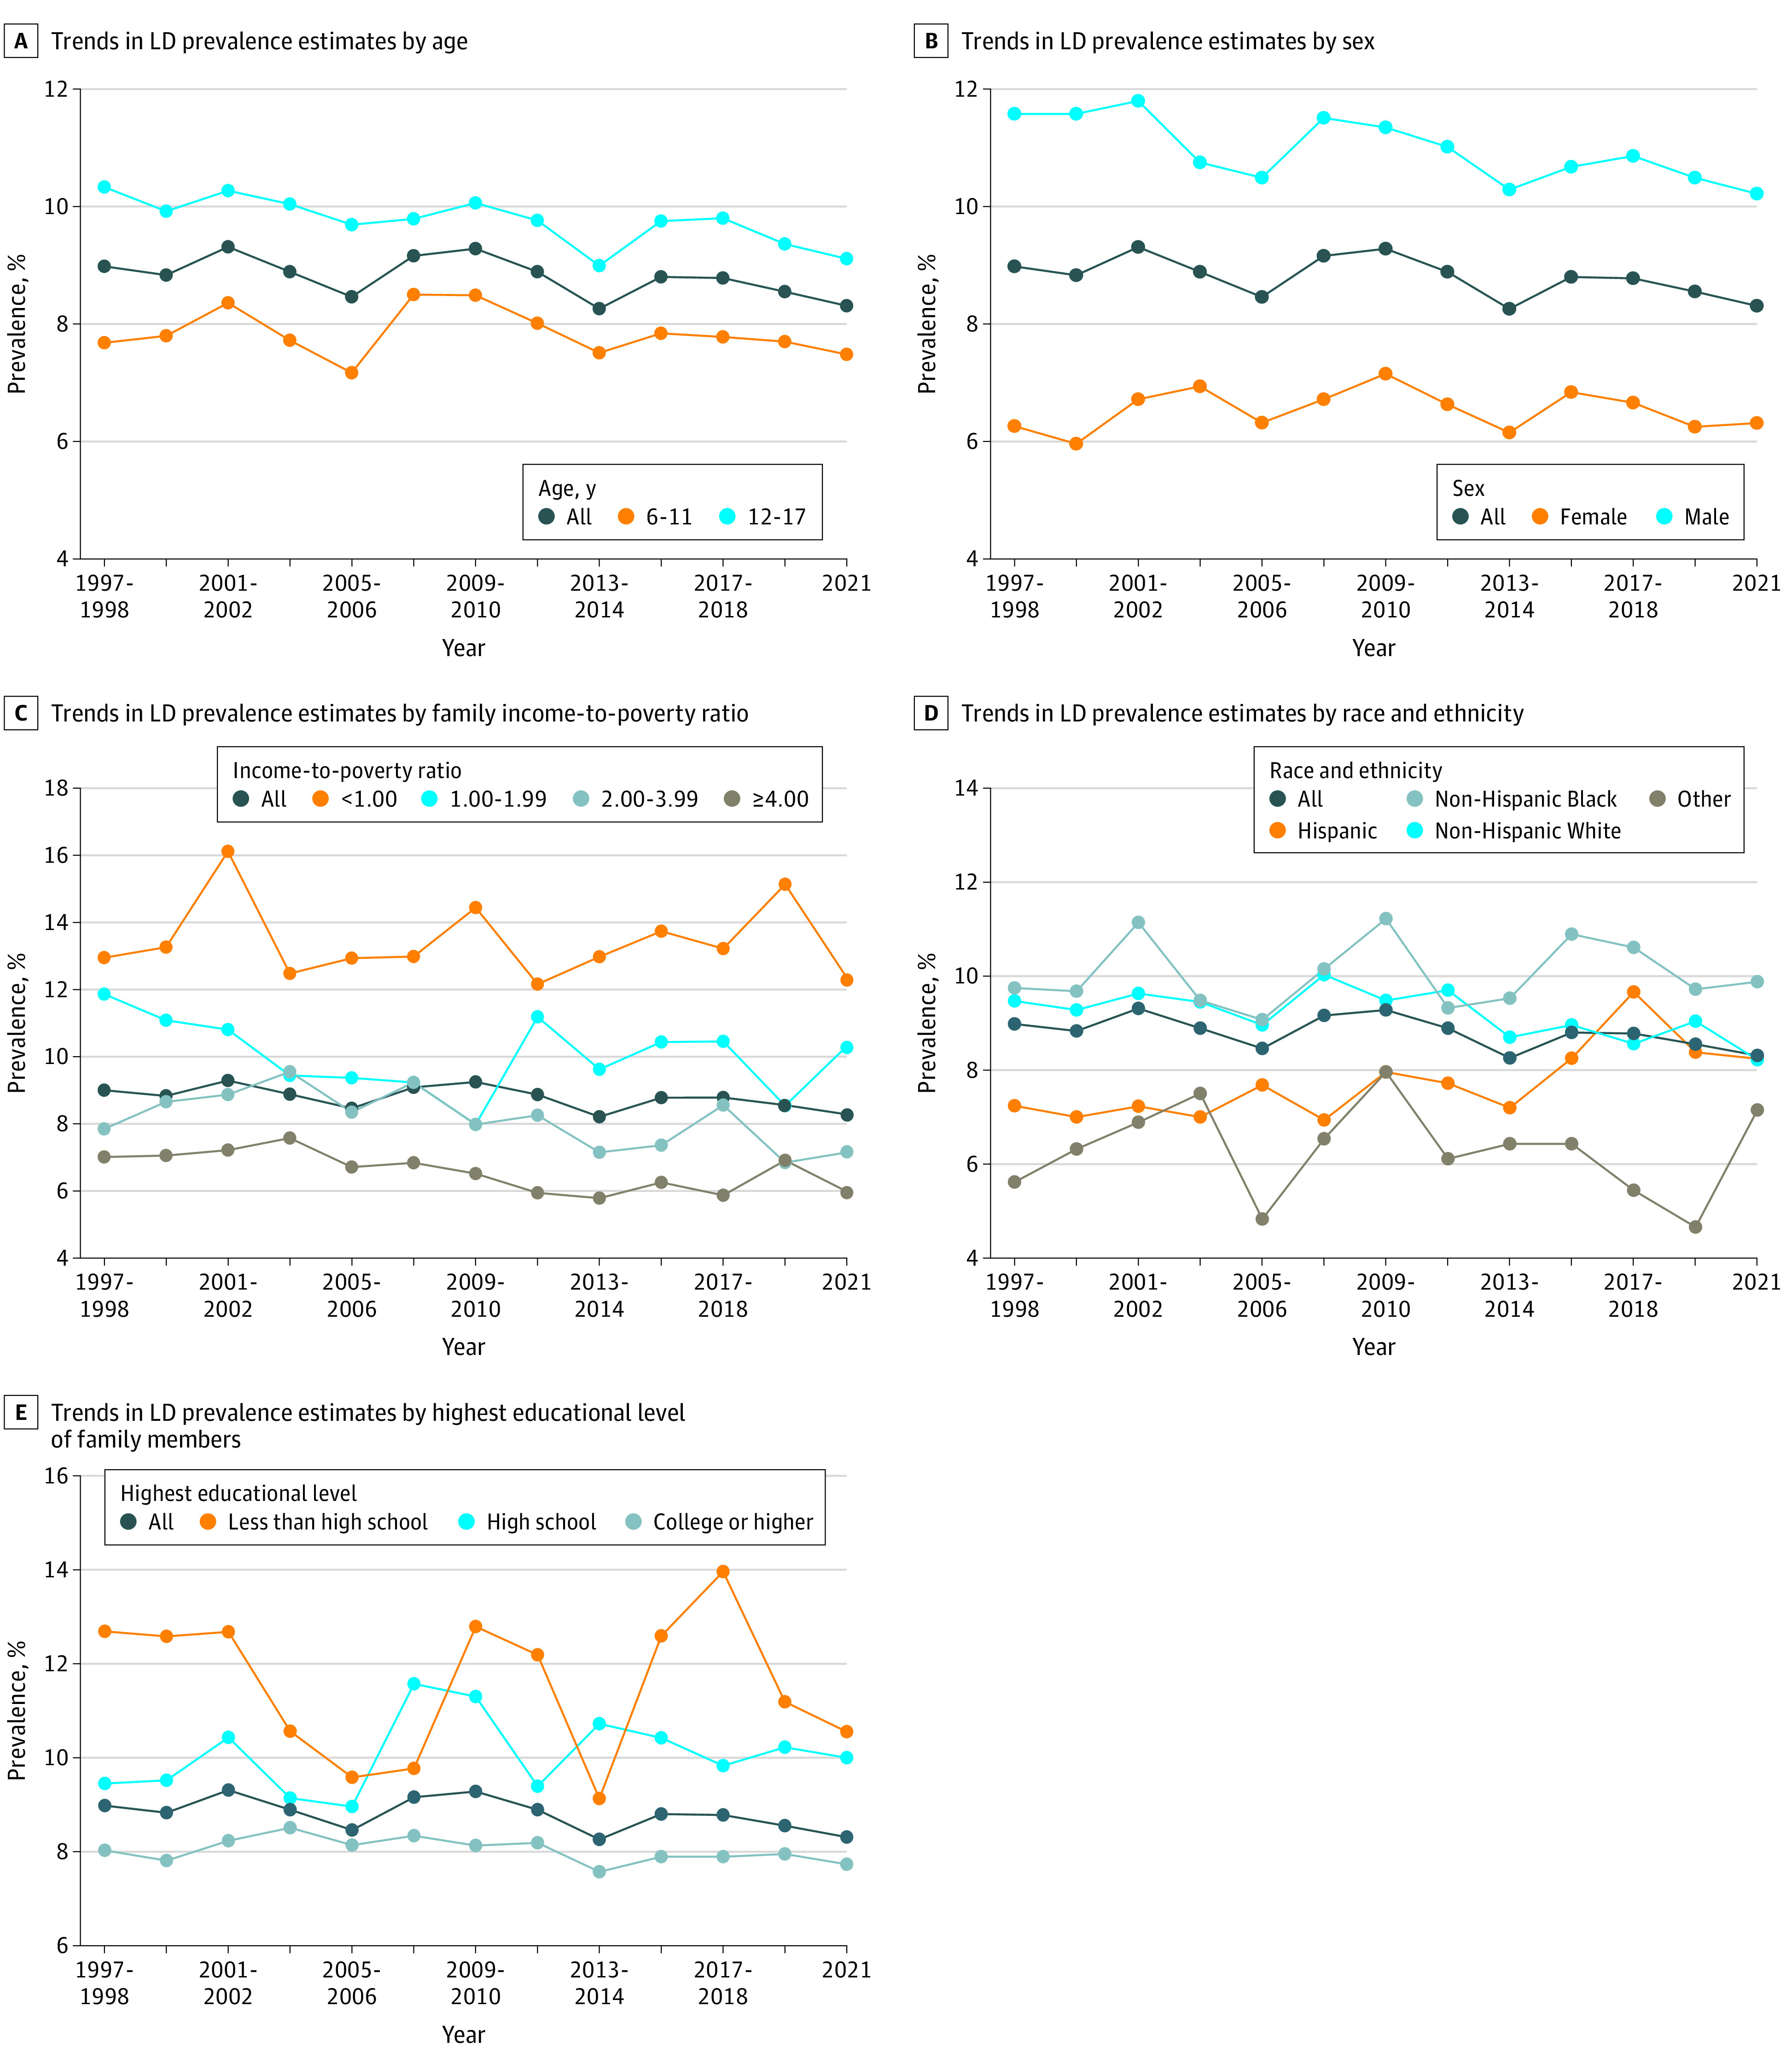
Prevalence estimates were weighted. P for trend was calculated using a weighted logistic regression model, which included survey year as a continuous variable and was adjusted for age, sex, family income, race and ethnicity, and family educational level: age (6-17 years: P = .94; 6-11 years: P = .40; 12-17 years: P = .53), sex (female: P = .06; male: P = .17), family income to poverty ratio (<1.00: P = .08; 1.00-1.99: P = .77; 2.00-3.99: P = .06; ≥4.00: P = .08); race and ethnicity (Hispanic: P = .003; non-Hispanic Black: P = .34; non-Hispanic White: P = .15; other: P = .35); and highest educational level of family members (less than high school: P = .20; high school: P = .07; college or higher: P = .13). Other races and ethnicities included non-Hispanic American Indian or Alaska Native (individual only), non-Hispanic American Indian or Alaska Native and any other group, non-Hispanic Asian (individual only), and other single and multiple races or declined to respond, no response, or unknown.
Discussion
Based on US nationally representative data, the estimated LD prevalence was 8.83% among children and adolescents aged 6 to 17 years from 1997 to 2021, which was slightly higher than that from a previous NHIS study from 2009 to 2017 (7.74%).6 These data indicate that LD is a common chronic condition among US children, affecting about 9 in 100 overall. In this population-based study, no significant annual change was found, which was similar to the Zablotsky et al6 report (7.87% in 2009-2011 to 7.86% in 2015-2017). Notably, we found a rising trend in LD in Hispanic youths from 1997 to 2021. Prevalence of LD differed significantly by age, sex, race and ethnicity, educational level, and family income level, consistent with previous studies.1,3
A study limitation is that information provided by parents may have led to misreporting and recall bias. Given that LD is a lifelong condition and its prevalence remains high, further investigation is warranted to assess potentially modifiable risk factors and causes of LD.
Data Sharing Statement
References
- 1.Altarac M, Saroha E. Lifetime prevalence of learning disability among US children. Pediatrics. 2007;119(suppl 1):S77-S83. doi: 10.1542/peds.2006-2089L [DOI] [PubMed] [Google Scholar]
- 2.Pastor PN, Reuben CA. Attention deficit disorder and learning disability: United States, 1997-98. Vital Health Stat 10. 2002;(206):1-12. [PubMed] [Google Scholar]
- 3.Pastor PN, Reuben CA. Diagnosed attention deficit hyperactivity disorder and learning disability: United States, 2004-2006. Vital Health Stat 10. 2008;(237):1-14. [PubMed] [Google Scholar]
- 4.Parsons VL, Moriarity C, Jonas K, Moore TF, Davis KE, Tompkins L. Design and estimation for the national health interview survey, 2006-2015. Vital Health Stat 2. 2014;(165):1-53. [PubMed] [Google Scholar]
- 5.US Centers for Disease Control and Prevention; National Center for Health Statistics . National Health Interview Survey: methods. Accessed April 12, 2023. https://www.cdc.gov/nchs/nhis/methods.htm
- 6.Zablotsky B, Black LI, Maenner MJ, et al. Prevalence and trends of developmental disabilities among children in the United States: 2009-2017. Pediatrics. 2019;144(4):e20190811. doi: 10.1542/peds.2019-0811 [DOI] [PMC free article] [PubMed] [Google Scholar]
Associated Data
This section collects any data citations, data availability statements, or supplementary materials included in this article.
Supplementary Materials
Data Sharing Statement