

Abstract
The World Health Organization has identified snakebite envenoming as a highest priority neglected tropical disease, yet there is a dearth of epidemiologic research on environmental risk factors, including outdoor temperature. Temperature may affect snakebites through human behavior or snake behavior; snakes are ectotherms, meaning outdoor temperatures influence their internal body temperature and thus their behavior. Here we investigate the relationship between short‐term temperature and snakebites in Georgia, one of the most biodiverse US states in terms of herpetofauna. We acquired emergency department (ED) visit data for Georgia between 1 January 2014 and 31 December 2020. Visits for venomous and non‐venomous snakebites were identified using diagnosis codes. For comparison, we also considered visits for non‐snake (e.g., insects, spiders, scorpions) envenomation. Daily meteorology from the Daymet 1 km product was linked to patient residential ZIP codes. We applied a case‐crossover design to estimate associations of daily maximum temperature and snakebite ED visits. During the 7‐year study period, there were 3,908 visits for venomous snakebites, 1,124 visits for non‐venomous bites and 65,187 visits for non‐snake envenomation. Across the entire period, a 1°C increase in same‐day maximum temperature was associated with a 5.6% (95%CI: 4.0–7.3) increase in the odds of venomous snakebite and a 5.8% (95%CI: 3.0–8.8) increase in non‐venomous snakebite. Associations were strongest in the spring. We also observed a positive and significant (p < 0.05) association for non‐snake envenomation, albeit slightly smaller and more consistent across seasons compared to those for snakebites.
Keywords: temperature, snakebite, climate change, epidemiology, ecology
Key Points
Hospital visits for venomous and non‐venomous snakebite increase with temperature
Seasonal differences in the association may reflect snake behavior and ecology
Non‐snake envenomation (bees, spiders, etc.) is also associated, but less strongly
1. Introduction
An estimated 5.4 million snakebites occur globally each year (World Health Organization, 2019). Roughly half involve envenomation and 81,000–138,000 result in death (Chippaux, 1998; Gutierrez et al., 2017; Kasturiratne et al., 2008). The World Health Organization (WHO) has identified snakebite envenoming as a highest priority neglected tropical disease, and one with inadequate epidemiological reporting (World Health Organization, 2018).
There are three broad types of snakebite. The first are bites when a venomous snake envenomates the victim. Poor outcomes related to envenomation are often preventable with proper treatment, but if untreated can progress to irreversible damage including permanent limb dysfunction or death, which often occurs through respiratory failure (elapid species) or hemorrhagic shock (viper species) (Ahmed et al., 2008; Gutierrez et al., 2017; Langley et al., 2020; Lavonas et al., 2011). The second type is a “dry bite” from a venomous species, when a bite occurs but no venom is injected. The third type are bites from non‐venomous species. The latter two are generally less severe compared to when envenomation occurs, but serious harm is possible, for example, through infection. In all cases, healthcare costs can be substantial, but particularly if antivenom is administered (Boyer, 2015; World Health Organization, 2018).
The WHO's strategic plan for snakebite envenoming prevention and control calls for improved understanding of the epidemiology and ecology of snake‐human interactions. The plan highlights several factors that warrant investigation, including climate, human population density, land use, and habitat (World Health Organization, 2019). Our study contributes value toward these research goals by investigating the association between ambient temperature and emergency department (ED) visits for snakebite in the US state of Georgia.
Georgia is the second most biodiverse US state in terms of herpetofauna, and snakes in particular (Dirk & Houston, 2017; Jensen, 2008). There are 45 snake species in Georgia, 7 of which are venomous and of primary concern to humans (Figure 1) (Georgia Poison Center, 2021). An additional 10 snake species are technically venomous but not at a medically meaningful level. Of the seven species of concern, six belong to the Crotalidae Pit Viper family, including: Eastern Copperhead Agkistrodon contortrix, Florida Cottonmouth Agkistrodon conanti, Northern Cottonmouth Agkistrodon piscivorus, Eastern Diamond‐backed Rattlesnake Crotalus adamanteus, Timber Rattlesnake Crotalus horridus, and the Pygmy Rattlesnake Sistrurus miliarius. The seventh species—the Eastern Coral Snake Micrurus fulvius—is in the Elapid family. A study based on data from the American Poison Control Center covering the period 1989–2018 reported Georgia as the leading state in snakebite deaths (tied with Kentucky) for which data was available (Greene et al., 2020). A similar but shorter (1999–2017) analysis based on the CDC Wonder database found that Georgia was second in deaths after the much more populous state of California (Langley et al., 2020).
Figure 1.
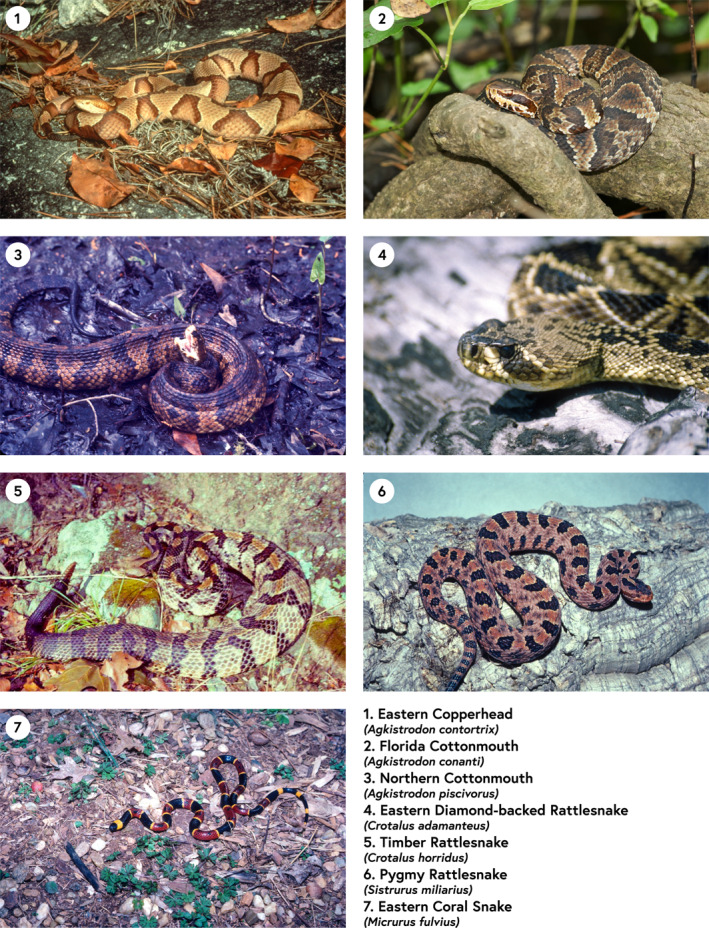
The seven venomous species of concern in Georgia, USA. All photos courtesy of co‐author Lawrence Wilson.
Snakes are ectotherms (cold‐blooded), meaning they lose heat through metabolic processes. Ectotherms regulate body temperatures behaviorally rather than metabolically as do endotherms. As a result, climatic variables, including heat and humidity, are believed to affect snake activity (Chippaux, 2017; Jensen, 2008). In Georgia, snakes exhibit several behaviors that suggest a potential association with temperature. In the winter, when external temperatures become too cold to maintain proper core body temperature, snakes may enter a dormancy period known as brumation, which is a physiologic state in reptiles comparable to torpor and/or hibernation in mammals (Jensen, 2008). However, brumation is a more flexible process than hibernation in that snakes may “awaken” from dormancy as a response to short‐term changes in temperature (Roman, 2018). In contrast, during Georgia summers, snakes may engage in estivation, which is also a dormancy response, but in this case to prolonged hot, dry periods (Jensen, 2008). As a result of these known and season‐specific impacts of temperature on snake activity, we hypothesized that a short‐term increase in temperature will increase the odds of experiencing a snakebite, but that the effect will be strongest at moderate temperatures (i.e., spring and fall) when it is neither extremely cold nor extremely hot.
2. Methods
We conducted a bidirectional time‐stratified case‐crossover study (Maclure, 1991) with conditional logistic regression to explore the relationship between ambient temperature and ED visits for snakebite.
2.1. Data Sources
2.1.1. Health Data
We acquired data on all ED visits for the years 2014–2020 from the Georgia Hospital Association. Variables of specific interest to this study included date of visit, the International Classification of Diseases (ICD) diagnosis codes, the home ZIP code of the patient and the ZIP code of the facility where they were treated. Patients with missing, erroneous or non‐Georgia ZIP codes were excluded from the study (n = 411 for any type of snakebite).
We used two snake‐specific ICD diagnosis codes: one for venomous snakebites, and one for non‐venomous snakebites. We also created a third “any snakebite” outcome which is the sum of venomous and non‐venomous events (Table 1). We note that visits for non‐venomous snakebites may reflect only more severe bites or bites where the type of snake was unknown, whereas most venomous snakebites are likely to result in a hospital visit. Finally, we generated a fourth outcome (“non‐snake envenomation”) that reports envenomation by other species (e.g., other reptiles, scorpions, arachnids, other arthropods, venomous fish, marine animals, venomous plants etc.). This outcome does not include snakebites and can be used to compare the temperature effect in snakes with other types of envenomation, thus providing some indirect insight into whether any observed effect may be due to snake behavior or human behavior.
Table 1.
International Classification of Diseases Diagnosis Codes for Outcomes of Interest
| ICD edition | Venomous snakebite | Non‐venomous snakebite | Non‐snake envenomation |
|---|---|---|---|
| ICD‐9 | E905.0 | E906.2 | 989.5, excluding E905.0 |
| ICD‐10 | T63.0 | W59.1 | T63, excluding T63.0 |
Note. ICD‐9 codes were used prior to and including October 2015, and ICD‐10 codes were used thereafter.
2.1.2. Exposure Data
The a priori exposure of interest was the same‐day maximum daily temperature. In sensitivity analyses, we also assessed minimum temperature and temperature on the previous day (lag 1), which assesses the possibility of a 1‐day delay in the temperature‐snakebite association. Same‐day total precipitation and mean dewpoint temperature (a measure of moisture in the air) were included as potential confounders. All meteorological data (temperature, precipitation, and dew point) were collected from Daymet, a publicly available database that provides gridded daily meteorology estimates at 1 km spatial resolution during the study period (P. Thornton et al., 2016). Daymet is based on observed meteorology from US automated surface observing stations, which include airports, cooperative network stations (e.g., US National Weather Service cooperative network stations), and some regional mesonets (e.g., Remote Automatic Weather Station), providing roughly 10–15,000 temperature observations a day across the contiguous US. Spatial and temporal interpolation is performed using truncated Gaussian filter and topographical predictors. Daymet has been found to accurately describe ambient temperature and mean heat index at weather stations (P. Thornton et al., 2016; P. E. Thornton et al., 1997). To derive daily exposures for linkage to ED visit data at the ZIP code level, for each Census ZIP Code Tabulation Area (ZCTA), we calculated a ZCTA exposure by averaging values from all Daymet 1 km grid cells overlapping with the ZCTA polygon. In the main analysis, we linked exposures to ED visits based on patient residential ZIP codes. In sensitivity analyses, we linked exposures to ED visits based on facility (hospital) ZIP codes, as some snakebites may occur distant from people's place of residence.
2.2. Statistical Analysis
We used a case‐crossover study design with conditional logistic regression to estimate the odds of snakebite ED visits with same‐day maximum temperature. In this design, the analysis is conducted on individual‐level data and each subject serves as their own control; the inference is based on comparing each subject's exposure on the case day with their exposure on control days (Jaakkola, 2003; Maclure & Mittleman, 2000), For selection of control days, we used a bi‐directional, time stratified approach where the control days were chosen as the same day of the week within the same month and year, leading to 3–4 control days per case. This approach inherently controls for long‐term trends, seasonality, and day of the week (Jaakkola, 2003; Neas et al., 1999); in a sensitivity analysis we also adjusted for holidays. In addition, the case crossover study design controls for individual‐level factors such as age and sex, as case days are compared to control days for the same individual. Same‐day maximum temperature was assigned to all case and control days based on ZIP codes, as were same‐day total precipitation and mean dewpoint to control for meteorology.
To investigate seasonal variation in the effect of temperature on snakebite events, we ran the same models described above, but stratified by season. Winter was defined as December to February, spring as March to May, summer as June to August, and fall as September to November. This study was approved by the Institutional Review Board of Emory University.
3. Results
Averaged across all ZIP codes, the daily maximum temperature during the study period was 24.3°C and, as expected, was much higher in summer than winter (Table 2). However, these statewide averages mask regional variation in temperature, which is reported in Figure S1 in Supporting Information S1. Average precipitation was 4.0 mm/day and highest in winter and lowest in fall, whereas average dew point temperature was 12.0°C and highest in summer and lowest in winter.
Table 2.
Descriptive Statistic of the Health and Meteorology Variables, 2014–2020
| All | Fall | Winter | Spring | Summer | |
|---|---|---|---|---|---|
| Mean maximum daily temperature, °C (standard deviation) | 24.3 (7.9) | 25.1 (6.2) | 15.3 (5.9) | 24.4 (5.6) | 32.1 (2.5) |
| Mean minimum daily temperature, °C (standard deviation) | 12.0 (8.2) | 12.6 (6.9) | 3.4 (6.0) | 11.2 (5.7) | 20.7 (2.0) |
| Mean daily precipitation, mm (standard deviation) | 4.0 (10.0) | 3.4 (10.8) | 4.7 (11.1) | 3.8 (9.7) | 4.2 (8.2) |
| Mean dew point, °C (standard deviation) | 12.0 (8.2) | 12.6 (7.0) | 3.4 (6.0) | 11.1 (5.7) | 20.7 (2.1) |
| Venomous snakebite events (mean/day) | 3,908 (1.5) | 1,090 (1.7) | 57 (0.1) | 953 (1.5) | 1,808 (2.8) |
| Non‐venomous snakebite events (mean/day) | 1,124 (0.4) | 276 (0.4) | 44 (0.1) | 306 (0.5) | 498 (0.8) |
| Any snakebite a (mean/day) | 5,094 (2.0) | 1,384 (2.2) | 106 (0.2) | 1,272 (2.0) | 2,332 (3.6) |
| Non‐snake envenomation (mean/day) | 65,187 (25.5) | 16,473 (25.9) | 2,560 (4.1) | 9,340 (14.5) | 36,814 (57.2) |
If a record was coded as both a venomous and non‐venomous snakebite, it was excluded from both categories but included in the “any snake” analysis; therefore, the “any snakebite” category is more than the sum of the two sub‐categories.
There were 5,094 ED visits for snakebite in Georgia during the 7‐year study period, of which approximately 77% (3,908) were venomous (Table 2). Visits for non‐snake envenomation (n = 65,187) were an order of magnitude more common. Counts for all four outcomes were highest in the summer and lowest in the winter; only two percent of all snakebites occurred in winter. In general, ED visits for snakebites were most common in northern and coastal Georgia (Figure 2).
Figure 2.

Snakebite frequency (venomous and non‐venomous) during the study period, by ZIP code of patient residence. Note: this map is only for illustrative purposes—the study design (case‐crossover) does not rely on differences across locations but rather differences in exposure between case and control days for each individual.
Conditional logistic regression models showed that all outcomes were positively associated with temperature (Figure 3). Associations were observed in models unadjusted for precipitation and dew point, as well as adjusted models, though the latter were somewhat attenuated; dew point was positively associated with the outcome while the opposite was true for precipitation (see Table S1 in Supporting Information S1). Specifically, in the adjusted models, we found that a 1°C increase in same‐day maximum temperature was associated with a 1.056 (95%CI: 1.040–1.73) increase in the odds of venomous snakebite and a 1.058 (95%CI: 1.030–1.088) increase in the odds of a non‐venomous snakebite. Associations with snakebite outcomes were stronger than for non‐snake envenomation. In general, similar or stronger associations were observed using same‐day minimum temperature, and associations were lower when lagged by 1 day (Table S2 in Supporting Information S1). Effect estimates were nearly identical whether exposures were assigned based on residential or facility ZIP code (Table S3 in Supporting Information S1), and effect estimates were virtually unchanged after adjustment for holidays (Table S4 in Supporting Information S1).
Figure 3.
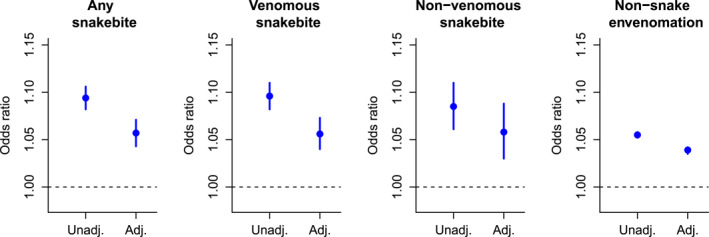
Odds ratios for the association with same‐day maximum temperature, unadjusted or adjusted for precipitation and dew point temperature.
Figure 4 reports results when stratified by season. For all snakebites combined, associations were positive and significant (p < 0.05) in all seasons except winter, with the strongest effect in spring. The pattern for venomous snakebites was similar, though the effect in summer was also non‐significant (p = 0.13). There was more uncertainty in the smaller non‐venomous snakebite category, where there was indication of a positive effect for all seasons except winter. The association for non‐snake envenomation was consistently significant (p < 0.001) across all seasons.
Figure 4.

Odds ratios for the association with same‐day maximum temperature by season. All models were adjusted for precipitation and dew point.
4. Discussion
We assessed the association between outdoor temperature and snakebite in Georgia, a state with diverse herpetofauna and a historically high rate of snake envenomation. We found that same‐day maximum temperature was positively associated with the odds of venomous and non‐venomous snakebites, including after adjusting for precipitation and dew point, both of which were associated with the outcome in most models (the former negatively and the latter positively).
The associations between temperature and snakebite were evident when analyzed over the full time period, but stratified analyses indicate that the relationship may be most pronounced in the spring (especially) and fall (for venomous snakebite) when temperatures are relatively moderate and when snakes are in a highly dynamic state either arising from brumation and reproduction (spring) or when initiating dormancy (fall) (Eskew & Todd, 2017; Gibbons & Semlitsch, 1987). There were also indications of an association with venomous snakebite in winter, but with uncertainty due to the small number of bites. We did not observe a significant association in summer for either type of snakebite, though this was not due to estivation (summer dormancy), as summer was the season when the most bites were reported (n = 2,332). This finding suggests the possibility of a concave relationship where a temperature effect is evident up to a certain level, beyond which it is no longer an important risk factor; however, when combined as a group, an effect in summer was evident. This aspect requires further study, as many locations where snakebites are a public health concern have annual temperatures that are warmer and more constant than what occurs in Georgia.
There have been a small number of prior studies exploring the link between meteorological factors and snakebite. Two studies most similar in design to ours—one from Israel and a smaller one from Alabama—both found that warmer temperatures were associated with an increase in snakebite (Hanback et al., 2021; Shashar et al., 2018). Ediriweera et al. (2018) reported a positive association between snakebite and periods of lower‐than‐expected humidity in Sri Lanka (Ediriweera et al., 2018). In Brazil, da Costa et al. (2019) found increased temperature to be positively associated with snakebite, while another Brazilian study reported a higher incidence of Bothrops envenomings in areas with high rainfall and humidity (Alcantara et al., 2018; da Costa et al., 2019). A Costa Rican study found that snakebites are more likely to occur with higher temperatures and may be reduced after the rainy season (Chaves et al., 2015), while a different study from Costa Rica reported a higher incidence of snakebite in humid areas. In California, Phillips et al. (2018) found that snakebite incidence decreased following drought, and increased after precipitation (Phillips et al., 2018) while a study from Colombia reported that rainfall only drives snakebite incidence in regions with marked dry seasons, but did not find an association with temperature (C. Bravo‐Vega et al., 2022). Our findings are broadly consistent with most of these studies in terms of temperature, but more mixed for the other meteorological factors (rainfall or humidity), though direct comparisons are difficult due to differences in study design, including that many of these other studies investigated longer‐term (e.g., monthly, seasonal or annual) meteorology. We also note that mathematical models of snakebite incidence find meteorological variables to be important predictors (C. A. Bravo‐Vega et al., 2019).
An association between temperature and snakebite may result from the influence on human behavior or on snake behavior, or both. In other words, the relationship may be a consequence of snake activity or may be due to the fact that people may be more likely to engage in outdoor activities that increase the likelihood of interaction with a snake, for example, hiking, gardening or certain occupational tasks. Our study cannot easily differentiate between the two pathways; however, the finding that the effect for non‐snake envenomation is somewhat lower than for the snakebite outcomes, and is more consistent across seasons, indicates that snake biology likely plays a role. We also note that the observed association between temperature and non‐snake envenomation is an important finding in and of itself, as these types of bites and stings are also responsible for high burdens of mortality and morbidity in many locations (Chippaux & Goyffon, 2008; Warrell, 2012; World Health Organization, 2007).
There are limitations to our study, of which we highlight four. The first is that the reported ZIP code of the patient may or may not be reflective of where the snakebite occurred. This could lead to exposure misclassification, which would likely attenuate the effect estimates. However, the fact that results were highly similar when instead using facility ZIP code provides support for the results. Similarly, we were not able to confirm if the snakebite occurred on the day of the ED visit, though we note that symptoms of envenomation generally begin within minutes to hours (Mehta & Sashindran, 2002). A second limitation is the relatively small number of events, particularly in winter, compared to many other outcomes often investigated with respect to temperature (e.g., cardiorespiratory diseases); a longer time series would help address this issue. Third, ZIP code level data was the spatial resolution of analysis for this study, which would not necessarily reflect micro‐climates that may influence snake behavior (Dupoué et al., 2015). And fourth, we did not have data on the snake species so were not able to differentiate species‐specific behaviors influencing snakebites that led to our ED visits. In general, due to different biological and ecological characteristics of snake species, further research is needed to determine if the associations we find here are generalizable to other locations, climates and/or ecosystems.
Conflict of Interest
The authors declare no conflicts of interest relevant to this study.
Supporting information
Supporting Information S1
Acknowledgments
This work was supported by the NIEHS‐funded HERCULES Center (P30ES019776).
Landry, M. , D’Souza, R. , Moss, S. , Chang, H. H. , Ebelt, S. , Wilson, L. , & Scovronick, N. (2023). The association between ambient temperature and snakebite in Georgia, USA: A case‐crossover study. GeoHealth, 7, e2022GH000781. 10.1029/2022GH000781
Data Availability Statement
Daymet meteorology data is publicly available (https://daac.ornl.gov/cgi-bin/dsviewer.pl?ds_id=2129). The health data was obtained from the Georgia Hospital Association through a data use agreement that prevents data sharing due to standard issues with patient confidentiality.
References
- Ahmed, S. M. , Ahmed, M. , Nadeem, A. , Mahajan, J. , Choudhary, A. , & Pal, J. (2008). Emergency treatment of a snake bite: Pearls from literature. Journal of Emergencies, Trauma, and Shock, 1(2), 97–105. 10.4103/0974-2700.43190 [DOI] [PMC free article] [PubMed] [Google Scholar]
- Alcantara, J. A. , Bernarde, P. S. , Sachett, J. , da Silva, A. M. , Valente, S. F. , Peixote, H. M. , et al. (2018). Stepping into a dangerous quagmire: Macroecological determinants of Bothrops envenomings, Brazilian Amazon. PLoS One, 13(12), 15. 10.1371/journal.pone.0208532 [DOI] [PMC free article] [PubMed] [Google Scholar]
- Boyer, L. V. (2015). On 1000‐fold pharmaceutical price markups and why drugs cost more in the United States than in Mexico. The American Journal of Medicine, 128(12), 1265–1267. 10.1016/j.amjmed.2015.08.007 [DOI] [PubMed] [Google Scholar]
- Bravo‐Vega, C. , Santos‐Vega, M. , & Cordovez, J. M. (2022). Disentangling snakebite dynamics in Colombia: How does rainfall and temperature drive snakebite temporal patterns? PLoS Neglected Tropical Diseases, 16(3), e0010270. 10.1371/journal.pntd.0010270 [DOI] [PMC free article] [PubMed] [Google Scholar]
- Bravo‐Vega, C. A. , Cordovez, J. M. , Renjifo‐Ibáñez, C. , Santos‐Vega, M. , & Sasa, M. (2019). Estimating snakebite incidence from mathematical models: A test in Costa Rica. PLoS Neglected Tropical Diseases, 13(12), e0007914. 10.1371/journal.pntd.0007914 [DOI] [PMC free article] [PubMed] [Google Scholar]
- Chaves, L. F. , Chuang, T. W. , Sasa, M. , & Gutiérrez, J. M. (2015). Snakebites are associated with poverty, weather fluctuations, and El Niño. Science Advances, 1(8), e1500249. 10.1126/sciadv.1500249 [DOI] [PMC free article] [PubMed] [Google Scholar]
- Chippaux, J. P. (1998). Snake‐bites: Appraisal of the global situation. Bulletin of the World Health Organization, 76(5), 515. [PMC free article] [PubMed] [Google Scholar]
- Chippaux, J. P. (2017). Incidence and mortality due to snakebite in the Americas. PLoS Neglected Tropical Diseases, 11(6), e0005662. 10.1371/journal.pntd.0005662 [DOI] [PMC free article] [PubMed] [Google Scholar]
- Chippaux, J.‐P. , & Goyffon, M. (2008). Epidemiology of scorpionism: A global appraisal. Acta Tropica, 107(2), 71–79. 10.1016/j.actatropica.2008.05.021 [DOI] [PubMed] [Google Scholar]
- da Costa, M. , da Fonseca, C. , Navoni, J. , & Freire, E. (2019). Snakebite accidents in Rio Grande do Norte state, Brazil: Epidemiology, health management and influence of the environmental scenario. Tropical Medicine and International Health, 24(4), 432–441. 10.1111/tmi.13207 [DOI] [PubMed] [Google Scholar]
- Dirk, J. S. , & Houston, C. C. (2017). The herpetofauna of conservation lands along the Altamaha River, Georgia. Southeastern Naturalist, 16(2), 261–282. [Google Scholar]
- Dupoué, A. , Stahlschmidt, Z. R. , Michaud, B. , & Lourdais, O. (2015). Physiological state influences evaporative water loss and microclimate preference in the snake Vipera aspis. Physiology & Behavior, 144, 82–89. 10.1016/j.physbeh.2015.02.042 [DOI] [PubMed] [Google Scholar]
- Ediriweera, D. S. , Diggle, P. J. , Kasturiratne, A. , Pathmeswaran, A. , Gunawardena, N. K. , Jayamanne, S. F. , et al. (2018). Evaluating temporal patterns of snakebite in Sri Lanka: The potential for higher snakebite burdens with climate change. International Journal of Epidemiology, 47(6), 2049–2058. 10.1093/ije/dyy188 [DOI] [PMC free article] [PubMed] [Google Scholar]
- Eskew, E. A. , & Todd, B. D. (2017). Too cold, too wet, too bright, or just right? Environmental predictors of snake movement and activity. Copeia, 105(3), 584–591. 10.1643/ch-16-513 [DOI] [Google Scholar]
- Georgia Poison Center . (2021). Snakebites. Retrieved from https://www.georgiapoisoncenter.org/poisons/alerts-recent-trends/snakebites/
- Gibbons, J. , & Semlitsch, R. (1987). Activity patterns. Snakes: Ecology and evolutionary biology. MacMillan Publishing Company. [Google Scholar]
- Greene, S. C. , Folt, J. , Wyatt, K. , & Brandehoff, N. P. (2020). Epidemiology of fatal snakebites in the United States 1989–2018. The American Journal of Emergency Medicine, 45, 309–316. 10.1016/j.ajem.2020.08.083 [DOI] [PubMed] [Google Scholar]
- Gutierrez, J. M. , Calvete, J. J. , Habib, A. G. , Harrison, R. A. , Williams, D. J. , & Warrell, D. A. (2017). Snakebite envenoming. Nature Reviews Disease Primers, 3(1), 17063. 10.1038/nrdp.2017.63 [DOI] [PubMed] [Google Scholar]
- Hanback, S. , Slattery, A. , McGwin, G. , & Arnold, J. (2021). Association of daily high temperatures with increased snake envenomations: A case‐crossover study. Toxicon, 201, 54–58. 10.1016/j.toxicon.2021.08.010 [DOI] [PubMed] [Google Scholar]
- Jaakkola, J. (2003). Case‐crossover design in air pollution epidemiology. European Respiratory Journal, 21(40 suppl), 81s–85s. 10.1183/09031936.03.00402703 [DOI] [PubMed] [Google Scholar]
- Jensen, J. B. (2008). Amphibians and reptiles of Georgia. University of Georgia Press. [Google Scholar]
- Kasturiratne, A. , Wickremasinghe, A. R. , de Silva, N. , Gunawardena, N. K. , Pathmeswaran, A. , Premaratna, R. , et al. (2008). The global burden of snakebite: A literature analysis and modelling based on regional estimates of envenoming and deaths. PLoS Medicine, 5(11), e218. 10.1371/journal.pmed.0050218 [DOI] [PMC free article] [PubMed] [Google Scholar]
- Langley, R. , Haskell, M. G. , Hareza, D. , & King, K. (2020). Fatal and nonfatal snakebite injuries reported in the United States. Southern Medical Journal, 113(10), 514–519. 10.14423/smj.0000000000001156 [DOI] [PubMed] [Google Scholar]
- Lavonas, E. J. , Ruha, A.‐M. , Banner, W. , Bebarta, V. , Bernstein, J. N. , Bush, S. P. , et al. (2011). Unified treatment algorithm for the management of crotaline snakebite in the United States: Results of an evidence‐informed consensus workshop. BMC Emergency Medicine, 11(1), 2. 10.1186/1471-227x-11-2 [DOI] [PMC free article] [PubMed] [Google Scholar]
- Maclure, M. (1991). The case‐crossover design: A method for studying transient effects on the risk of acute events. American Journal of Epidemiology, 133(2), 144–153. 10.1093/oxfordjournals.aje.a115853 [DOI] [PubMed] [Google Scholar]
- Maclure, M. , & Mittleman, M. A. (2000). Should we use a case‐crossover design? Annual Review of Public Health, 21(1), 193–221. 10.1146/annurev.publhealth.21.1.193 [DOI] [PubMed] [Google Scholar]
- Mehta, S. , & Sashindran, V. (2002). Clinical features and management of snake bite. Medical Journal Armed Forces India, 58(3), 247–249. 10.1016/s0377-1237(02)80140-x [DOI] [PMC free article] [PubMed] [Google Scholar]
- Neas, L. M. , Schwartz, J. , & Dockery, D. (1999). A case‐crossover analysis of air pollution and mortality in Philadelphia. Environmental Health Perspectives, 107(8), 629–631. 10.1289/ehp.99107629 [DOI] [PMC free article] [PubMed] [Google Scholar]
- Phillips, C. , Lipman, G. S. , Gugelmann, H. , Doering, K. , & Lung, D. (2018). Snakebites and climate change in California, 1997–2017. Clinical Toxicology, 57(3), 168–174. 10.1080/15563650.2018.1508690 [DOI] [PubMed] [Google Scholar]
- Roman, C. (2018). Hibernation vs brumation: Changing seasons.
- Shashar, S. , Yitshak‐Sade, M. , Sonkin, R. , Novack, V. , & Jaffe, E. (2018). The association between heat waves and other meteorological parameters and snakebites: Israel national study. Journal of Emergency Medicine, 54(6), 819–825. 10.1016/j.jemermed.2018.02.002 [DOI] [PubMed] [Google Scholar]
- Thornton, P. , Thornton, M. , Mayer, B. , Wei, Y. , Devarakonda, R. , Vose, R. , & Cook, R. (2016). Daymet: Daily surface weather data on a 1‐km grid for North America, version 3. ORNL DAAC. USDA‐NASS. 2017 Census of Agriculture, Summary and State Data, Geographic Area Series, Part 51, (pp. AC‐17–A‐51). [Google Scholar]
- Thornton, P. E. , Running, S. W. , & White, M. A. (1997). Generating surfaces of daily meteorological variables over large regions of complex terrain. Journal of Hydrology, 190(3), 214–251. 10.1016/s0022-1694(96)03128-9 [DOI] [Google Scholar]
- Warrell, D. A. (2012). Venomous bites, stings, and poisoning. Infectious Disease Clinics, 26(2), 207–223. 10.1016/j.idc.2012.03.006 [DOI] [PubMed] [Google Scholar]
- World Health Organization . (2007). Rabies and envenomings: A neglected public health issue.
- World Health Organization . (2018). Global snakebite burden. 71st World Health Assembly Provisional agenda item 12.1.
- World Health Organization . (2019). Snakebite envenoming: A strategy for prevention and control. [DOI] [PubMed]
Associated Data
This section collects any data citations, data availability statements, or supplementary materials included in this article.
Supplementary Materials
Supporting Information S1
Data Availability Statement
Daymet meteorology data is publicly available (https://daac.ornl.gov/cgi-bin/dsviewer.pl?ds_id=2129). The health data was obtained from the Georgia Hospital Association through a data use agreement that prevents data sharing due to standard issues with patient confidentiality.