Abstract
Three‐dimensional (3D) representations of anatomical specimens are increasingly used as learning resources. Photogrammetry is a well‐established technique that can be used to generate 3D models and has only been recently applied to produce visualisations of cadaveric specimens. This study has developed a semi‐standardised photogrammetry workflow to produce photorealistic models of human specimens. Eight specimens, each with unique anatomical characteristics, were successfully digitised into interactive 3D models using the described workflow and the strengths and limitations of the technique are described. Various tissue types were reconstructed with apparent preservation of geometry and texture which visually resembled the original specimen. Using this workflow, an institution could digitise their existing cadaveric resources, facilitating the delivery of novel educational experiences.
Keywords: 3D visualisation, anatomy visualisation, cadaver, photogrammetry
This paper presents a workflow for using photogrammetry as a method by which to reproduce photorealistic, three‐dimensional (3D) cadaveric specimens with high resolution. The paper guides the anatomist through the photogrammetry process, from selection and staging of cadaveric specimens through to equipment and lighting, image acquisition and 3D reconstruction.
1. INTRODUCTION
The study of anatomy relies upon the ability to investigate three‐dimensional (3D) spatial relationships between structures (Miller, 2000). Many authors have advocated that the best approach to learning anatomy is to use dissected cadaveric specimens within a dedicated ‘wet’ laboratory facility (Aziz et al., 2002; Kerby et al., 2011; Saltarelli et al., 2014; Schofield, 2014). However, such an approach can be problematic due to cost, chemical exposure or curriculum design (Bhat et al., 2019; Raja & Sultana, 2012). In a modern health science syllabus, the contact hours dedicated to learning anatomy, as well as staff to student ratios, are decreasing (Bergman et al., 2011; Mcbride & Drake, 2018), with some institutions opting out of the traditional laboratory experience in favour of contextualising content within clinical scenarios (McLachlan et al., 2004; McMenamin et al., 2018). Other institutions do not have access to specialised anatomical facilities as they are expensive to build and maintain (Goldman, 2010). In order to decrease anatomists' reliance on wet‐laboratory learning environments, alternatives to physical specimen dissection are needed. The use of alternative laboratory pedagogies appears to be of no detriment to the learner (Wilson et al., 2018), providing reassurance to educators who wish to embrace digital technologies, simulation or hybrid education strategies.
Digitally constructed 3D anatomical learning resources are being increasingly adopted to either replicate or supplement the visual and tactile elements of the human gross anatomy laboratory experience (Hu et al., 2009; Murgitroyd et al., 2015; Nicholson et al., 2006; Trautman et al., 2019). The transition toward the use of technology‐aided anatomy resources was accelerated by the COVID‐19 pandemic in 2020 (Singal et al., 2020). Pather et al. (2020) noted that during this period multiple body donor programs in Australia were suspended, decreasing cadaver availability. Consequently, educational institutions have become more reliant on proprietary digital resources for their teaching.
Various modalities can be used to generate 3D anatomical learning resources, including stylised digital models, 3D printed models (Thomas et al., 2016; Ye et al., 2020), 3D renders of computed tomography (CT) and magnetic resonance imaging (MRI) datasets (Bueno et al., 2021; Moore et al., 2017), laser scanning (Rydmark et al., 1999) and photogrammetry (De Benedictis et al., 2018; Gurses et al., 2021). Models generated from each of these modalities has their own advantages and limitations. For example, digital and 3D printed models created by volume rendering CT and MRI datasets can possess excellent spatial resolution and cross‐sectional information (Tam, 2010). However, the surface texture and detail are limited, lacking photorealism when compared to with photogrammetry which can capture intricate, colour‐accurate details of anatomical specimens (Dębski et al., 2021).
2. PHOTOGRAMMETRY AS A 3D DIGITAL TECHNOLOGY
Photogrammetry is a scientific technique whereby electromagnetic energy sources, most commonly the visible light spectrum, are used for measurement (Nebel et al., 2020). Using this method, digital 3D models can be produced from multiple overlapping 2D photographic still images. Objects may be captured either by rotating an object in front of a stationary camera or by moving the camera around a stationary object. This is referred to as ‘structure from motion’ (SfM) photogrammetry (Westoby et al., 2012). By photographing the object from multiple planes and angles, the object's 3D visual characteristics are captured in their entirety.
Knowledge of the fundamental principles of photogrammetry assists the user in producing detailed models that closely replicate the original. Mathematical algorithms (collinearity equations) are applied to matching points in different still photos, most commonly by processing digital images within photogrammetry software packages. Based on how these points have changed in each image, the equations reconstruct the position and angle of the camera. Rendering all image points in a three‐dimensional space using x, y and z co‐ordinates produces a single virtual 3D model of the object.
When a robust protocol is performed correctly, photogrammetry can resolve detail to any resolution and accuracy. Unlike CT or MRI, this technique cannot capture internal cross‐sectional detail, nor can it be used to perform volume segmentation. The accuracy of photogrammetry is determined by camera quality, the quality and number of photos and the photogrammetry software package used (Westoby et al., 2012). Image capture must be structured so that there is sufficient observational redundancy (overlap between images) to ensure mathematical calculations are performed reliably by the software (Luhmann et al., 2016). This technique produces photorealistic surface texture, authentic colour rendition and accurate surface geometry (Li et al., 2020).
2.1. Application of photogrammetry in the anatomical sciences
Photogrammetry is currently increasing in popularity due to ease of use, a low technical barrier to entry and low start‐up costs (Medina et al., 2020). This technique has only recently been applied for anatomical purposes, having previously been used for diverse fields including aerial mapping and architecture (Polidori, 2020).
Photogrammetry has the potential to take anatomy out of the dissection lab to any digital location. There is limited literature discussing the detailed methods employed by those who have used this technique for anatomical purposes, making these studies difficult to replicate. Some authors have not described the angles from which their images were captured (Burk & Johnson, 2019) and others were unable to disclose a detailed workflow due to their use of proprietary technology (Petriceks et al., 2018). Dębski et al. (2021) designed an impressive, but custom‐built, workstation which required the use of bespoke equipment. Wesencraft and Clancy (2020) limited their study to a single cadaveric trunk and did not apply their method to other anatomical specimens, which may highlight deficiencies in the technique used. Nocerino et al. (2017) described a photogrammetric method to specifically capture white matter tracts of the brain using coded targets. These were placed onto the cortical surface of the specimen and rendered into the final model, which arguably impairs its appearance. There is a need to assess whether a single photogrammetry workflow can overcome the aforementioned limitations and be successfully applied to multiple human organs.
Compared to other objects frequently captured with photogrammetry, human cadaveric specimens present unique constraints. Wet specimens are flexible and easily deform over time, requiring some form of stabilisation. Large specimens are difficult to suspend due to their weight and may be too unstable to be placed on a turntable. Due to legal and licencing requirements, image acquisition must be performed in a dedicated anatomy facility; typical photo studios are not suitable for this process as they do not adhere to occupational health and safety standards. Formalin‐fixed (wet) specimens are preserved using potentially harmful agents such as formaldehyde and phenol (Ya'acob et al., 2013). Chemical fixatives necessitate laminar airflow; although ventilation reduces indoor pollutants, air currents can excessively dry wet specimens. While some authors have placed objects within a partially enclosed box for image capture (Apollonio et al., 2021), this may not be suitable for wet specimens as fixative concentrations within the confined working area could exceed recommended safe levels without adequate ventilation.
This paper describes a detailed photogrammetry workflow, which can be used or adapted to create photorealistic digital 3D reproductions of formalin‐fixed and plastinated specimens. In addition, it describes variables to be considered when digitising human material using photogrammetry including specimen selection, equipment, camera parameters and imaging angles.
3. METHODS
This research was performed at Curtin University's anatomy facility in Perth, Western Australia. Formalin‐fixed (wet) and plastinated specimens were permitted to be used under the Anatomy Act of Western Australia (WA) (1930) and ethical approval was gained from Curtin University's Human Research Ethics Committee (approval number HRE2021‐0226). The WA Department of Health, which is responsible for administering the WA Anatomy Act and regulating the use of human tissue, granted the authors permission to perform image acquisition and produce 3D reconstructions of cadaveric material to be used for educational and research purposes. Additional permission was sought, and granted, for images contained within this article to be disseminated via publication. No identifying features of the donors were captured during the use of the workflow described.
Eight specimens were chosen according to their instructional value, clarity of prosection, uniqueness and preservation method. Wet specimens were stored in a 3% formalin solution when not in use and were drained of excess fluid and dabbed dry with an absorbent material to remove any surface fluids prior to image capture. In our facility, plastination was achieved by forced vacuum impregnation of Biodur™ S10 (silicone) polymer into fixed specimens, as developed by Von Hagens (1979). An open‐plan laboratory classroom was used as the photography location.
3.1. Specimen selection and preparation
Five formalin‐fixed wet specimens were selected, including an isolated stomach, complete colon, left and right lungs and whole brain. Each was chosen due to their unique characteristics and how they would test the workflow. To assess whether flexible and hollow viscera could be supported in an anatomical position for image capture, the stomach and complete colon were used. Wet lungs assessed whether organs with limited stromal strength could be positioned without distortion or destruction of tissue. Brain capture evaluated whether two brain perspectives could be merged into a single model and whether small discrete structures, such as cranial nerves and cerebral blood vessels, could be accurately rendered. For some specimens, further prosection and reflection of structures was performed to improve clarity of features. If necessary, sutures were placed to anchor reflected organ walls and to strengthen the suspension sites.
Three plastinated specimens were selected, which included a heart, liver and thorax. The heart assessed whether the internal architecture of the cardiac chambers and coronary vasculature could be reconstructed. The liver assessed whether heavy, solid organs could be suspended and homogenous surface texture reconstructed. A plastinated thorax was used to assess whether complex concavities (e.g., costophrenic recesses) and layered skeletal muscles (e.g., intercostals and intrinsic back muscles) could be represented in 3D. Prior to staging, foreign surface material (e.g., fibres) found on the specimens was removed. Otherwise, little or no preparation was required.
3.2. Specimen staging
Specimens were either suspended from the ceiling via dissection light mounting frames or placed on a supporting platform when it was impractical to suspend the specimen. Organs were suspended using cotton thread, fishing line or steel wire. Wet specimens, such as the stomach and large intestine required additional support due to their flexibility. The brain, due to its delicate nature, was positioned on a platform for support rather than being suspended. Further details of how staging was achieved for selected specimens are described below and depicted in Figure 1.
FIGURE 1.
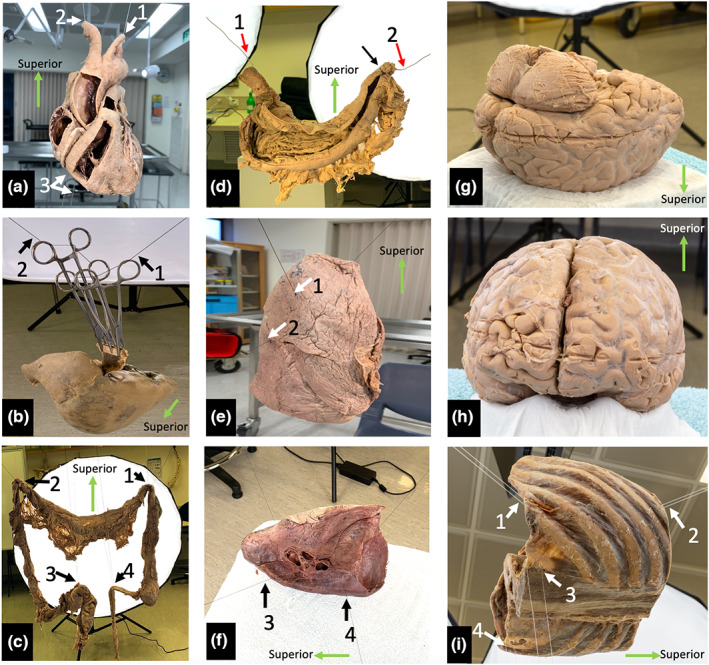
Specimen staging. (a) Plastinated heart suspended via the cut lumina of the aortic arch branches with additional inferior stabilisation. (b) Plastinated liver suspended with haemostats, wood and thread. The suspension line is indicated with black arrows. (c) Posterior view of the suspended specimen with full lighting. The small bowel has been dissected, but not suspended, and was not included in the image capture. (d) Posterior view of a fixed, wet stomach suspended using steel wire which is hidden in the rugal folds (red arrows). Sutures have been placed to secure the wire within the superior part of the duodenum (black arrow). (e) demonstrates vertical suspension of the right lung, white arrowheads indicate placement of suspension lines. (f) demonstrates horizontal suspension of the left lung with suspension lines (black arrows), which was found to be a more stable configuration. (g) brain position during capture of inferior structures. (h) brain position during capture of superior structures. (i) Suspended plastinated thorax (left posterior oblique view). White arrows indicate suspension points.
3.3. Suspension of the plastinated heart
The heart was suspended between two sets of ceiling mounted points by threading a wire through the brachiocephalic trunk and out of the left subclavian artery (Figure 1a, arrows 1 and 2). Inferior stabilisation of the specimen was achieved by a wire threaded between the right coronary and posterior interventricular arteries at the crux of the heart (arrow 3) which was anchored to a metal stand on the floor.
3.4. Suspension of the plastinated liver
Various methods of suspension were trialled, which aimed to avoid damage to the specimen due to its weight. The preferred technique suspended the liver in an inverted position. Two small pieces of wood were placed along the ligamentum teres and falciform ligaments and secured via haemostat compression (Figure 1b). The liver was suspended from two ceiling mounted points by threading cotton through the haemostat handles (arrows 1 and 2).
3.5. Suspension of a fixed wet colon
The isolated colon had lost its anatomical configuration that it would normally have in situ, therefore, the suspension method needed to replicate the position of the flexures, ileum and sigmoid colon. The specimen was suspended from ceiling mounted points using cotton thread at four strategic positions: the hepatic and splenic flexures, the sigmoid colon and ileum (Figure 1c, arrows 1–4). The small intestine loops were placed in a specimen tray as they were not included in the images.
3.6. Suspension of a wet stomach
The specimen was sectioned at the oesophagus, superior to the gastro‐oesophageal junction. Distally, the specimen was sectioned at the junction between the superior and descending parts of the duodenum. The greater and lesser omenta were removed from their attachments. The posterior gastric wall was incised, reflected superiorly and sutured to the posterior oesophagus in order to demonstrate the internal structures of the gastric lumen (rugae and pyloric sphincter) and layers of the gastric wall.
A steel wire, attached to ceiling mounted points, was introduced through the stomach via the oesophagus and threaded medially through the duodenum (Figure 1d, arrows 1 and 2). The wire was used as a means of suspension and recreated the configuration of the lesser curvature. No additional stabilisation was necessary.
3.7. Suspension of right and left wet lungs
The right lung was oriented vertically with two cotton threads running transversely through the lung parenchyma, one superior to the other. The upper thread was positioned superior to the hilum on the medial surface and exited at the lateral costal surface of the superior lobe (Figure 1e, arrow 1). The lower thread entered the lung medially, inferior to the hilum, and exited at the lateral superior border of the inferior lobe (Figure 1e, arrow 2).
Due to the degree of consolidation in the posterior aspect of the left lung, it was suspended horizontally with two threads traversing the lung tissue from medial to lateral (Figure 1f, arrows 3 and 4). The threads were placed more posterior to the hilum than in the right lung and directed through the inferior lobe. This adequately stabilised the specimen and prevented the lobes from separating due to gravity. This method was demonstrated to be a more stable arrangement than vertical suspension.
3.8. Fixed wet brain positioning
A full brain specimen, with brainstem intact and subdural meninges present, was kept in a 10% formalin solution. Suspending the brain was considered, however, due to the softness of the tissue and the specimen's lack of structural rigidity, this was not attempted. Instead, it was placed on a plastic platform designed for a commercially produced brain model (Figure 1g,h). With this method it was only possible to image half of the specimen at a time, first, the inferior aspect and second, the superior aspect. The two halves were merged in post‐processing.
3.9. Plastinated thorax and diaphragm
The specimen used was sectioned transversely in two locations; superiorly through the T8 vertebra and inferiorly through the intervertebral disc at L2/3. The thorax was placed in a supine position, with the anterior aspect facing toward the ceiling. Two lines, attached to the ceiling, supported the anterior aspect of the specimen (Figure 1i, arrows 1 and 2) which were placed between the body of the sternum and fibrous pericardium. Both continued inferiorly through the central tendon to either side of the xiphoid process. An additional two lines were placed through dissection defects in the thoracolumbar fascia, stabilising the specimen from below (Figure 1i, arrows 3 and 4). The superior and inferior sides of the open thorax were placed toward the studio lighting, illuminating these regions.
3.10. Image acquisition
A Sony a7R mark IV digital single lens reflex (DSLR) camera body (61.2 Mpix, 35 mm full‐frame equivalent) coupled with two prime lenses (Sony Sonnar T* E‐Mount FE 55 mm f1.8 Zeiss, Sony FE 50 mm f1.4 Zeiss) were used to perform still image capture, except for the lung and liver specimens where a Canon EOS Rebel T1i with a 30 mm lens was used. The camera was mounted to a tripod (Manfrotto 190X Pro 3) and a geared head (Sunwayfoto GH‐Pro II Geared Head) which allowed for precise camera angle determination.
Images were captured in RAW format (uncompressed) to eliminate artefacts introduced by image compression. The camera was set to aperture priority mode, and an aperture of f18 (narrow aperture) was selected to increase the depth of field, ensuring that both the object and background were in focus. When long shutter speeds were noted, the camera ISO (light sensitivity) was set to ISO200 to increase the camera's sensitivity to light. Otherwise, an ISO of 100 was used to minimise image noise.
Eight studio lights (Godox SL‐60 W), mounted on tripods (Neewer Pro 260 cm Alloy Stands) and equipped with internal diffusers and softboxes (Neewer 120 cm Hexadecagon Softboxes) were used to supplement the harsh fluorescent ambient lighting of the laboratory. To ensure all features of the specimen were evenly illuminated, the studio lights were angled alternately (above and below) surrounding the specimen. Half were positioned higher than the specimen and angled to illuminate the superior half of the specimen, while the remaining lights were positioned below the specimen and angled to illuminate the inferior half. Roof‐mounted dissection lights were used as spotlights to improve lighting in and around cavities, for example chambers of cardiac ventricles.
Photographs were taken at or exceeding the minimum focussing distance of the lens (500 mm) to ensure accurate focus. The specimen of interest filled the camera frame as much as possible while maintaining this distance. Image capture was completed in the same session to avoid alterations in the background environment and deformation of the suspension materials.
Images were acquired at seven orbital planes around the specimen, one horizontal (0°), three superior (+20°, +45° and +90°) and three inferior (−20°, −45° and −90°) (Figure 2a). For each orbit at 0°, +/− 20° and +/−45° images were captured at 10‐degree intervals, a total 36 images/orbit. When the camera was positioned at 90° above and below the specimen, a minimum of four images, one per quadrant, were acquired in these orbits (Figure 2b). Additional spot‐photos of small structures of interest were captured as necessary.
FIGURE 2.
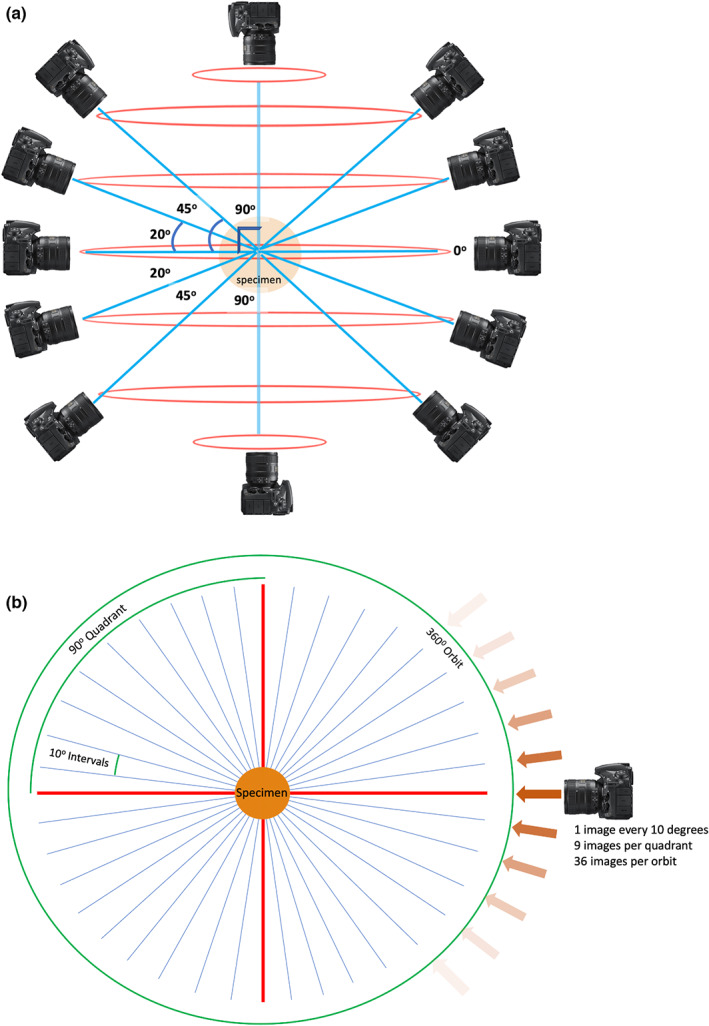
Image acquisition planning. (a) Horizontal orbits (red) and camera angles (blue) used for image acquisition planning, relative to the anatomical specimen in the coronal plane. (b) Image acquisition plan in the transverse plane, that is image capture in one orbit of rotation. Straight red lines represent 90 degree angles, relative to the specimen. Angled blue lines represent camera perspectives.
3.11. 3D model generation
3.11.1. Image optimisation
Once acquired, images were imported into Adobe Photoshop (Adobe Photoshop CC 2021) and batch processed to auto‐level image exposure and convert them to a lossless Tag Image File Format (TIFF).
3.12. 3D rendering
A standard photogrammetric workflow was followed using Agisoft Metashape (Agisoft, Version 1.7.3 build 12,473) on a Hewlett‐Packard Z4 G4 workstation (64GB RAM, Intel XeonW‐2145 processor) running Windows 10 (64 bit) and equipped with a NVIDIA Quadro RTX 4000 graphics card. Table 1 details the Metashape workflow processes, parameters, settings and rationales. Images were not manually masked as the presence of background objects supported extraction of feature points used for image alignment during processing. For further detail regarding the standard structure‐from‐motion photogrammetric workflow, please refer to Struck et al. (2019).
TABLE 1.
Metashape processes, parameters, settings and rationales.
| Process | Parameter | Setting | Rationale (if applicable) |
|---|---|---|---|
| Align photos | Accuracy | Highest | Prevents downscaling of images for feature point selection |
| Generic Preselection | On | Default. Reduction of computation time for feature matching as initial feature mapping performed on down‐sampled images | |
| Reference Preselection | Estimated | Default. Reduction of computation time for photo alignment, uses estimated exterior orientation parameters | |
| Key Point Limit | 40,000 | Recommended by Metashape | |
| Tie Point Limit | 4000 | Recommended by Metashape | |
| Exclude Stationary Tie Points | On | Supresses lens artefacts | |
| Guided image matching | Off | Default | |
| Adaptive camera model fitting | Off | Default | |
| Build dense cloud | |||
| Quality | Ultra high | Prevents downscaling of original images | |
| Depth filtering | Aggressive | Reduces excessive noise and artefacts in the dense cloud | |
| Reuse depths maps | On | Reduces computation time for subsequent runs | |
| Calculate point colors | On | Required for colour rendering of models | |
| Calculate point confidence | Off | Parameter can be used for dense cloud filtering but this is not applied as filtering is done during the Build Mesh process | |
| Build mesh | Source Data | Depth Maps | Less resource intensive than generating from dense cloud. |
| Surface type | Arbitrary (3D) | Biological specimens are non‐planar | |
| Quality | Ultra high | Prevents downscaling during meshing. Uses original captured photographic information | |
| Face count | High | Creates mesh with the highest possible faces, allows more detail in the representation of complex surfaces | |
| Interpolation | Enabled | Default, automatically fills holes in model | |
| Depth filtering | Aggressive | Setting reduced wet specimen artefacts during empirical testing | |
| Calculate vertex colors | On | Required for colour rending of models | |
| Reuse depth maps | On | Reduces computation time for subsequent runs | |
| Build texture | Texture Type | Diffuse Map | Default. Applies photographic texture map rather than geometric normal map or occlusion map |
| Source data | Images | Using original captured colour information | |
| Mapping mode | Keep uv | Default. Reduces computation time for subsequent runs | |
| Blending mode | Mosaic | Default | |
| Texture size/count | 16,384 × 1 | Creates textures at 16 K resolution. Down‐sampling can be completed later if required. | |
| Enable hole filling | On | Creates a smooth surface impression | |
| Enable ghosting filter | On | Creates a smooth surface impression | |
| Transfer texture | Off | Default | |
| Decimate texture | Face count | 500,000 | Increases computer performance when viewing models |
3.13. Model editing and deployment
Once processed, models were edited in Blender (Blender Inc, Version 3.0.0) to digitally fill regions, which did not reconstruct and digitally erase suspension materials. Following this, models were imported and viewed on a custom JavaScript‐based 3D viewer. All models were decimated to 500,000 faces from their original face count (Table 2) as it was determined that this was the optimal compromise between model detail and smooth performance across different devices. To ensure security when being used as an educational resource, the 3D viewer was hosted on a password‐protected institutional learning management system that required students and staff to enter unique user credentials for access. Prior to accessing the 3D models, students were required to complete an online compliance test which demonstrated their knowledge of the Anatomy Act of WA, their responsibilities to the donor as well as institutional requirements. Furthermore, staff and students are presented with a ‘terms of use’ page each time they access the models, where they are required to acknowledge that reproduction of the models in any format is strictly forbidden.
TABLE 2.
Reconstruction summary of selected organs.
| Specimen | Brain (superior view) | Brain (inferior view) | Diaphragm and thorax | Heart | Large intestine | Lung (left) | Lung (right) | Stomach |
|---|---|---|---|---|---|---|---|---|
| Camera | Sony a7r iv | Sony a7r iv | Sony a7r iv | Sony a7r iv | Sony a7r iv | Canon EOS Rebel T1i | Canon EOS Rebel T1i | Sony a7r iv |
| Lens | Sony FE 55 mm f1.8 | Sony FE 55 mm f1.8 | Sony FE 55 mm f1.8 | Sony FE 50 mm f1.4 | Sony FE 55 mm f1.8 | Sigma 30 mm f1.4 | Sigma 30 mm f1.4 | Sony FE 55 mm f1.8 |
| Total images captured (n) | 138 | 194 | 369 | 355 | 178 | 314 | 396 | 160 |
| Total images aligned (n) | 138 | 194 | 369 | 355 | 175 | 314 | 377 | 160 |
| Dense cloud points | 86,380,028 | 86,400,459 | 435,415,546 | 184,024,508 | 391,419,131 | 46,546,445 | 89,152,610 | 94,511,347 |
| Vertices | 2,446,797 | 2,536,907 | 16,261,205 | 8,068,843 | 11,188,735 | 250,017 | 1,212,107 | 5,216,980 |
| Faces (prior to decimation) | 4,884,199 | 5,065,308 | 32,516,113 | 16,135,178 | 22,370,642 | 499,999 | 2,423,954 | 10,432,859 |
| Total processing time (mins) | 610 | 898 | 25,160 | 3917 | 1348 | 1532 | 2198 | 634 |
| Software version | 1.7.2.12070 | 1.7.2.12070 | 1.7.2.12070 | 1.6.3.10732 | 1.6.5.11249 | 1.6.2.10247 | 1.6.2.10247 | 1.7.2.12070 |
4. RESULTS
In this section, 3D models resulting from the described photogrammetric workflow are presented. All figures contain screenshots of digital models but not of the original specimens.
4.1. 3D heart model
The superficial structures of the heart, including the great vessels and coronary vasculature are clearly depicted (Figure 3). Superficial internal structures of the cardiac chambers are observed, including the pectinate muscle and crista terminalis of the right atrium and chordae tendinae of the right ventricle. Noticeable gaps are present in the interventricular septum.
FIGURE 3.
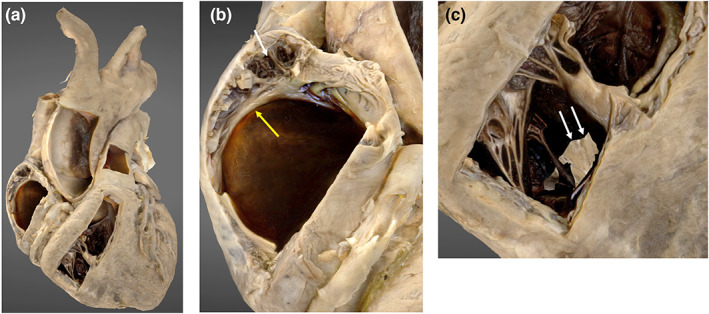
3D photogrammetric model of the heart. (a) (left) demonstrates the entire heart model. (b) (middle) demonstrates internal structures displayed in the lateral wall of the right atrium including the pectinate muscle (white arrowhead) and crista terminalis (yellow arrowhead). (c) (right) demonstrates the internal structures within the right ventricle and incomplete model development in the region of the interventricular septum (white arrows).
4.2. 3D brain model
Two brain models, one depicting the superior aspect and the other inferior were merged into a single model using Metashape (Agisoft, Version 1.7.3 build 12,473). A transverse seam artefact at the model merge site is present, which can be observed interrupting the continuity of the central sulcus (Figure 4, Image A). The cerebral lobes, cerebellum, cerebroarterial circle, brainstem and selected cranial nerves are well visualised, as are subtle features, for example arachnoid granulations (Figure 4).
FIGURE 4.
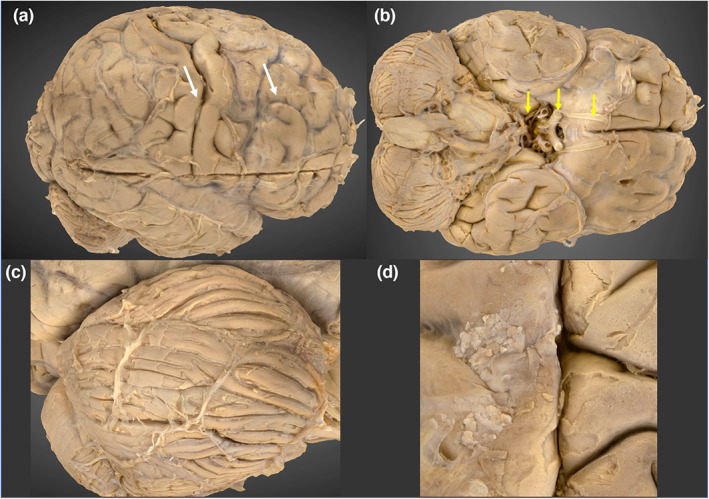
3D photogrammetric model of the brain. (a) (top left) Lateral view of the brain, demonstrating the transverse seam at the model merge site (white arrowheads). (b) (top right) Inferior view, demonstrating the cerebroarterial circle and cranial nerves I, II and III (yellow arrows). (c) (bottom left) Right cerebellar folia. (d) (bottom right) Arachnoid granulations.
4.3. 3D colon model
The colon is demonstrated in its entirety from the ileocecal junction to the anal canal. The transverse colon has been successfully rendered, however there are large gaps in the greater omentum, particularly noticeable inferior to the splenic flexure (Figure 5, image A). Subtle macroscopic structures, such as the taenia coli, haustra and epiploic appendages were appreciated (Figure 5, image B).
FIGURE 5.
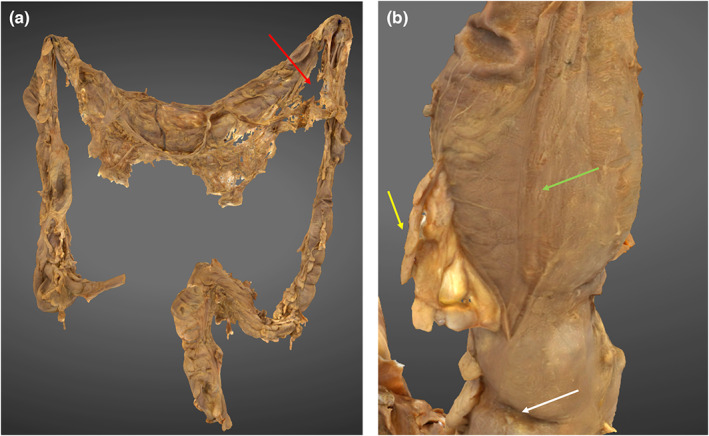
3D photogrammetric model of the colon. (a) (left) demonstrates the entire colon model with reconstruction defect in greater omentum (red arrow). (b) (right) demonstrates a haustral fold (white arrow), epiploic appendage (yellow arrow) and taenia coli (green arrow).
4.4. 3D liver model
The liver lobes, ligaments and blood vessels associated with the porta hepatis are well depicted (Figure 6). The structures of the biliary tree are present, but are not well distinguished from the surrounding tissue, particularly the common hepatic duct.
FIGURE 6.
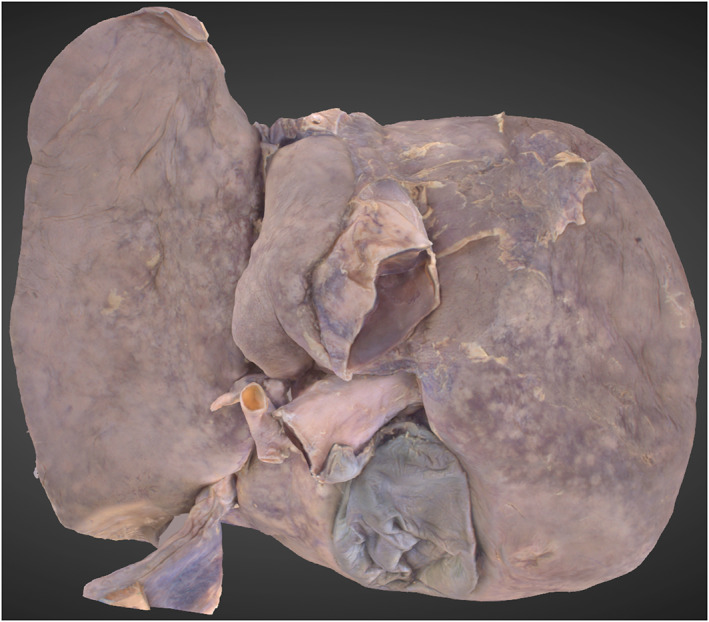
3D Photogrammetric model of the liver. A posterior view shows the reconstruction of the porta hepatis, hepatic lobes and gallbladder.
4.5. 3D lung models
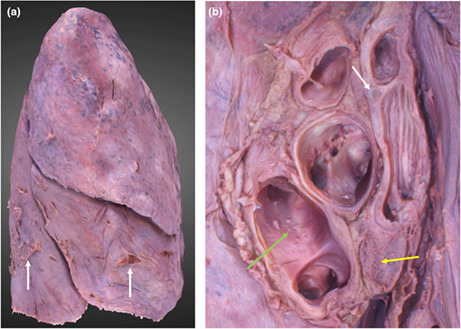
The lobes, fissures, apices and bases are all reconstructed (Figure 7). The left lung was re‐orientated from a horizontal position (position at capture) to its anatomical position. This had no detrimental effects on its appearance. No reconstruction defects were observed. Obvious lung impressions, such as the aortic and cardiac, are visible with clear geometry. Subtle lung impressions, such as the azygos and right brachiocephalic are also clearly defined. The hilar structures are clear and identifiable (Figure 7, image B). No visible tearing of lung tissue occurred at the suspension points.
FIGURE 7.
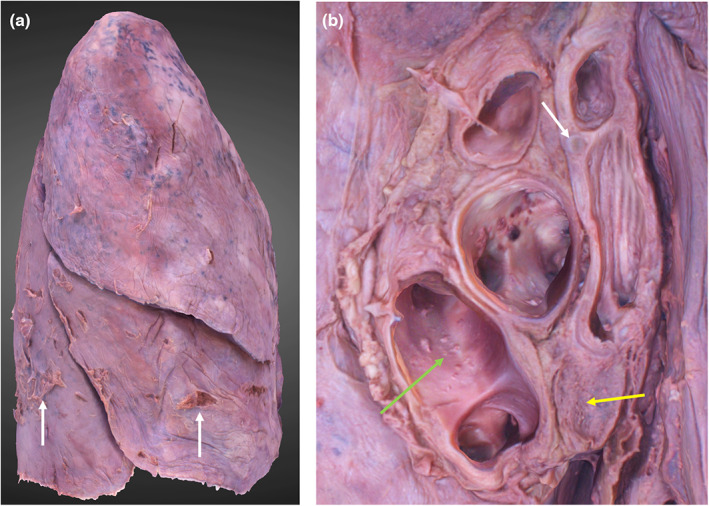
3D photogrammetric model of the right lung. (a) (left) demonstrates the entire model (lateral view), dissection artefacts are indicated by white arrows. (b) (right) demonstrates the hilar structures including hyaline cartilage of the bronchial wall (white arrow), hilar lymph node (yellow arrow) and lumina of the pulmonary veins (green arrow).
4.6. 3D stomach model
The inferior oesophagus, stomach and proximal duodenum are reconstructed. The internal features of the pyloric antrum and thin aspects of the greater omentum have not been rendered. The rugae and gastric wall layers can be observed (Figure 8, Image B).
FIGURE 8.
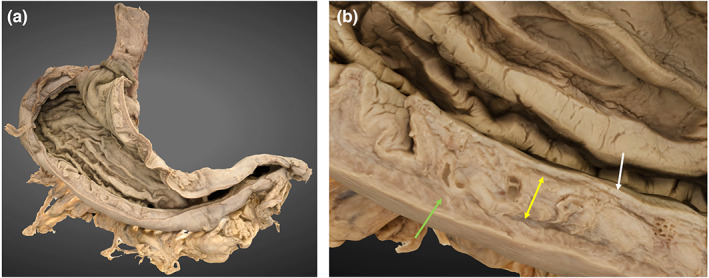
3D photogrammetric model of the stomach. (a) (left) demonstrates the entire model (posterior view). (b) (right) demonstrates a cross section of the gastric wall layers including mucosa (white arrow), submucosa (yellow arrow) and muscularis externa (green arrow).
4.7. 3D thorax
The osseous ribs and costal cartilages are identifiable (Figure 9). Smaller structures, such as the fibres of the radiate sternocostal ligaments are well depicted. Separation between muscle layers can be observed between the intercostal and thoracic epaxial layers. The inferior aspect of the thoracic diaphragm and its apertures are reconstructed, however the costophrenic recesses and inferior pericardium are not (Video S1). These voids were digitally filled following the final render.
FIGURE 9.
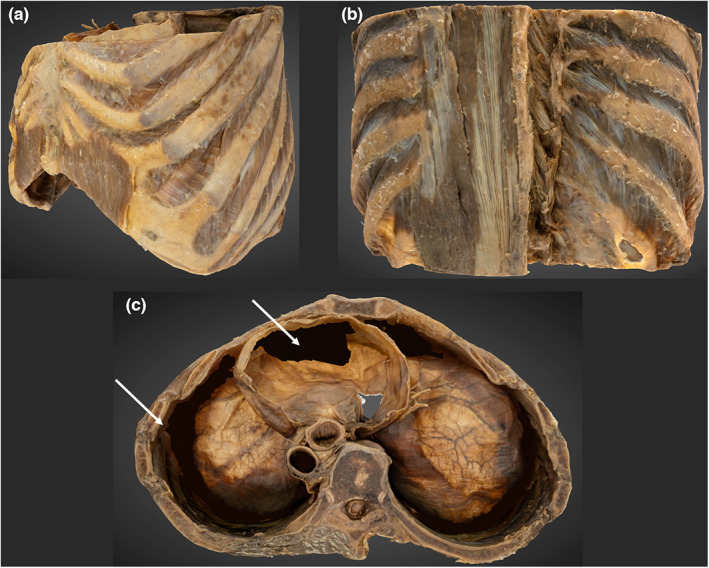
3D photogrammetric model of the thorax. (a) (top left) demonstrates the entire thorax model from a left anterolateral perspective. (B) (top right) demonstrates the reconstruction of the erector spinae and transversospinales. (c) (bottom, middle) superior view of the thorax. Shows reconstruction errors of the inferior pericardium and costophrenic recesses that have been digitally filled (white arrowheads).
5. DISCUSSION
This study demonstrates the feasibility of producing photorealistic, 360° 3D cadaveric models using a semi‐standardised photogrammetry workflow in conjunction with a professional grade DSLR for image acquisition. Detailed instructions have been provided to guide the anatomist on performing a 360° photographic survey in a conventional anatomy laboratory, without the need for specialised equipment, and which tissues are favourable for this process. These findings support previous studies which conclude that photogrammetry can be successfully used to produce high quality digital models of human anatomical specimens (Burk & Johnson, 2019; Dixit et al., 2019; Dixit et al., 2020; Nocerino et al., 2017; Wesencraft & Clancy, 2020).
The creation of detailed anatomical models relied upon accurately capturing fine surface texture data. As such, the camera with a high megapixel count and a large sensor (Sony a7R mark IV) was preferred as this reduced image noise and increased spatial resolution and light sensitivity. We have noted that the benefits of high‐resolution images become more obvious when models are used at high zoom levels, as small details (e.g., gastric wall layers and cerebral vessels) maintain their clarity. To add detail on large specimens, additional close‐up images were acquired to ensure smaller structures of pre‐determined interest were captured, such as the lung hilum, vermiform appendix, taenia coli and arcuate ligaments of the diaphragm. During processing it was verified that close‐up images were successfully integrated into the models. We have not assessed whether omitting these would be detrimental to the models' appearance.
Multiple tissue types were well depicted including bone, skeletal and cardiac muscle, nerves, blood vessels and visceral features. Well‐lit structures with heterogeneous surface texture (e.g., skeletal muscles) appeared to be successfully reconstructed with sufficient detail for fibre direction to be clearly identified. Poorly illuminated or shadowed structures (e.g., costophrenic recesses, interventricular septum) and excessively lit partially transparent structures (e.g., pericardium and omenta) were not well rendered, demonstrating multiple defects (holes or voids) in the reconstructed models. Due to this, it is recommended that specimens be uniformly lit. The use of spot lighting or a ring flash may assist to light shadowed areas, minimising reconstruction defects. However, excessive light intensity can produce reflection, which may also impair model construction.
A novel aspect of this study is in the method of large specimen suspension. Suspending the specimens enabled 360‐degree access and allowed capture of the whole specimen in one photographic survey. This negated the need to merge two or more 3D models, such as what was required for the brain. Additionally, it allowed the organs to be placed in a position that approximates the shape of the structure in situ. However, to suspend specimens in this way was more labour intensive, requiring additional planning and setup time when compared to placing specimens on a platform.
The method by which photographs were acquired successfully produced images that were clear and sharply focused. This addresses one of the challenges that Dixit et al. (2019) found when performing photogrammetric image capture while using a turntable to incrementally move a specimen. Dixit et al. (2019) observed that small movements of the brain resulted in distortion of tissues. In our study, minimising specimen movement was a priority. This was achieved by keeping the specimen stationary while the camera was moved around the object. Nonetheless, long shutter speeds (>1 s) were found to be problematic for suspended specimens as they had small, but detectable, movements due to laboratory air flow. Due to obstruction from suspension lines, maintaining strict image capture intervals was not always possible, which did not appear to be of detriment to the final models. This suggests there was sufficient observational redundancy in our image capture process.
Plastinated specimens were found to be ideal for photogrammetry. The silicon polymer confers structural rigidity which increases ease of specimen positioning. The tissue does not deform over time and the colour and texture is static. As there is no surface moisture from chemical preservatives, reflection from the tissues is minimised. For some applications, wet specimens were found to be advantageous as they could be further prosected, prior to image capture, to demonstrate structures of interest. Due to their inherent flexibility, specimens could be manipulated into anatomical position and structures could be reflected or separated to ensure that the 3D model was instructive and clear for students. However, wet specimens were noted to deform over time which is undesirable as stable ‘shape invariant’ geometry is necessary for accurate 3D reconstruction (Luhmann et al., 2016). By their nature, wet specimens desiccate with exposure to air which can change their appearance. Additionally, droplets of chemical fixatives can be reflective and were found to occupy texture detail when processed. Given the scenario where identical formalin‐fixed and plastinated specimens were available, we would recommend that plastinated specimens be used for photogrammetric reconstruction. Fresh tissue could be an alternative, however our laboratory does not have access to unfixed human tissue, so we were unable to investigate how this material would affect photogrammetric reconstruction.
The workflow described has been successfully used to generate 3D models additional to those presented, including formalin‐fixed upper and lower limbs, the torso and its viscera and foot ligaments. Plastic anatomical models can also be digitised. As per other authors (Li et al., 2020; Waltenberger et al., 2021), we have produced bone specimens, including the skull base and lumbar vertebrae. However, due to the length of time necessary for photogrammetric image acquisition and rendering, bone specimens may be reconstructed more efficiently by using CT imaging, which has a shorter acquisition time (Hamm et al., 2018).
During the course of workflow development, we attempted to digitise pathological specimens that had been chemically fixed and contained within acrylic glass containers (‘potted’ or ‘bottled’ specimens). Our attempts to reconstruct these were unsuccessful and deemed of an unsuitable quality for education. Acrylic glass produced specular reflection, even with the use of a circular polarising lens filter, which impaired reconstruction. It should be noted that other authors have not described this issue and successfully reconstructed anatomical pathology specimens through photogrammetry (Vaduva et al., 2020).
This study did not examine the colour differences between the 3D models produced and that of the original specimens. No colour calibration took place at the time of image acquisition and the colour profile may have changed during the auto‐levelling process, leading to variation in the model. Furthermore, the models can be viewed on a variety of computer monitors, these are known to have variable colour profiles unless accurately calibrated (Clarke & Treanor, 2017). While colour replication is important, many anatomy‐based visualisation tools do not faithfully reproduce the colours of the original tissues. Examples of this include medical imaging datasets, computer generated models, 3D printed models and commercially available plastic models (McMenamin et al., 2014; McMenamin et al., 2021). The educational value of our 3D models is not anticipated to be appreciably affected by their colour rendition.
The images acquired through this workflow were processed through one photogrammetry software package. Agisoft Metashape has been previously used for reconstruction of anatomical specimens by multiple authors (Burk & Johnson, 2019; Dixit et al., 2019; Kottner et al., 2017; Wesencraft & Clancy, 2020) but other alternatives are available. All photogrammetry software packages would be expected to yield similar outcomes though we have not been able to verify this, presenting a potential limitation for this workflow. Reconstruction quality may also limited by the computer hardware available, in which case we would recommend downscaling the image resolution, which has been shown to reduce processing time (Benjamin et al., 2017).
The educational value of the 3D models produced in this study could further be enhanced by the ability to accurately measure the model and its features. While the structures should be proportioned accurately relative to other structures on the same model, there is no way to quantify and confirm this. The standard edition of the Metashape software, on which the 3D models were rendered, does not permit accurate model scaling. If photogrammetric models can be demonstrated to be accurately sized, these could be used for measurement of structures that are curved or too small to be easily measured with callipers. The professional version of the software is known to enable this functionality. When accurately scaled, measurements of features obtained from photogrammetric 3D models have been found to be a highly accurate, approximating that of direct measurement (Dai & Lu, 2010). Photogrammetric models also have the potential to demonstrate small anatomical structures with great precision. The spatial accuracy of the human eye can resolve measurement to 0.26 mm (Bould et al., 1999), which is based on the human eye's near‐point of convergence, that is, the closest point at which the eye can focus without diplopia. This has been observed to be at a focal length of ~72 mm in a young population (Hashemi et al., 2019). Unlike the original specimen, a 3D photogrammetric model can be viewed as if millimetres from the specimen surface and topographical detail remains clear and in sharp focus.
One advantage of utilising photogrammetry is its low financial barriers to entry. Costings for implementing the photogrammetry workflow described in this paper are detailed in Table 3. This is substantially lower than specialised commercially available equipment used for the production of 3D models, such as a structured light scanner, for example Artec Space Spider (USD$24800 at time of writing). For institutions that do not require a physical representation of the specimen, these costs are likely to be lower than establishing a 3D printing program for anatomical specimens (McMenamin et al., 2014).
TABLE 3.
Approximate start‐up expenses and ongoing costs associated with the use of photogrammetry in an anatomy laboratory.
| Start‐up expenses | Cost in AUD ($USD) [€EUR] |
|---|---|
| Camera and wireless trigger | $4500 ($3276) [€2914] |
| Lens | $700 ($509) [€453] |
| Tripod | $500 ($364) [€323] |
| Geared head (optional) | $300 ($218) [€194] |
| Lights, light stands and softboxes | $2500 ($1820) [€1619] |
| Photogrammetry software (Metashape Standard with educational licence) | $80 ($59) [€51] |
| Computer | $5000 ($3640) [€3239] |
| Total | $13580.00 ($9887) [€8797] |
| Ongoing costs | Cost in AUD ($USD) |
|---|---|
| Image capture (2 h per specimen) | Variable |
| Specimen prosection | Variable |
From an educational perspective, these models can be implemented into educational practice in several ways. As suggested by Erolin (2019), they can be used in lectures when outside of an anatomy lab, in conjunction with a real specimen for identification of structures, in place of fragile specimens or for self‐directed study. The importance of having innovative modern alternatives to in‐person classroom experiences has been highlighted during the COVID‐19 pandemic and is anticipated to persist due to cadaver shortages (Iwanaga, Loukas, et al., 2021; Pather et al., 2020; Singal et al., 2020). When hosted online, virtual models are sufficiently scalable to be used in courses with large cohorts or those that are remotely delivered, which presents an advantage over 3D printed specimens.
For online assessments, digital labels could be placed anywhere on the model. This would allow for multiple test permutations and avoid damage from placing numbered pins in structures, as is common practice in ‘steeple‐chase’ practical assessments. Meyer et al. (2016) suggested that images used in online practical anatomy assessments that offer a selection of views, directional labels and various zoom levels may increase student satisfaction. Using this technology, directional labels could be added and zoom functionality could enable testing of more detailed anatomy by labelling structures which are normally too small to accurately pin on a wet specimen (e.g. gastric wall layers). Photogrammetric specimens could also increase the accessibility of wet lab material by providing an acceptable alternative in cases where students are unable to learn in a traditional laboratory setting; for example, due to visual impairment, formaldehyde hypersensitivity or are pregnant/breastfeeding.
While photogrammetric models in this study portray photorealistic visualisations, it is unknown exactly how the models differ geometrically from the original. This may be of importance if photogrammetric models are to be used for assessment or distributed learning, as close approximations of physical specimens are desirable for these use cases. Preliminary unpublished data indicate that these models are being widely used and are favourably received by students studying anatomy at our institution.
6. CONCLUSION
Photogrammetry is an established technique with a variety of applications and has only been recently utilised in the anatomical sciences. As such, there is scarce literature on how to overcome the unique requirements that cadaveric specimens pose to image capture and 3D rendering. This study has successfully developed a workflow that can be applied to any formalin‐fixed or plastinated specimen for the generation of photorealistic 3D models whilst describing the limitations of this technique. With further exploration into improving the final models and novel implementation into anatomy curricula, 3D photogrammetric models could become a mainstay in anatomical teaching.
AUTHOR CONTRIBUTIONS
Morgan Titmus, Gary Whittaker, Milo Radunski, Paul Ellery, Beatriz IR de Oliveira, Hannah Radley, Petra Helmholz and Zhonghua Sun devised the study concept and design. Morgan Titmus, Gary Whittaker, Milo Radunski and Paul Ellery acquired the data. Morgan Titmus and Gary Whittaker interpreted the data and drafted the manuscript. Beatriz IR de Oliveira, Hannah Radley, Petra Helmholz and Zhonghua Sun critically revised the manuscript.
Supporting information
Video S1.
ACKNOWLEDGMENTS
The authors thank the technical staff in the Curtin University anatomy facility—Melissa Parkinson, Kylie Doornbusch, Zeke Samson, Nyasha Bepete, Dr Joshua Ravensdale and Alana Stainton, for their ongoing support, and Curtin University for their financial assistance which enabled this research through the Early‐Mid Career Academic Grant. Additionally, the authors acknowledge the University of Western Australia's Body Bequest program. Acknowledgement of donors (adapted from Iwanaga, Singh, et al. (2021)). The authors sincerely thank those who donated their bodies to science so that anatomical research could be performed. These donors and their families deserve our highest gratitude. Open access publishing facilitated by Curtin University, as part of the Wiley ‐ Curtin University agreement via the Council of Australian University Librarians.
Titmus, M. , Whittaker, G. , Radunski, M. , Ellery, P. , IR de Oliveira, B. , Radley, H. et al. (2023) A workflow for the creation of photorealistic 3D cadaveric models using photogrammetry. Journal of Anatomy, 243, 319–333. Available from: 10.1111/joa.13872
DATA AVAILABILITY STATEMENT
The data are not publicly available due to privacy or ethical restrictions.
REFERENCES
- Apollonio, F.I. , Fantini, F. , Garagnani, S. & Gaiani, M. (2021) A photogrammetry‐based workflow for the accurate 3D construction and visualization of museums assets. Remote Sensing, 13, 486. [Google Scholar]
- Aziz, M.A. , Mckenzie, J.C. , Wilson, J.S. , Cowie, R.J. , Ayeni, S.A. & Dunn, B.K. (2002) The human cadaver in the age of biomedical informatics. The Anatomical Record: An Official Publication of the American Association of Anatomists, 269, 20–32. [DOI] [PubMed] [Google Scholar]
- Benjamin, A. , O'brien, D. , Barnes, G. , Wilkinson, B. & Volkmann, W. (2017) Assessment of structure from motion (SfM) processing parameters on processing time, spatial accuracy, and geometric quality of unmanned aerial system derived mapping products. Journal of Unmanned Aerial Systems, 3, 27. [Google Scholar]
- Bergman, E. , van der Vleuten, C.P. & Scherpbier, A.J. (2011) Why don't they know enough about anatomy? A narrative review. Medical Teacher, 33, 403–409. [DOI] [PubMed] [Google Scholar]
- Bhat, D. , Chittoor, H. , Murugesh, P. , Basavanna, P.N. & Doddaiah, S. (2019) Estimation of occupational formaldehyde exposure in cadaver dissection laboratory and its implications. Anatomy & Cell Biology, 52, 419–425. [DOI] [PMC free article] [PubMed] [Google Scholar]
- Bould, M. , Barnard, S. , Learmonth, I.D. , Cunningham, J.L. & Hardy, J.R. (1999) Digital image analysis: improving accuracy and reproducibility of radiographic measurement. Clinical Biomechanics, 14, 434–437. [DOI] [PubMed] [Google Scholar]
- Bueno, M.R. , Estrela, C. , Granjeiro, J.M. , Estrela, M.R.D.A. , Azevedo, B.C. & Diogenes, A. (2021) Cone‐beam computed tomography cinematic rendering: clinical, teaching and research applications. Brazilian Oral Research, 35, e024. [DOI] [PubMed] [Google Scholar]
- Burk, Z. & Johnson, C. (2019) Method for production of 3D interactive models using photogrammetry for use in human anatomy education. HAPS Educator, 23, 457–463. [Google Scholar]
- Clarke, E.L. & Treanor, D. (2017) Colour in digital pathology: a review. Histopathology, 70, 153–163. [DOI] [PubMed] [Google Scholar]
- Dai, F. & Lu, M. (2010) Assessing the accuracy of applying photogrammetry to take geometric measurements on building products. Journal of Construction Engineering and Management, 136, 242–250. [Google Scholar]
- De Benedictis, A. , Nocerino, E. , Menna, F. , Remondino, F. , Barbareschi, M. , Rozzanigo, U. et al. (2018) Photogrammetry of the human brain: a novel method for three‐dimensional quantitative exploration of the structural connectivity in neurosurgery and neurosciences. World Neurosurgery, 115, e279–e291. [DOI] [PubMed] [Google Scholar]
- Dębski, M. , Bajor, G. , Lepich, T. , Aniszewski, Ł. & Jędrusik, P. (2021) Process of photogrammetry with use of custom made workstation as a method of digital recording of anatomical specimens for scientific and research purposes. Translational Research in Anatomy, 24, 100128. [Google Scholar]
- Dixit, I. , Dunne, C. , Blumer, P. , Logan, C. , Prakitpong, R. & Krebs, C. (2020) The best of each capture – the combination of 3D laser scanning with photogrammetry for optimized digital anatomy specimens. The FASEB Journal, 34, 1. [Google Scholar]
- Dixit, I. , Kennedy, S. , Piemontesi, J. , Kennedy, B. & Krebs, C. (2019) Which tool is best: 3D scanning or photogrammetry – it depends on the task. In: Rea, P.M. (Ed.) Biomedical Visualisation, Vol. 1. Cham: Springer International Publishing. [DOI] [PubMed] [Google Scholar]
- Erolin, C. (2019) Interactive 3D digital models for anatomy and medical education. Biomédica Visualisation, 1138, 1–16. [DOI] [PubMed] [Google Scholar]
- Goldman, E. (2010) Building a low‐cost gross anatomy laboratory: a big step for a small university. Anatomical Sciences Education, 3, 195–201. [DOI] [PubMed] [Google Scholar]
- Gurses, M.E. , Gungor, A. , Hanalioglu, S. , Yaltirik, C.K. , Postuk, H.C. , Berker, M. et al. (2021) Qlone(R): a simple method to create 360‐degree photogrammetry‐based 3‐dimensional model of cadaveric specimens. Oper Neurosurg (Hagerstown), 21, E488–E493. [DOI] [PubMed] [Google Scholar]
- Hamm, C.A. , Mallison, H. , Hampe, O. , Schwarz, D. , Mews, J. , Blobel, J. et al. (2018) Efficiency, workflow and image quality of clinical computed tomography scanning compared to photogrammetry on the example of a tyrannosaurus rex skull from the Maastrichtian of Montana, USA. Journal of Paleontological Techniques, 21, 1–13. [Google Scholar]
- Hashemi, H. , Pakbin, M. , Ali, B. , Yekta, A. , Ostadimoghaddam, H. , Asharlous, A. et al. (2019) Near points of convergence and accommodation in a population of university students in Iran. Journal of Ophthalmic & Vision Research, 14, 306–314. [DOI] [PMC free article] [PubMed] [Google Scholar]
- Hu, A. , Wilson, T. , Ladak, H. , Haase, P. & Fung, K. (2009) Three‐dimensional educational computer model of the larynx: voicing a new direction. Archives of Otolaryngology – Head & Neck Surgery, 135, 677–681. [DOI] [PubMed] [Google Scholar]
- Iwanaga, J. , Loukas, M. , Dumont, A.S. & Tubbs, R.S. (2021) A review of anatomy education during and after the COVID‐19 pandemic: revisiting traditional and modern methods to achieve future innovation. Clinical Anatomy, 34, 108–114. [DOI] [PMC free article] [PubMed] [Google Scholar]
- Iwanaga, J. , Singh, V. , Ohtsuka, A. , Hwang, Y. , Kim, H.J. , Moryś, J. et al. (2021) Acknowledging the use of human cadaveric tissues in research papers: recommendations from anatomical journal editors. Clinical Anatomy, 34, 2–4. [DOI] [PubMed] [Google Scholar]
- Kerby, J. , Shukur, Z.N. & Shalhoub, J. (2011) The relationships between learning outcomes and methods of teaching anatomy as perceived by medical students. Clinical Anatomy, 24, 489–497. [DOI] [PubMed] [Google Scholar]
- Kottner, S. , Ebert, L.C. , Ampanozi, G. , Braun, M. , Thali, M.J. & Gascho, D. (2017) VirtoScan ‐ a mobile, low‐cost photogrammetry setup for fast post‐mortem 3D full‐body documentations in x‐ray computed tomography and autopsy suites. Forensic Science, Medicine, and Pathology, 13, 34–43. [DOI] [PubMed] [Google Scholar]
- Li, Q.Y. , Zhang, Q. , Yan, C. , He, Y. , Phillip, M. , Li, F. et al. (2020) Evaluating phone camera and cloud service‐based 3D imaging and printing of human bones for anatomical education. BMJ Open, 10, e034900. [DOI] [PMC free article] [PubMed] [Google Scholar]
- Luhmann, T. , Fraser, C. & Maas, H.‐G. (2016) Sensor modelling and camera calibration for close‐range photogrammetry. ISPRS Journal of Photogrammetry and Remote Sensing, 115, 37–46. [Google Scholar]
- Mcbride, J.M. & Drake, R.L. (2018) National survey on anatomical sciences in medical education. Anatomical Sciences Education, 11, 7–14. [DOI] [PubMed] [Google Scholar]
- Mclachlan, J.C. , Bligh, J. , Bradley, P. & Searle, J. (2004) Teaching anatomy without cadavers. Medical Education, 38, 418–424. [DOI] [PubMed] [Google Scholar]
- Mcmenamin, P.G. , Hussey, D. , Chin, D. , Alam, W. , Quayle, M.R. , Coupland, S.E. et al. (2021) The reproduction of human pathology specimens using three‐dimensional (3D) printing technology for teaching purposes. Medical Teacher, 43, 189–197. [DOI] [PubMed] [Google Scholar]
- Mcmenamin, P.G. , Mclachlan, J. , Wilson, A. , Mcbride, J.M. , Pickering, J. , Evans, D.J.R. et al. (2018) Do we really need cadavers anymore to learn anatomy in undergraduate medicine? Medical Teacher, 40, 1020–1029. [DOI] [PubMed] [Google Scholar]
- Mcmenamin, P.G. , Quayle, M.R. , Mchenry, C.R. & Adams, J.W. (2014) The production of anatomical teaching resources using three‐dimensional (3D) printing technology. Anatomical Sciences Education, 7, 479–486. [DOI] [PubMed] [Google Scholar]
- Medina, J.J. , Maley, J.M. , Sannapareddy, S. , Medina, N.N. , Gilman, C.M. & Mccormack, J.E. (2020) A rapid and cost‐effective pipeline for digitization of museum specimens with 3D photogrammetry. PLoS One, 15, e0236417. [DOI] [PMC free article] [PubMed] [Google Scholar]
- Meyer, A.J. , Innes, S.I. , Stomski, N.J. & Armson, A.J. (2016) Student performance on practical gross anatomy examinations is not affected by assessment modality. Anatomical Sciences Education, 9, 111–120. [DOI] [PubMed] [Google Scholar]
- Miller, R. (2000) Approaches to learning spatial relationships in gross anatomy: perspective from wider principles of learning. Clinical Anatomy: The Official Journal of the American Association of Clinical Anatomists and the British Association of Clinical Anatomists, 13, 439–443. [DOI] [PubMed] [Google Scholar]
- Moore, C.W. , Wilson, T.D. & Rice, C.L. (2017) Digital preservation of anatomical variation: 3D‐modeling of embalmed and plastinated cadaveric specimens using uCT and MRI. Annals of Anatomy‐Anatomischer Anzeiger, 209, 69–75. [DOI] [PubMed] [Google Scholar]
- Murgitroyd, E. , Madurska, M. , Gonzalez, J. & Watson, A. (2015) 3D digital anatomy modelling ‐ practical or pretty? The Surgeon, 13, 177–180. [DOI] [PubMed] [Google Scholar]
- Nebel, S. , Beege, M. , Schneider, S. & Rey, G.D. (2020) A review of photogrammetry and photorealistic 3D models in education from a psychological perspective. Frontiers in Education, 5, 144. [Google Scholar]
- Nicholson, D.T. , Chalk, C. , Funnell, W.R. & Daniel, S.J. (2006) Can virtual reality improve anatomy education? A randomised controlled study of a computer‐generated three‐dimensional anatomical ear model. Medical Education, 40, 1081–1087. [DOI] [PubMed] [Google Scholar]
- Nocerino, E. , Menna, F. , Remondino, F. , Sarubbo, S. , DE Benedictis, A. , Chioffi, F. et al. (2017) Application of photogrammetry to brain anatomy. The International Archives of the Photogrammetry, Remote Sensing and Spatial Information Sciences, XLII‐2/W4, 213–219. [Google Scholar]
- Pather, N. , Blyth, P. , Chapman, J.A. , Dayal, M.R. , Flack, N. , Fogg, Q.A. et al. (2020) Forced disruption of anatomy education in Australia and New Zealand: an acute response to the Covid‐19 pandemic. Anatomical Sciences Education, 13, 284–300. [DOI] [PMC free article] [PubMed] [Google Scholar]
- Petriceks, A.H. , Peterson, A.S. , Angeles, M. , Brown, W.P. & Srivastava, S. (2018) Photogrammetry of human specimens: an innovation in anatomy education. Journal of Medical Education and Curricular Development, 5, 1–10. [DOI] [PMC free article] [PubMed] [Google Scholar]
- Polidori, L. (2020) Words as tracers in the history of science and technology: the case of photogrammetry and remote sensing. Geo‐Spatial Information Science, 24, 167–177. [Google Scholar]
- Raja, D.S. & Sultana, B. (2012) Potential health hazards for students exposed to formaldehyde in the gross anatomy laboratory. Journal of Environmental Health, 74, 36–41. [PubMed] [Google Scholar]
- Rydmark, M. , Brodendal, J. , Folkesson, P. & Kling‐Petersen, T. (1999) Laser 3‐D scanning for surface rendering in biomedical research and education. Medicine Meets Virtual Reality, 62, 315–320. [PubMed] [Google Scholar]
- Saltarelli, A.J. , Roseth, C.J. & Saltarelli, W.A. (2014) Human cadavers vs. multimedia simulation: a study of student learning in anatomy. Anatomical Sciences Education, 7, 331–339. [DOI] [PubMed] [Google Scholar]
- Schofield, K.A. (2014) Anatomy in occupational therapy program curriculum: practitioners' perspectives. Anatomical Sciences Education, 7, 97–106. [DOI] [PubMed] [Google Scholar]
- Singal, A. , Bansal, A. & Chaudhary, P. (2020) Cadaverless anatomy: darkness in the times of pandemic Covid‐19. Morphologie, 104, 147–150. [DOI] [PMC free article] [PubMed] [Google Scholar]
- Struck, R. , Cordoni, S. , Aliotta, S. , Pérez‐Pachón, L. & Gröning, F. (2019) Application of photogrammetry in biomedical science. In: Rea, P.M. (Ed.) Biomedical Visualisation, Vol. 1. Cham: Springer International Publishing. [DOI] [PubMed] [Google Scholar]
- Tam, M.D. (2010) Building virtual models by postprocessing radiology images: a guide for anatomy faculty. Anatomical Sciences Education, 3, 261–266. [DOI] [PubMed] [Google Scholar]
- Thomas, D.B. , Hiscox, J.D. , Dixon, B.J. & Potgieter, J. (2016) 3D scanning and printing skeletal tissues for anatomy education. Journal of Anatomy, 229, 473–481. [DOI] [PMC free article] [PubMed] [Google Scholar]
- Trautman, J. , Mcandrew, D. & Craig, S.J. (2019) Anatomy teaching stuck in time? A 10‐year follow‐up of anatomy education in Australian and New Zealand medical schools. Australian Journal of Education, 63, 340–350. [Google Scholar]
- Vaduva, A.O. , Serban, C.L. , Lazureanu, C.D. , Cornea, R. , Vita, O. , Gheju, A. et al. (2020) Three‐dimensional virtual pathology specimens: decrease in student performance upon switching to digital models. Anatomical Sciences Education, 15(1), 115–126. [DOI] [PubMed] [Google Scholar]
- von Hagens, G. (1979) Impregnation of soft biological specimens with thermosetting resins and elastomers. The Anatomical Record, 194, 247–255. [DOI] [PubMed] [Google Scholar]
- Waltenberger, L. , Rebay‐Salisbury, K. & Mitteroecker, P. (2021) Three‐dimensional surface scanning methods in osteology: a topographical and geometric morphometric comparison. American Journal of Physical Anthropology, 174, 846–858. [DOI] [PMC free article] [PubMed] [Google Scholar]
- Wesencraft, K.M. & Clancy, J.A. (2020) Using photogrammetry to create a realistic 3D anatomy learning aid with Unity game engine. Biomedical Visualisation, 1205, 93–104. [DOI] [PubMed] [Google Scholar]
- Westoby, M.J. , Brasington, J. , Glasser, N.F. , Hambrey, M.J. & Reynolds, J.M. (2012) ‘Structure‐from‐Motion’ photogrammetry: a low‐cost, effective tool for geoscience applications. Geomorphology, 179, 300–314. [Google Scholar]
- Wilson, A.B. , Miller, C.H. , Klein, B.A. , Taylor, M.A. , Goodwin, M. , Boyle, E.K. et al. (2018) A meta‐analysis of anatomy laboratory pedagogies. Clinical Anatomy, 31, 122–133. [DOI] [PubMed] [Google Scholar]
- Ya'acob, S.H. , Suis, A.J. , Awang, N. & Sahani, M. (2013) Exposure assessment of formaldehyde and its symptoms among anatomy laboratory workers and medical students. Asian Journal of Applied Sciences, 6, 50–55. [Google Scholar]
- Ye, Z. , Dun, A. , Jiang, H. , Nie, C. , Zhao, S. , Wang, T. et al. (2020) The role of 3D printed models in the teaching of human anatomy: a systematic review and meta‐analysis. BMC Medical Education, 20, 335. [DOI] [PMC free article] [PubMed] [Google Scholar]
Associated Data
This section collects any data citations, data availability statements, or supplementary materials included in this article.
Supplementary Materials
Video S1.
Data Availability Statement
The data are not publicly available due to privacy or ethical restrictions.


