Abstract
Cell migration and invasion have essential roles in both normal physiology and disease. As such, methodologies to assess cell migratory and invasive capacities are necessary to elucidate normal cell processes and underlying mechanisms of disease. Here, we describe commonly used transwell in vitro methods for the study of cell migration and invasion. The transwell migration assay involves the chemotaxis of cells through a porous membrane after the establishment of a chemoattractant gradient using two medium-filled compartments. The transwell invasion assay involves the addition of an extracellular matrix on top of the porous membrane which only permits chemotaxis of cells which possess invasive properties such as tumor cells.
Keywords: Cell migration, Cell invasion, Transwell assay, Matrigel, Extracellular matrix
1. Introduction
Migration of cells, such as leukocytes, stem cells, fibroblasts, and tumor cells are involved in a variety of physiological and pathophysiological processes [1–10]. As such, cellular migration and invasion assays have been widely employed and made a significant impact in the fields of biology and biomedicine [1,11,5,7,12].
Numerous assays have been developed to evaluate spontaneous migration or chemotactic response toward a chemoattractant such as chemokines, bioactive lipids, or growth factors [13–21,4]. Here, we outline the widely utilized transwell migration and invasion assays which involve two medium-filled chambers that are divided by a porous membrane [13–15,17,18]. Medium containing the chemotactic agent is added to the bottom chamber followed by the seeding of cells in the top chamber to establish a chemoattractant gradient for directional cellular migration. Following incubation, the extent of cell chemotaxis can be assessed by quantification of adherent cells that have migrated to the basal side of the porous membrane. Additionally, migration of non-adherent cells to the bottom chamber can be quantified. For transwell invasion assays, addition of an extracellular matrix layer on top of the porous transwell membrane allows for the investigation of cell invasion and migration [13,14].
2. Materials
2.1. Cells
J774A.1 mouse macrophage/monocyte cell line (TIB-67).
Mouse bone marrow derived macrophages (BMDMs).
B16-F10 mouse melanoma cell line (CRL-6475), or any suitable cell line.
2.2. Media and solutions
Cell culture medium for J774A.1 macrophage cell line and B16-F10 melanoma cell line: Dulbecco’s Modified Eagle’s Medium (DMEM) + 10% fetal bovine serum (FBS) + 1% penicillin-streptomycin (5000 U/mL and 5000 μg/mL).
Cell culture medium for bone marrow derived macrophages (BMDMs): DMEM/F12 + 15% L929 conditioned medium (see Note 1) + 10% FBS + 1% penicillin-streptomycin.
Migration buffer: DMEM + 10 mM HEPES (N-[2-Hydroxyethyl]piperazine-N’-[2-ethanesulfonic acid]) + 0.1% bovine serum albumin (BSA), pH 7.4.
Dulbecco’s phosphate buffered saline (DPBS), Ca2+-/ Mg2+ -free.
0.25% (w/v) Trypsin-EDTA.
Crystal violet solution: 0.2% (w/v) crystal violet acetate in deionized water.
1 μg/mL 4´, 6-diamidino-2´-phenylindole, dihydrochloride (DAPI) in phosphate buffered saline (PBS).
0.4% Trypan Blue solution.
Matrigel extracellular matrix.
2.3. Transwell inserts
6.5 mm diameter inserts, 8.0 μm pore size, tissue culture treated, polycarbonate membrane, sterile polystyrene plates.
6.5 mm diameter insets, 5.0 μm pore size, tissue culture treated, polycarbonate membrane, sterile polystyrene plates. See Note 2.
2.4. Chemoattractant
Recombinant Complement component 5a (C5a).
Stromal cell derived factor 1α (SDF-1α).
NIH3T3 fibroblast conditioned medium. See Note 3.
2.5. Equipment
EVOS Fl inverted microscope or similar model, used for fluorescence detection.
DISCOVER ECHO Revolve 3 microscope or similar model, used for colorimetric detection.
Beckman Coulter Allegra X-12 centrifuge or similar model.
3. Methods
3.1. Cell Culture
Prepare cells for transwell cell migration assay by culturing up to 80–90% confluence in a tissue culture plate or a flask prior to initiating the experimental protocol. See Note 4.
For non-adherent cells, pipette 10 mL cell solution into a 15 mL conical tube and proceed with step 7.
For adherent cells, aspirate culture media from a 10 cm cell culture plate and gently add 5 mL room temperature (R.T.) phosphate buffered saline (PBS) without calcium and magnesium to the inside wall of the cell culture plate, swirl gently to cover entire plate, aspirate and add another 5 mL PBS for an additional wash. See Note 5.
Aspirate PBS solution from the plate, add 2 mL 0.25% Trypsin-EDTA and swirl gently allowing trypsin to cover the entire plate. See Note 6.
Insert the cell culture plate into an incubator set at 37°C and 5% CO2 and incubate for 3 minutes or until cells are detached from the plate.
Remove cell culture plate from the incubator, add 3 mL warmed medium supplemented with 10% fetal bovine serum (FBS) to the plate, mix gently with a pipette to further detach cells from the culture plate and make single cell suspension. Transfer the 5 mL cell solution into a 15 mL conical centrifuge tube.
Centrifuge the conical tube at 335 x g for 5 minutes to pellet the cells.
Aspirate the solution leaving the cell pellet undisturbed and subsequently flick the conical tube to loosen the cell pellet.
Add 5 mL PBS to the conical tube and pipette gently to mix cells. Repeat steps 7 – 8.
Add the migration buffer and pipette gently to mix cell solution.
Pipette 15 μL of cell solution into 15 μL of trypan blue in the well of a 96-well plate, pipette up and down 4–5 times to mix solution and carefully transfer 10 μL to a hemocytometer. Count live and dead cells. Resuspend viable cells to a concentration of 1 × 10⁶ cells/mL in the migration buffer. See Note 7.
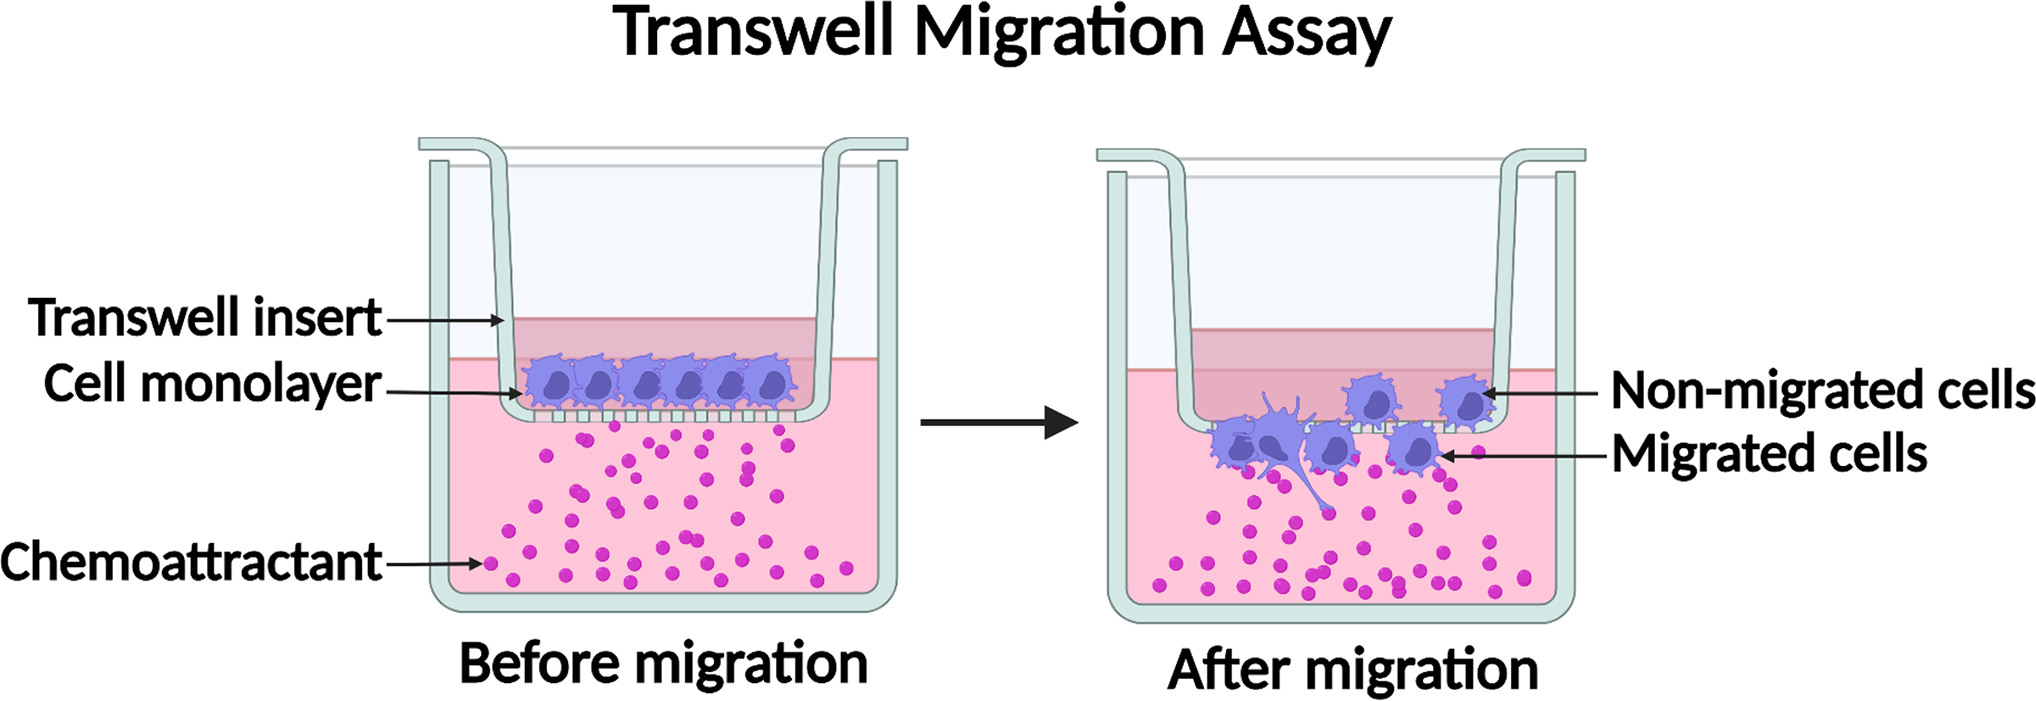
3.2. Transwell Cell Migration Assay (see Figure 1)
Figure 1.

Diagram of the transwell cell migration assay. Cells in migration buffer are added into a transwell insert with a porous membrane. A chemoattractant is added into the bottom chamber to form a chemotactic gradient. Cells sense the chemotactic gradient and migrate through the pores of the transwell membrane. Created with BioRender.com.
Carefully pipette 100 μL cell solution containing 1 × 10⁵ cells onto the membrane of the 24-well transwell insert (5 or 8 μm pore size) and incubate for 10 minutes at 37°C and 5% CO2. See Notes 8 & 9.
Carefully add 600 μL of migration buffer containing chemoattractant (e.g., 5 ng/mL C5a or 10% NIH3T3 fibroblast conditioned medium) to the well directly below the transwell insert. See Notes 10, 11 & 12.
Incubate the plate at 37°C and 5% CO2 for 2 to 5 hours. See Note 13.
For non-adherent cells, migrated cells will drop into the medium in the bottom chamber. The transwell insert should be carefully removed with forceps and the migrated cells in the medium of the bottom chamber can be quantified as described in section 3.7.
For adherent cells, follow steps 6 – 11.
Remove the plate from the incubator. See Note 14.
Using a cotton-tipped applicator, gently remove any non-migrated cells from the apical side of the transwell insert membrane. Repeat to ensure there are no remaining non-migrated cells.
Pipette 1 mL of 70% ethanol into a well of a 24-well plate.
Place the transwell insert into a well containing 70% ethanol. Incubate at R.T. for 10–15 minutes to fix the migrated cells on the basal side of the transwell insert membrane.
Place the insert into an empty well to allow the transwell membrane to dry.
Proceed with the preferred staining method in sections 3.4. and 3.5.
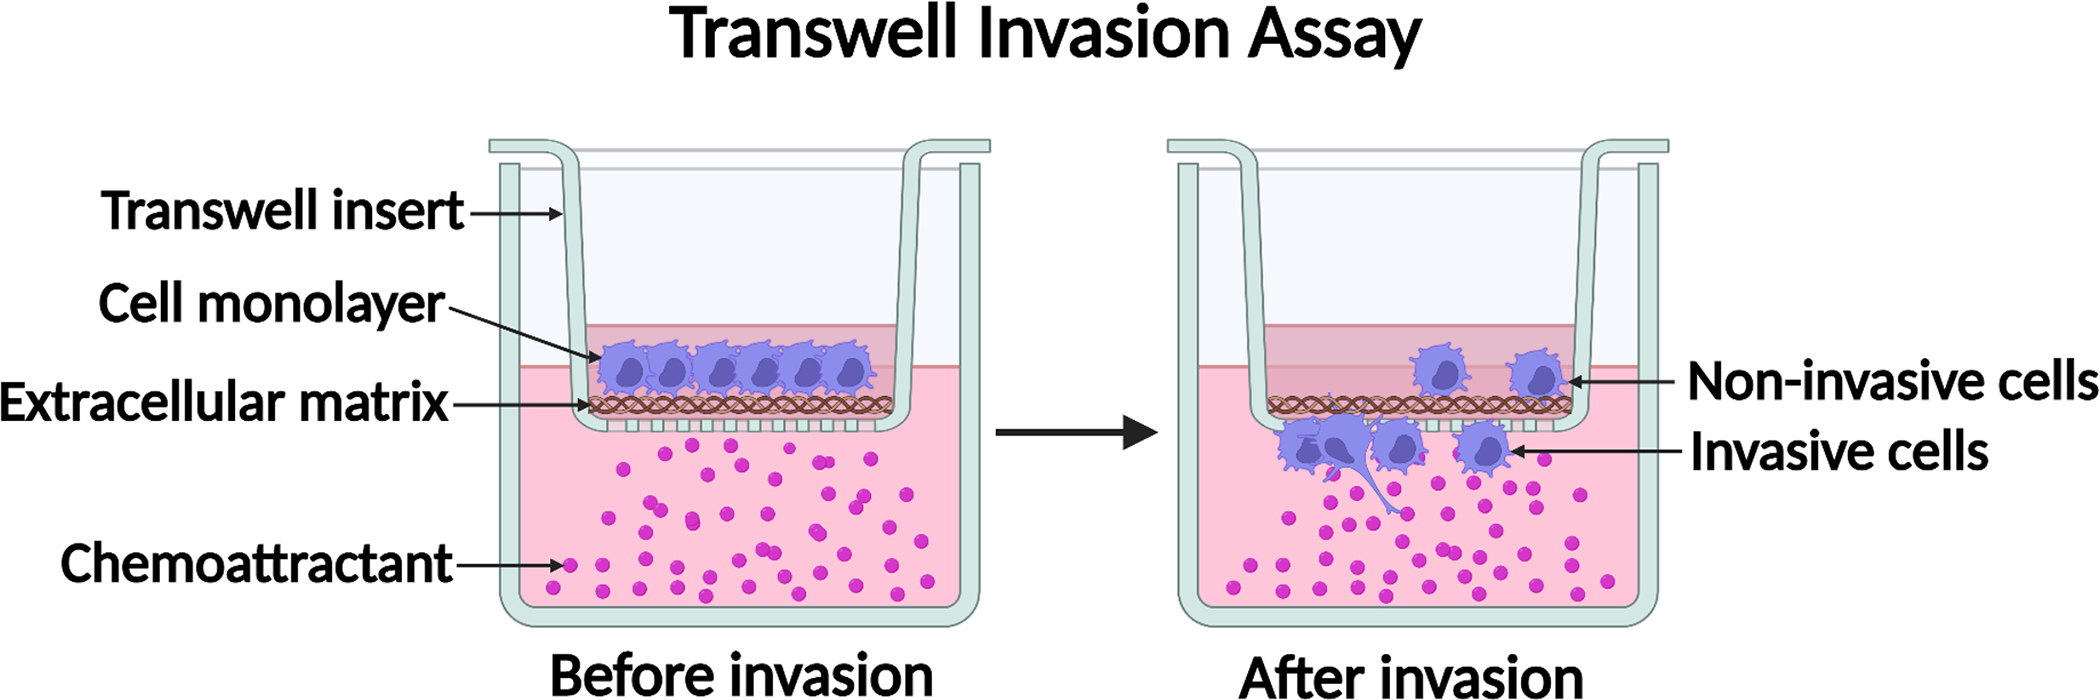
3.3. Transwell Cell Invasion Assay (see Figure 2)
Figure 2.

Diagram of the transwell cell invasion assay. An extracellular matrix such as Matrigel is added to the apical side of the transwell membrane to form a uniform thin layer of gel. Cells in migration buffer are added into the transwell insert. A chemoattractant is added into the bottom chamber to form a chemotactic gradient. Cells with invasive capability can sense the chemotactic gradient, invade through the extracellular matrix, and migrate through the pores of the transwell membrane. Created with BioRender.com.
Remove Matrigel solution from −20 °C freezer and store in 4 °C refrigerator overnight the day prior to starting the experimental protocol.
Keep Matrigel solution on ice while completing the experimental protocol. See Note 15.
Prepare the Matrigel solution by diluting the stock solution with sterile ice-cold deionized water (1:1 to 1:2), then mix well. See Note 16.
In a biosafety hood, gently add 50–100 μL of diluted Matrigel solution to the membrane of a transwell insert. See Note 17.
Incubate the 24-well plate containing the transwell inserts with Matrigel for 30 minutes to 1 hour at 37°C and 5% CO2 to allow Matrigel to solidify.
Carefully pipette 100 μL cell suspension, such as B16-F10 melanoma cells, in migration buffer onto the Matrigel and incubate for 10 minutes at 37°C and 5% CO2. See Note 18.
Carefully add 600 μL of migration buffer containing chemoattractant (e.g., 10% NIH3T3 fibroblast conditioned medium or 5 ng/mL SDF-1α) to the well directly below the 24-well transwell insert. See Note 10, 11 & 12.
Incubate the plate at 37°C and 5% CO2 for 16–24 hours. See Note 13.
For non-adherent cells, the transwell insert should be carefully removed with forceps and the migrated cells in the medium of the bottom chamber can be quantified as described in section 3.7.
For adherent cells, follow steps 11 – 16.
Remove the plate from the incubator. Gently but firmly remove Matrigel from the inside of the transwell insert by use of a cotton tipped applicator. Repeat with a fresh cotton-tipped applicator to ensure all Matrigel and remaining non-migratory cells are removed. See Note 14.
Pipette 1 mL PBS into a well and 1 mL 70% ethanol into another well of a 24-well plate.
Remove the transwell insert from the well containing media and place the insert into the well containing PBS to briefly wash the membrane.
Remove the transwell insert from the well containing PBS and place the insert into the well containing 70% ethanol.
Incubate at R.T. for 10–15 minutes to fix the migrated cells and subsequently place the insert into an empty well to allow the transwell membrane to dry.
Proceed with preferred staining methods in sections 3.4. and 3.5.
3.4. Colorimetric Staining for Migrated Adherent Cells – Crystal Violet
Place the transwell insert into the well with 0.2% (w/v) crystal violet and incubate for 3–5 minutes at R.T. See Note 19.
Remove the transwell insert and place it into a well containing PBS or water to wash any remaining crystal violet from the membrane.
Repeat the wash with PBS or water to remove excess crystal violet.
Allow the membrane to dry by placing the transwell insert into an empty well.
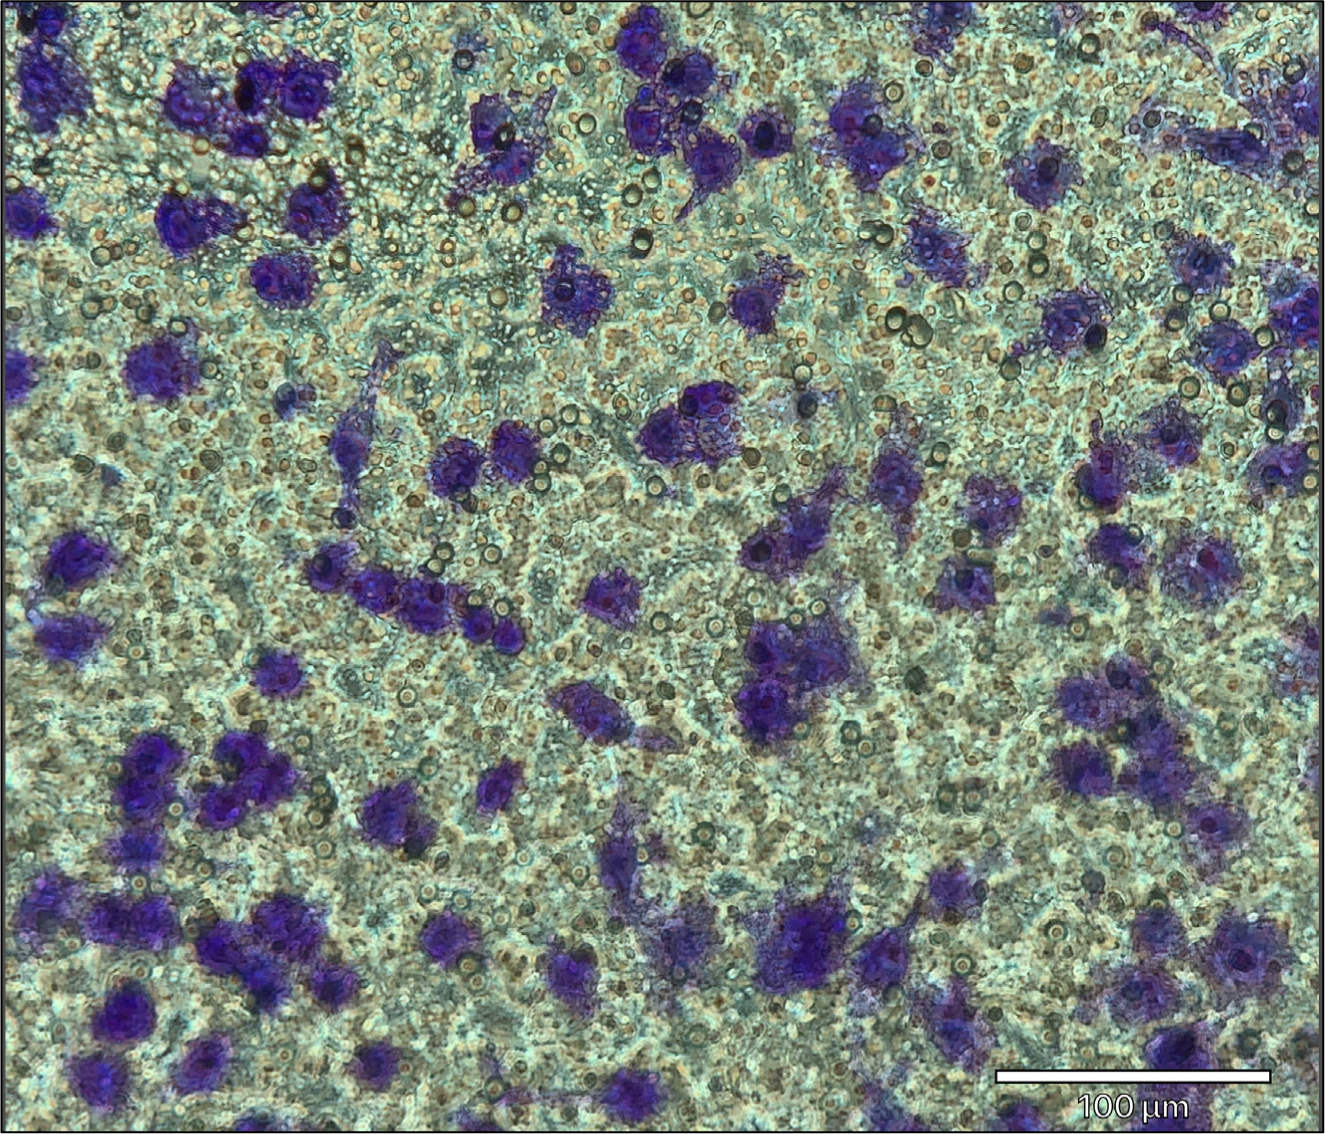
Using a microscope, multiple images of the transwell membrane can be taken with a 10x or 20x objective to ensure a representative field of view (FOV) is captured (see Figure 3). See Note 20.
Figure 3.

Representative image of migrated cells stained with crystal violet. J774A.1 macrophage/monocyte migration using 100 ng/mL recombinant mouse C5a. Migrated cells are stained with 0.2% crystal violet solution. Images of the transwell membrane are taken with a 20x objective using the ECHO Revolve 3 microscope. Migrated J774A.1 cells are stained purple. Scale bar = 100 μm.
3.5. Fluorescent Staining for Migrated Adherent Cells – DAPI
Dilute the stock solution of DAPI (1 mg/mL) by adding 1 μL into 1000 μL PBS and add 600 μL of diluted DAPI solution (1 μg/mL) into a well of a 24 well plate. See Note 21.
Place the transwell insert into the well with diluted DAPI and incubate for 10 minutes while protected from light.
Pipette 1 mL of PBS into 3 separate wells in the 24 well plate.
Place the transwell insert into one of the wells containing PBS to wash the transwell insert and repeat with the other two wells for a total of 3 washes.
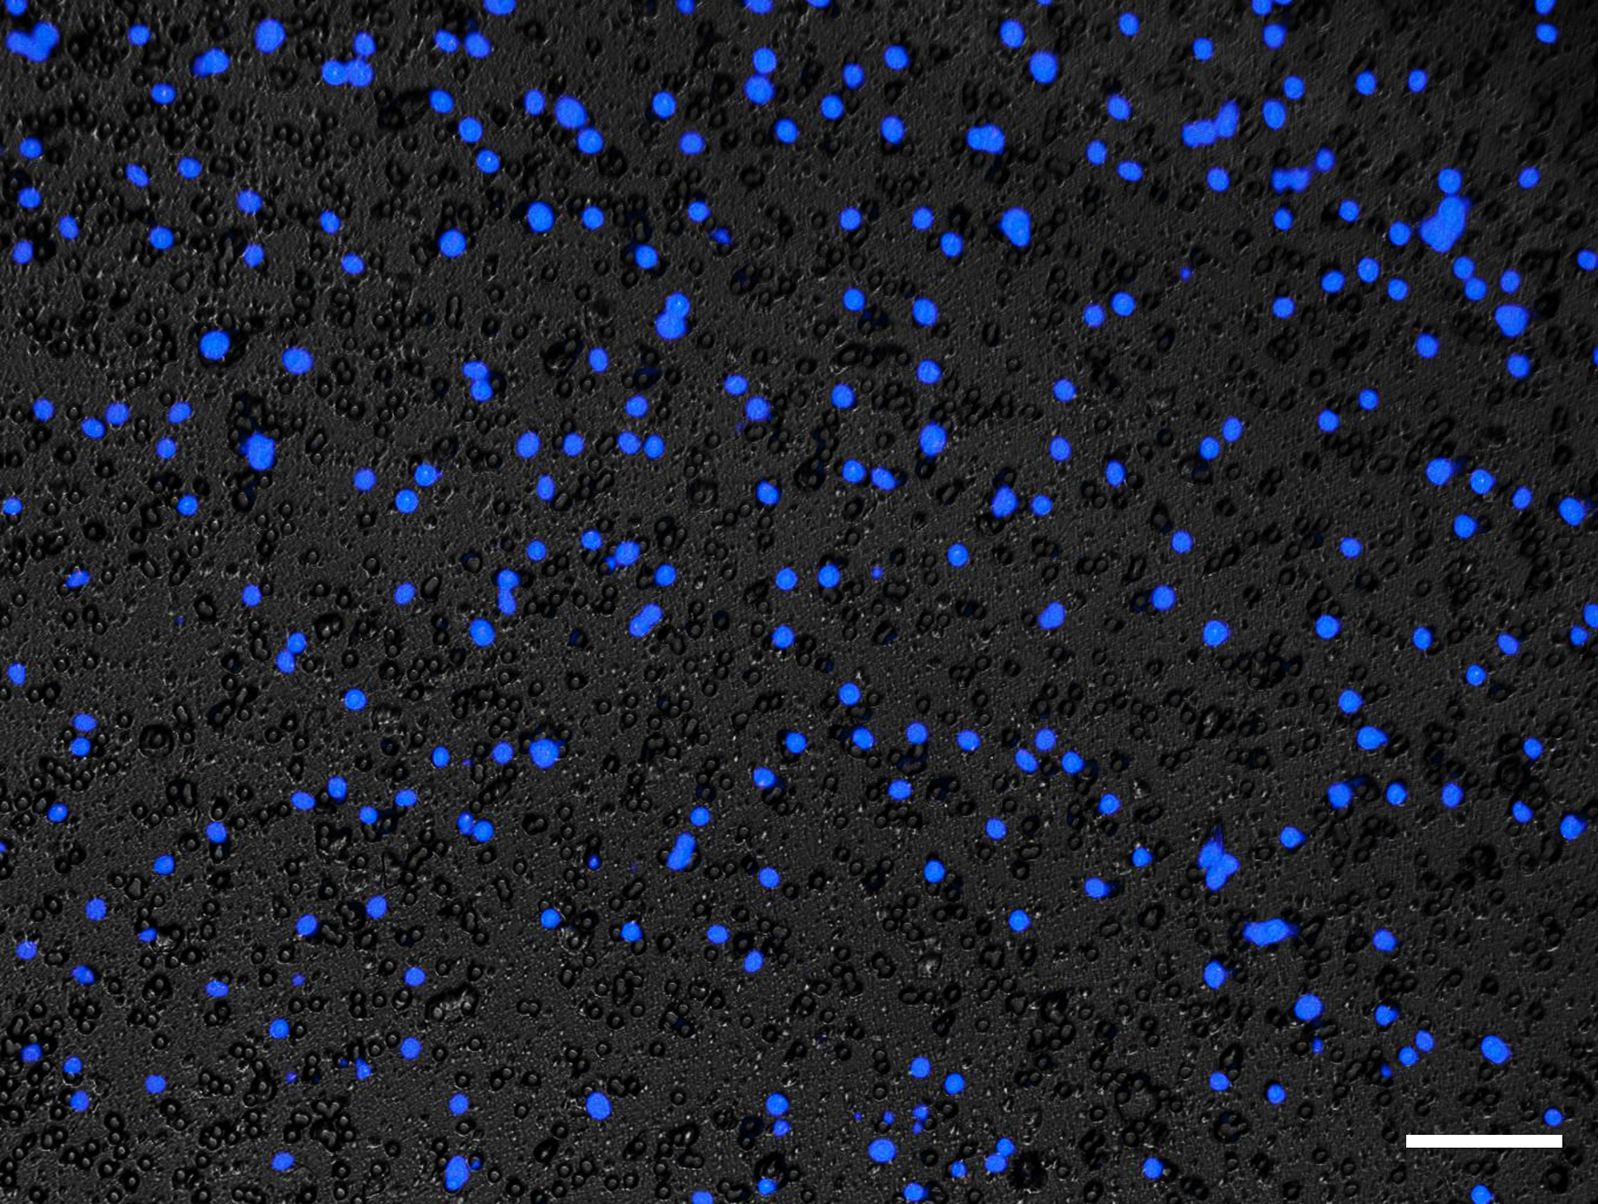
Using a fluorescence microscope, images of the transwell membrane can be taken with a 10x or 20x objective to ensure a representative FOV is captured (see Figure 4). See Note 20.
Figure 4.

Representative image of migrated cells stained with DAPI. Bone marrow derived macrophage (BMDM) migration using 5 ng/mL recombinant human C5a. Migrated cells are stained with 1 μg/mL DAPI solution. Images of the transwell membrane are taken with a 10x objective using the EVOS Fl fluorescence microscope. The nuclei of migrated BMDMs are stained with DAPI and visualized using a fluorescence microscope. Scale bar = 100 μm.
3.6. Quantification of Migrated Adherent Cells
As described above, adherent cells migrate through the pores of the transwell membrane and adhere to the basal side of the membrane. The migrated cells can be fixed and stained. Multiple representative images can be taken for quantification of cell migration.
Adobe Photoshop’s counting tool can be used to enumerate the number of crystal violet- or DAPI-positive cells per FOV.
Open each image and click to label each cell in the FOV.
The average number of migrated cells per FOV can be calculated.
Alternatively, the multi-point tool of the ImageJ software can be used to count cells per FOV. See Note 22.
3.7. Quantification of Migrated Non-Adherent Cells
Non-adherent cells migrating through the pores of the transwell membrane will drop into the medium in the bottom chamber. The 600 μL of cell-containing medium in the bottom chamber can be collected for quantification.
Migrated cells in the medium can be directly counted using a hemocytometer. The total number of migrated cells = cells/mL x collected volume. If the cell concentration is low, the samples may be centrifuged to concentrate the cells, then resuspended in a smaller volume of medium and counted using a hemocytometer.
Alternatively, a flow cytometer or cell counting instrument (e.g., automated cell counter) can be used to count the migrated cells in the medium.
4. Notes
L929 conditioned medium is obtained from the mouse fibroblast L929 cell line. L929 cells secrete macrophage colony stimulating factor (M-CSF) which is required for the differentiation of BMDMs [22,23].
Transwell pore size should be chosen based on cell type and size. Generally, the selected membrane pore size should be smaller than the cell diameter when in suspension. Pilot experiments may be needed to determine the appropriate membrane pore size, which allows sufficient cell migration toward a chemoattractant while minimizing random cell migration without chemoattractant.
NIH3T3 conditioned medium is generated by growing the mouse NIH3T3 fibroblasts in DMEM + 10% FBS to ~95% confluency. The medium is collected and centrifuged to remove cell debris. The conditioned medium contains soluble chemotactic factors secreted by NIH3T3 fibroblasts.
J774A.1 cells and B16-F10 cells are cultured using the tissue culture plate. BMDMs are cultured using a non-tissue culture petri dish.
PBS without calcium and magnesium may be used to disassociate specific cell types without strong adherence to substrates. J774A.1 cells are semi-adherent and can be mechanically dissociated into single cell suspension by direct pipetting.
Percentage of Trypsin-EDTA solution required to detach cells is cell type specific and should be empirically determined prior to completing the transwell cell migration assay. Prolonged exposure to Trypsin-EDTA can impact cell migration due to cleavage of cell surface receptors. As such, Trypsin-EDTA exposure time should be limited. If a cell surface receptor under investigation is sensitive to trypsin cleavage, non-enzymatic cell dissociation buffer can be used.
Percentage of live and dead cells should be considered prior to continuing with the experimental protocol. It is recommended that the experimental protocol below should only be initiated if cells are more than 95% viable. If cell clumps are observed, a cell strainer can be used to remove the clumps.
Be careful not to disturb the transwell membrane with the pipette tip. The transwell membrane pore size and cell number used is dependent on the cell type being investigated. Generally, a 5 μm to 8 μm pore size and cell concentration of 1 × 10⁶ cells/mL are a good starting point.
This incubation step is to allow the cells time to settle on the transwell insert membrane.
Be careful not to disturb the transwell insert. Slowly add the chemoattractant to the lower chamber to form a chemoattractant gradient. Avoid air bubbles.
Ensure the chemoattractant is in direct contact with the transwell membrane and that there are no bubbles present under the transwell membrane to ensure a proper chemoattractant gradient is present. This is critical for the success of the cell chemotaxis assay.
The chemoattractant used and the optimal concentration depend on cell type and should be empirically determined.
The migration time depends on cell type and should be empirically determined.
A sterile environment is no longer required from this step.
Matrigel liquefies at 4°C or on ice and solidifies at 37°C.
Avoid creating bubbles and keep all reagents chilled on ice.
Carefully pipette Matrigel solution onto the transwell membrane to avoid damaging the membrane. Make sure that Matrigel forms a uniform thin layer of gel on top of the transwell membrane.
Be careful not to disturb the transwell membrane or Matrigel with the pipette tip.
Other colorimetric dyes, such as hematoxylin, can also be used to stain the migrated cells.
Remaining non-migrated cells may be observed at the edge of the apical side on the transwell membrane. Avoid taking images of these areas.
Other fluorescent dyes, such as Hoechst 33358, can also be used to stain the migrated cells.
ImageJ is a software that can be freely downloaded from https://imagej.nih.gov/ij/.
Acknowledgement
The work was supported by research grants from the National Institutes of Health (R03CA249473 and R15DK109484, to L.V.Y.).
References
- 1.Eksteen B, Liaskou E, Adams DH (2008) Lymphocyte homing and its role in the pathogenesis of IBD. Inflamm Bowel Dis 14 (9):1298–1312. doi: 10.1002/ibd.20453 [DOI] [PubMed] [Google Scholar]
- 2.Bauer A, Tatliadim H, Halin C (2022) Leukocyte Trafficking in Lymphatic Vessels. Cold Spring Harb Perspect Med. doi: 10.1101/cshperspect.a041186 [DOI] [PMC free article] [PubMed] [Google Scholar]
- 3.Liesveld JL, Sharma N, Aljitawi OS (2020) Stem cell homing: From physiology to therapeutics. Stem Cells 38 (10):1241–1253. doi: 10.1002/stem.3242 [DOI] [PubMed] [Google Scholar]
- 4.Maddaluno L, Urwyler C, Werner S (2017) Fibroblast growth factors: key players in regeneration and tissue repair. Development 144 (22):4047–4060. doi: 10.1242/dev.152587 [DOI] [PubMed] [Google Scholar]
- 5.Hall A (2009) The cytoskeleton and cancer. Cancer Metastasis Rev 28 (1–2):5–14 [DOI] [PubMed] [Google Scholar]
- 6.Nagano M, Hoshino D, Koshikawa N, Akizawa T, Seiki M (2012) Turnover of focal adhesions and cancer cell migration. Int J Cell Biol 2012:310616. doi: 10.1155/2012/310616 [DOI] [PMC free article] [PubMed] [Google Scholar]
- 7.Yilmaz M, Christofori G (2010) Mechanisms of motility in metastasizing cells. Mol Cancer Res 8 (5):629–642. doi: 10.1158/1541-7786.MCR-10-0139 [DOI] [PubMed] [Google Scholar]
- 8.Sanderlin EJ, Leffler NR, Lertpiriyapong K, Cai Q, Hong H, Bakthavatchalu V, Fox JG, Oswald JZ, Justus CR, Krewson EA, O’Rourke D, Yang LV (2017) GPR4 deficiency alleviates intestinal inflammation in a mouse model of acute experimental colitis. Biochim Biophys Acta 1863 (2):569–584. doi: 10.1016/j.bbadis.2016.12.005 [DOI] [PMC free article] [PubMed] [Google Scholar]
- 9.Krewson EA, Sanderlin EJ, Marie MA, Akhtar SN, Velcicky J, Loetscher P, Yang LV (2020) The Proton-Sensing GPR4 Receptor Regulates Paracellular Gap Formation and Permeability of Vascular Endothelial Cells. iScience 23 (2):100848. doi: 10.1016/j.isci.2020.100848 [DOI] [PMC free article] [PubMed] [Google Scholar]
- 10.Marie MA, Sanderlin EJ, Satturwar S, Hong H, Lertpiriyapong K, Donthi D, Yang LV (2022) GPR65 (TDAG8) inhibits intestinal inflammation and colitis-associated colorectal cancer development in experimental mouse models. Biochim Biophys Acta Mol Basis Dis 1868 (1):166288. doi: 10.1016/j.bbadis.2021.166288 [DOI] [PMC free article] [PubMed] [Google Scholar]
- 11.Amantea D, Nappi G, Bernardi G, Bagetta G, Corasaniti MT (2009) Post-ischemic brain damage: pathophysiology and role of inflammatory mediators. FEBS J 276 (1):13–26. doi: 10.1111/j.1742-4658.2008.06766.x [DOI] [PubMed] [Google Scholar]
- 12.Itatani Y, Kawada K, Inamoto S, Yamamoto T, Ogawa R, Taketo MM, Sakai Y (2016) The Role of Chemokines in Promoting Colorectal Cancer Invasion/Metastasis. Int J Mol Sci 17 (5). doi: 10.3390/ijms17050643 [DOI] [PMC free article] [PubMed] [Google Scholar]
- 13.Castellone RD, Leffler NR, Dong L, Yang LV (2011) Inhibition of tumor cell migration and metastasis by the proton-sensing GPR4 receptor. Cancer Lett 312 (2):197–208. doi: 10.1016/j.canlet.2011.08.013 [DOI] [PubMed] [Google Scholar]
- 14.Justus CR, Leffler N, Ruiz-Echevarria M, Yang LV (2014) In vitro cell migration and invasion assays. J Vis Exp (88):e51046. doi: 10.3791/51046 [DOI] [PMC free article] [PubMed] [Google Scholar]
- 15.Radu CG, Yang LV, Riedinger M, Au M, Witte ON (2004) T cell chemotaxis to lysophosphatidylcholine through the G2A receptor. Proc Natl Acad Sci U S A 101 (1):245–250. doi: 10.1073/pnas.2536801100 [DOI] [PMC free article] [PubMed] [Google Scholar]
- 16.Rodriguez LG, Wu X, Guan JL (2005) Wound-healing assay. Methods Mol Biol 294:23–29. doi:1-59259-860-9:023 [DOI] [PubMed] [Google Scholar]
- 17.Justus CR, Sanderlin EJ, Dong L, Sun T, Chi JT, Lertpiriyapong K, Yang LV (2017) Contextual tumor suppressor function of T cell death-associated gene 8 (TDAG8) in hematological malignancies. J Transl Med 15 (1):204. doi: 10.1186/s12967-017-1305-6 [DOI] [PMC free article] [PubMed] [Google Scholar]
- 18.Yang LV, Radu CG, Wang L, Riedinger M, Witte ON (2005) Gi-independent macrophage chemotaxis to lysophosphatidylcholine via the immunoregulatory GPCR G2A. Blood 105 (3):1127–1134 [DOI] [PubMed] [Google Scholar]
- 19.Junger WG (2008) Purinergic regulation of neutrophil chemotaxis. Cell Mol Life Sci 65 (16):2528–2540. doi: 10.1007/s00018-008-8095-1 [DOI] [PMC free article] [PubMed] [Google Scholar]
- 20.Peter C, Waibel M, Radu CG, Yang LV, Witte ON, Schulze-Osthoff K, Wesselborg S, Lauber K (2008) Migration to apoptotic “find-me” signals is mediated via the phagocyte receptor G2A. J Biol Chem 283 (9):5296–5305. doi: 10.1074/jbc.M706586200 [DOI] [PubMed] [Google Scholar]
- 21.Roussos ET, Condeelis JS, Patsialou A (2011) Chemotaxis in cancer. Nat Rev Cancer 11 (8):573–587. doi: 10.1038/nrc3078 [DOI] [PMC free article] [PubMed] [Google Scholar]
- 22.Zhang X, Goncalves R, Mosser DM (2008) The isolation and characterization of murine macrophages. Curr Protoc Immunol Chapter 14:Unit 14 11. doi: 10.1002/0471142735.im1401s83 [DOI] [PMC free article] [PubMed] [Google Scholar]
- 23.Ying W, Cheruku PS, Bazer FW, Safe SH, Zhou B (2013) Investigation of macrophage polarization using bone marrow derived macrophages. J Vis Exp (76): e50323. doi: 10.3791/50323 [DOI] [PMC free article] [PubMed] [Google Scholar]


