Abstract
The laboratory rat, Rattus norvegicus, is an important model of human health and disease, and experimental findings in the rat have relevance to human physiology and disease. The Rat Genome Database (RGD, https://rgd.mcw.edu) is a model organism database that provides access to a wide variety of curated rat data including disease associations, phenotypes, pathways, molecular functions, biological processes, cellular components, and chemical interactions for genes, quantitative trait loci, and strains. We present an overview of the database followed by specific examples that can be used to gain experience in employing RGD to explore the wealth of functional data available for the rat and other species.
Keywords: rat, database, quantitative trait locus, ontology, gene
INTRODUCTION
The Rat Genome Database (RGD) provides the scientific community with a public source for a variety of information related to the laboratory rat (https://rgd.mcw.edu; (Smith, et al. 2020). RGD incorporates manually curated data and information through electronic resources into a comprehensive and dynamic database containing information on genes, strains, quantitative trait loci (QTLs), simple sequence length polymorphisms (SSLPs), sequences, maps, and orthologs, all with supporting references. RGD also provides a collection of visualization and analysis applications to assist researchers in effectively utilizing the information available in the database. This integration of manually curated data with electronically imported information obtained from major public data repositories (e.g., NCBI, UniProt), combined with diverse analysis tools, makes RGD a uniquely valuable resource to the scientific community.
This unit focuses on using RGD to access the phenotypic, functional, and genomic annotations that are available in the database. Basic Protocol 1 provides an overview of the RGD home page and illustrates the various features and entry points into the RGD Web site. The subsequent protocols explain the various routes to information in the database, how to use the more advanced querying tools, and how to interpret the individual data reports (Basic Protocols 2 and 3). The other protocols describe how to use RGD data analysis tools and how to navigate the RGD data portals.
BASIC PROTOCOL 1
NAVIGATING THE RGD HOME PAGE
The RGD Home Page provides entry points into the many features of the RGD Web site. It has several distinct sections that group together related content, and these are discussed in more detail below.
Necessary Resources
Hardware
Computer with functioning Internet connection
Software
Web browser (Microsoft Edge, Mozilla Firefox, Google Chrome, or Apple Safari)
Protocol steps with step annotations
Locate the RGD home page at https://rgd.mcw.edu.
- Examine the basic resource categories in RGD (Fig. 1).Resource categories are arranged on tabs at the top of the page and are divided into the six major areas of the RGD Web site: Data, Analysis & Visualization, Diseases, Phenotypes & Models, Pathways, and Community (Fig. 1A). Each tab provides quick access to the corresponding section of the RGD Web site. Expanded data and tool links are also available in the center of the home page (Fig. 1C).
- Explore the remainder of the home page.Right of center is a section containing tweets/links to RGD tweets of recent updates or rat research-related news items (Fig. 1D). Below the tweets are a list of video tutorials (Fig. 1E), which provide general introductions to various sections and topics of the RGD Web site. The bottom left portion of the home page has a list of RGD news items/links to announcements of updates, interesting journal articles, and others RGD-related information (Fig. 1F). Below the news is a list of upcoming conferences that may be of interest to RGD users (Fig. 1G). Each line in the list is a link to the home page of that conference.
Figure 1.
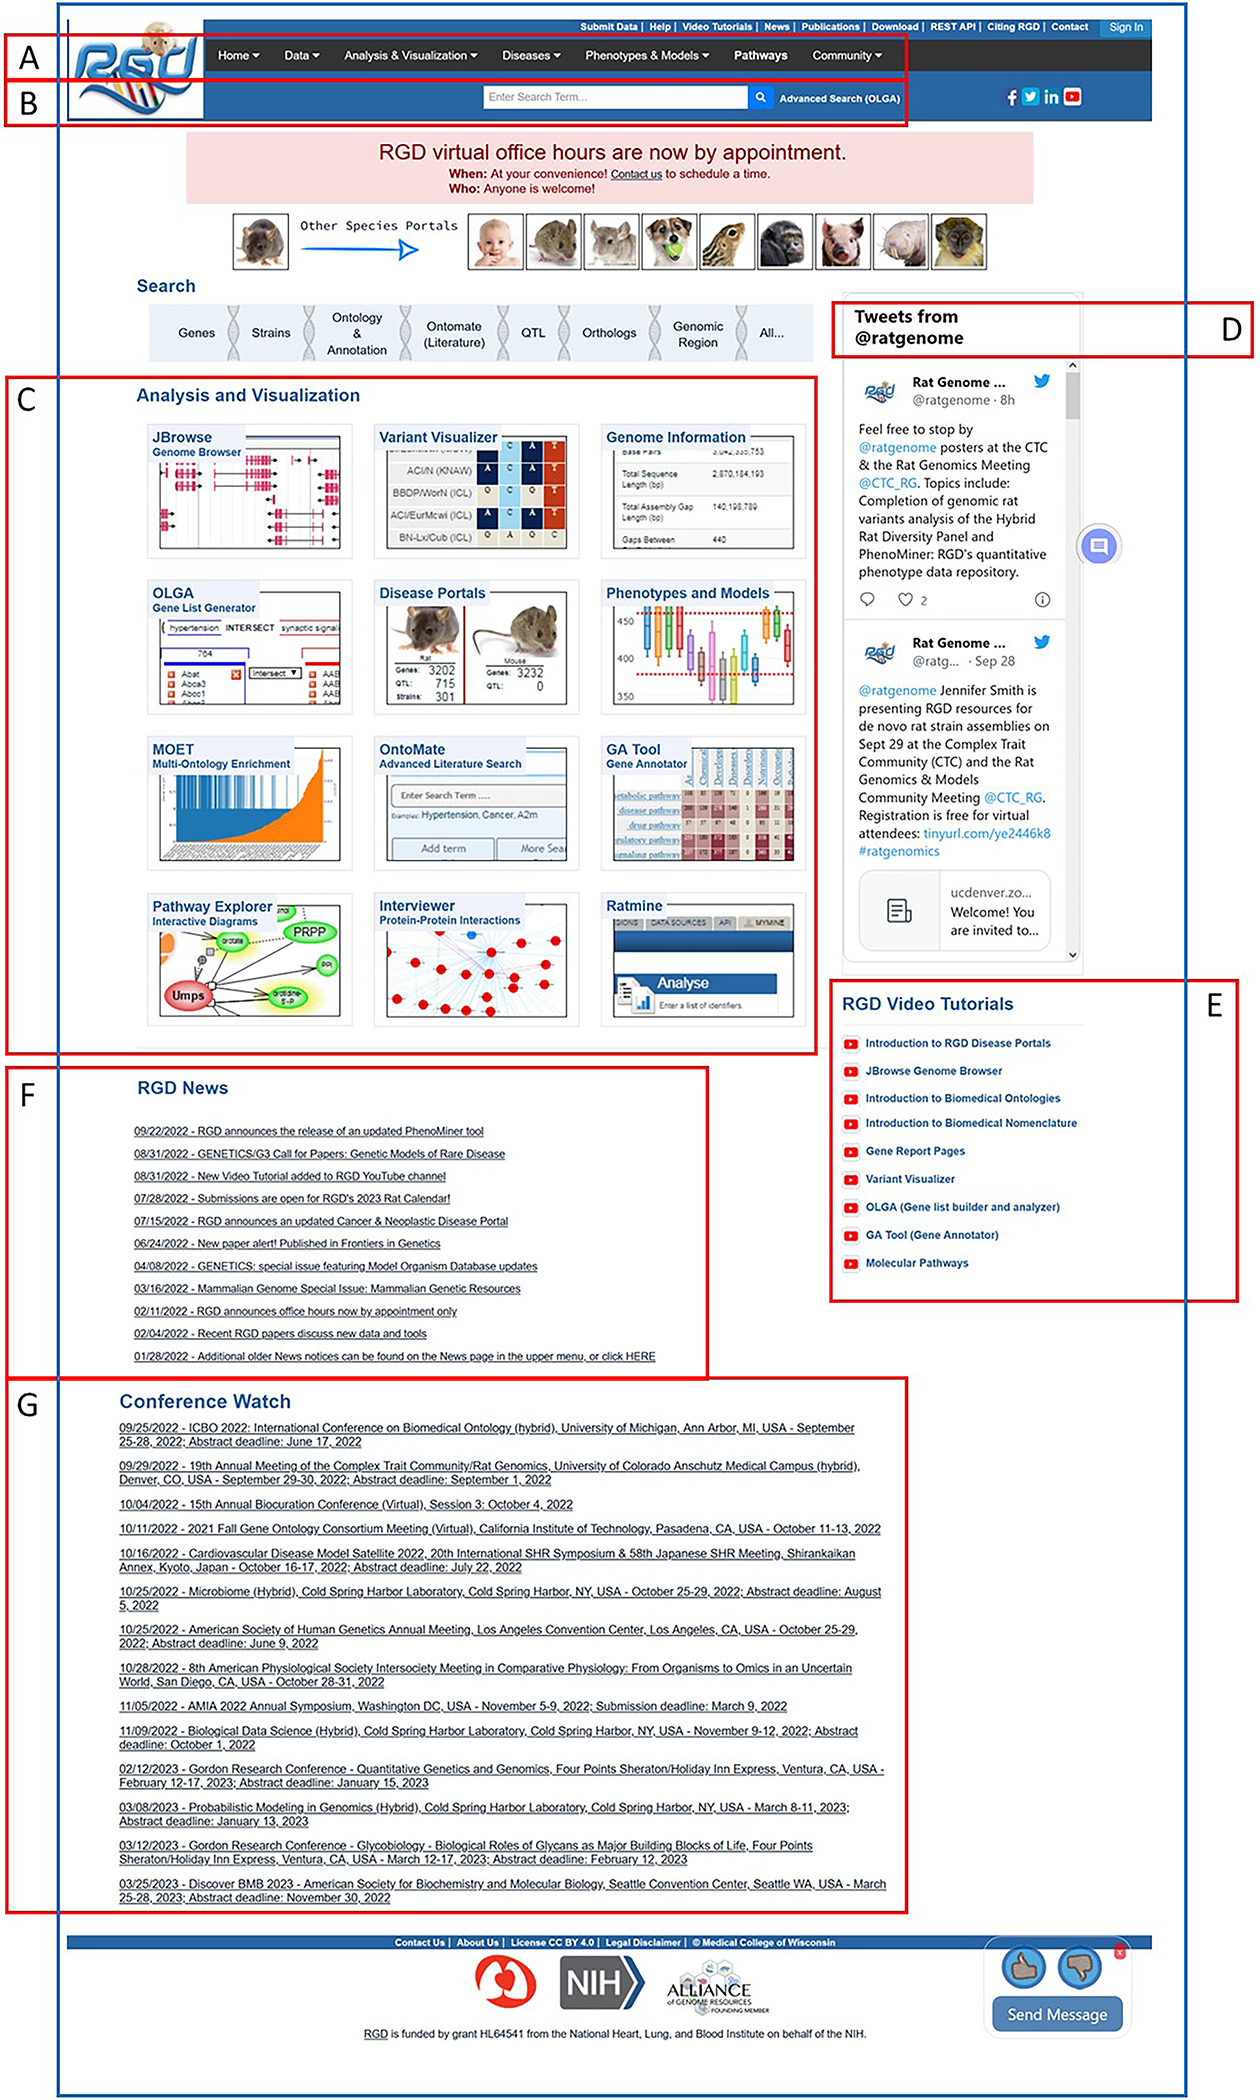
The RGD home page. Tabs and links to all the data and analysis tools at RGD are found here: Menu bar (A), General text search box (B), Links to data visualization and analysis software tools (C), and RGD messages made on Twitter (D). The bottom half of the page covers RGD tutorial videos (E), RGD news (F), and a conference list for users (G).
BASIC PROTOCOL 2
USING THE RGD SEARCH FUNCTIONS
The RGD Web site has several ways to search for data, depending on the scope of the specific information desired. The keyword search text box, available at the top center of most RGD Web pages (Fig. 1B), provides a fast way to get at specific data, such as gene or QTL information, when a name, keyword, or accession number is known. It searches across most object types (genes, QTLs, strains, homologs, SSLPs, ESTs, and references) and many data types. It also searches the many controlled vocabularies used at RGD, including gene ontology (biological process, molecular function, and cellular component), mammalian phenotype ontology, pathway ontology, and disease vocabulary. Also, one can search specific object types and ontologies directly through the Data choice in the menu bar or through the “Search” bar near the top of the RGD homepage.
Necessary Resources
Hardware
Computer with functioning Internet connection
Software
Web browser (Microsoft Edge, Mozilla Firefox, Google Chrome, or Apple Safari)
Protocol steps with step annotations
Using the general keyword search
-
1Go to the RGD Web site as described in Basic Protocol 1. Enter a key word or phrase in the keyword search box in the upper center of any RGD web page (Fig. 1B). For example, enter “protease”, then click the search icon or press the Enter key.Any text can be entered, and the search looks for an exact or partial match of whatever word or phrase is entered. Wildcards can be used at either end of a word, and punctuation is ignored. Certain short, common words, such as “a” or “the,” cannot be searched. See Figure 2 for results of the “protease” search. An intermediate results page is shown that groups result by category. In this instance data objects, ontology terms, and references represent the result categories.
-
2Click “GO: Molecular Function” on the results page (Fig. 2A) to display a list of result terms from that ontology (Fig 3a) as well as the list of the other ontologies from the original results list (Fig 3b). Open the ontology browser by clicking on the branch icon next to “protease binding” (Fig. 4A). Click the “A” icon next to “protease binding” (Fig. 4B) to open the corresponding ontology report annotation page (Fig. 4C) with rat as the default species selected.The ontology report page lists all annotations to “protease binding” and its children terms by gene and species. A view of chromosomal location of the annotated genes is shown in an ideogram above the gene list.
Figure 2.
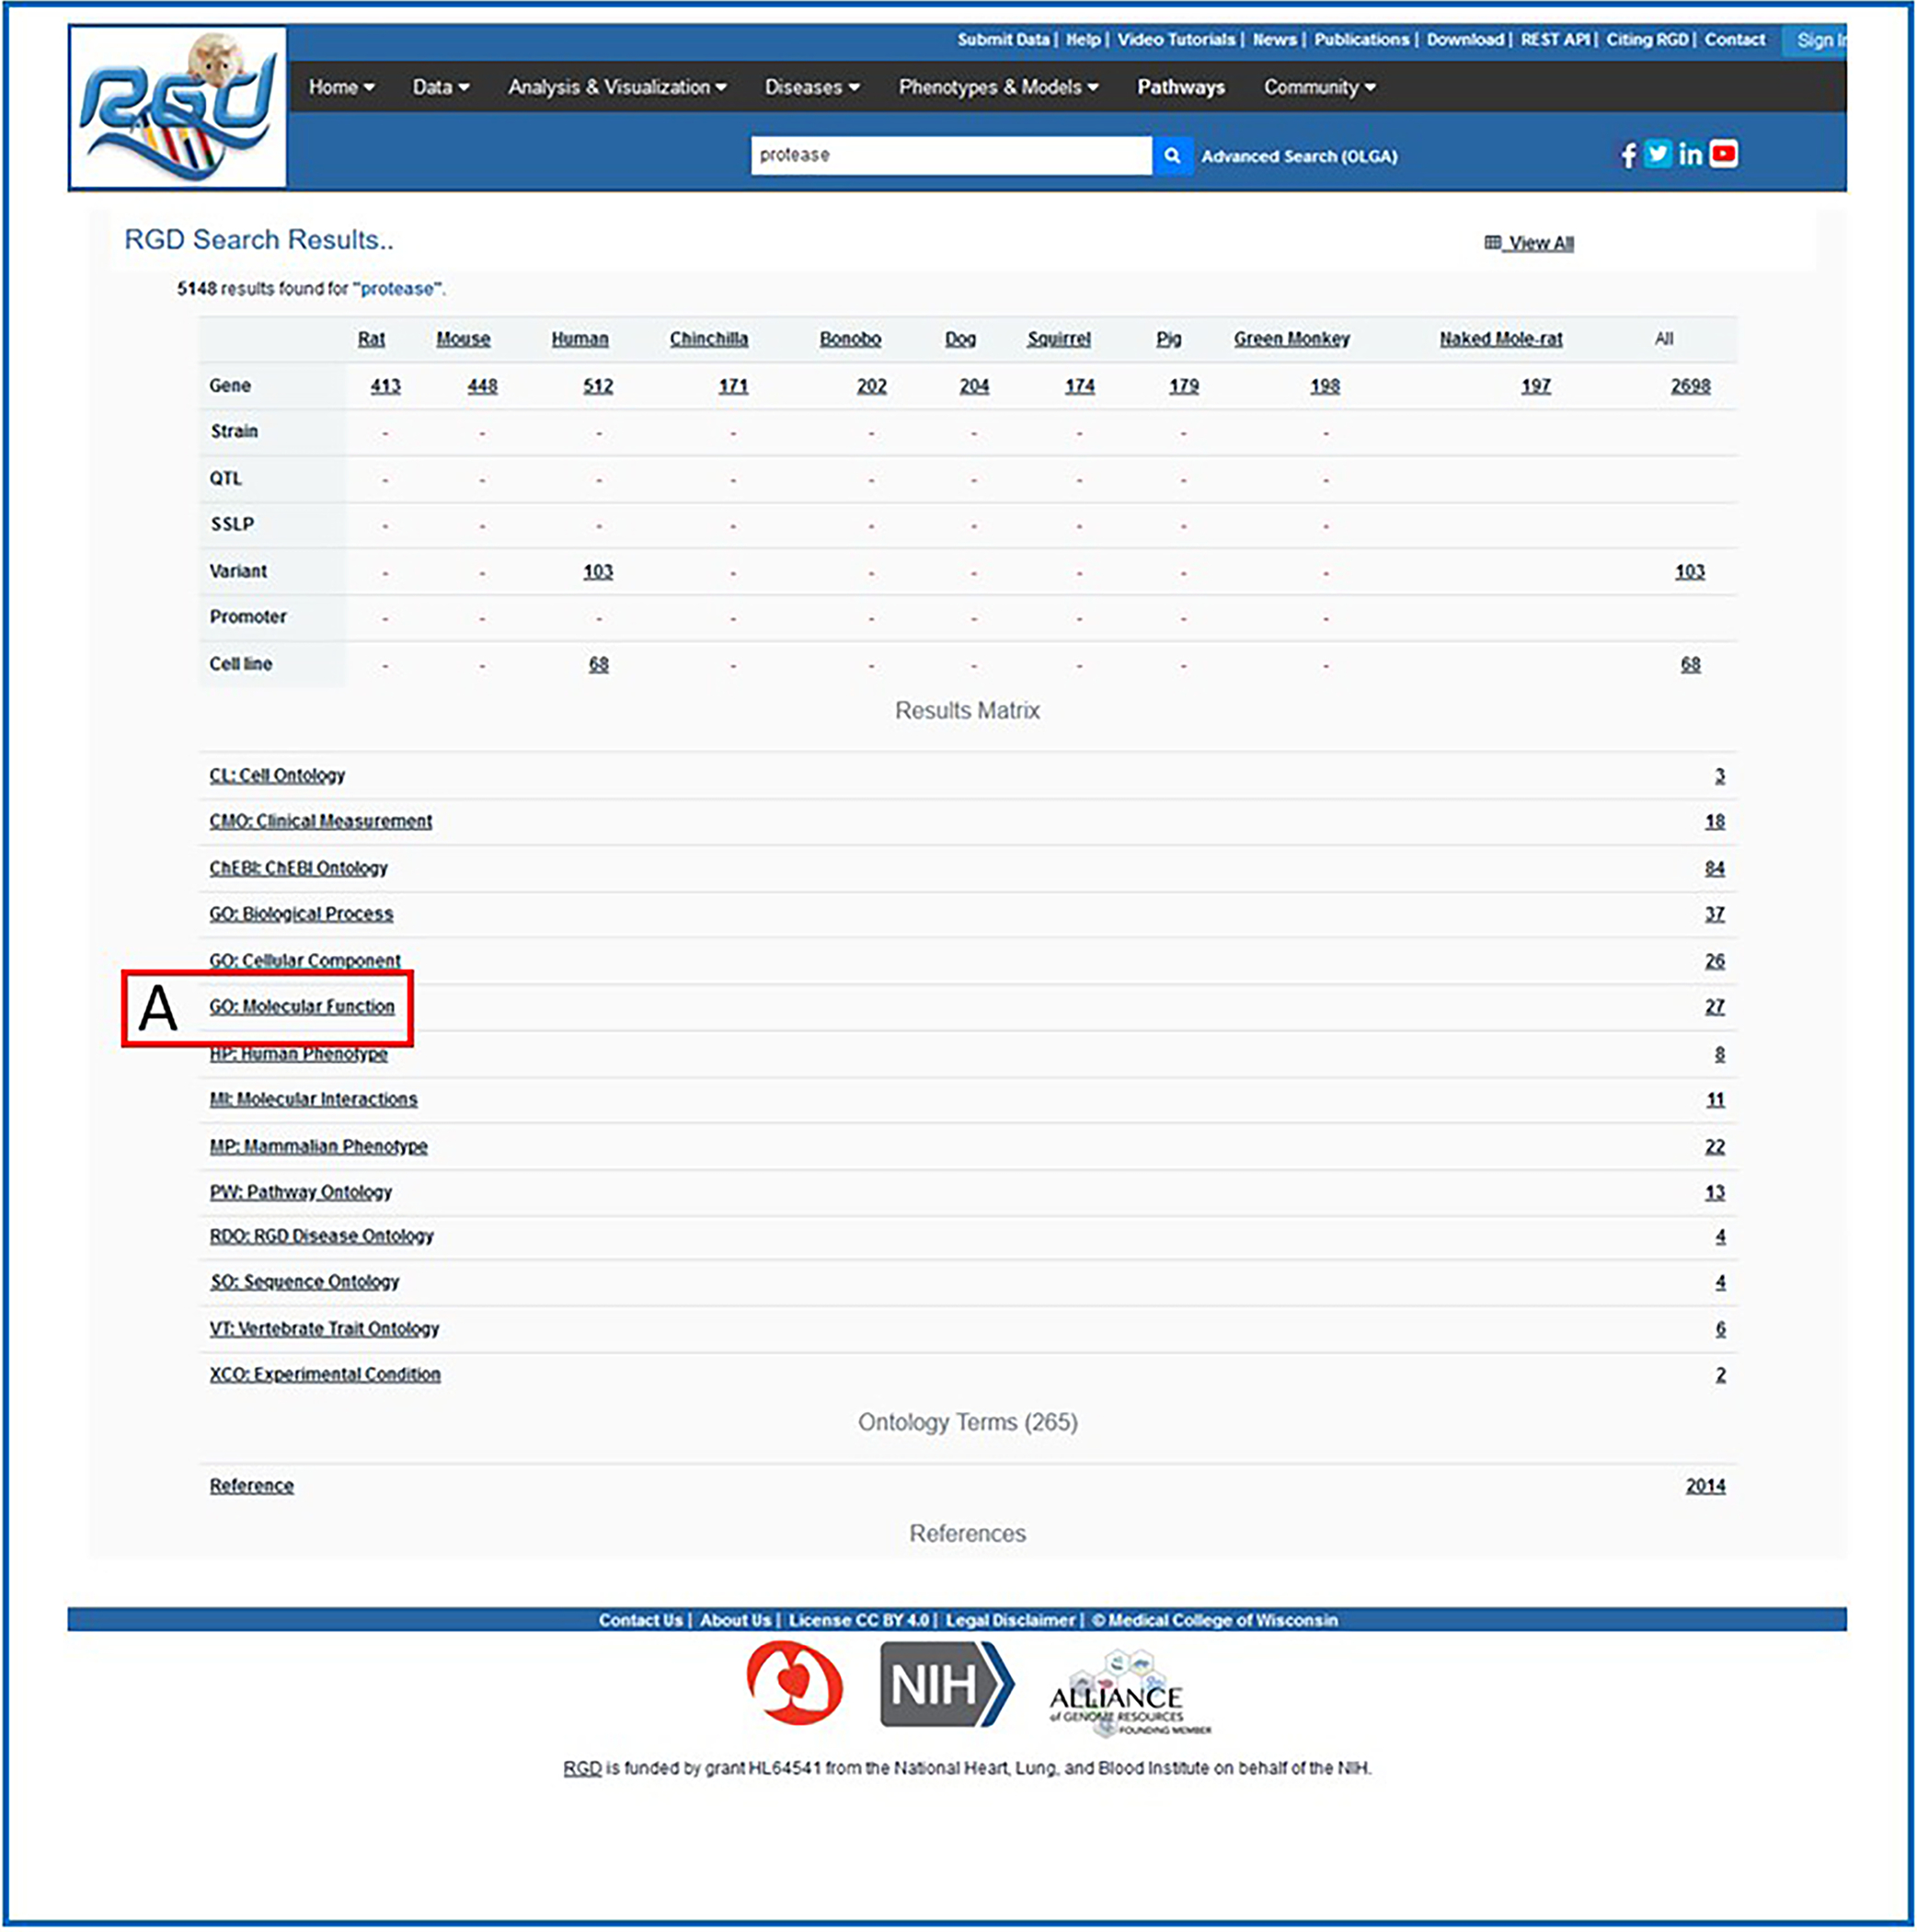
Intermediate search results page. This page shows results grouped by category (ontology category example: A. Gene Ontology) with links to the specific groups of data.
Figure 3.
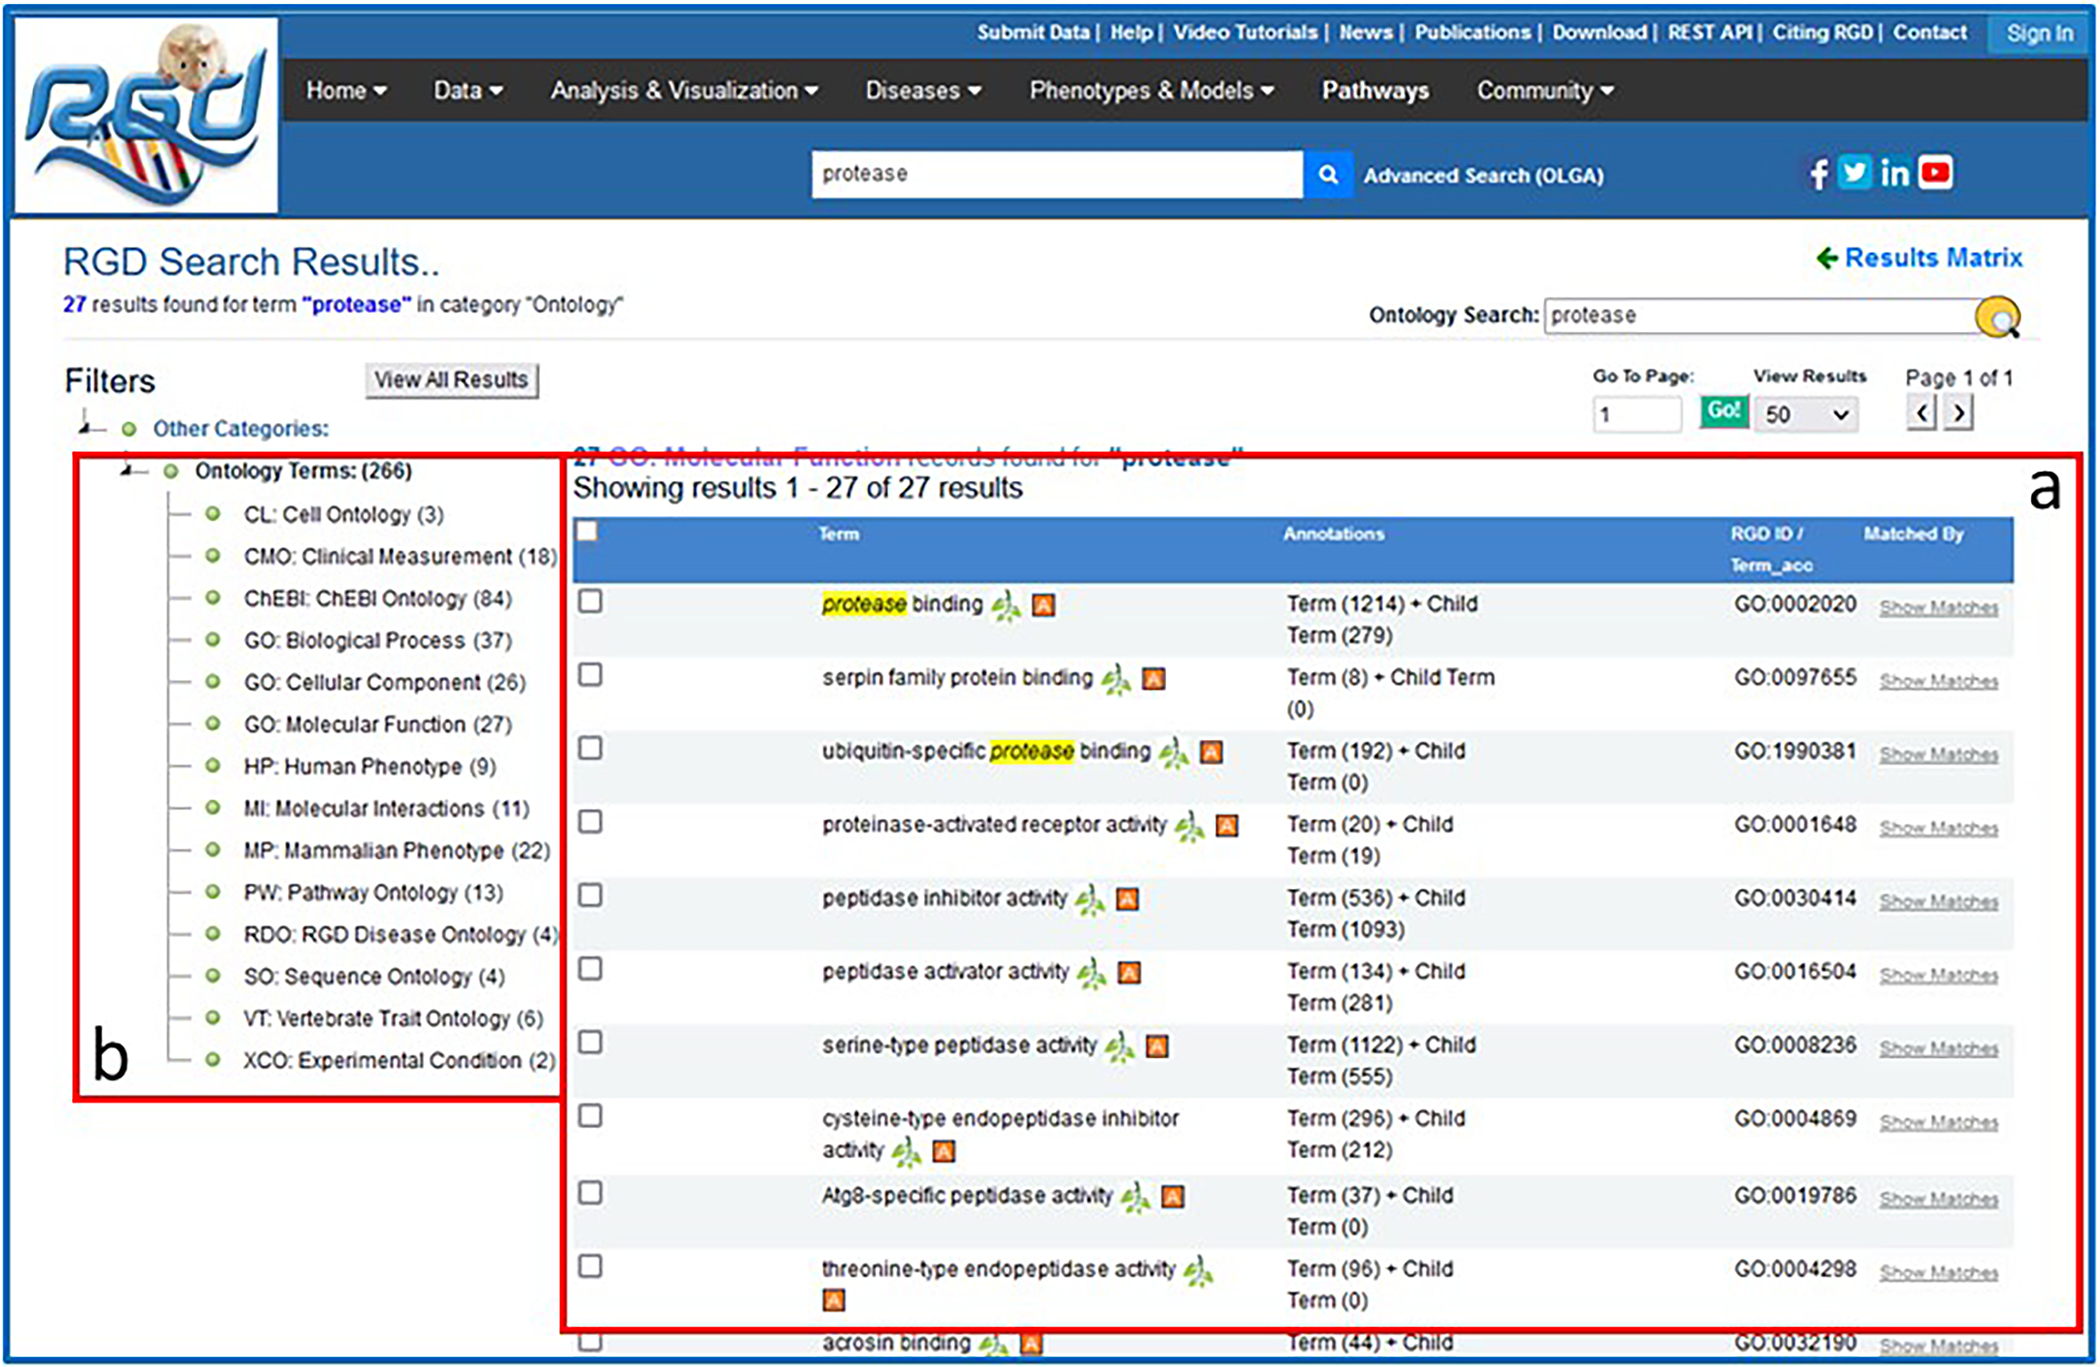
Intermediate search results page. This page provides the ontology results of a general search for “protease”.
Figure 4.

Search results for the Gene Ontology term “protease binding”. This figure tracks the search of “protease binding” through the general search and the RGD term browser to the ontology report page.
Performing an object-specific search
-
3Hover over the “Data” dropdown to the right of the RGD logo of any RGD Web page (seen with white font on a black background in Fig. 1A).The Data dropdown menu has a list of all available data categories.
-
4
Select a data type by clicking the data name. For example, click “Genes”. A new page is returned for gene-specific searches. Enter the gene symbol “lepr” in the Keyword search box on the left side of the page (Fig. 5A–a).
- 5
- 6
Figure 5.
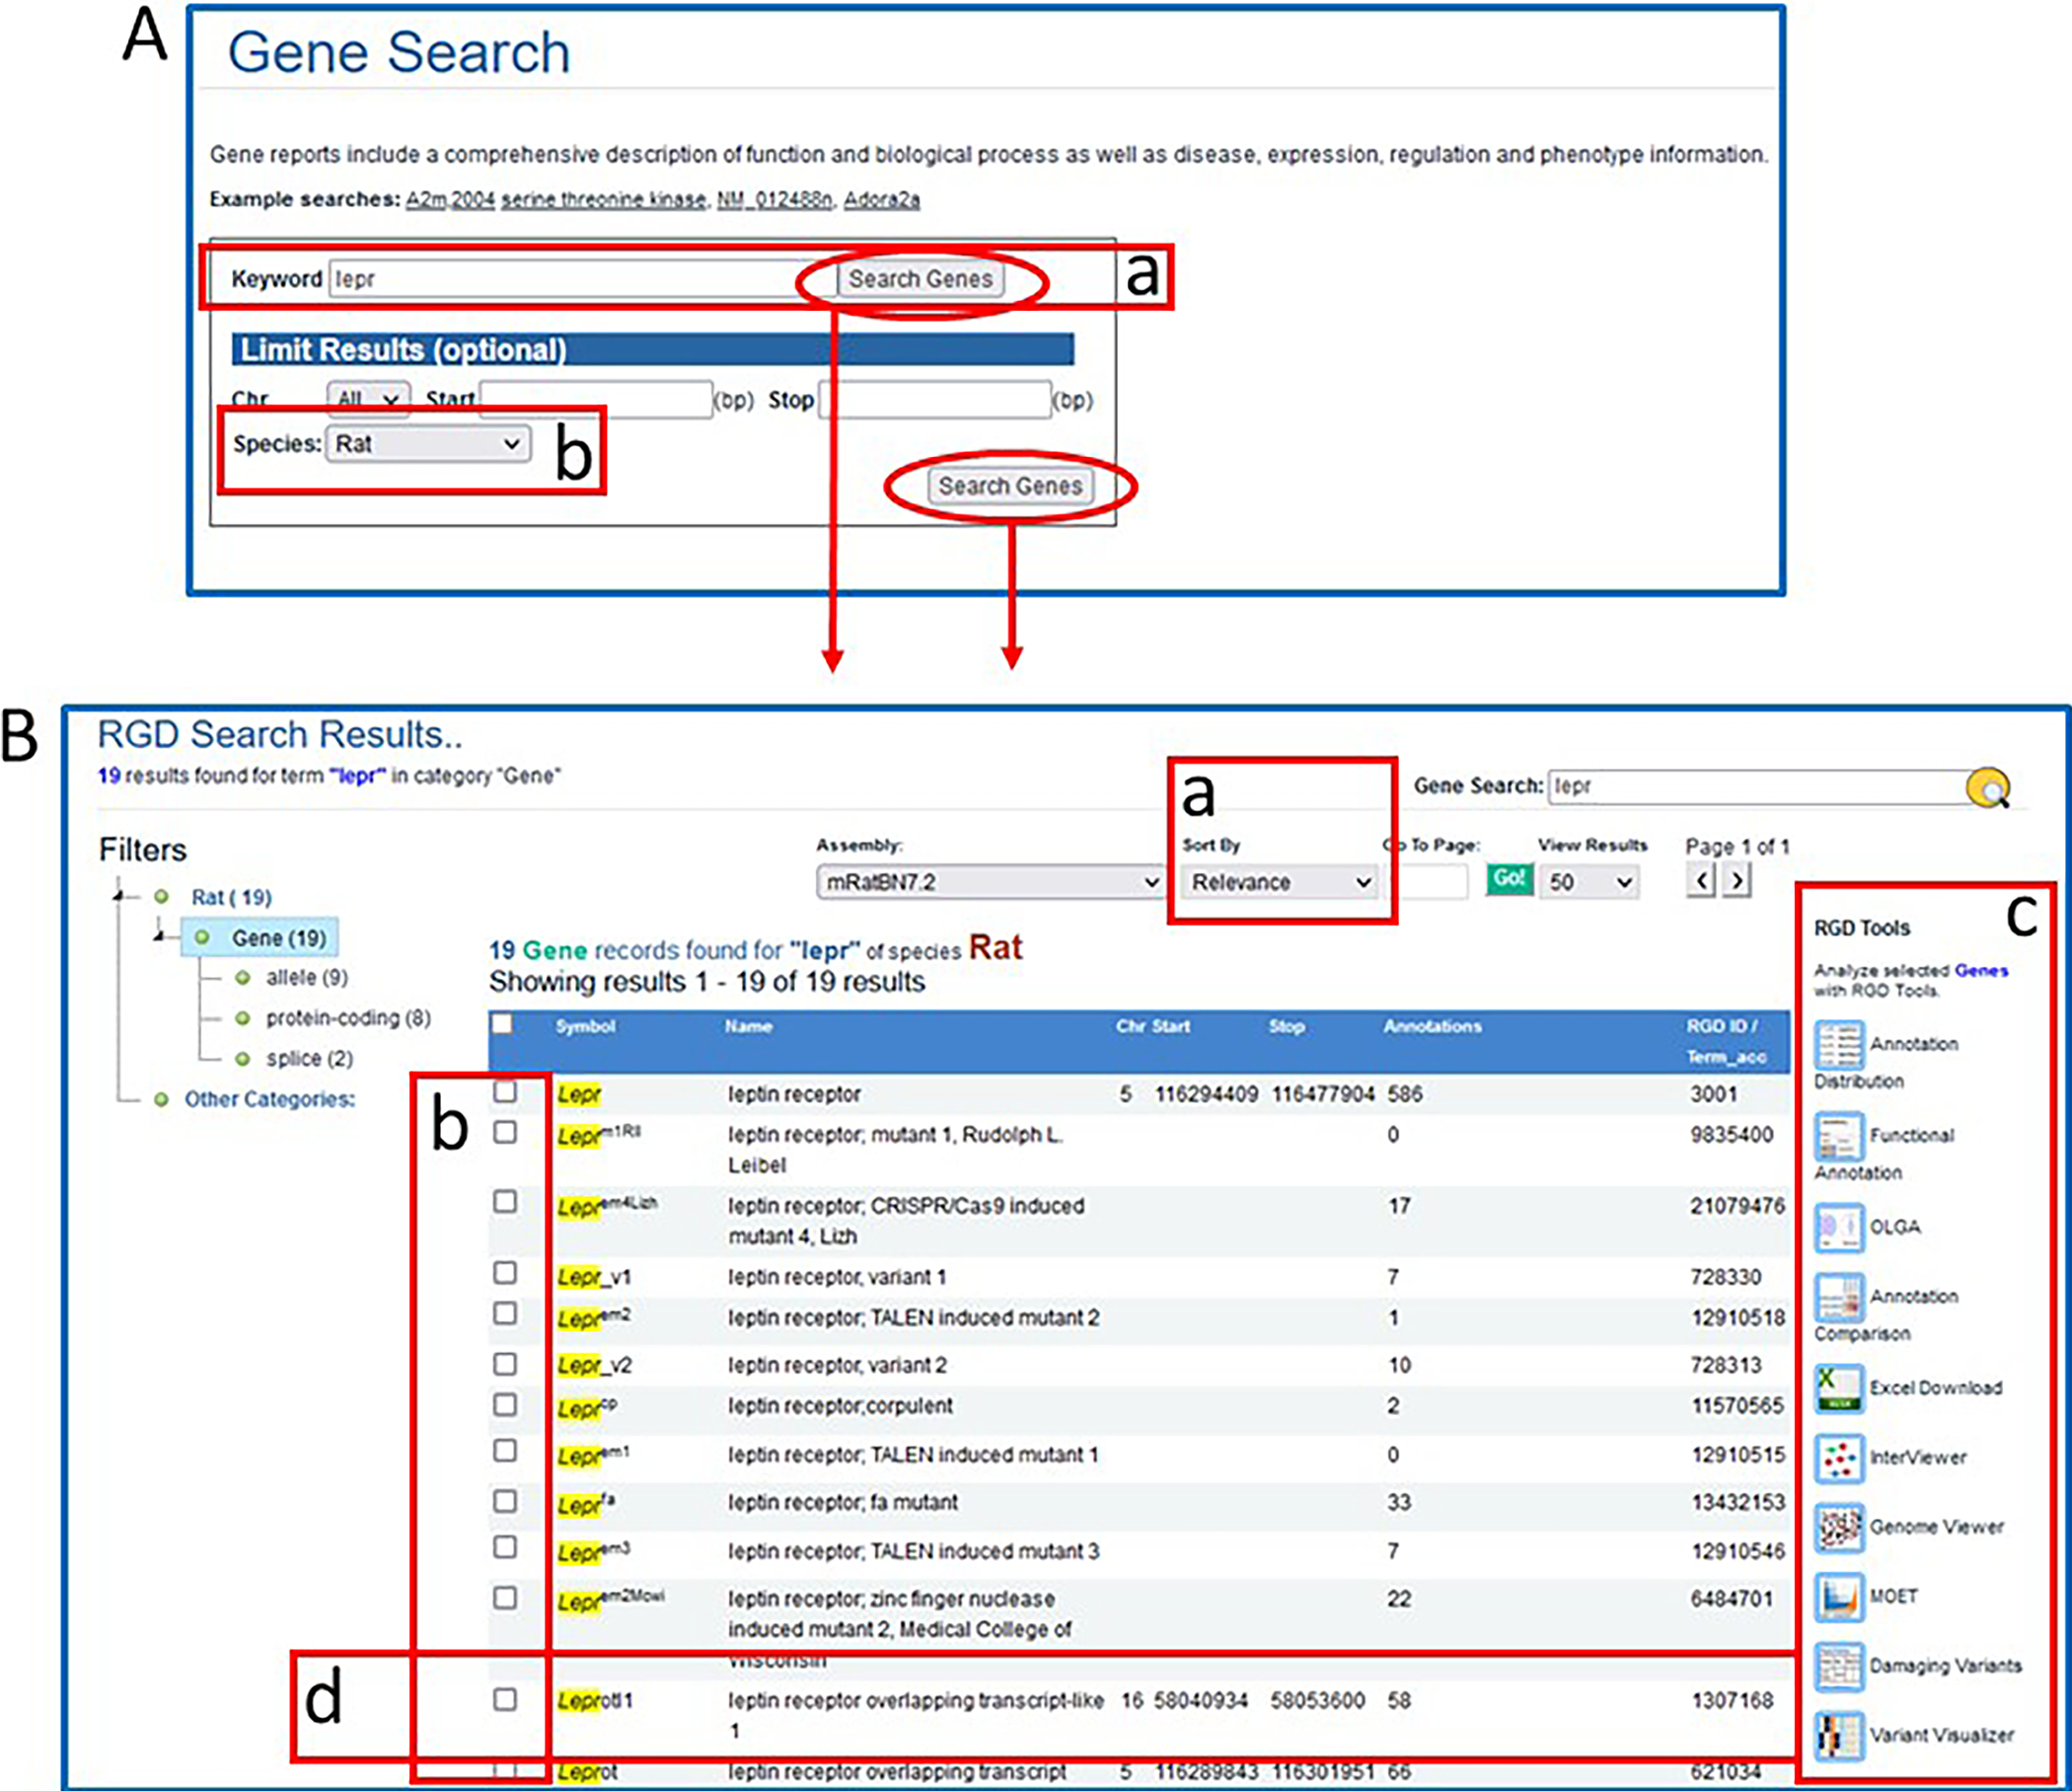
A. Gene Search page. This page provides a gene-specific version of the RGD data search. B. Genes results page. This page displays gene search data for rat with multiple options for viewing and analyzing the results.
Navigating the search results
-
7
The results can be sorted alphabetically or by relevance (Fig 5B–a).
-
8
To send any of the results to an RGD analysis tool or to an Excel file, click one or more selection boxes to the left of any line in the results (Fig. 5B–b) and then click one of the icons on the right of the results list (Fig. 5B–c).
-
9
To display a certain gene report page, click anywhere on the result line (Fig. 5B–d).
Using the ontology search
-
10
Return to the “Data” dropdown to the right of the RGD logo of any RGD Web page as described in step 3.
-
11Click on the Ontologies link in the data dropdown list from the menu bar. Then, click on the ontology dropdown menu (Fig. 6A–a) and select GO: Molecular Function”. Enter the word “peptidase” in the textbox adjacent to the dropdown and click the Search button to the right of the textbox (Fig. 6A–b).This will lead to a results page showing Ontology Terms by ontology with a count of terms which match the query term directly, via definition, or via synonym (Fig. 6B–a) and a list of molecular function terms which at least partially match the query term (Fig. 6B–b). A term marked with an “A” in a red square means that data objects in RGD have been annotated for that term. Additional columns in the table include a count of annotations, to the term and its children, accession ID number of the ontology term, and links to a summary of the matches for the result.
-
12Click on “peptidase activator activity” in the molecular function term list (Fig. 6B–c).An ontology report page (Fig. 7) is returned with a definition of the term, synonyms, and a list of genes annotated to that term and its children. Above the list of genes is the GViewer (Fig. 7A), which illustrates the genomic location of each gene with an idiogram. The species tabs underneath the GViewer allow a separate view of annotated genes from rat, mouse, human, or the seven other species in RGD (Fig. 7B). Above the species tabs is a check box to display genes annotated to the ontology term or both the term and its child terms (default). There are also two drop-down menus for sorting the annotation gene list by any of its columns (Fig. 7c). The Symbols, Evidence, Source, Reference IDs, and JBrowse links in the gene list are all hyperlinked to relevant information at RGD and at external databases (Fig. 7D).
-
13Scroll down to the bottom of the page to see text (Fig. 8A) and graph representations (Fig. 8B) of the branch of the ontology where the term “peptidase activator activity” resides. Click on the branch icon (Fig. 8C) next to the annotation count for “peptidase activator activity” to access the main RGD ontology term browser (Fig. 9).The term “peptidase activator activity” is highlighted in yellow in the center column, listed with its siblings, while its child terms are in a column to the right and its parent terms are in a column to the left.
-
14Click on “peptidase activator activity involved in apoptotic process” (Fig. 9A–a).When any term is clicked, it gets highlighted and shown in the center column with its sibling terms, and the other columns refresh to show parent terms in the left column and children terms in the right column. This allows horizontal navigation of the ontology in both directions, with three levels of terms always visible. An “A” icon to the right of a term signifies that annotations for that term exist in RGD.
-
15Click on the red square “A” icon adjacent to “peptidase activator activity involved in apoptotic process” (Fig. 9B–a), now in the “Term With Siblings” (center) column.The returned page is the ontology report page for “peptidase activator activity involved in apoptotic process”, which has annotations that represent a subset of those on the page for the parent term “peptidase activator activity” (step 13) (Fig. 7).
Figure 6.
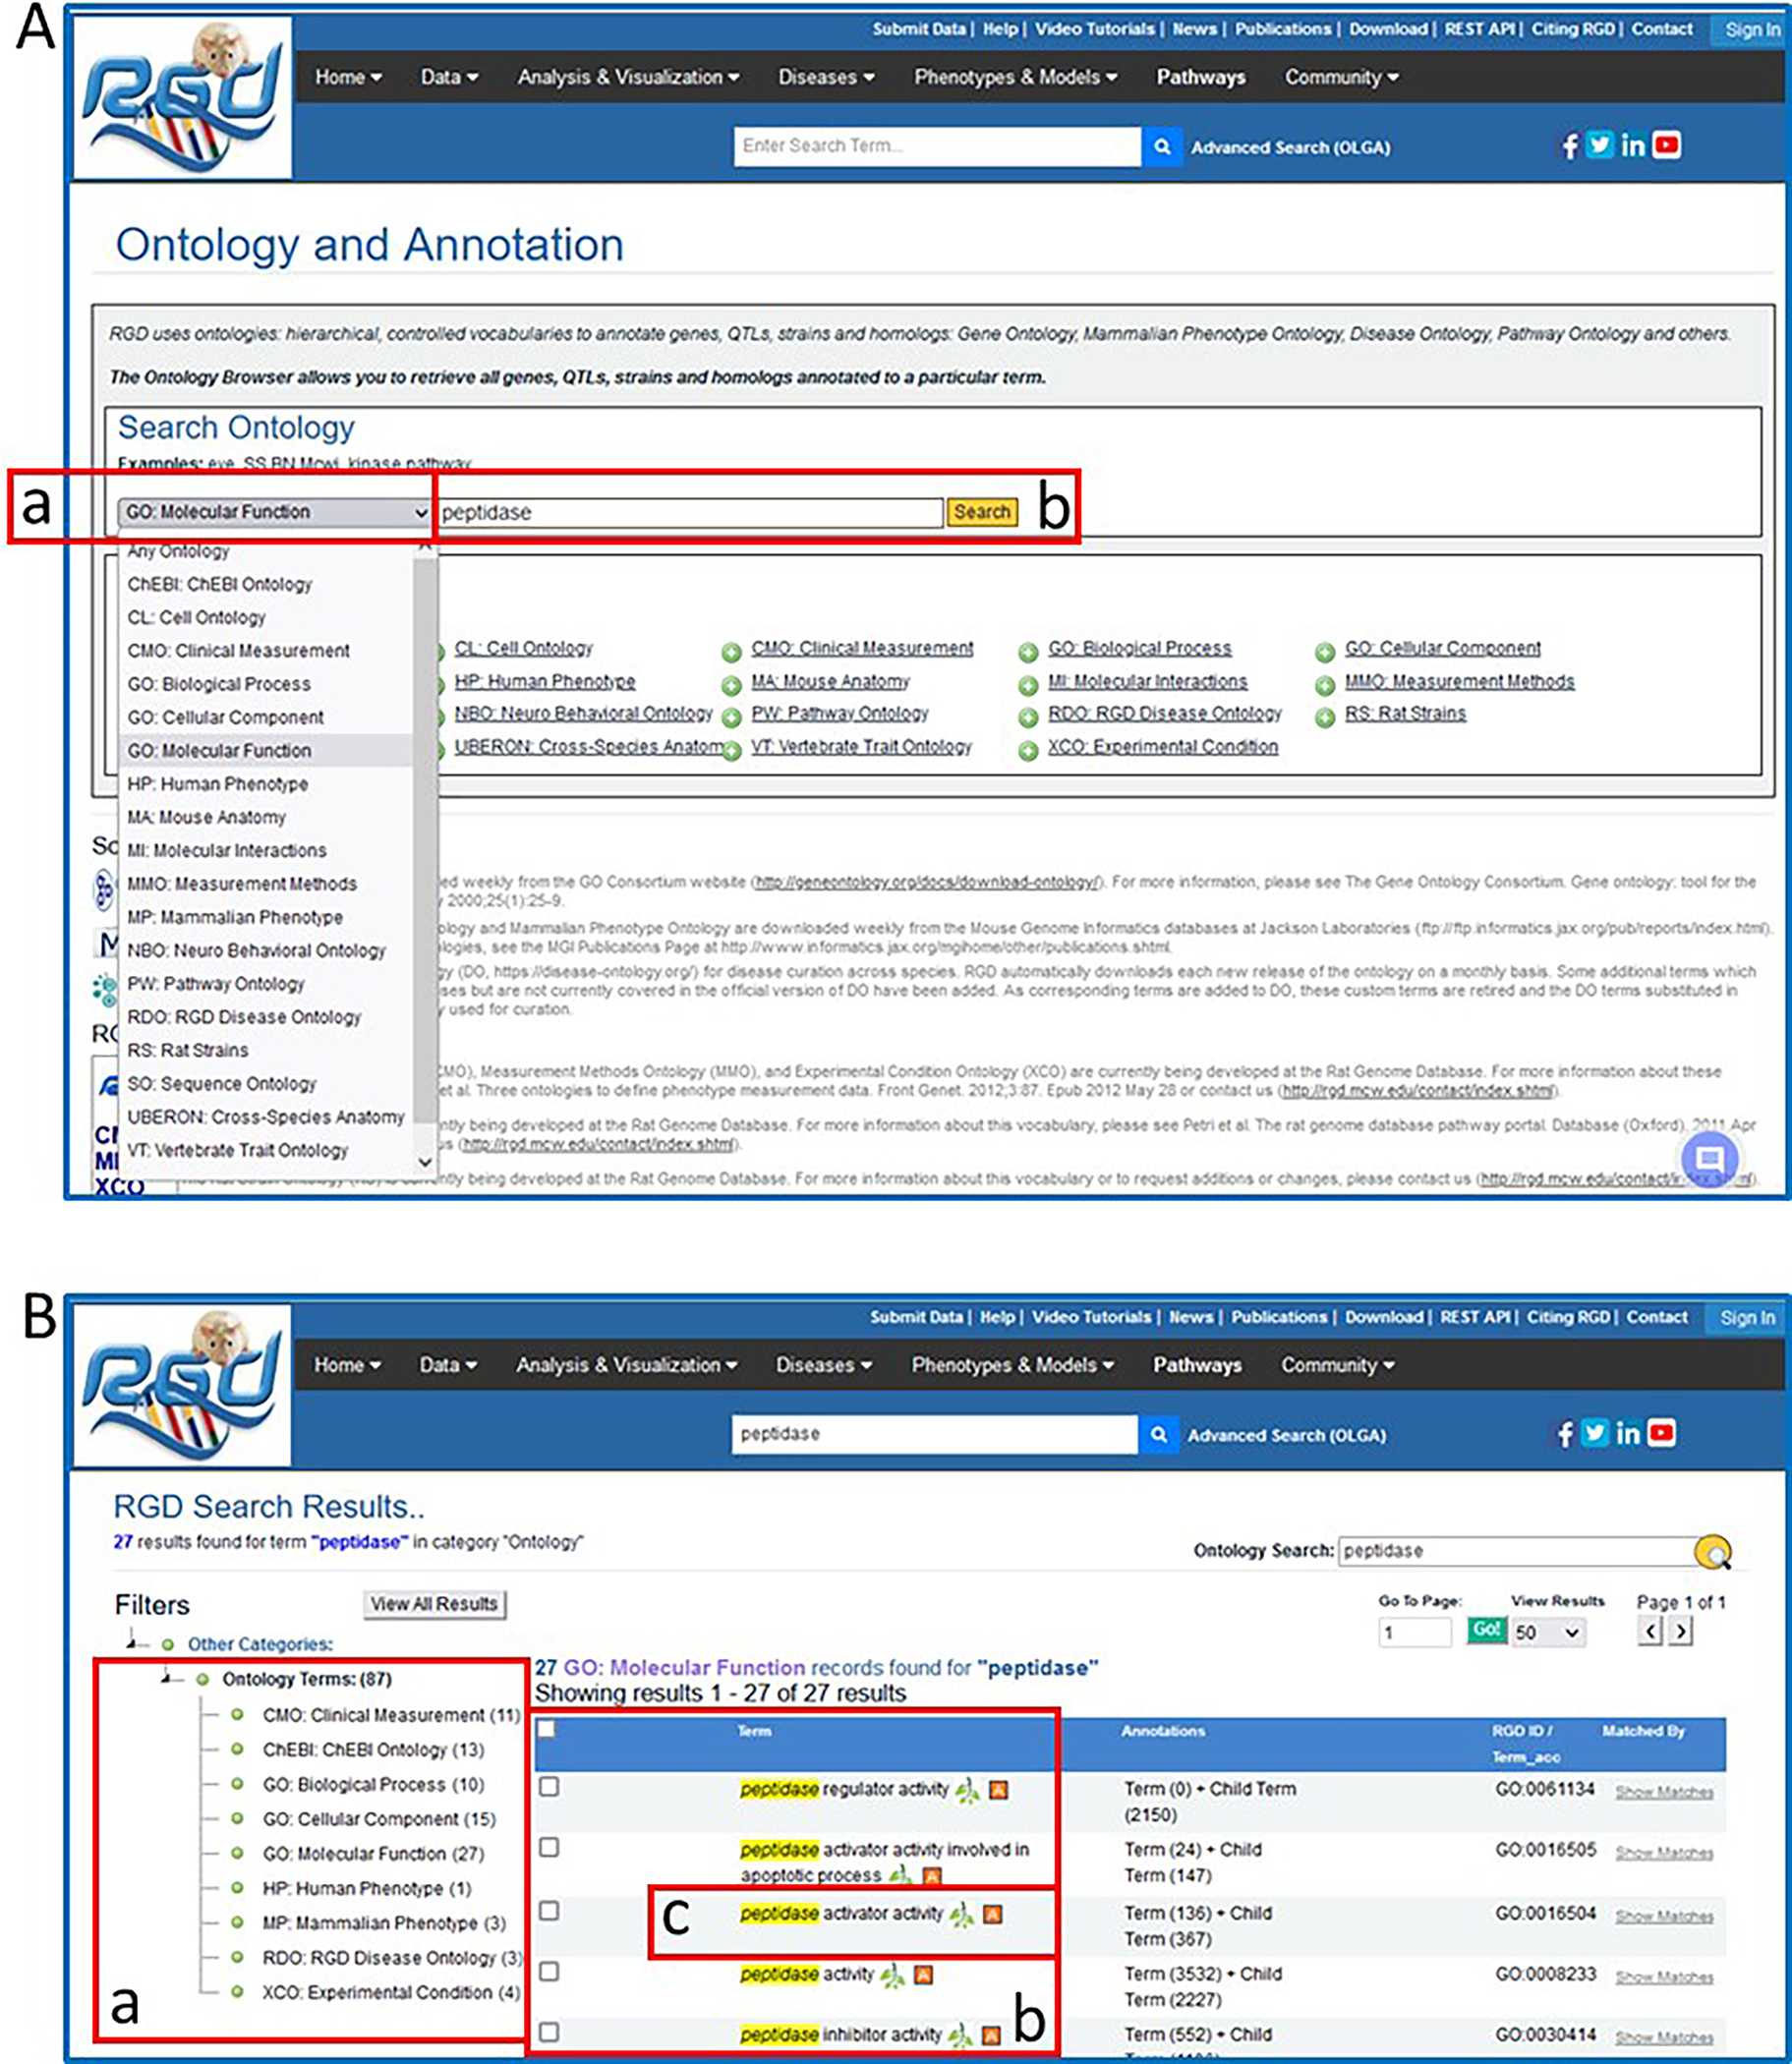
Ontology general search results for the word “protease”. These pages highlight the narrowing of the search results down to a single Gene Ontology-Molecular Function term.
Figure 7.
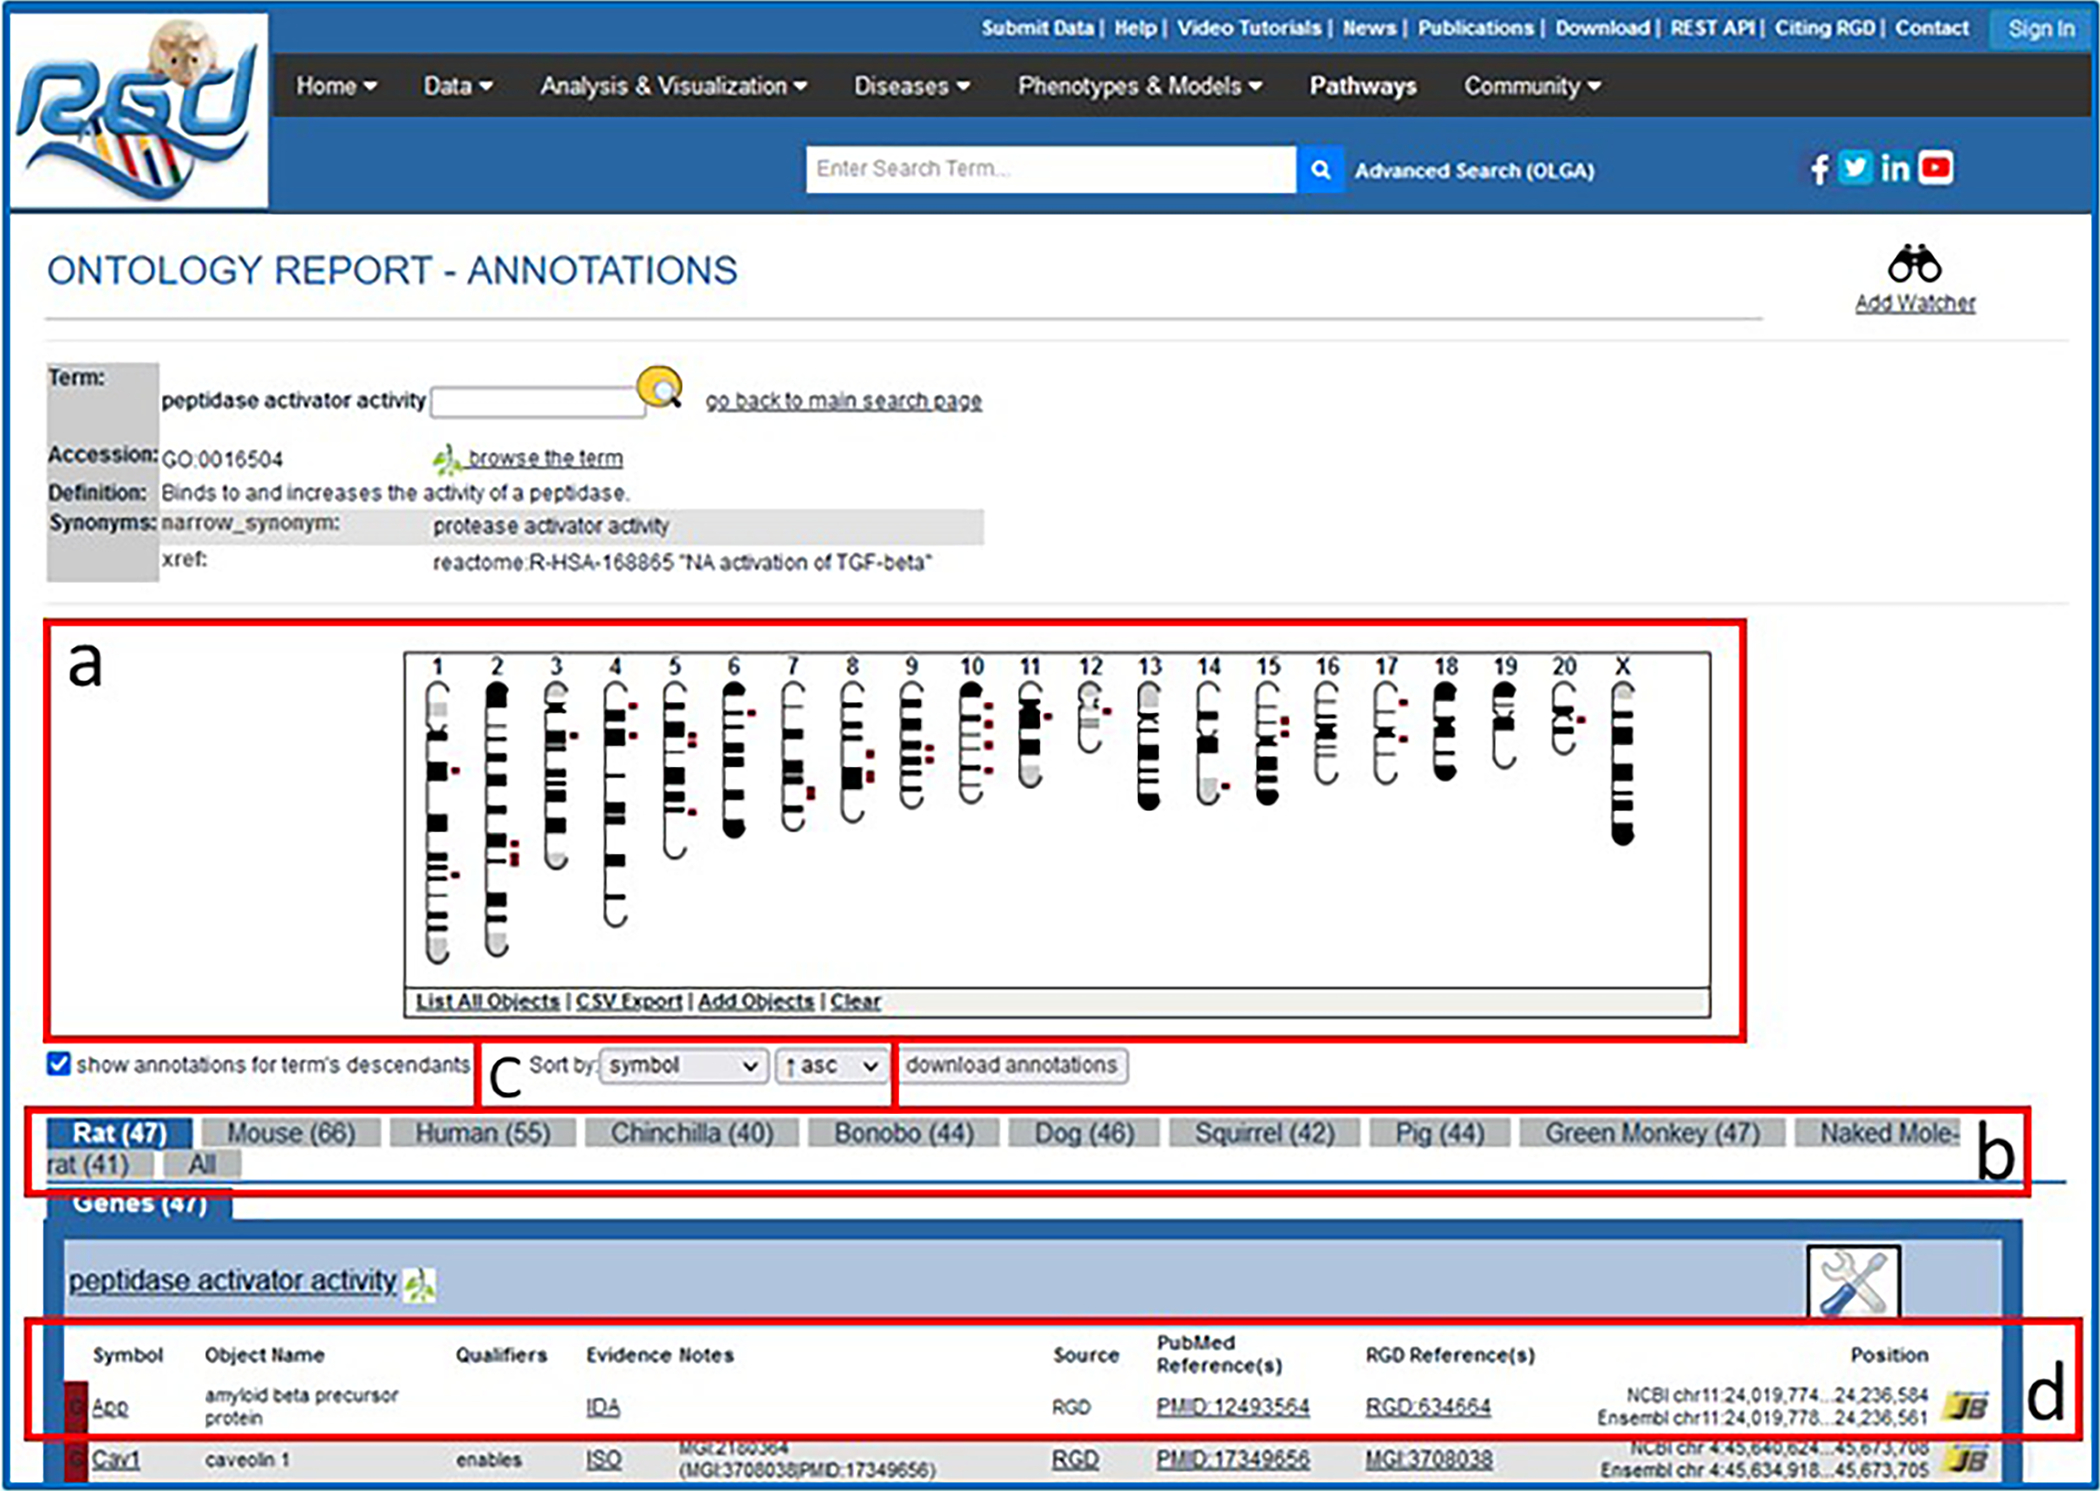
Ontology report page. This page defines the selected ontology term, lists all RGD objects annotated with that term and its children, and displays the genomic location of annotated genes, QTLs, and congenic strains.
Figure 8.
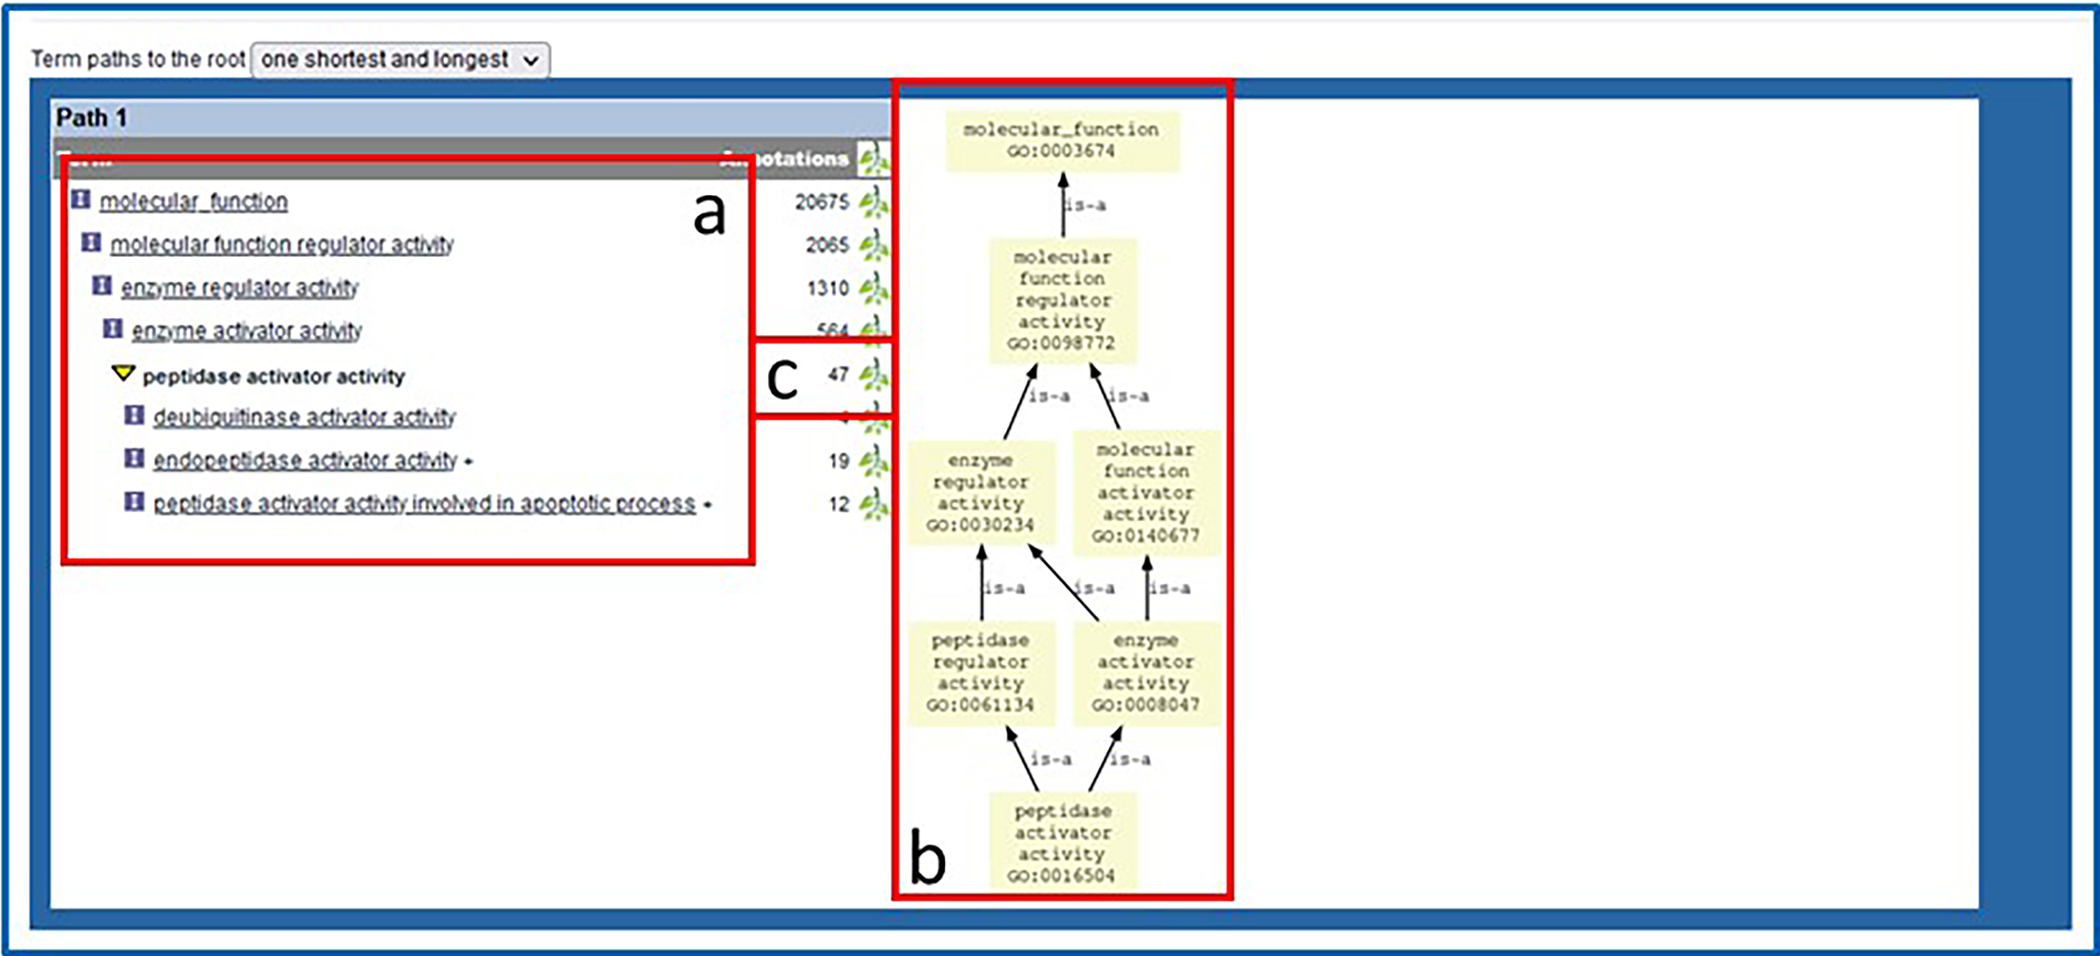
Bottom of ontology report page. Underneath the annotated object list are text and graph representations of the ontology branch(es) containing the selected term.
Figure 9.
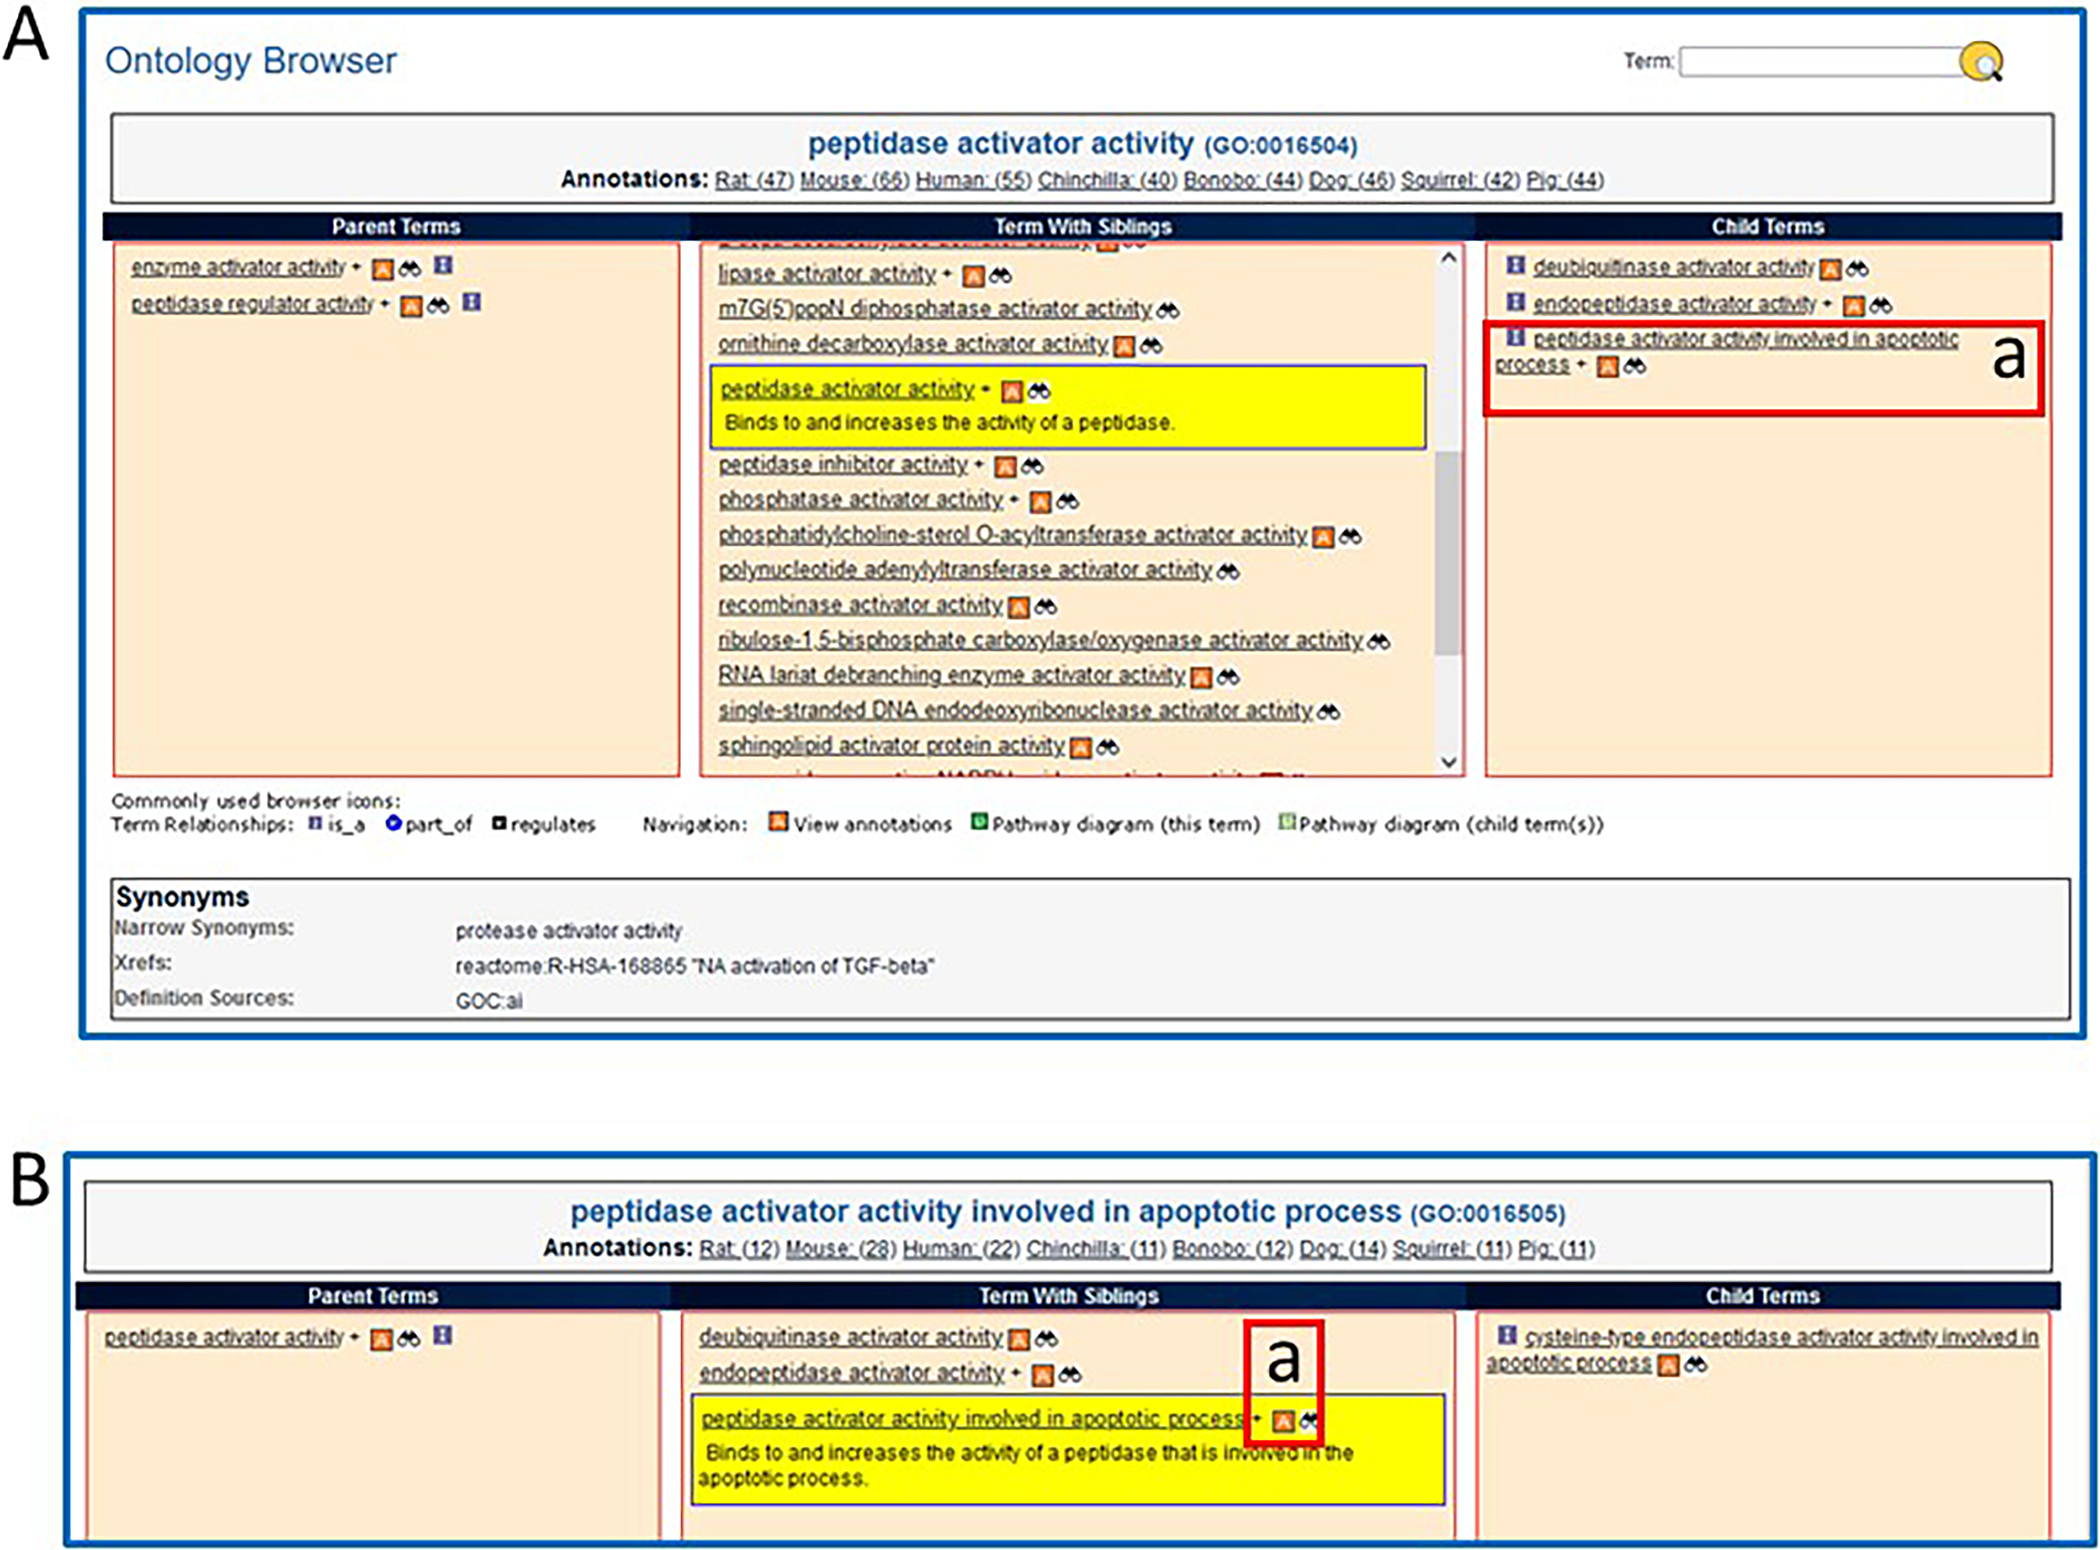
The RGD ontology browser. Any of the ontologies/vocabularies used at RGD can be displayed in this horizontally oriented term browser.
Visualizing search results using GViewer
The GViewer tool provides a graphic representation of the genomic locations of all genes, QTLs, and congenic strains that are annotated to an ontology term or terms. The GViewer tool is visible on all the ontology report pages (see Fig. 7A).
-
16On either the ontology report page (Fig. 7, upper left) or the ontology browser homepage (Fig. 6A–a), enter “hypertension” in the ontology text search box. Click the magnifying glass icon to the right of the search box or press Enter on your keyboard. This will return an ontology results list on which you should click “RDO: RGD Disease Ontology,” and then click “hypertension” in the returned term results list.The GViewer image shows all the chromosomes that have a gene (brown), QTL (blue), or congenic strain (green) annotated to the term hypertension and its children terms (Fig. 10A).
-
17Click on the center of chromosome 11 to view a more detailed image in a zoom pane (Fig. 10B). Scroll the zoom pane by dragging the highlighted (gray) slider on the chromosome or by using the zoom pane’s horizontal scroll bar to see all the targeted genes and QTLs on chromosome 11 in more detail. Click the chromosome a second time to lock the slider (now red). Click “send to JBrowse” (Fig. 10B–a) to see a JBrowse model of the genes from the zoom pane (Fig. 10C) (see Basic Protocol 4).
-
18
Click on the gene symbol “Drd3” in the zoom pane (Fig. 10B–c) to go to the gene report, which opens in a new window (Fig. 11).
Figure 10.
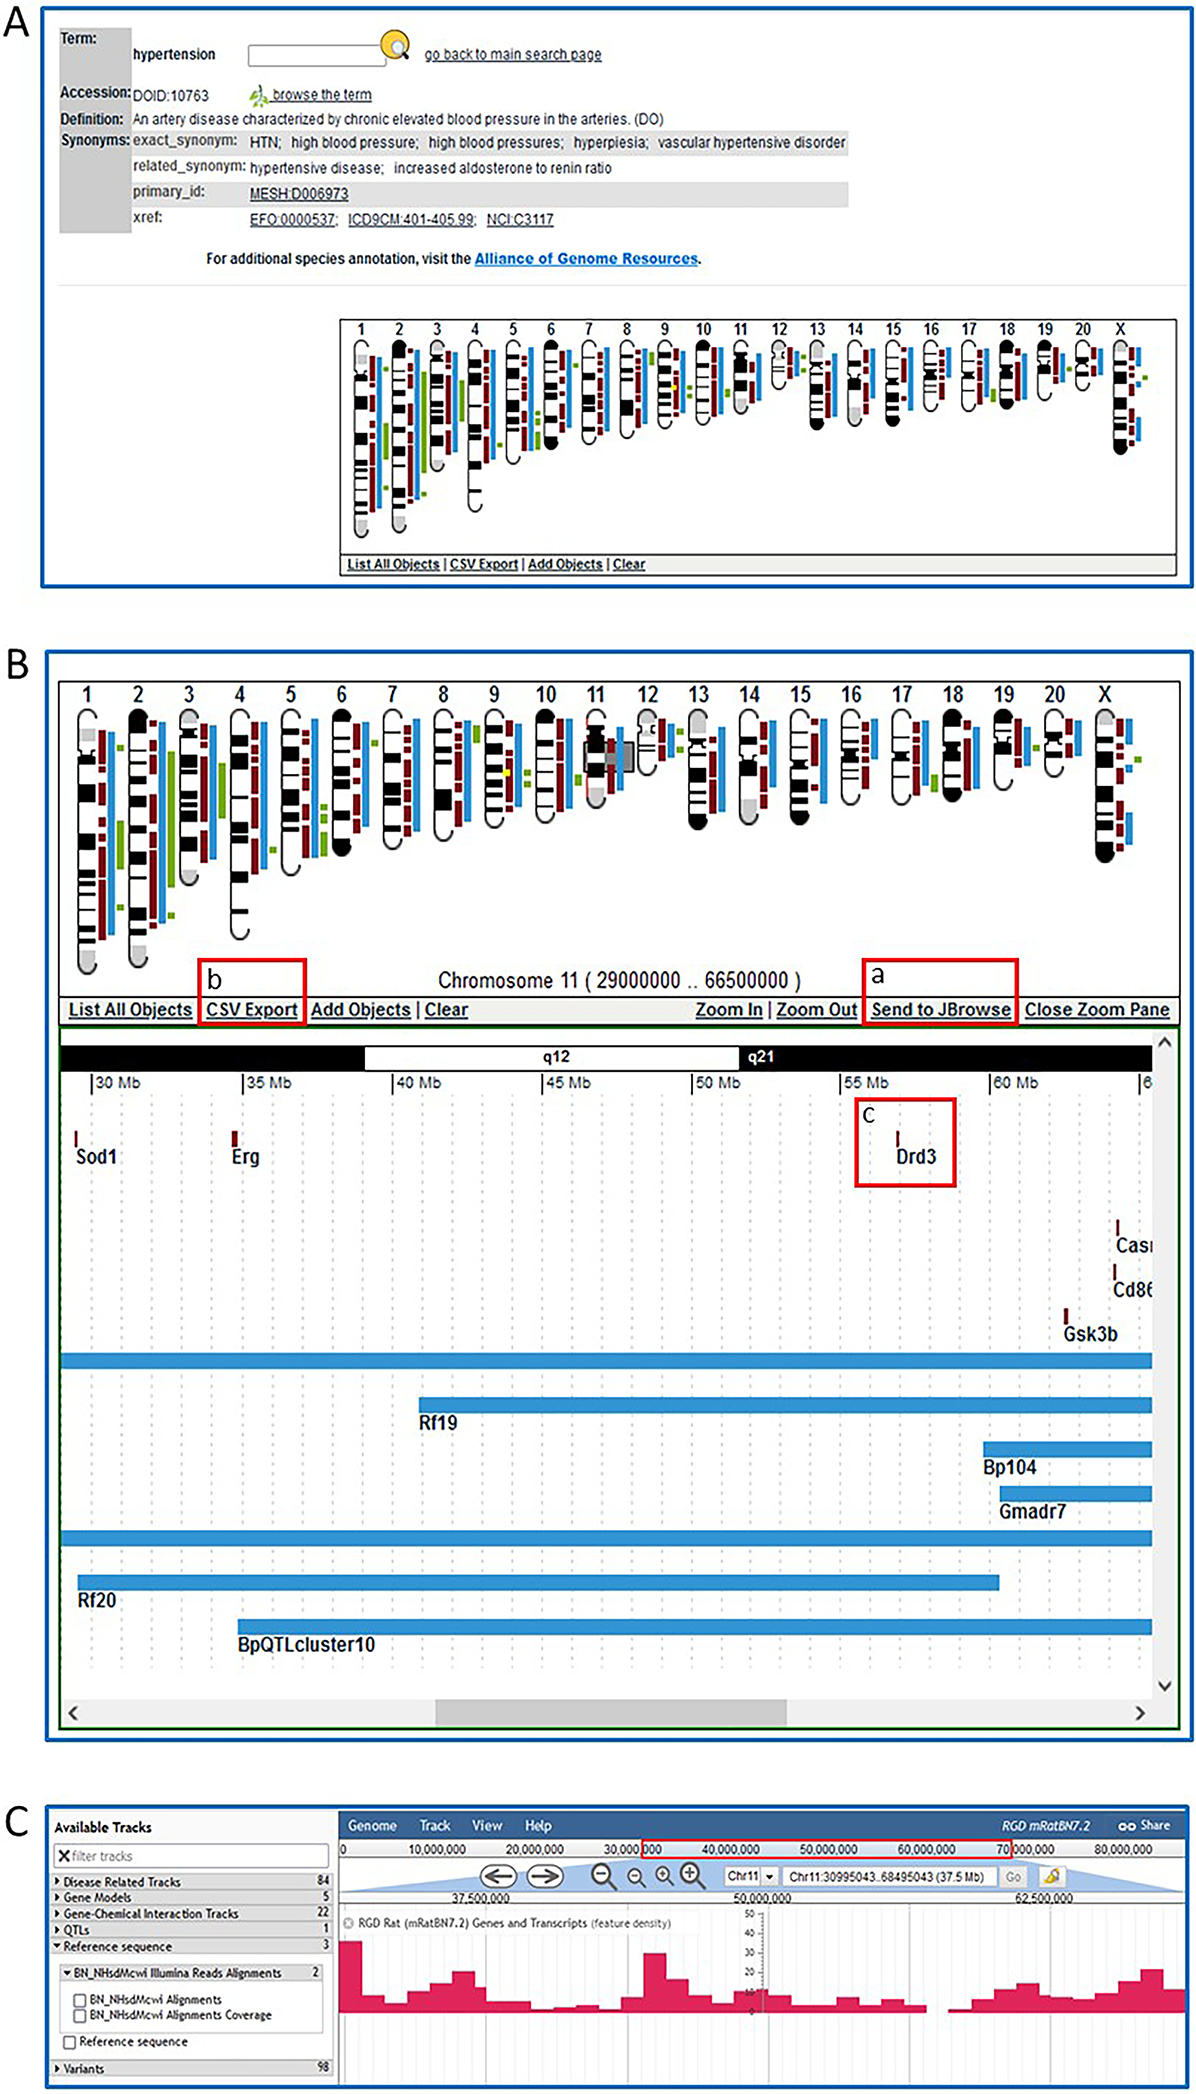
The GViewer. All genes, QTLs, and congenic strains annotated to the selected term and its descendants are shown at the appropriate chromosomal location.
Figure 11.
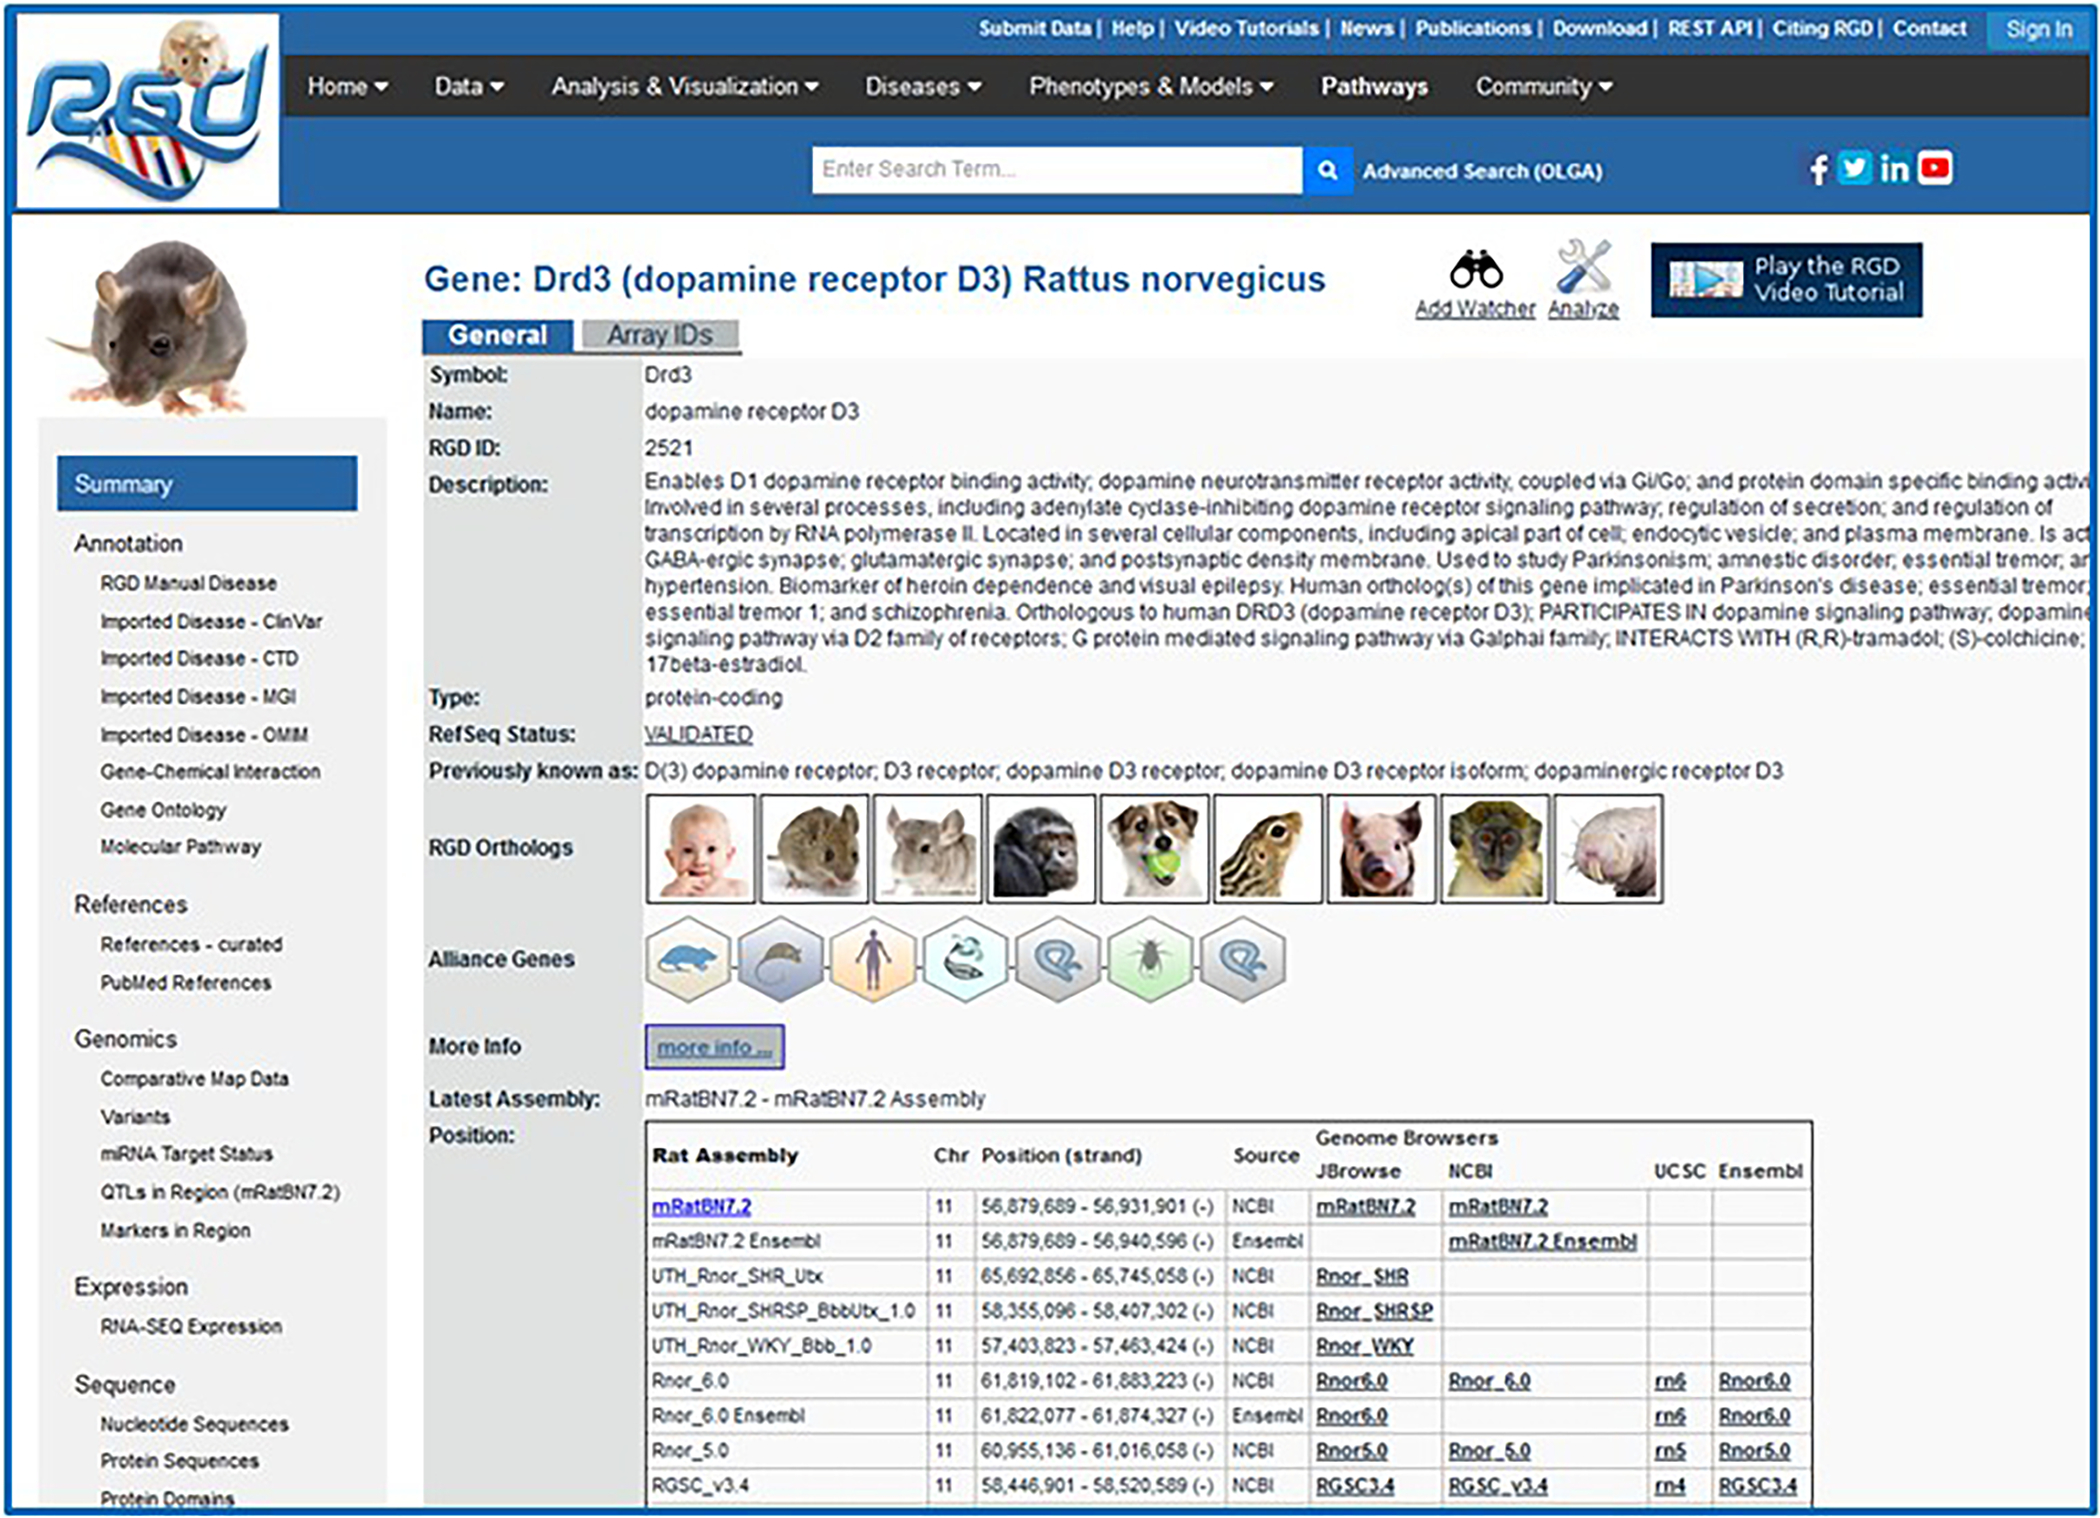
The RGD gene report page for Drd3. The summary/general section has a textual description of the gene, shows orthologs, has links to Alliance of Genome Resources gene pages, and genomic position information. Links on the left side lead to the Annotation, References, Genomics, and other sections of the page.
BASIC PROTOCOL 3
SEARCHING FOR QUANTITATIVE TRAIT LOCI
As mentioned earlier, RGD contains data related to various types of biological “objects” such as genes, strains, and Quantitative Trait Loci (QTLs). The complete list of data objects is accessible via the Data dropdown list on the menu bar at the top of most pages on the RGD Web site. Basic Protocol 2 describes how to search the database for any object using keywords and ontology terms. RGD also provides object-specific queries focused on a particular type of data (e.g., QTLs). As an example of these types of object-specific queries, this protocol illustrates how to search for QTLs related to blood pressure phenotypes.
While a QTL query or report page differs in some respects, such as search options or data available, from the corresponding pages for other types of data, there are substantial similarities. RGD report pages contain many of the same elements regardless of the data type. These include official nomenclature for the object, annotations in the form of both ontology terms and free-text notes, and links to related information in other databases. In addition, reports for genomic and genetic data types include information on mapping and a link to various genome browsers to permit viewing of the object in its genomic context. Many of these elements are reciprocally linked to information of other data types. A link on a QTL report page, for instance, will lead to a gene report page which will, in turn, link back to the QTL. Each of these characteristics is reviewed in this protocol.
Necessary Resources
Hardware
Computer with functioning Internet connection
Software
Web browser (Microsoft Edge, Mozilla Firefox, Google Chrome, or Apple Safari)
Protocol steps with step annotations
Navigate to the object-specific query page
-
1From the RGD home page (https://rgd.mcw.edu), or any internal page, scroll over “Data” in the top menu bar to get to a listing of the various types of biological data stored in RGD. Click “QTLs” to open the QTL query page.Using the RGD Specific Query pages allows the user to enter query criteria specific for a particular data object. These other query pages can be reached by selecting the appropriate data object from the menu bar.
-
2In the Keyword search box in the left center of the page, type “blood pressure” (Fig. 12A–a). Change the chromosome selection from “All” to “8” in the Chr (chromosome) dropdown menu (Fig. 12A–b). Click on the Search QTLs button to run the search.When using the Start and Stop parameters for chromosomal position, the positions given must be positions from the reference genome assembly for the selected species (rat, mouse, or human). In the case of rat, the current reference assembly is mRatBN7.2. The addition of new data often shifts the absolute base-pair positions of genes and markers slightly from one assembly to the next, which is why it is important that the positions match the underlying assembly if they are to be accurate.
-
3Examine the QTL results page (Fig. 12B).The QTL search results page contains a list of all the rat QTLs in RGD that match the search criteria (in this case,18 hits). Mouse and human QTLs for the same search may be found by selecting the appropriate species on the Species dropdown on the QTL search page (Fig. 12A). For each QTL, the list gives the official symbol and name, chromosome, the start and stop base-pair positions, number of ontology annotations associated with the QTL, strains crossed, and RGD ID (Fig. 12B).
Figure 12.
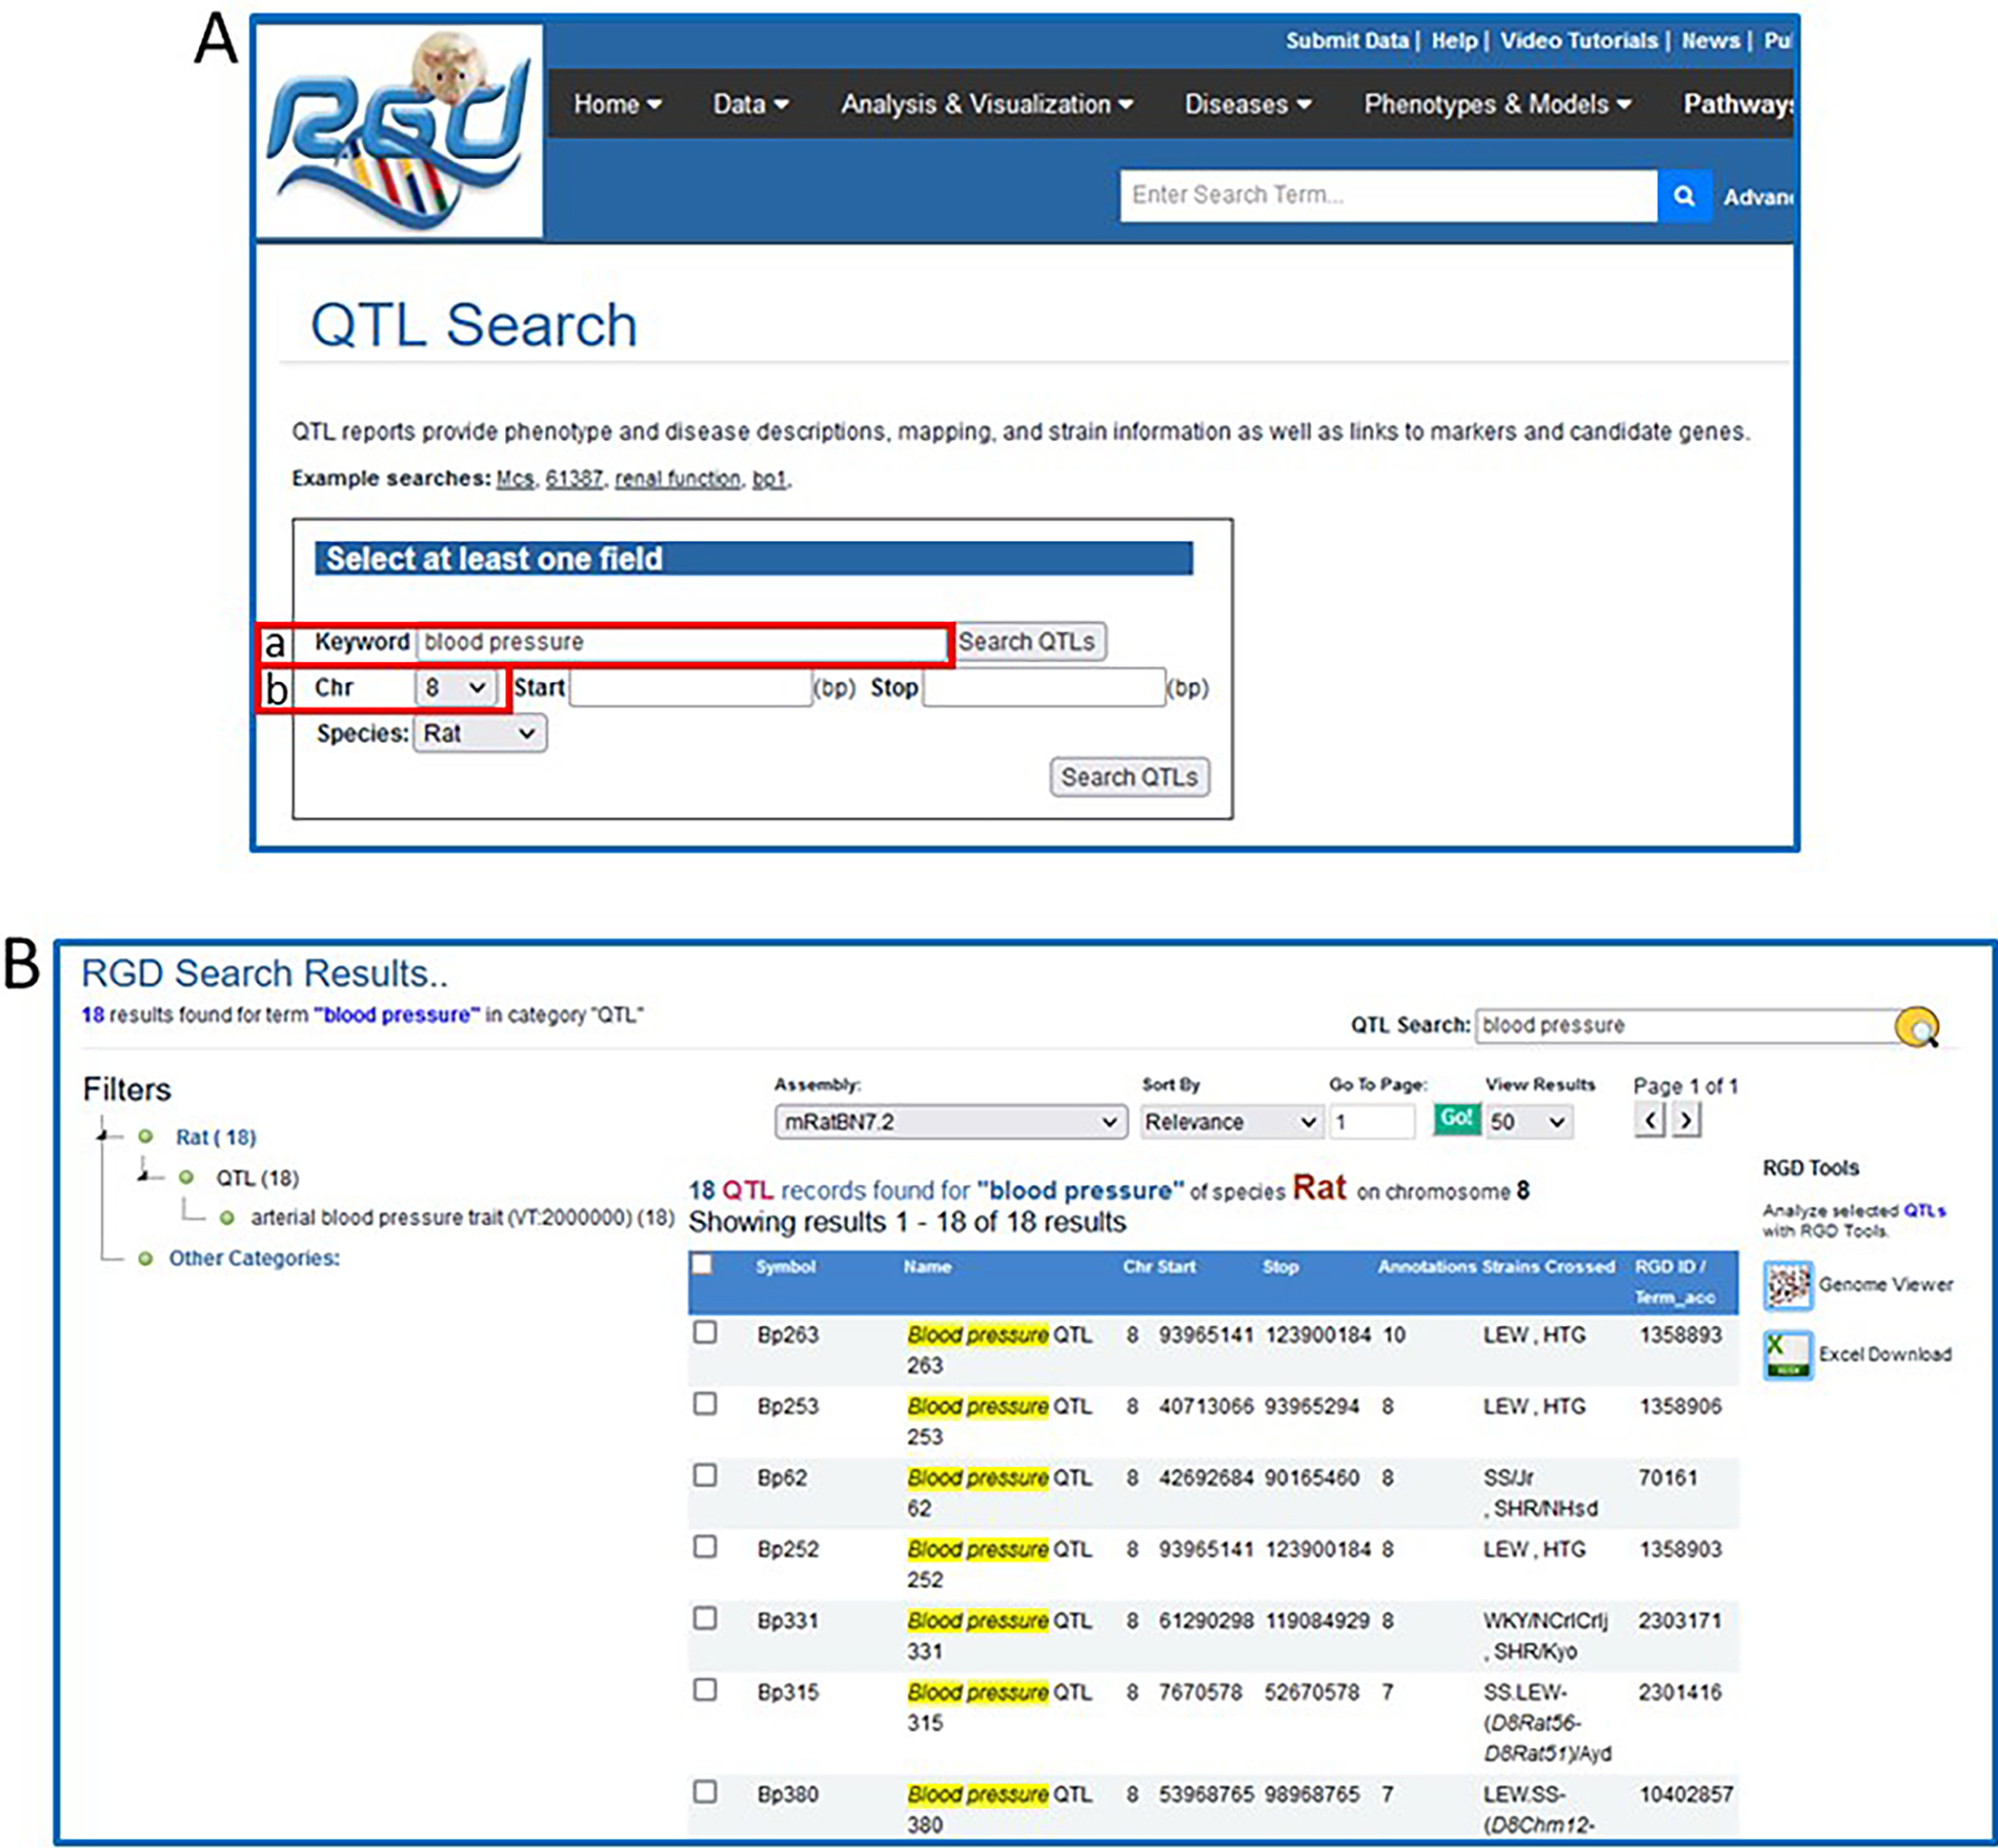
A. The QTL-specific search. This page uses a keyword search with optional restrictions to narrow the search. B. QTL search results for “blood pressure” on rat chromosome 8.
Select a query result to view the corresponding report page
-
4Click on the symbol for Bp263, at the top of the results list, to go to the RGD report page for that QTL (Fig. 13).RGD report pages are divided into sections depending on the type of data being displayed. The QTL report page has sections for general information, annotations, references, genomic region, and additional information (Fig. 13-a), all linked from the navigation list on the left side of the page. Note, however, that not all QTL report pages will have all the possible subsections in each section.
-
5The names of the strains used in the linkage analysis (“Strains Crossed” in the summary/general section at the top of the page) provide links to the strain report pages. Click on HTG (Fig. 13-b) to access the report page for that rat strain.The strain pages contain extensive information on characteristics such as derivation and disease associations, as well as links to related strains and associated ontology terms to aid in data mining.
-
6Return to the QTL report page. Click the term “hypertension” (Fig. 14A–a) in the RGD Manual Disease Annotations subsection to go to the details page for that annotation (Fig. 14B).Each annotation report page provides information on evidence code, a link to the reference from which the annotation was made, the number of RGD objects annotated to the ontology term, a link to the ontology term report page (Fig. 14B–a), and the number of references in RGD curated for the object of that annotation.
Figure 13.
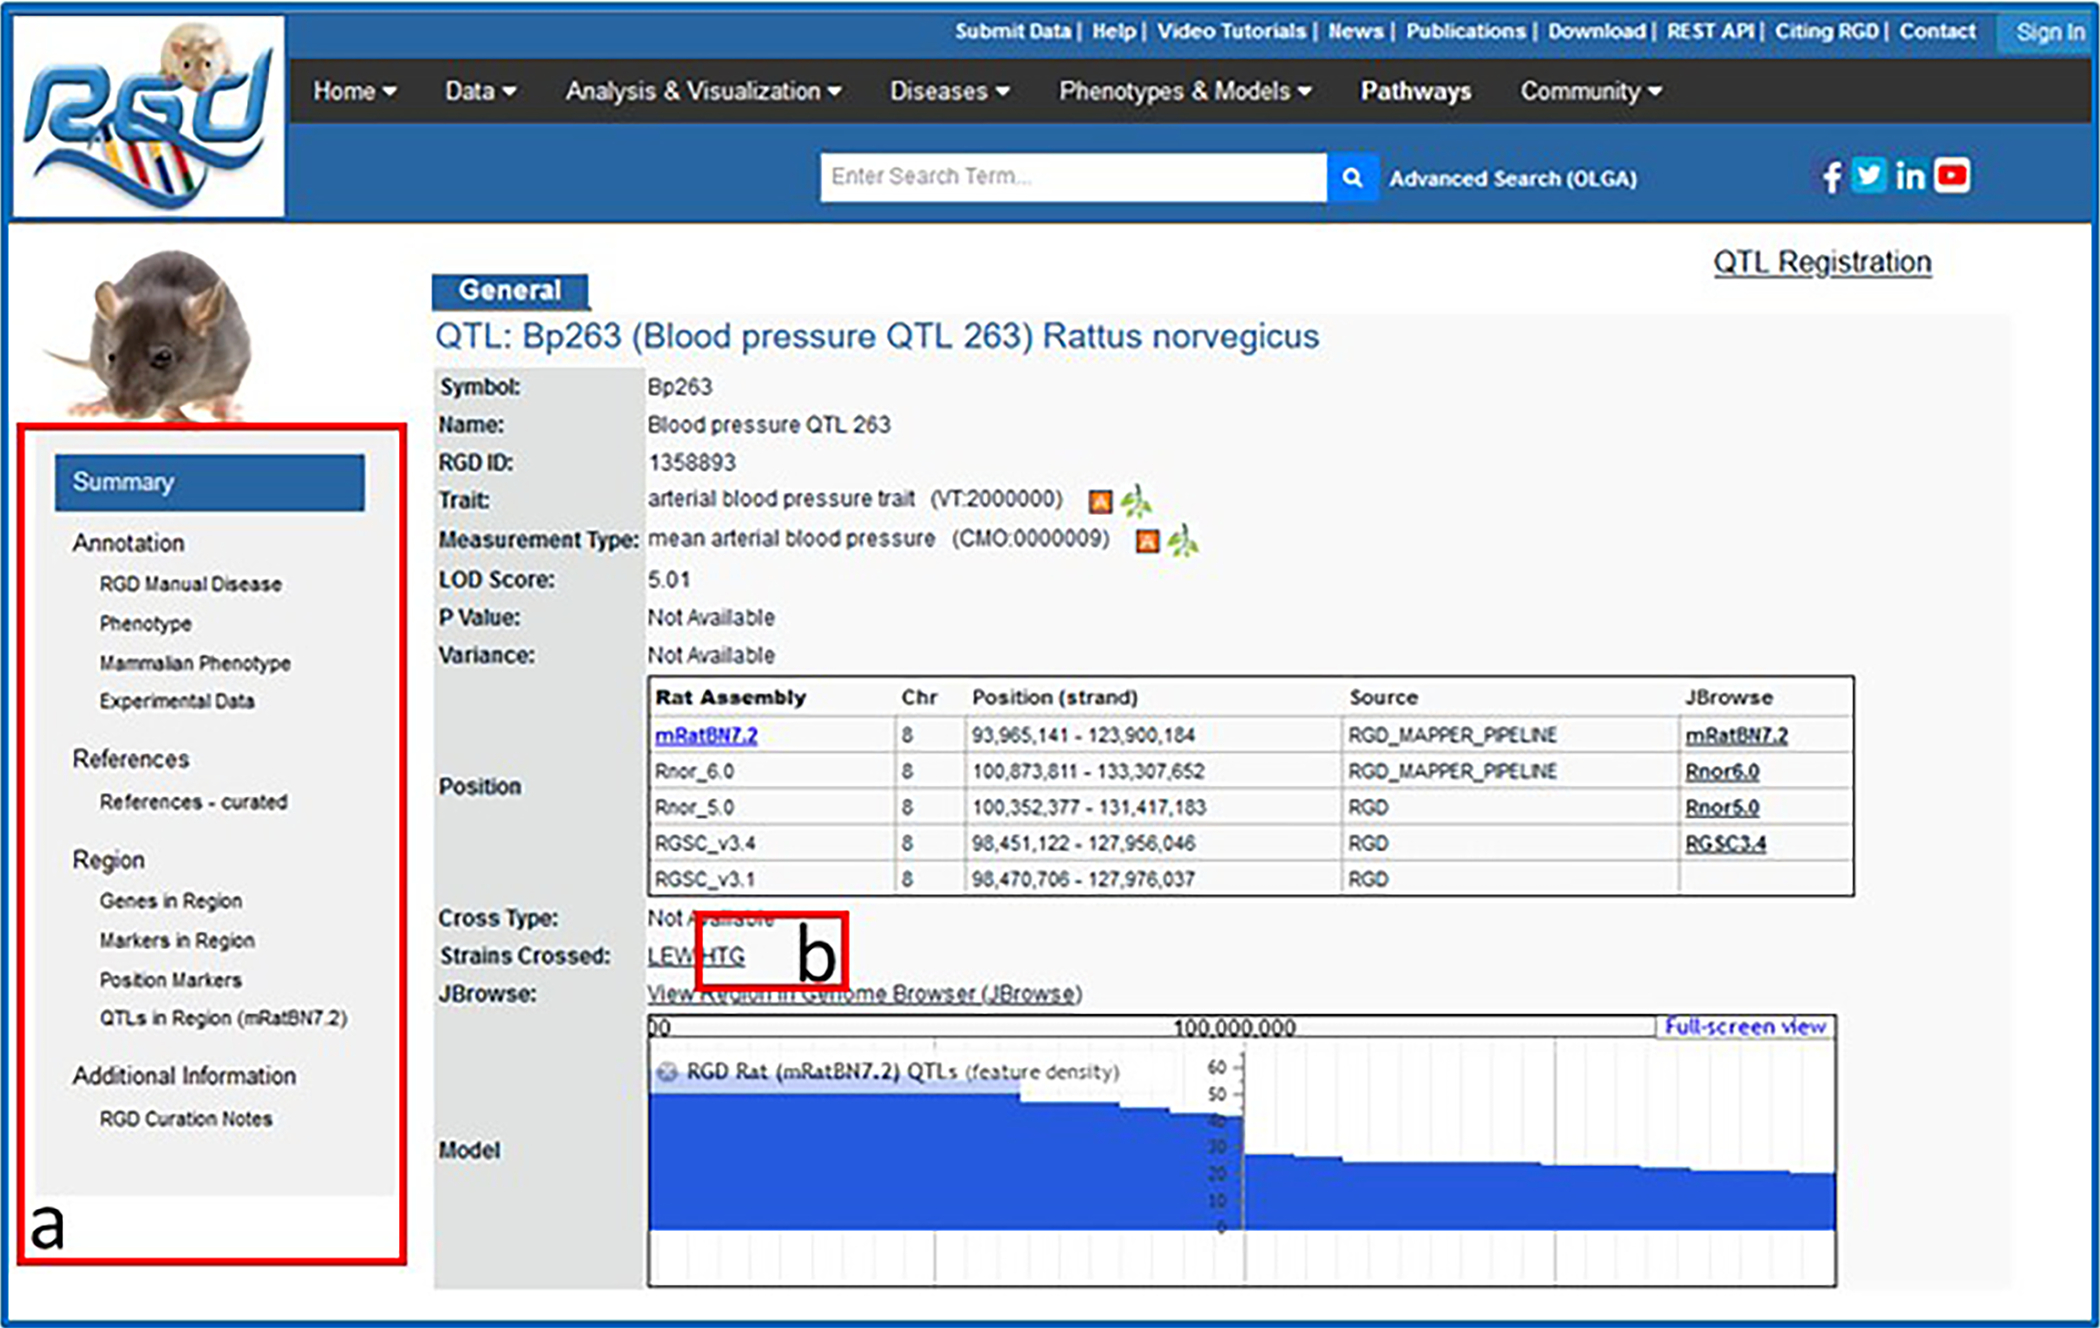
QTL report page including general information section, Annotation section, and others.
Figure 14.
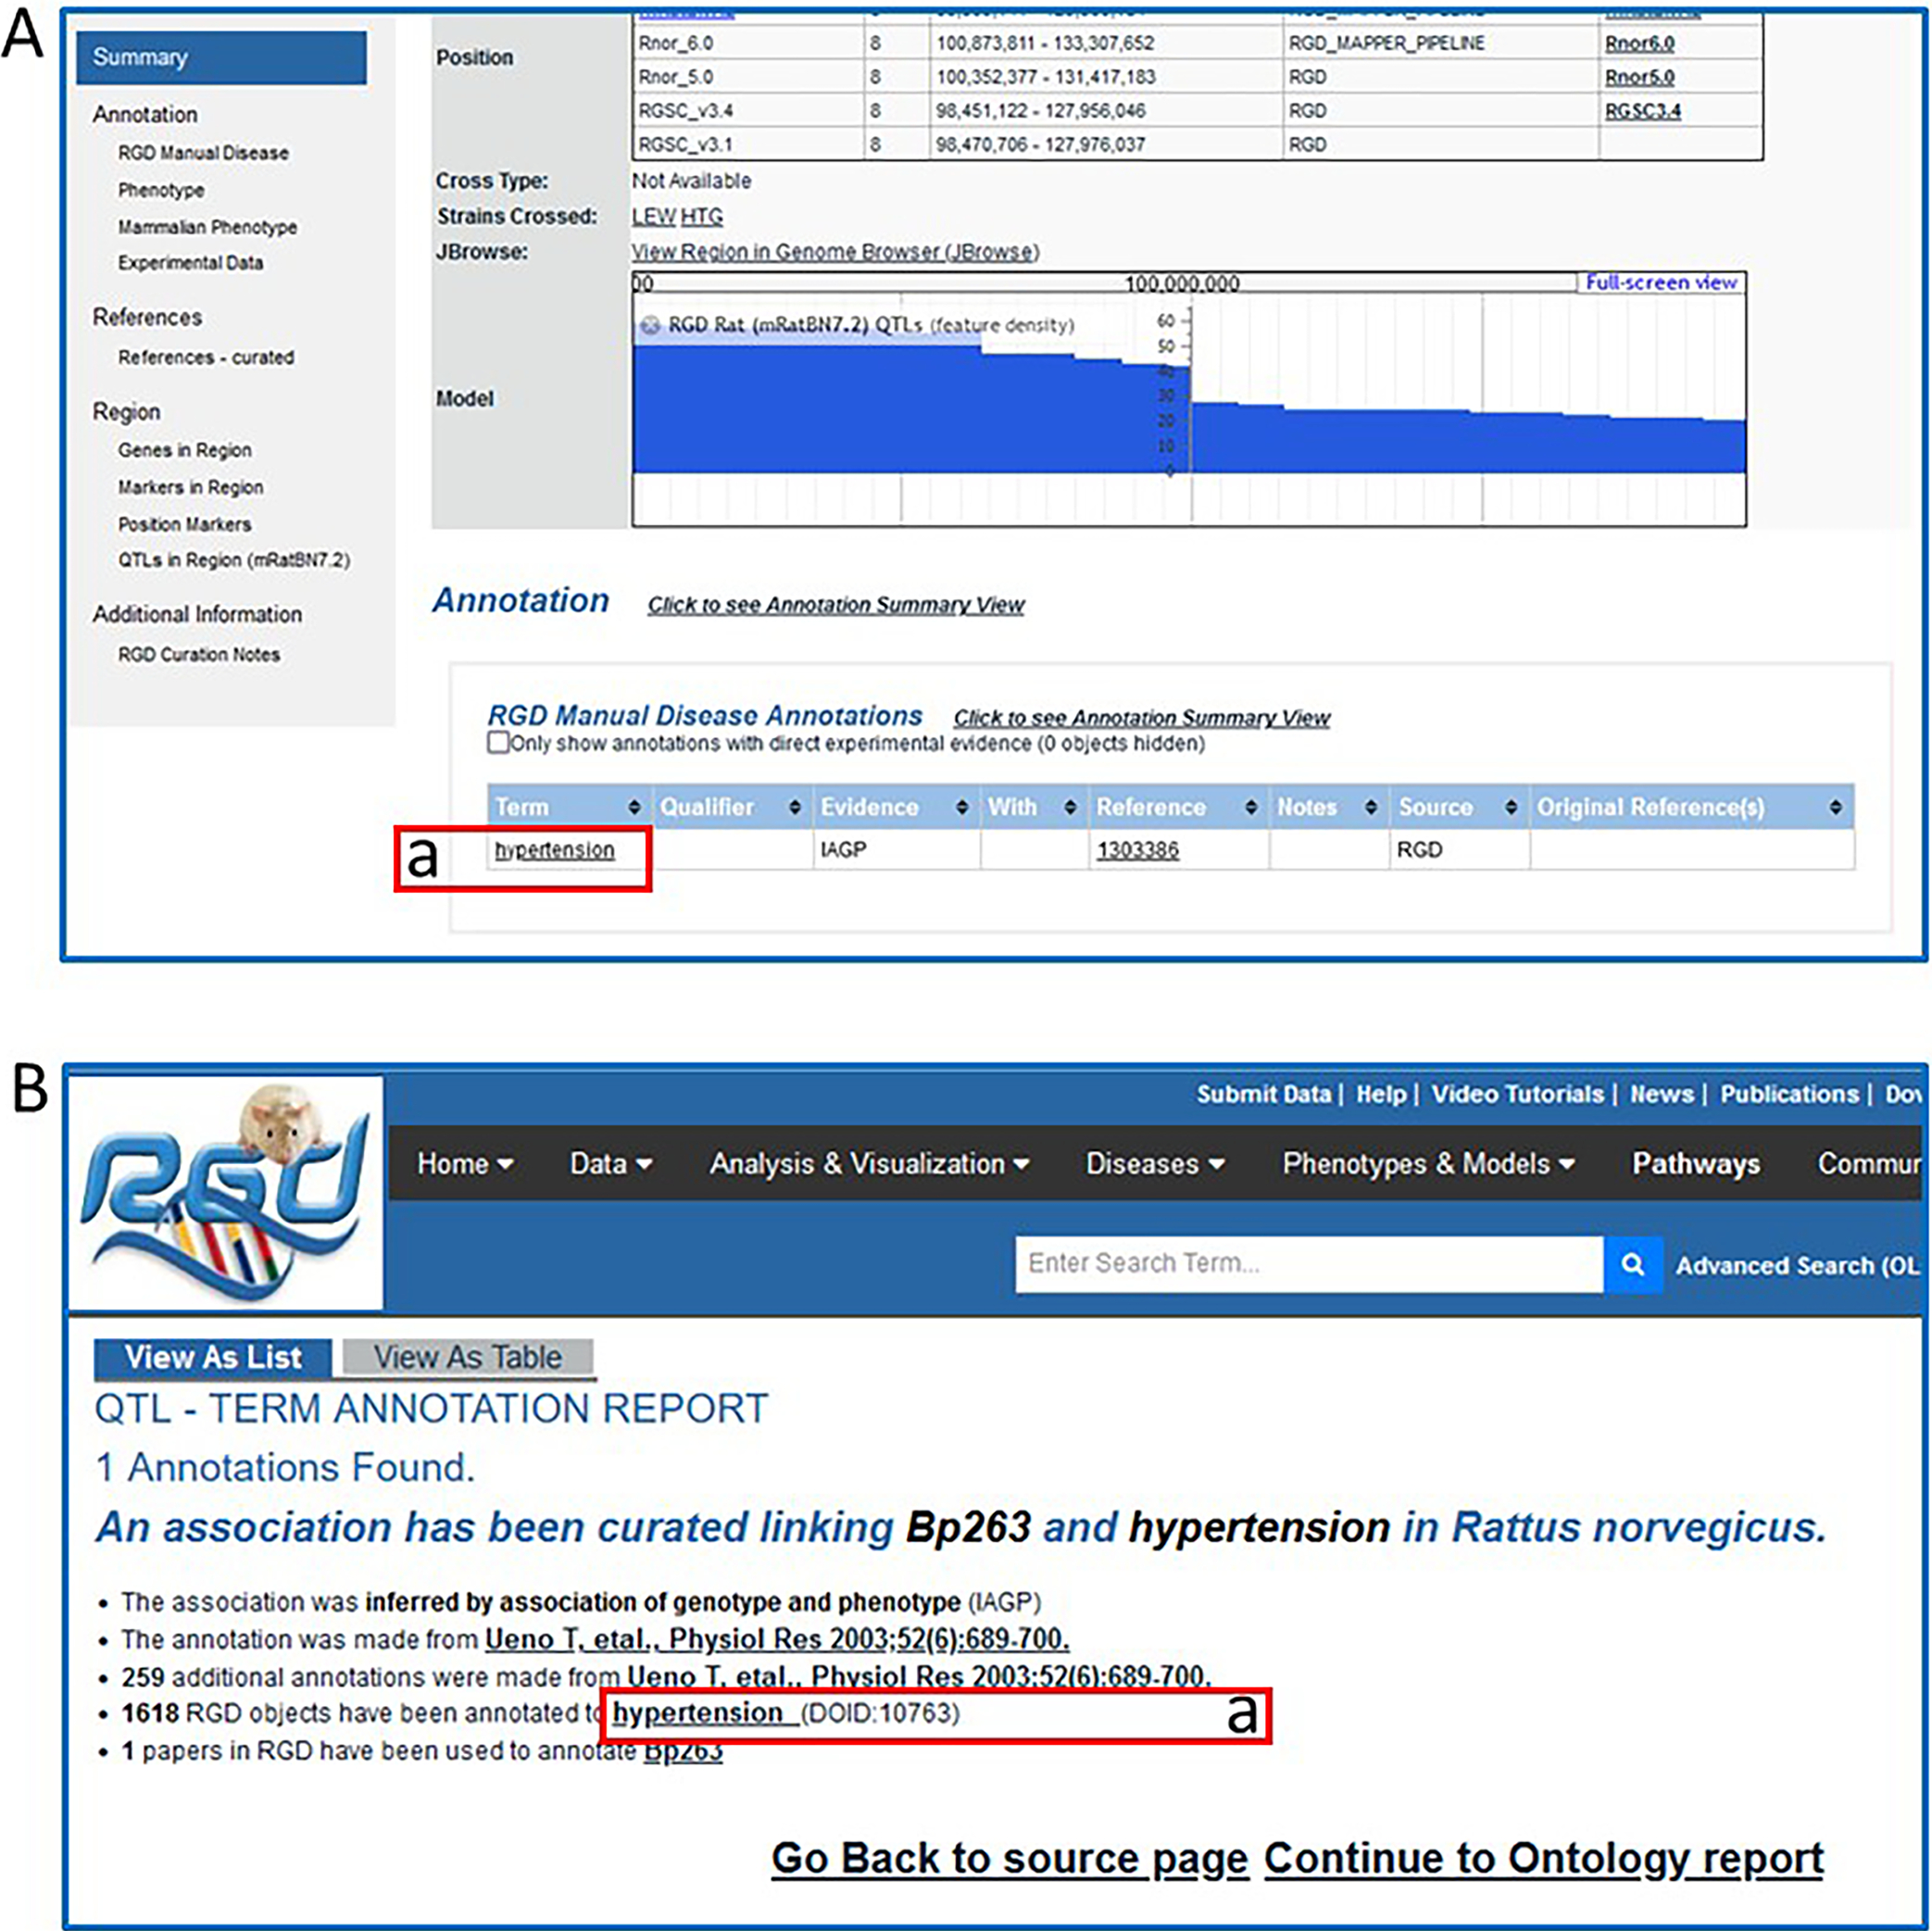
QTL report page (A) and QTL-term report page (B). The QTL-term report page gives annotation information such as type of evidence, data source, number of annotations from that data source, and number of references associated with the QTL.
Examine the genomic Region section of the QTL report page
-
7Return to the QTL report page. In the “Region” section/”Genes in Region” subsection click on the link “Tgfbr2” under “Symbol” (Fig. 15-a) to access the gene report page for Tgfbr2.The Genes in Region table can be downloaded as a CSV (comma-separated values) or TAB (tab separated) file, sent to a printer, or loaded into various RGD analysis tools (Basic Protocol 6).
-
8
Click on the subsection navigation link for/or scroll to “Position Markers” (Fig. 16). Adjacent to “Flank 1” (Fig. 16-a), click on “(D8Rat19)” to go to the SSLP report for that marker.
Figure 15.
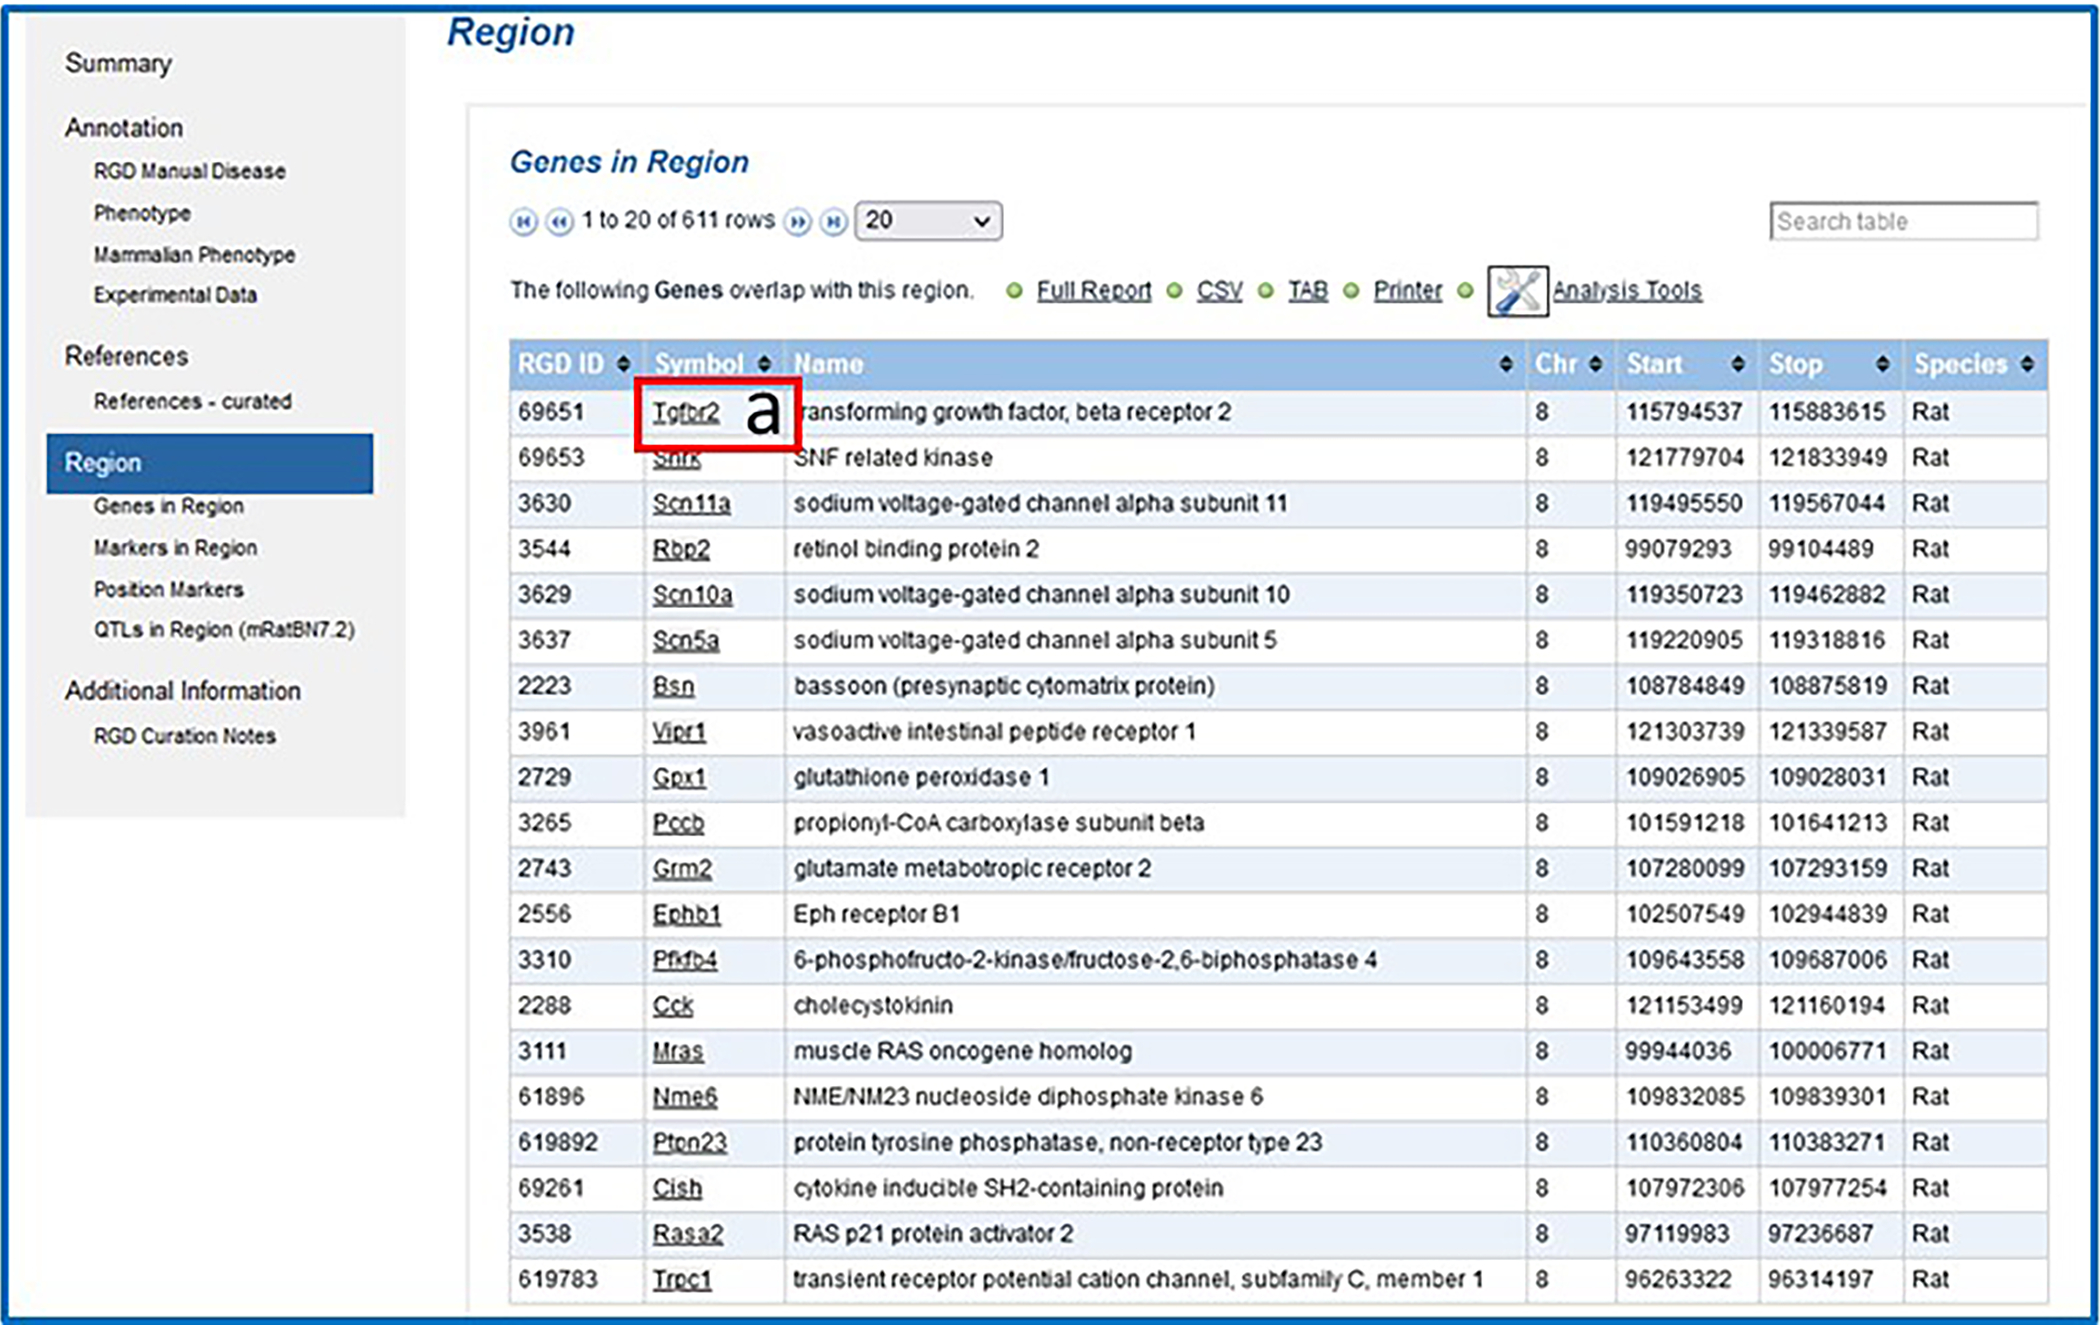
Genes in Region subsection of the QTL report page.
Figure 16.
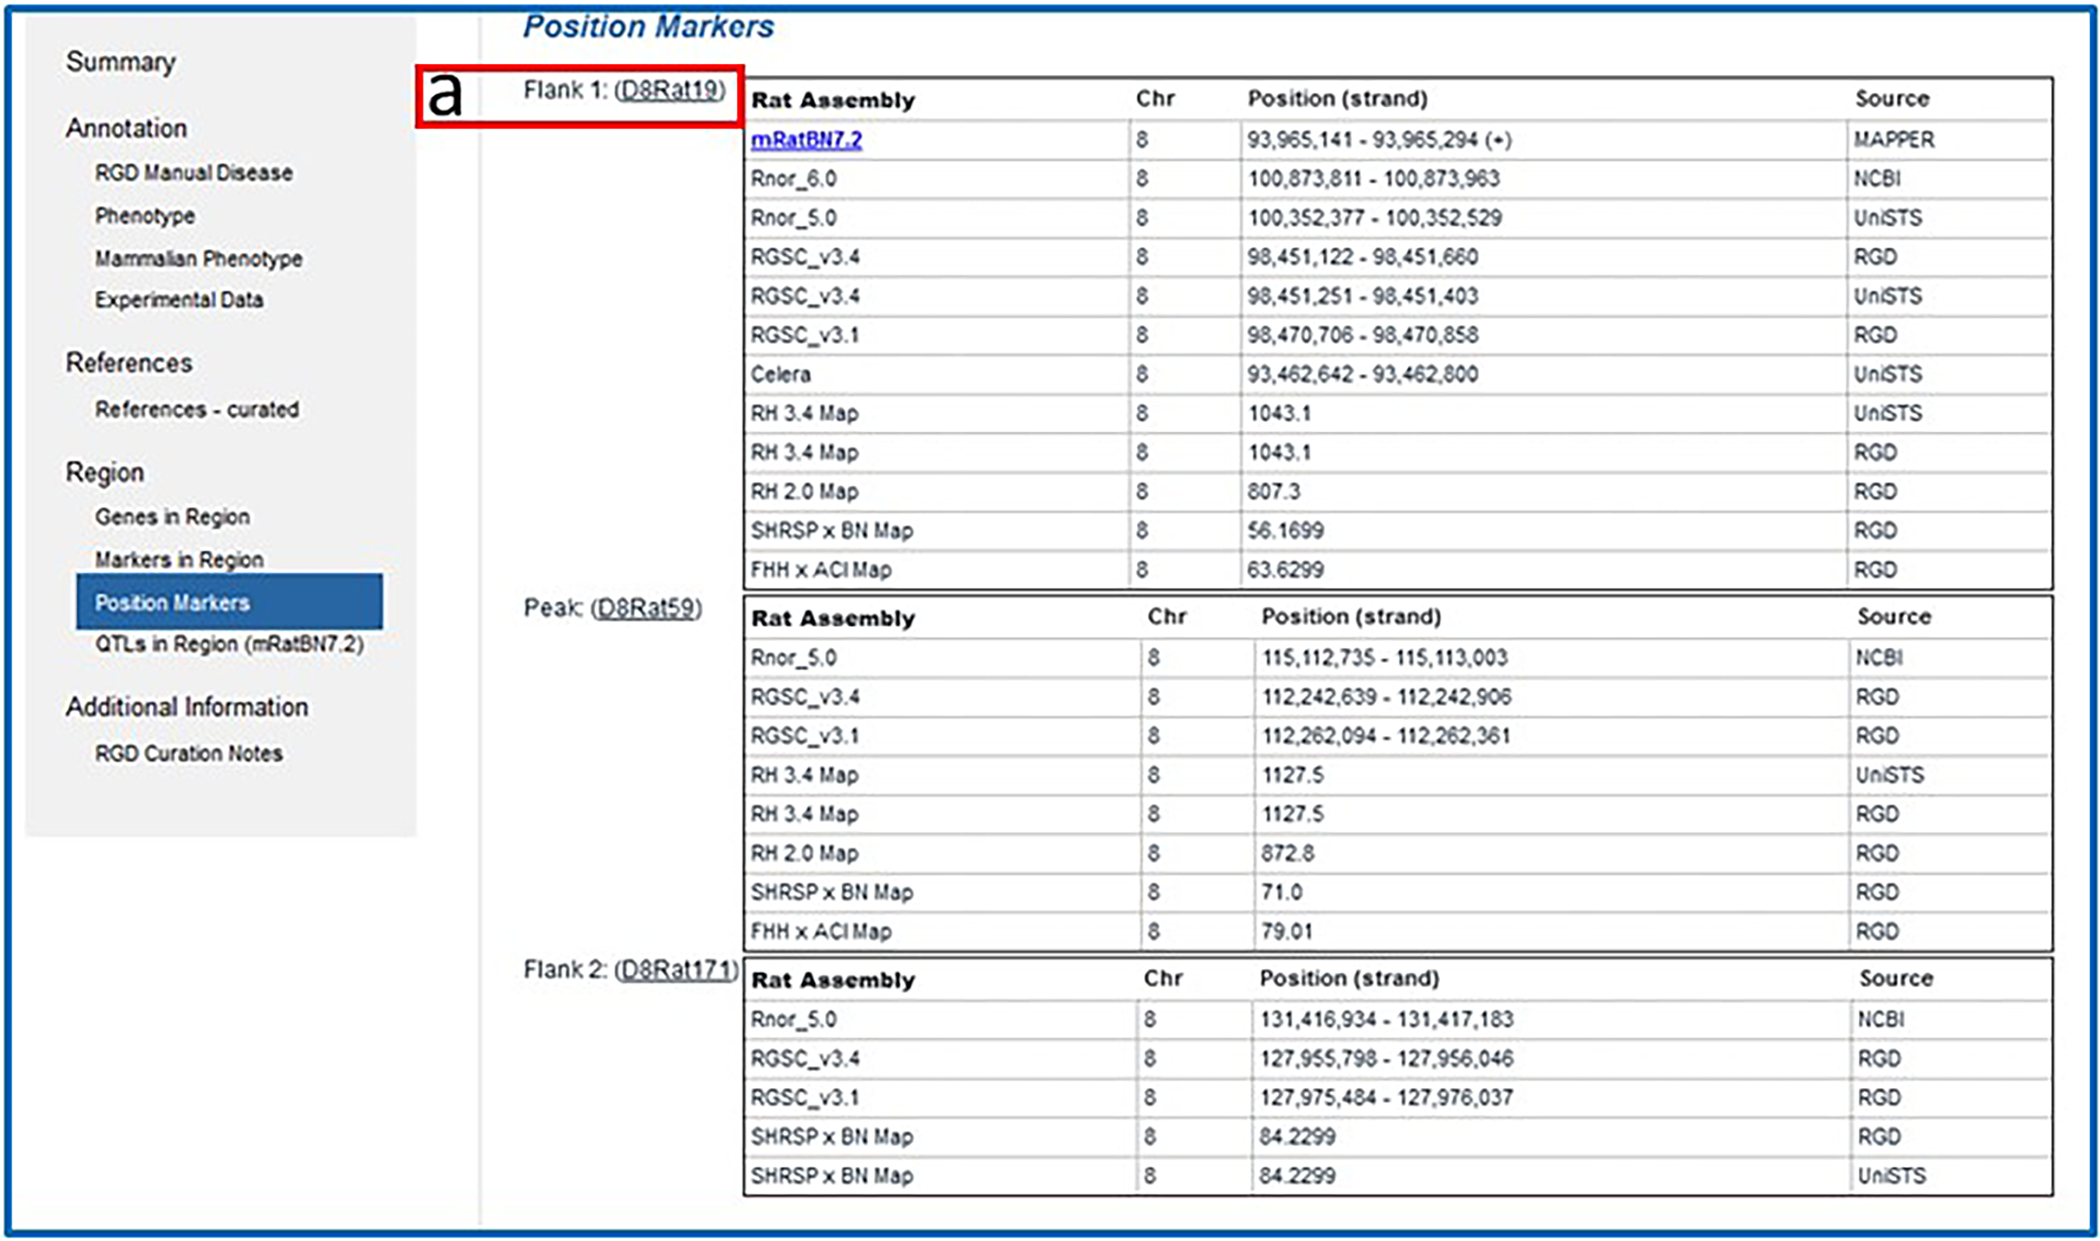
Position Markers subsection of the QTL report page.
Examine the remaining subsections of the QTL report page
-
9
Return to the QTL report page and scroll down to the “References-curated” subsection of the Annotations section or click on “References” in the left side navigation column to view the reference for the paper with information about Bp263 (Fig. 17A). Click on the “Reference Citation” link on the right side of the page to read the abstract on the reference report page and see what other objects and what other annotations are associated with the same reference.
-
10
Return to the QTL report page. The “RGD Curation Notes” subsection of the “Additional Information” section (Fig. 17B) contains free-text notes giving additional details about the QTL that are not included elsewhere in the report. Click the link “1303386” in the Reference column (Fig. 17B–a) to view the abstract of the paper detailing the sexual dimorphism and drug dependence linked to this blood pressure QTL. The reference page includes a link to the abstract at PubMed, which in turn often links to a copy of the full text of the article.
Figure 17.
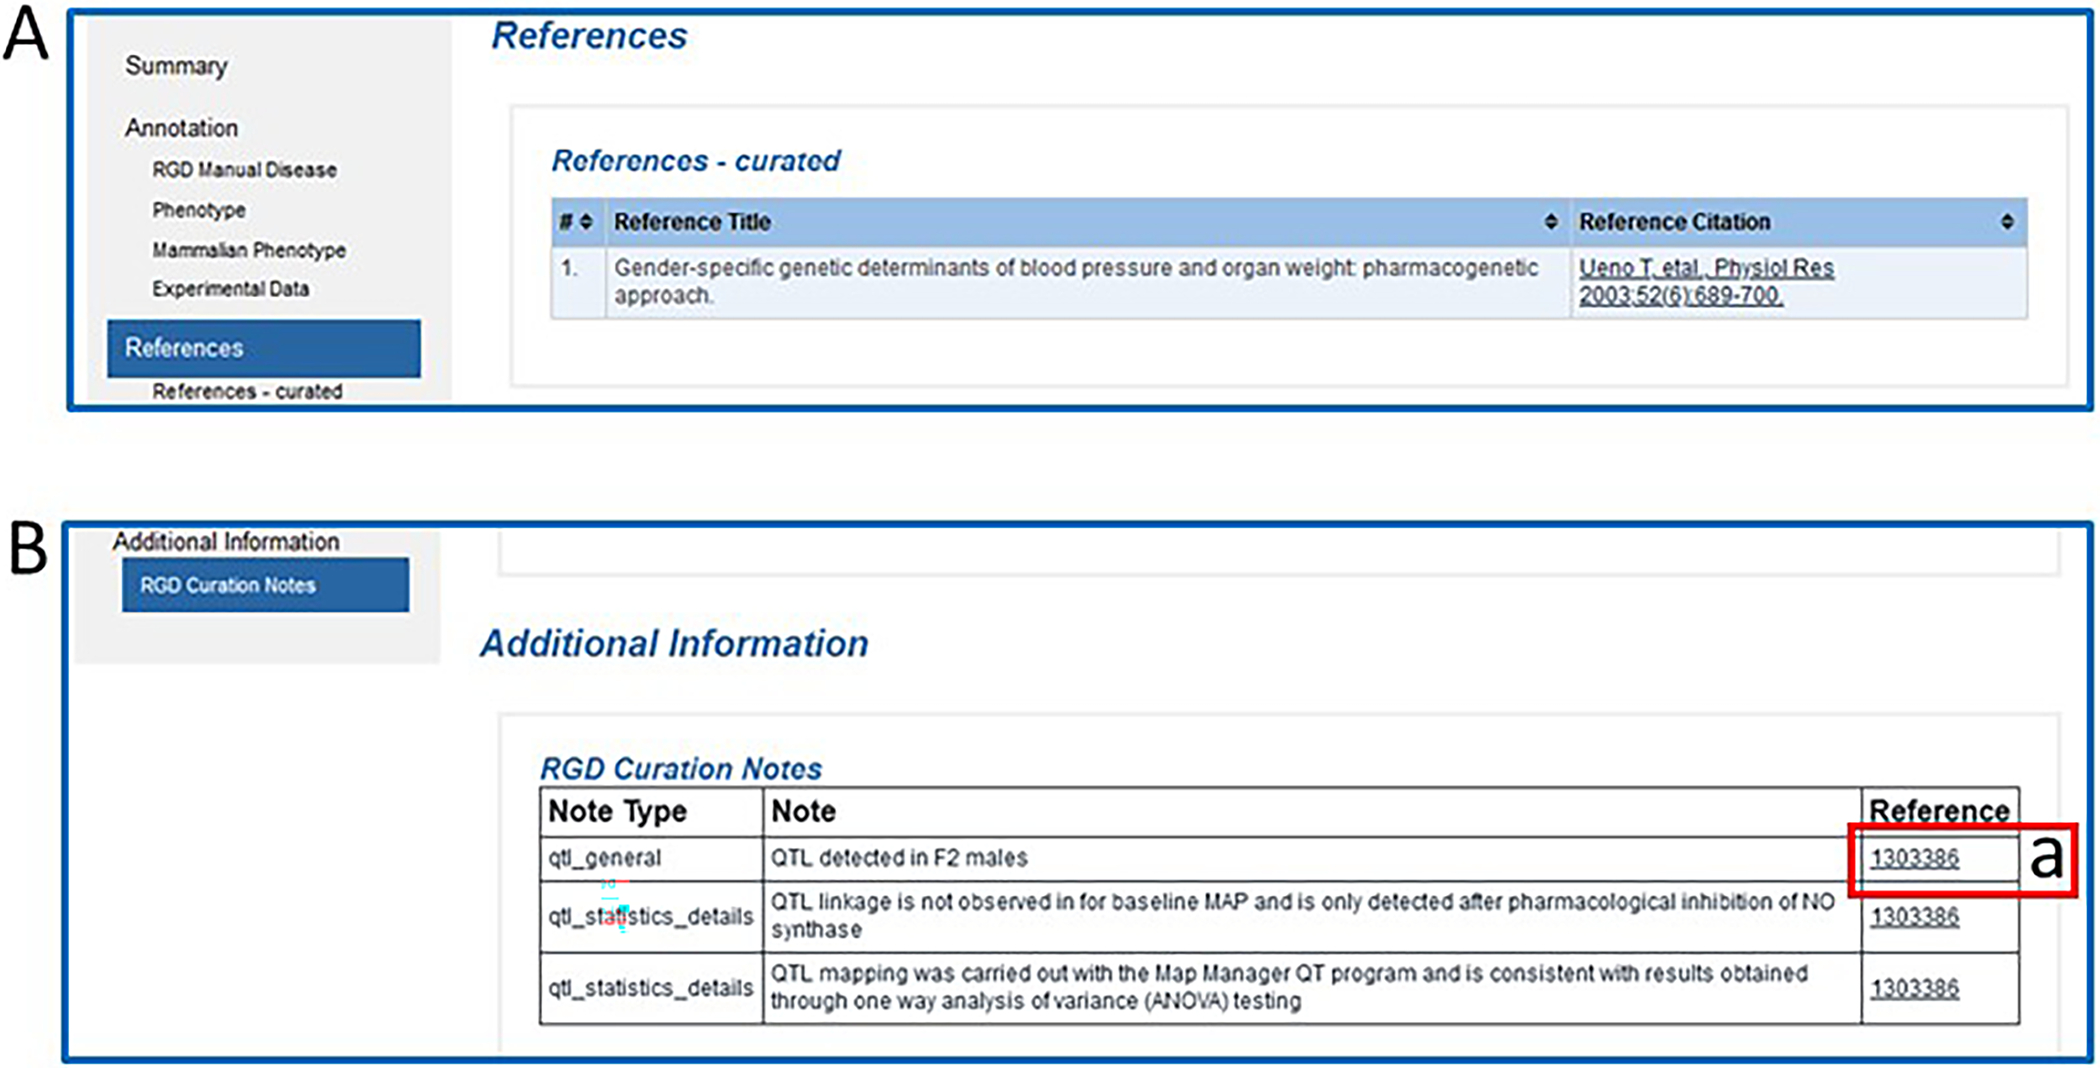
The References (A) and Additional Information (B) sections of the QTL report page.
BASIC PROTOCOL 4
USING THE RGD GENOME BROWSER (JBrowse) TO FIND PHENOTYPIC ANNOTATIONS
The JBrowse genome browser (Buels, et al. 2016) from the Generic Model Organism Database project (http://www.gmod.org) is an interactive tool that allows researchers to visualize a variety of genetic and phenotypic data types in their genomic context. Virtually all the data within the Rat Genome Database have been associated with the genome sequence in one way or another. As fundamental datasets such as genes, quantitative trait loci, microsatellite and SNP markers, and sequence resources such as ESTs are aligned with the genome sequence, they bring with them phenotypic and other information. This information includes methylation data, associations with disease, human synteny, and many types of variant/mutation data. Any or all of these can be accessed via the JBrowse genome browser and their relationship to the genomic sequence explored.
This protocol details the use of the JBrowse tool to look at a genomic region associated with hypertension.
Necessary Resources
Hardware
Computer with functioning Internet connection
Software
Web browser (Microsoft Edge, Mozilla Firefox, Google Chrome, or Apple Safari)
Protocol steps with step annotations
-
1From the RGD home page (https://rgd.mcw.edu, Fig. 1), click on the box labelled JBrowse Genome Browser on the left side of the page to access RGD’s rat genome browser.From RGD pages other than the home page, scroll over “Analysis & Visualization” on the menu bar at the top of the page. Click on “JBrowse (genome browser)” from the list that appears.The RGD JBrowse home page has a list of species and genome assemblies from which to choose.
-
2At the top of the genome assemblies list click “RGD mRatBN7.2” (Fig. 18A). At the top center of the right frame, choose chromosome 1 from the drop-down menu (Fig. 18B–a). In the left-side frame under “Available Tracks”, click “Disease Related Tracks”, then “Disease and Phenotype”, “Cardiovascular Diseases”, and finally “Cardiovascular Diseases Related Genes” (Fig. 18B–b). Cardiovascular disease-related genes will immediately load as a track in the right frame of the viewer (Fig. 18B–c).Zoom out using the “-“ buttons next to the chromosome dropdown menu if no genes are visible. Full view of the track can be seen by scrolling left and right along the chromosome. Relevant genes on other chromosomes can be seen by choosing another chromosome from the dropdown at the top of the frame (Fig. 18B–a).
-
3Click any red bar/gene symbol in the cardiovascular disease-related genes track (Fig. 18B–b, in this example Kcnj11 or Abcc8). A pop-up window appears (Fig. 18C) with specific gene information, including Disease Ontology annotations.The listed annotations all have links, via the term ID, to specific ontology report pages (as in Fig. 10).
Figure 18.
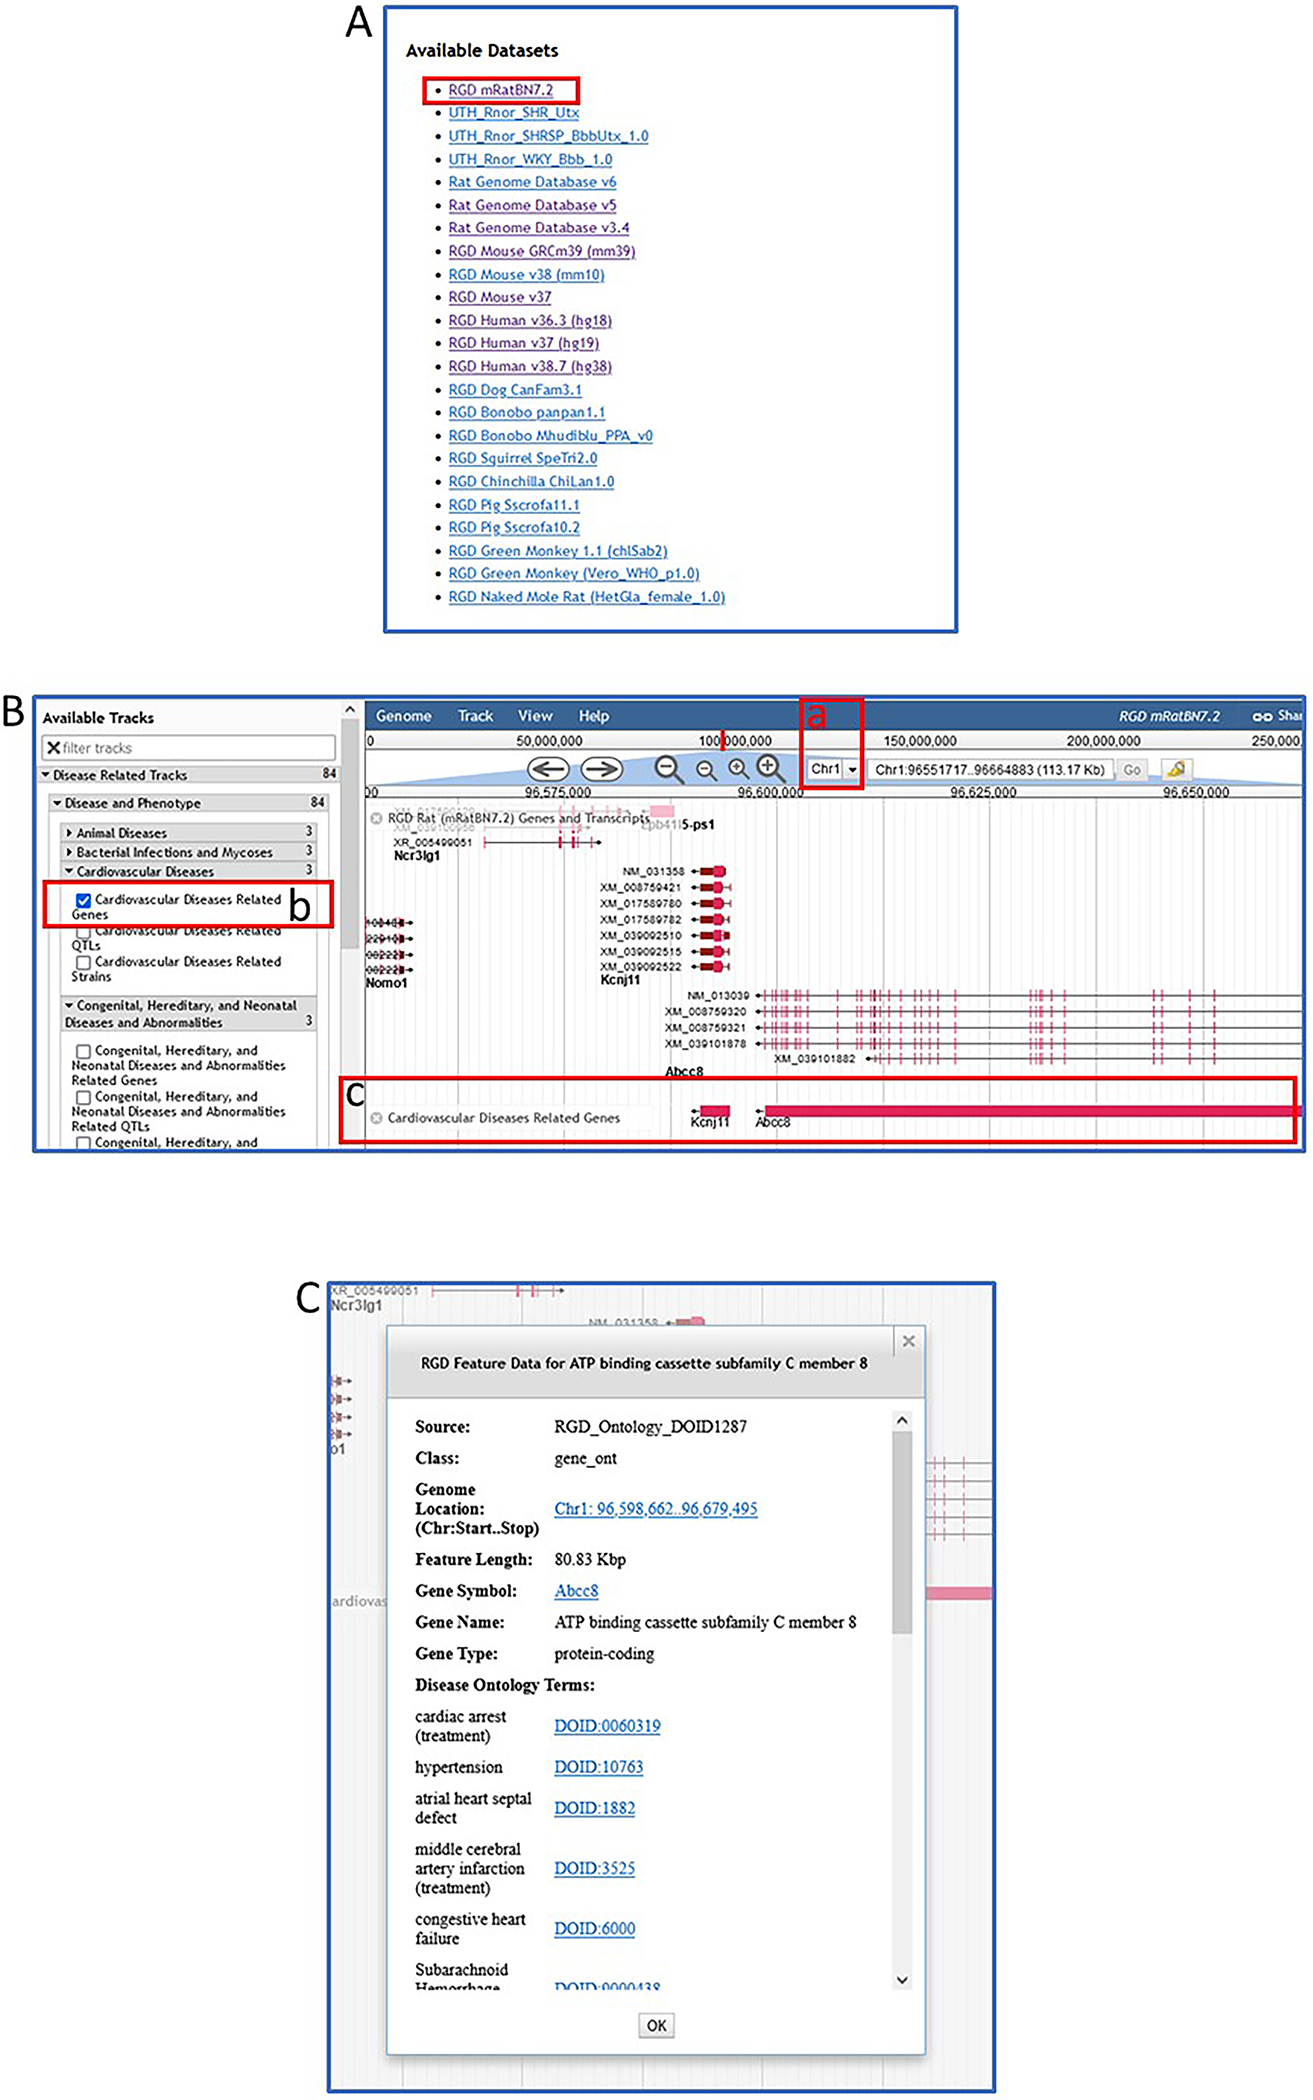
A default view of rat JBrowse with an RGD genes track selected.
Change the scope of the displayed information
- 4
Figure 19.
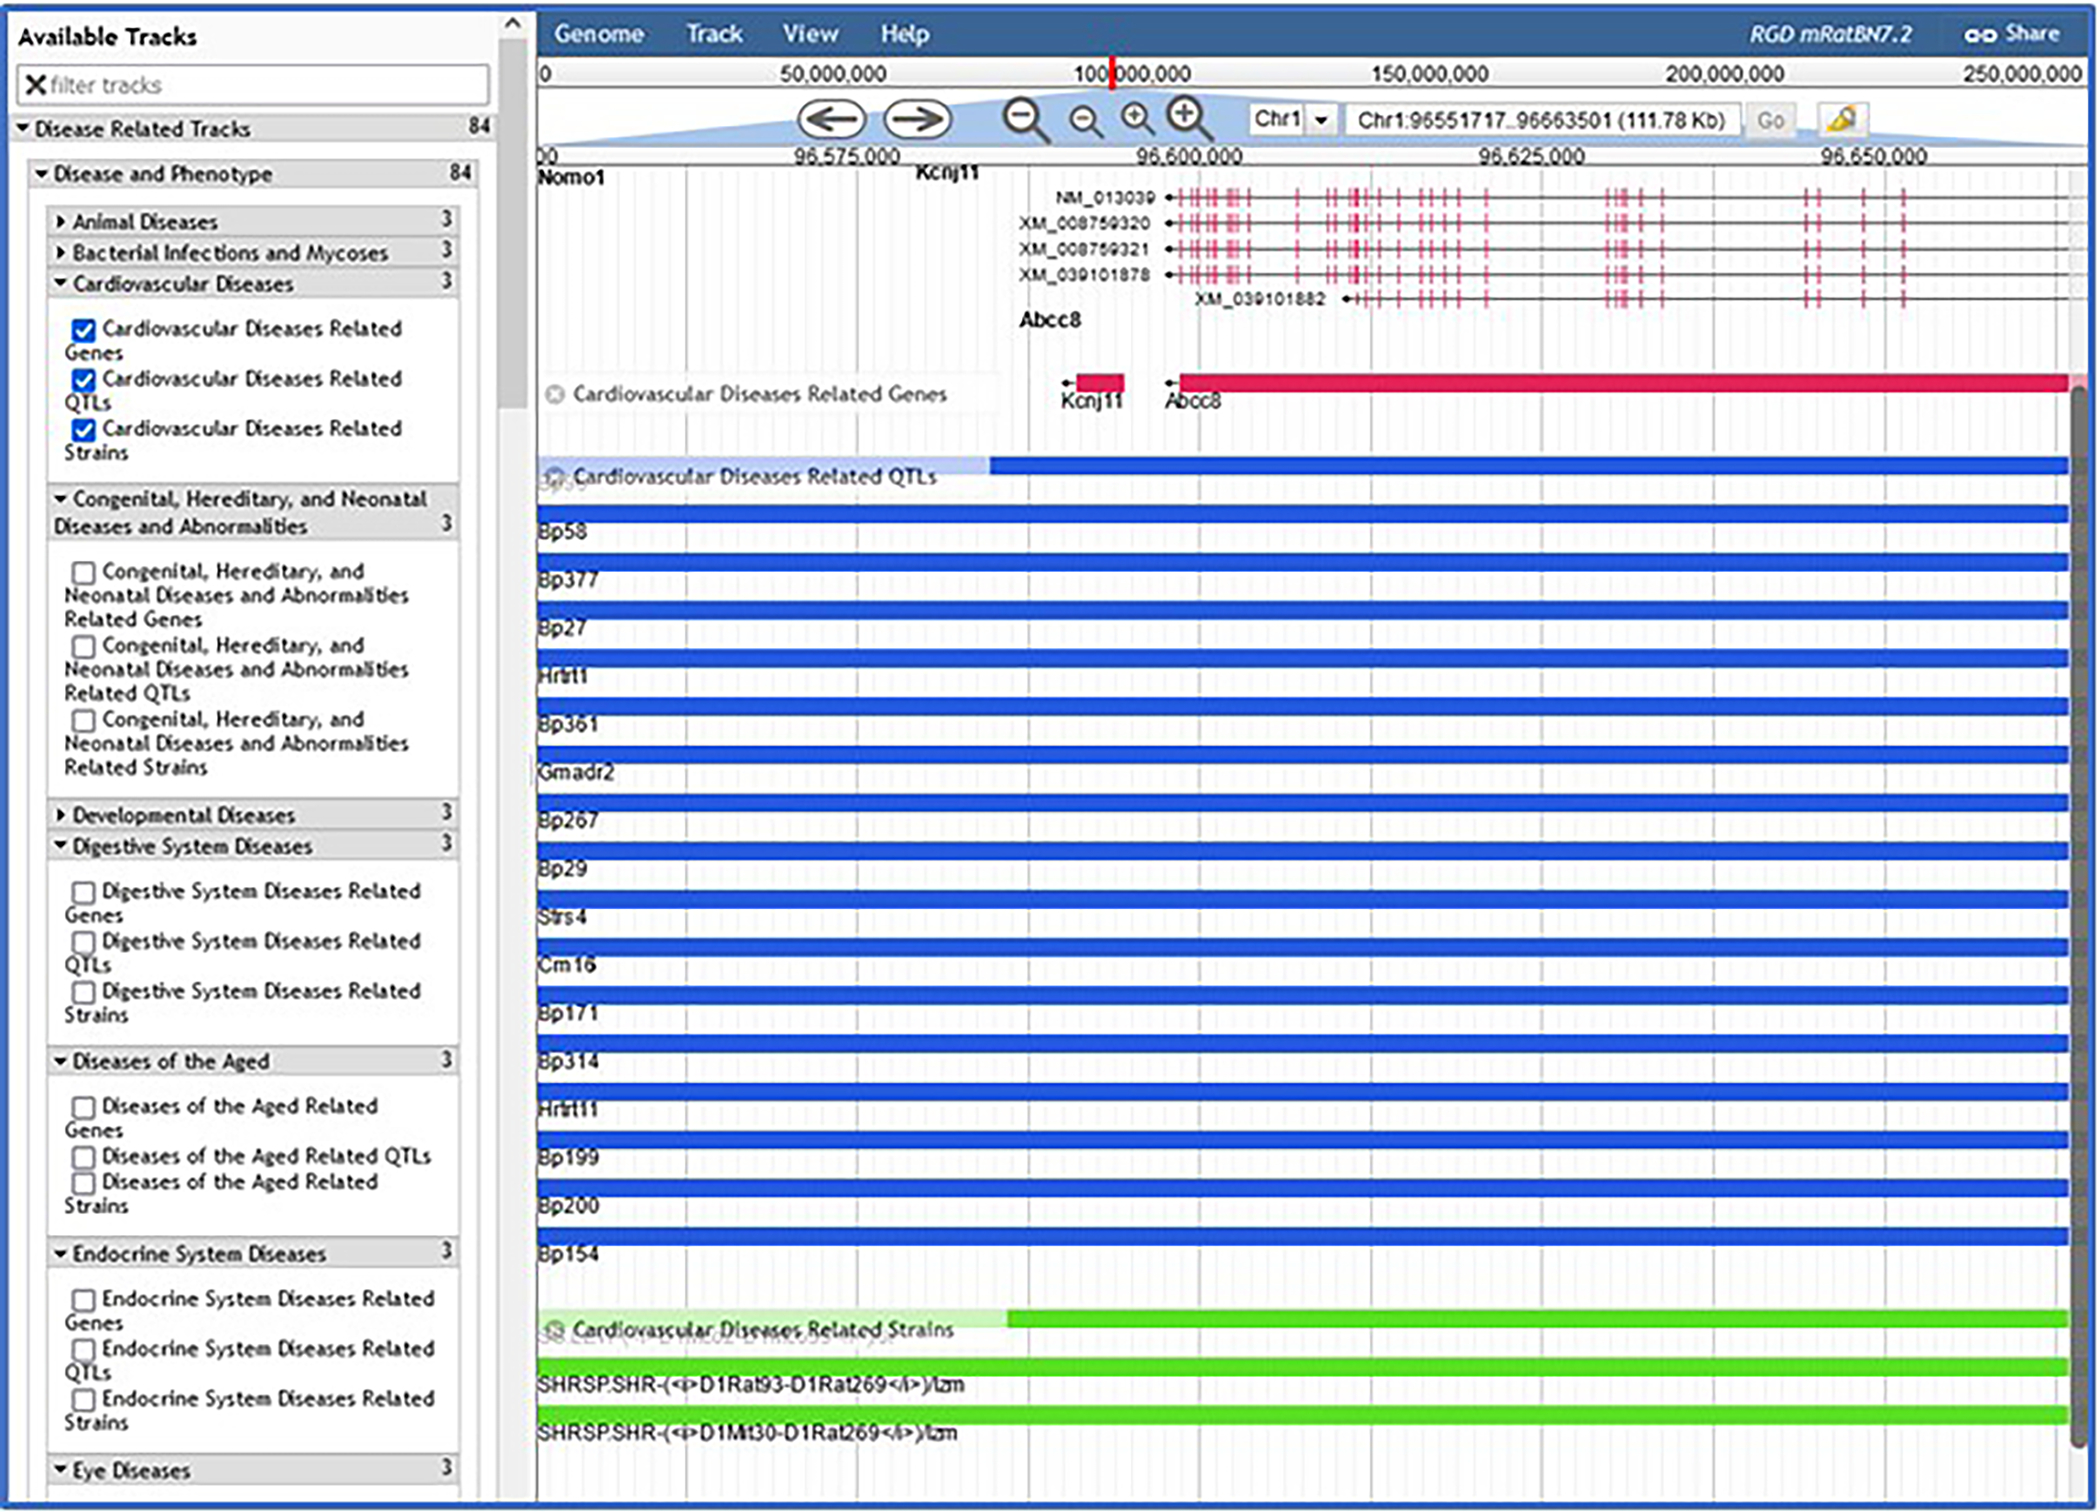
JBrowse page with “Cardiovascular Diseases” selected, showing rat genes, rat QTLs, and rat strains.
BASIC PROTOCOL 5
USING ONTOMATE TO FIND GENE-DISEASE DATA
The OntoMate tool is a biomedical literature search engine with data tagging and filtering. OntoMate provides an ontology-driven, concept-based literature search as a substitute for the PubMed search (http://www.ncbi.nlm.nih.gov/pubmed). OntoMate tags abstracts with gene names, gene mutations, organism name and most of the 19 ontologies/vocabularies used at RGD. Any of the ontologies can be used as the focus of an OntoMate search. All terms/entities tagged to an abstract are listed with the abstract in the search results.
This protocol will show how users can customize their queries by selecting from multiple categories: genes, disease, and multiple subsets thereof.
Necessary Resources
Hardware
Computer with functioning Internet connection
Software
Web browser (Microsoft Edge, Mozilla Firefox, Google Chrome, or Apple Safari)
Protocol steps with step annotations
- From the RGD home page (https://rgd.mcw.edu/, Fig. 1), scroll over “Analysis & Visualization” on the menu bar at the top of the page and click on “OntoMate (Literature Search)” (Fig. 20A–a).
- Click on the arrowhead in the drop-down selection box on the left side of the OntoMate homepage (Fig. 20B–a) and choose “Disease Ontology (RDO)” (Fig. 20C–a). Type “hypertension” in the textbox (Fig. 21A) to the right of the ontology selection box.The textbox has an autocomplete/suggest function, so any term that comes up in the list may be selected as an option.
- To combine a gene with “hypertension” for a gene-disease search, click “Add term condition” under the term textbox (Fig. 21A–a). Click on the arrowhead in the drop-down selection box that appears in the center of the page (Fig. 21B–a) and select “gene” (Fig. 21B–b). Type “Abcc8” in the textbox adjacent to the ontology selection box (Fig. 21B–c).The selection of multiple terms/genes is possible by repeating step 3. Note that “AND”, “OR”, and “NOT” are available with each choice to perform a Boolean search.
- Submit the query by clicking the “Search OntoMate” button beneath the ontology and term selection boxes (Fig. 21B–d).The query result is a list of abstracts tagged with both “Abcc8” and “hypertension”. The number of abtracts and the number of result pages are given above the first abstract (Fig. 22A–a). On the left side of the page there is a tally of abtracts by publication date (Fig. 22A–b), by organism, gene, mutation, and disease.
- Scroll down the list of abtracts to #5. Hover over the “D” in the upper right corner of the abstract box to reveal a pop-up window (Fig. 22B–a) showing RGD disease annotations to the rat, mouse, and human orthologs of gene “Abcc8”.The abstract box contains numerous things in addition to the citation including a link to the PubMed record of that abstract, a link to full text of that abstract, and a link to the RGD reference record for that abstract (Fig. 22B–b). Also included is a toggle (“show”) (Fig. 22B–c) to show the text of the abstract in the same window. Below the abstract is a listing (Fig. 22B–d) of all genes and ontology terms tagged in the abstract. The ontology terms are links to the respective ontology term report pages in RGD.
Figure 20.
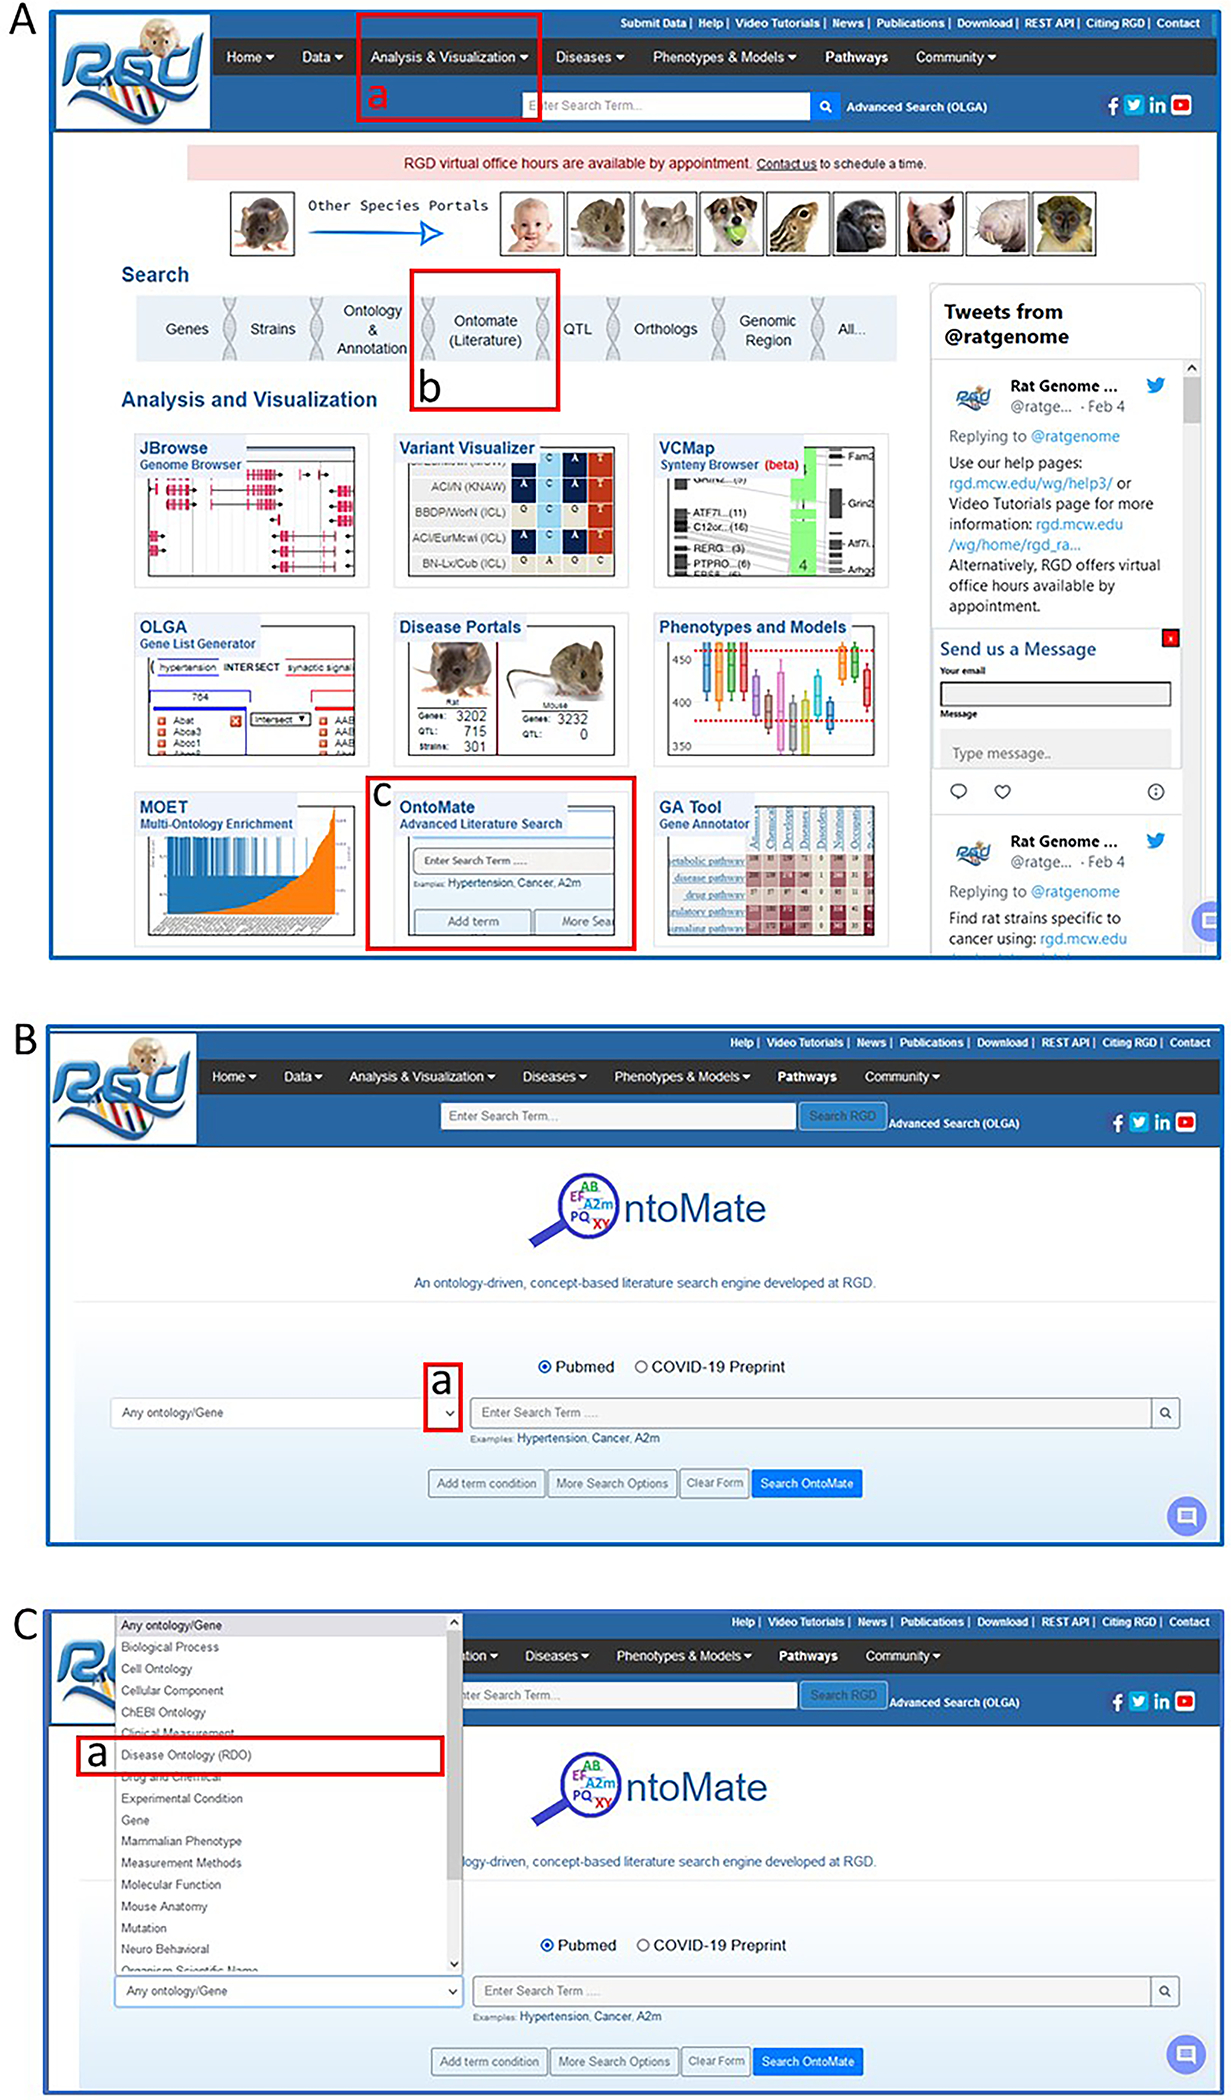
Navigating to OntoMate, the ontology-driven, literature search tool at RGD.
Figure 21.
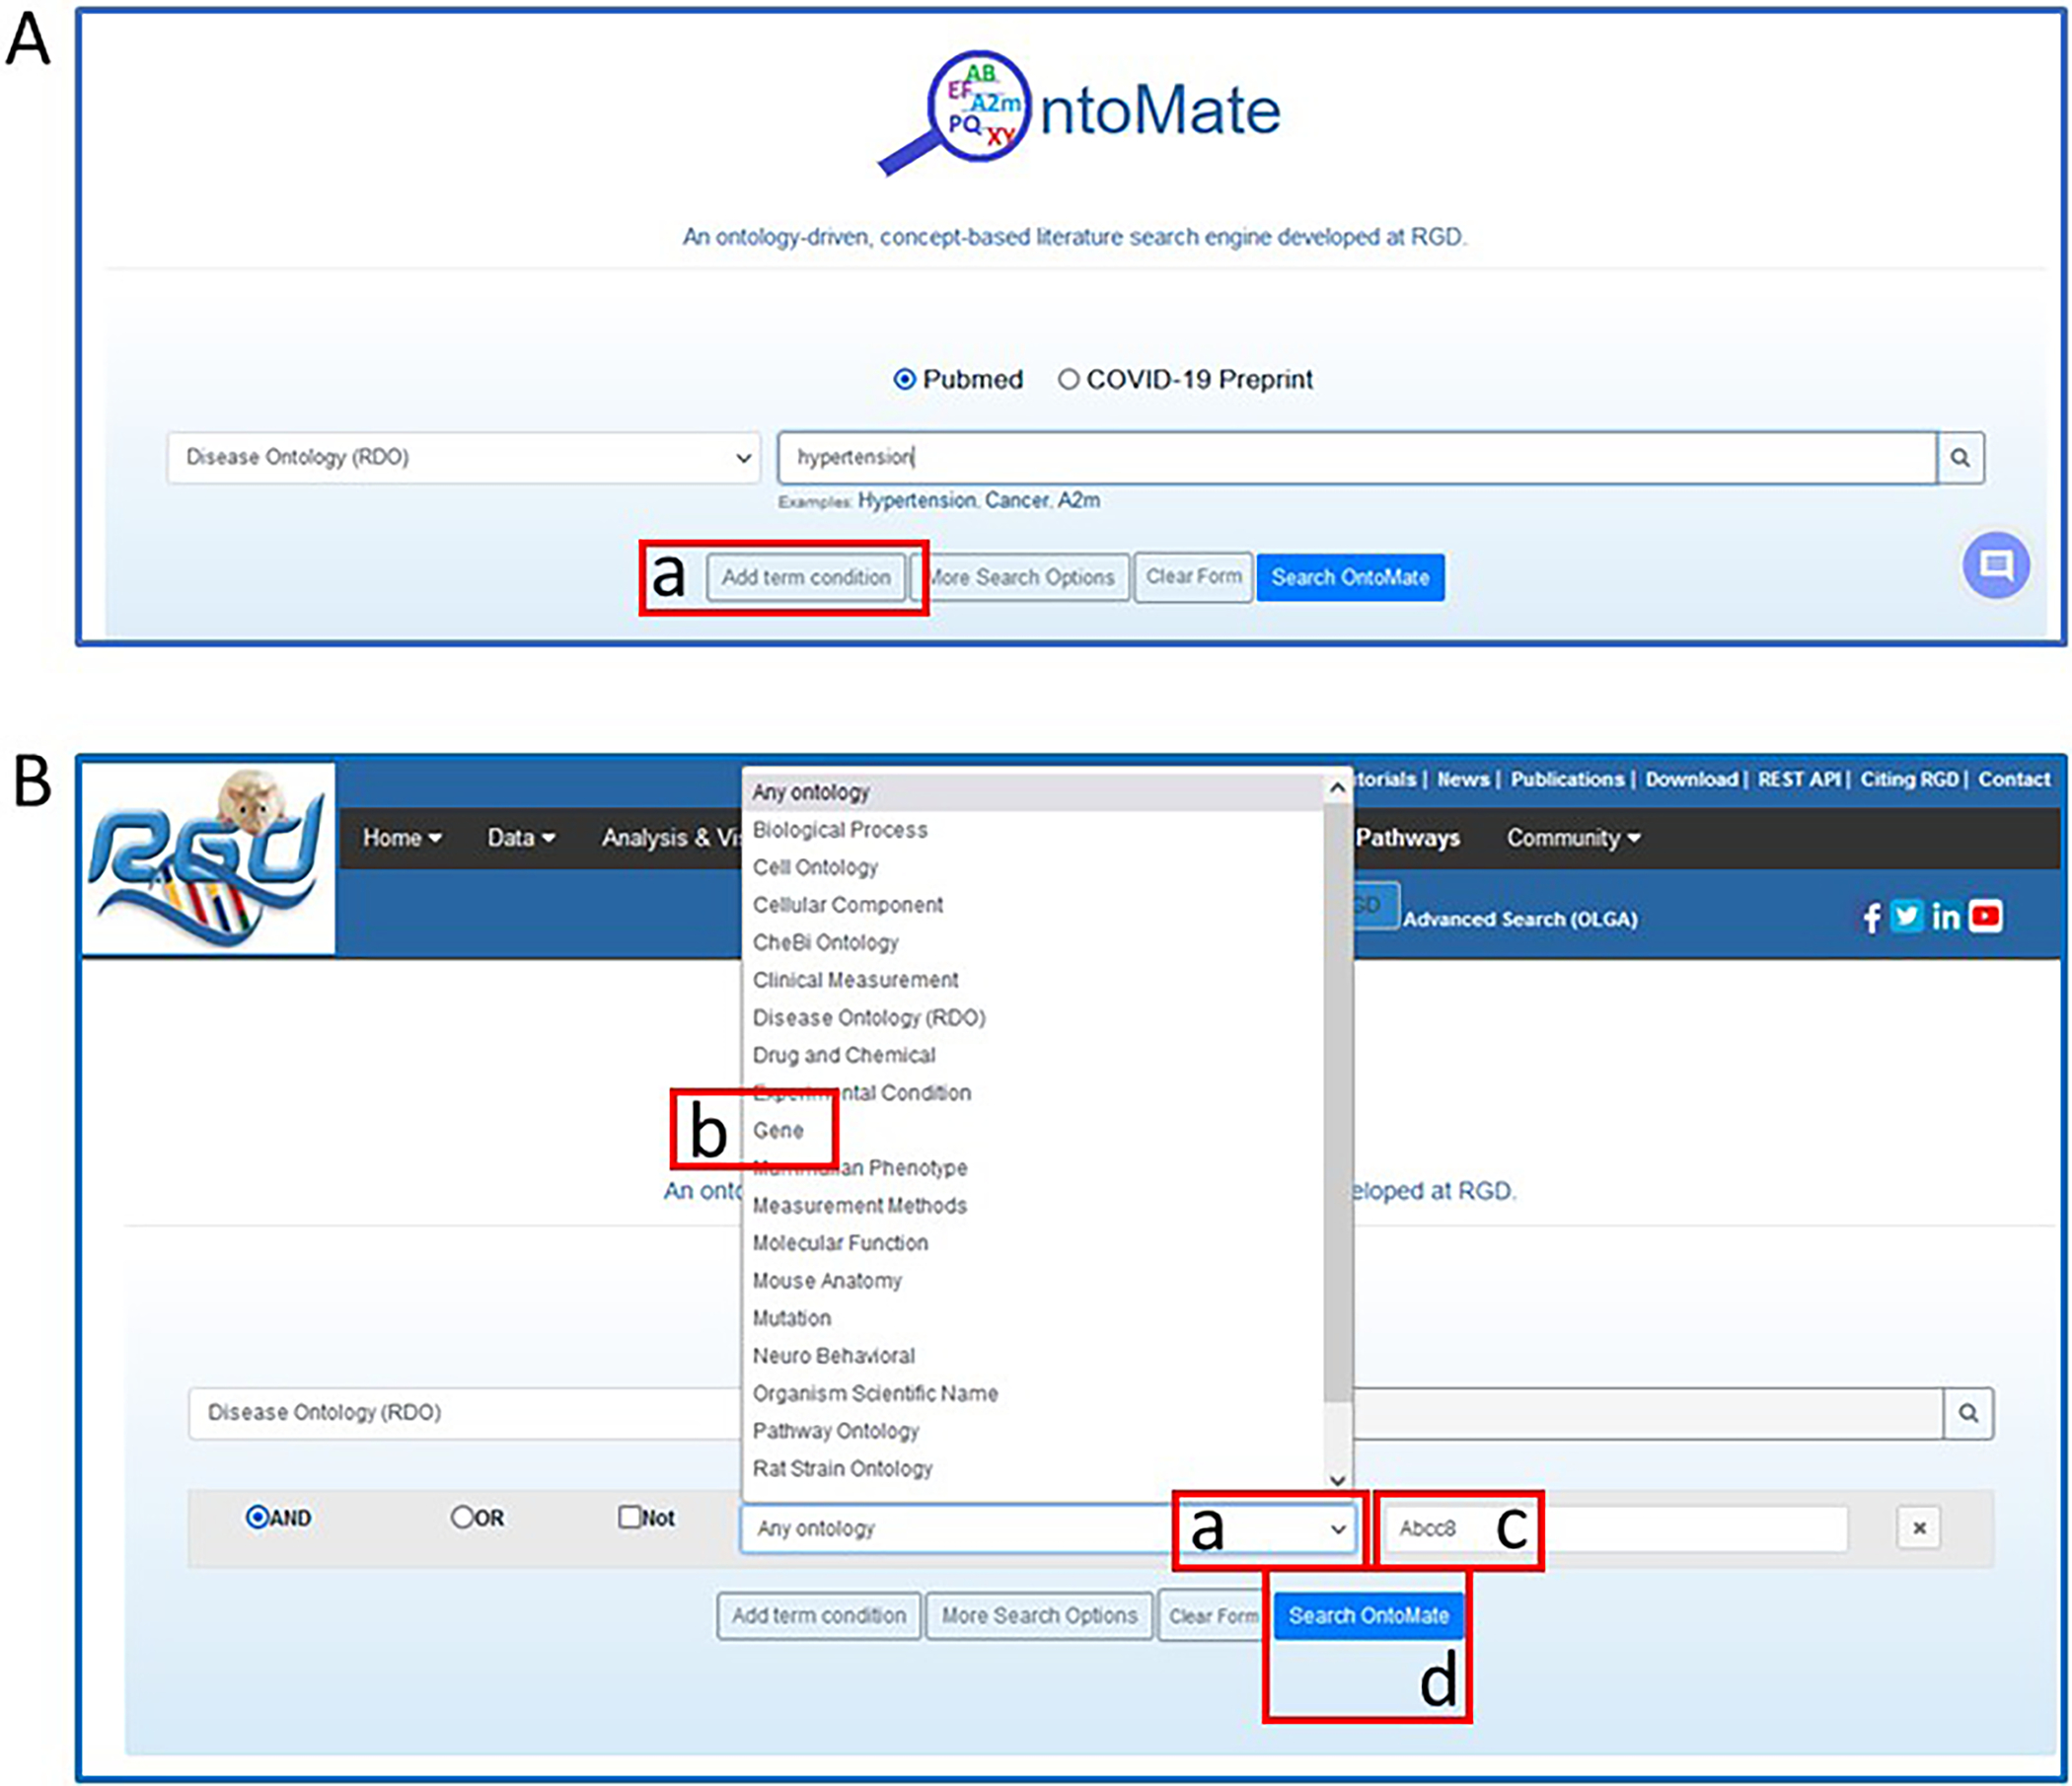
OntoMate homepage with search choices of the disease term “hypertension” and the gene “Abcc8”.
Figure 22.
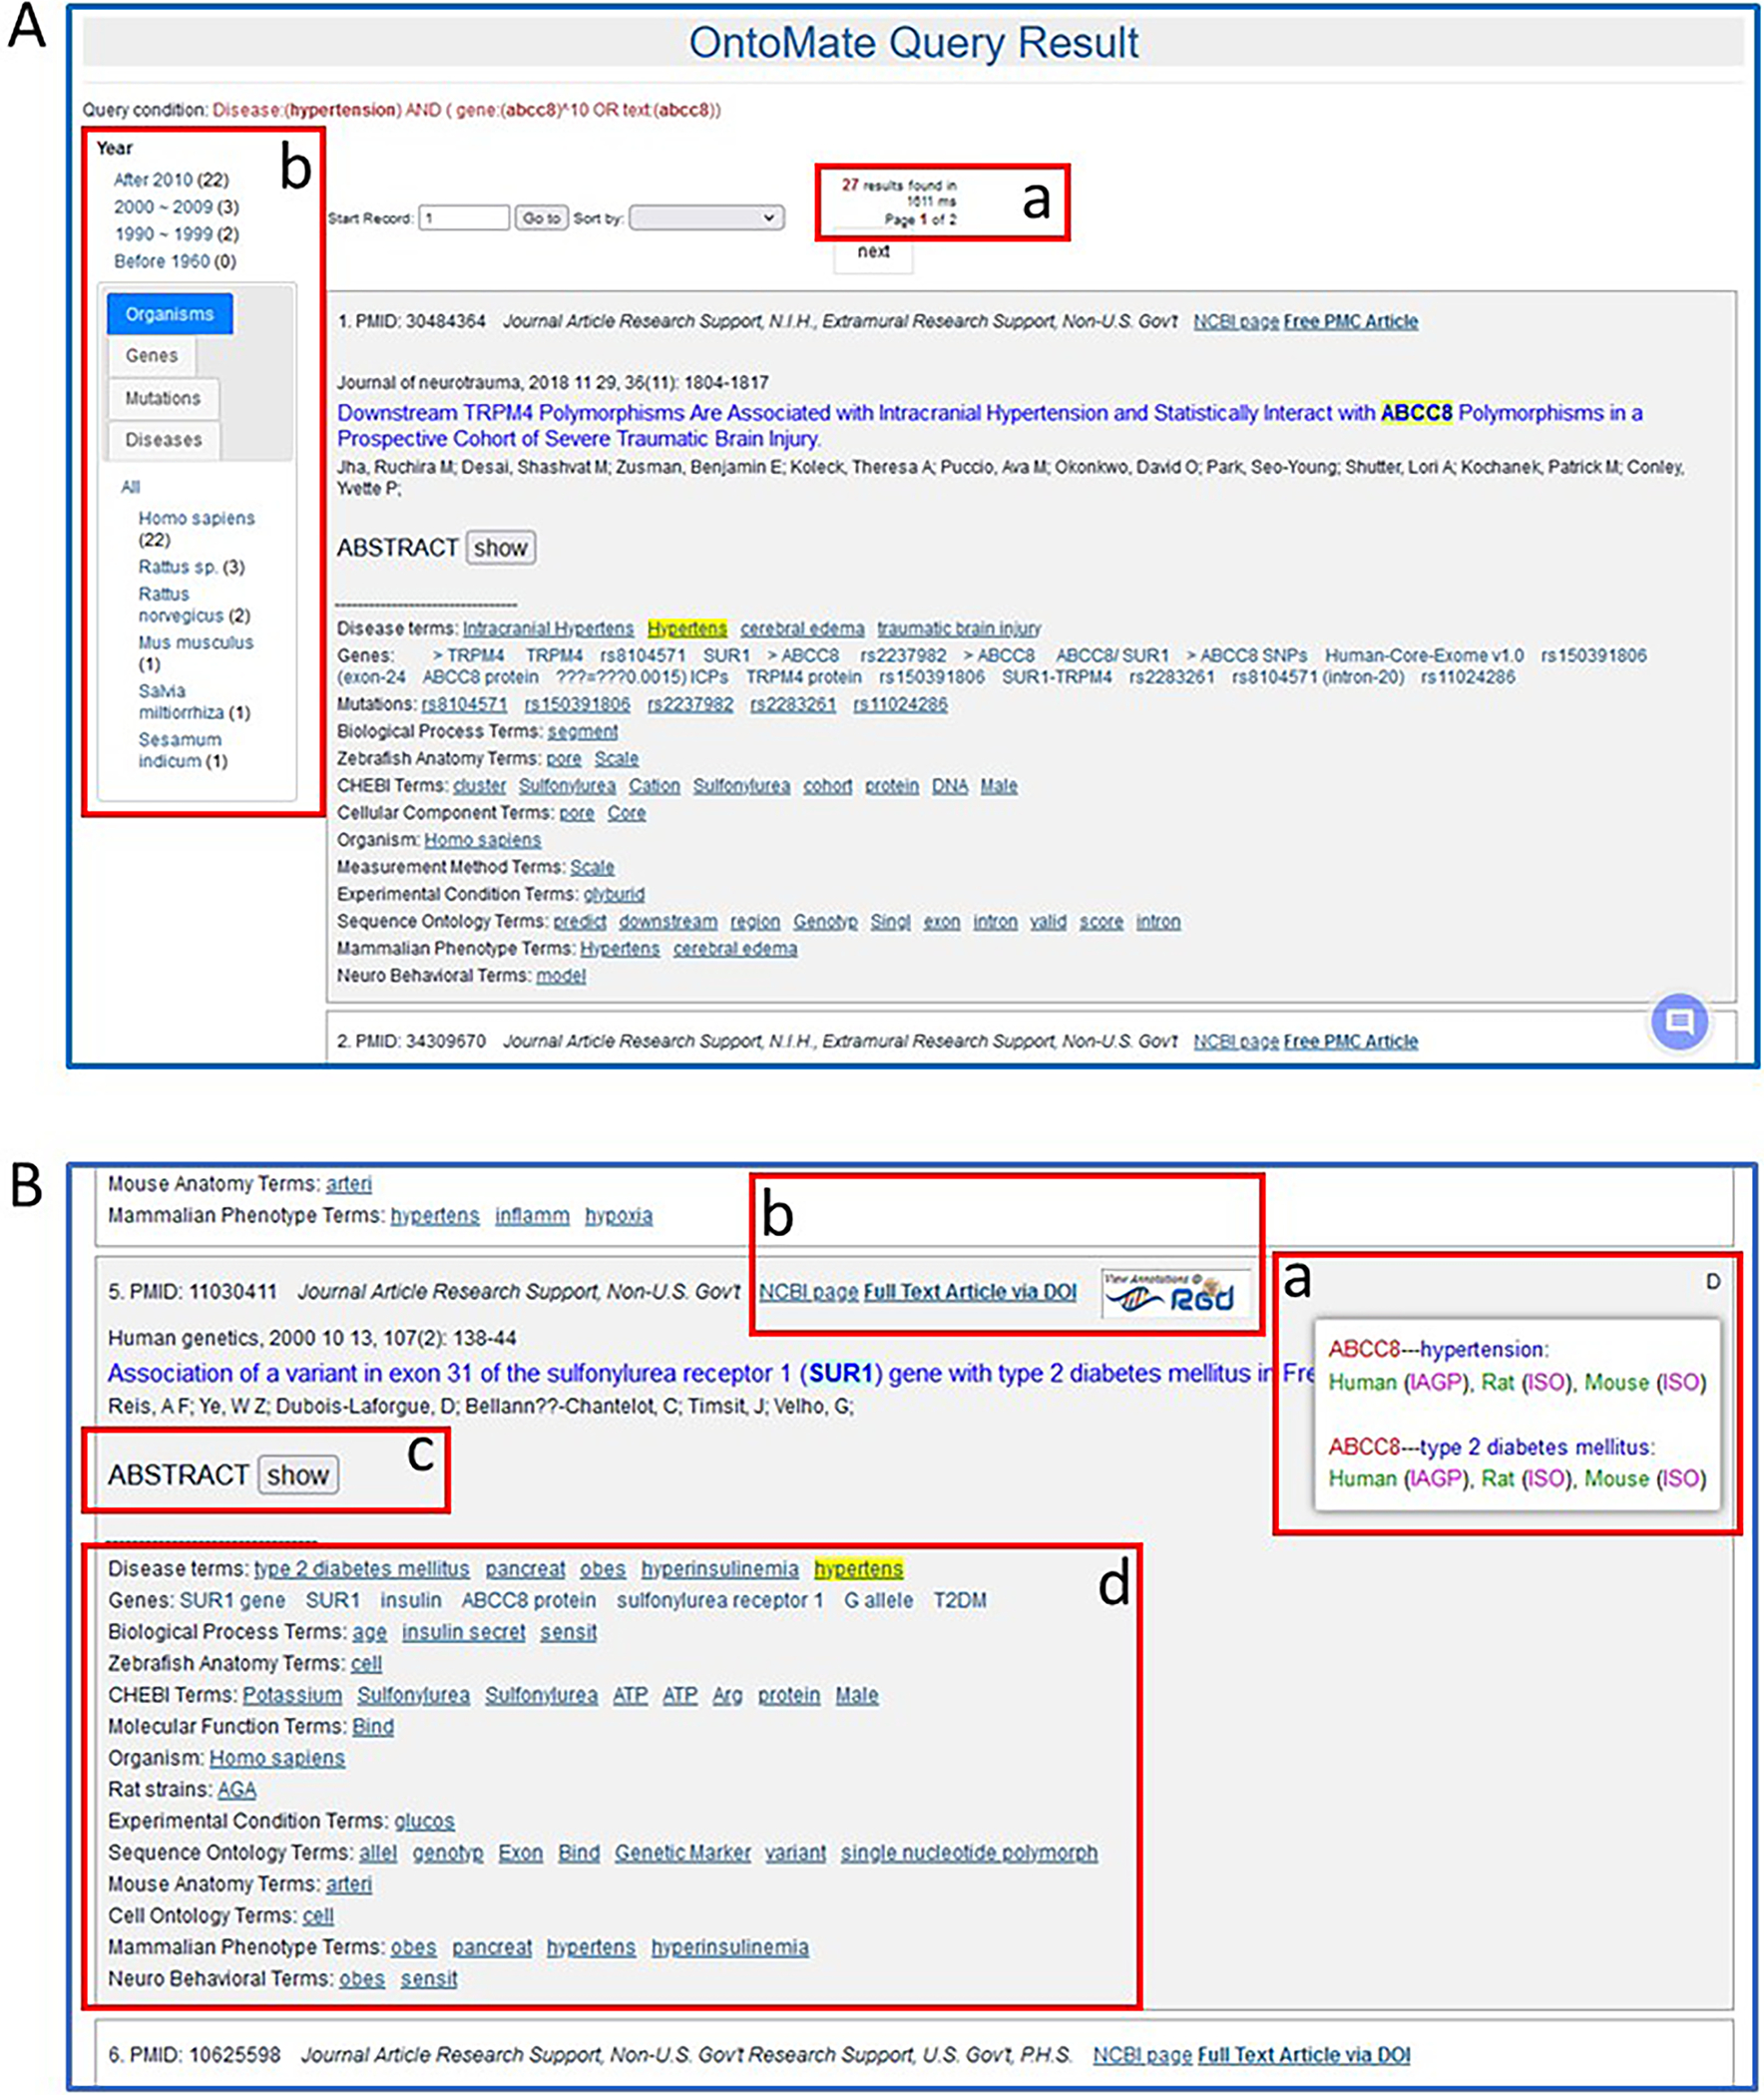
OntoMate results page for a search of “hypertension” and “Abcc8”. Various features are pointed out (A-a & b, B-a through B-d).
BASIC PROTOCOL 6
USING MOET TO FIND GENE-ONTOLOGY ENRICHMENT
The purpose of the MOET or the Multi-Ontology Enrichment Tool (Vedi, et al. 2022)( https://rgd.mcw.edu/rgdweb/enrichment/start.html), is to leverage curated data at RGD for analysis of gene or protein lists. Given a gene or protein list, MOET analysis identifies significantly overrepresented ontology terms using a hypergeometric test.
The data available in MOET comes from manual RGD literature curation, as well as imported data from external databases including the National Center for Biotechnology Information (NCBI), Mouse Genome Informatics (MGI), The Kyoto Encyclopedia of Genes and Genomes (KEGG), The Gene Ontology Consortium, UniProt-GOA, and others.
This protocol will show how users can find patterns of association among genes through ontology annotations.
Necessary Resources
Hardware
Computer with functioning Internet connection
Software
Web browser (Microsoft Edge, Mozilla Firefox, Google Chrome, or Apple Safari)
Protocol steps with step annotations
- From the RGD home page (https://rgd.mcw.edu/, Fig. 1), scroll over “Analysis & Visualization” on the menu bar at the top of the page and click on “Multi-Ontology Enrichment (MOET)”.Alternatively, MOET can be accessed by clicking the box labelled MOET on the left side of the homepage or from the menu bar dropdown on most RGD web pages.
- Click on the “Continue” button on the lower left side of the page (Fig. 23B–a) to run the analysis.In lieu of entering a list of gene or protein names/symbols/IDs, a specific region of the genome can be entered with chromosome, start and stop coordinates, and genome assembly at the bottom of the page (Fig. 23B–b).On the results page (the default is “rat” and “Disease Ontology) the gene symbols entered are listed above the enrichment results (Fig. 24A–a). The results are presented as a table (Fig. 24A–b) with the most highly used terms listed at the top, together with the number of annotated genes from the entered list, p value, Bonferroni Correction, and other parameters. The same data is shown in graph form (Fig. 24B) to the right of the table.
More analysis can be done on the same list of genes by clicking a different species (Fig. 24A–c) and/or selecting a different ontology (Fig. 24A–d) for the term enrichment.
Figure 23.
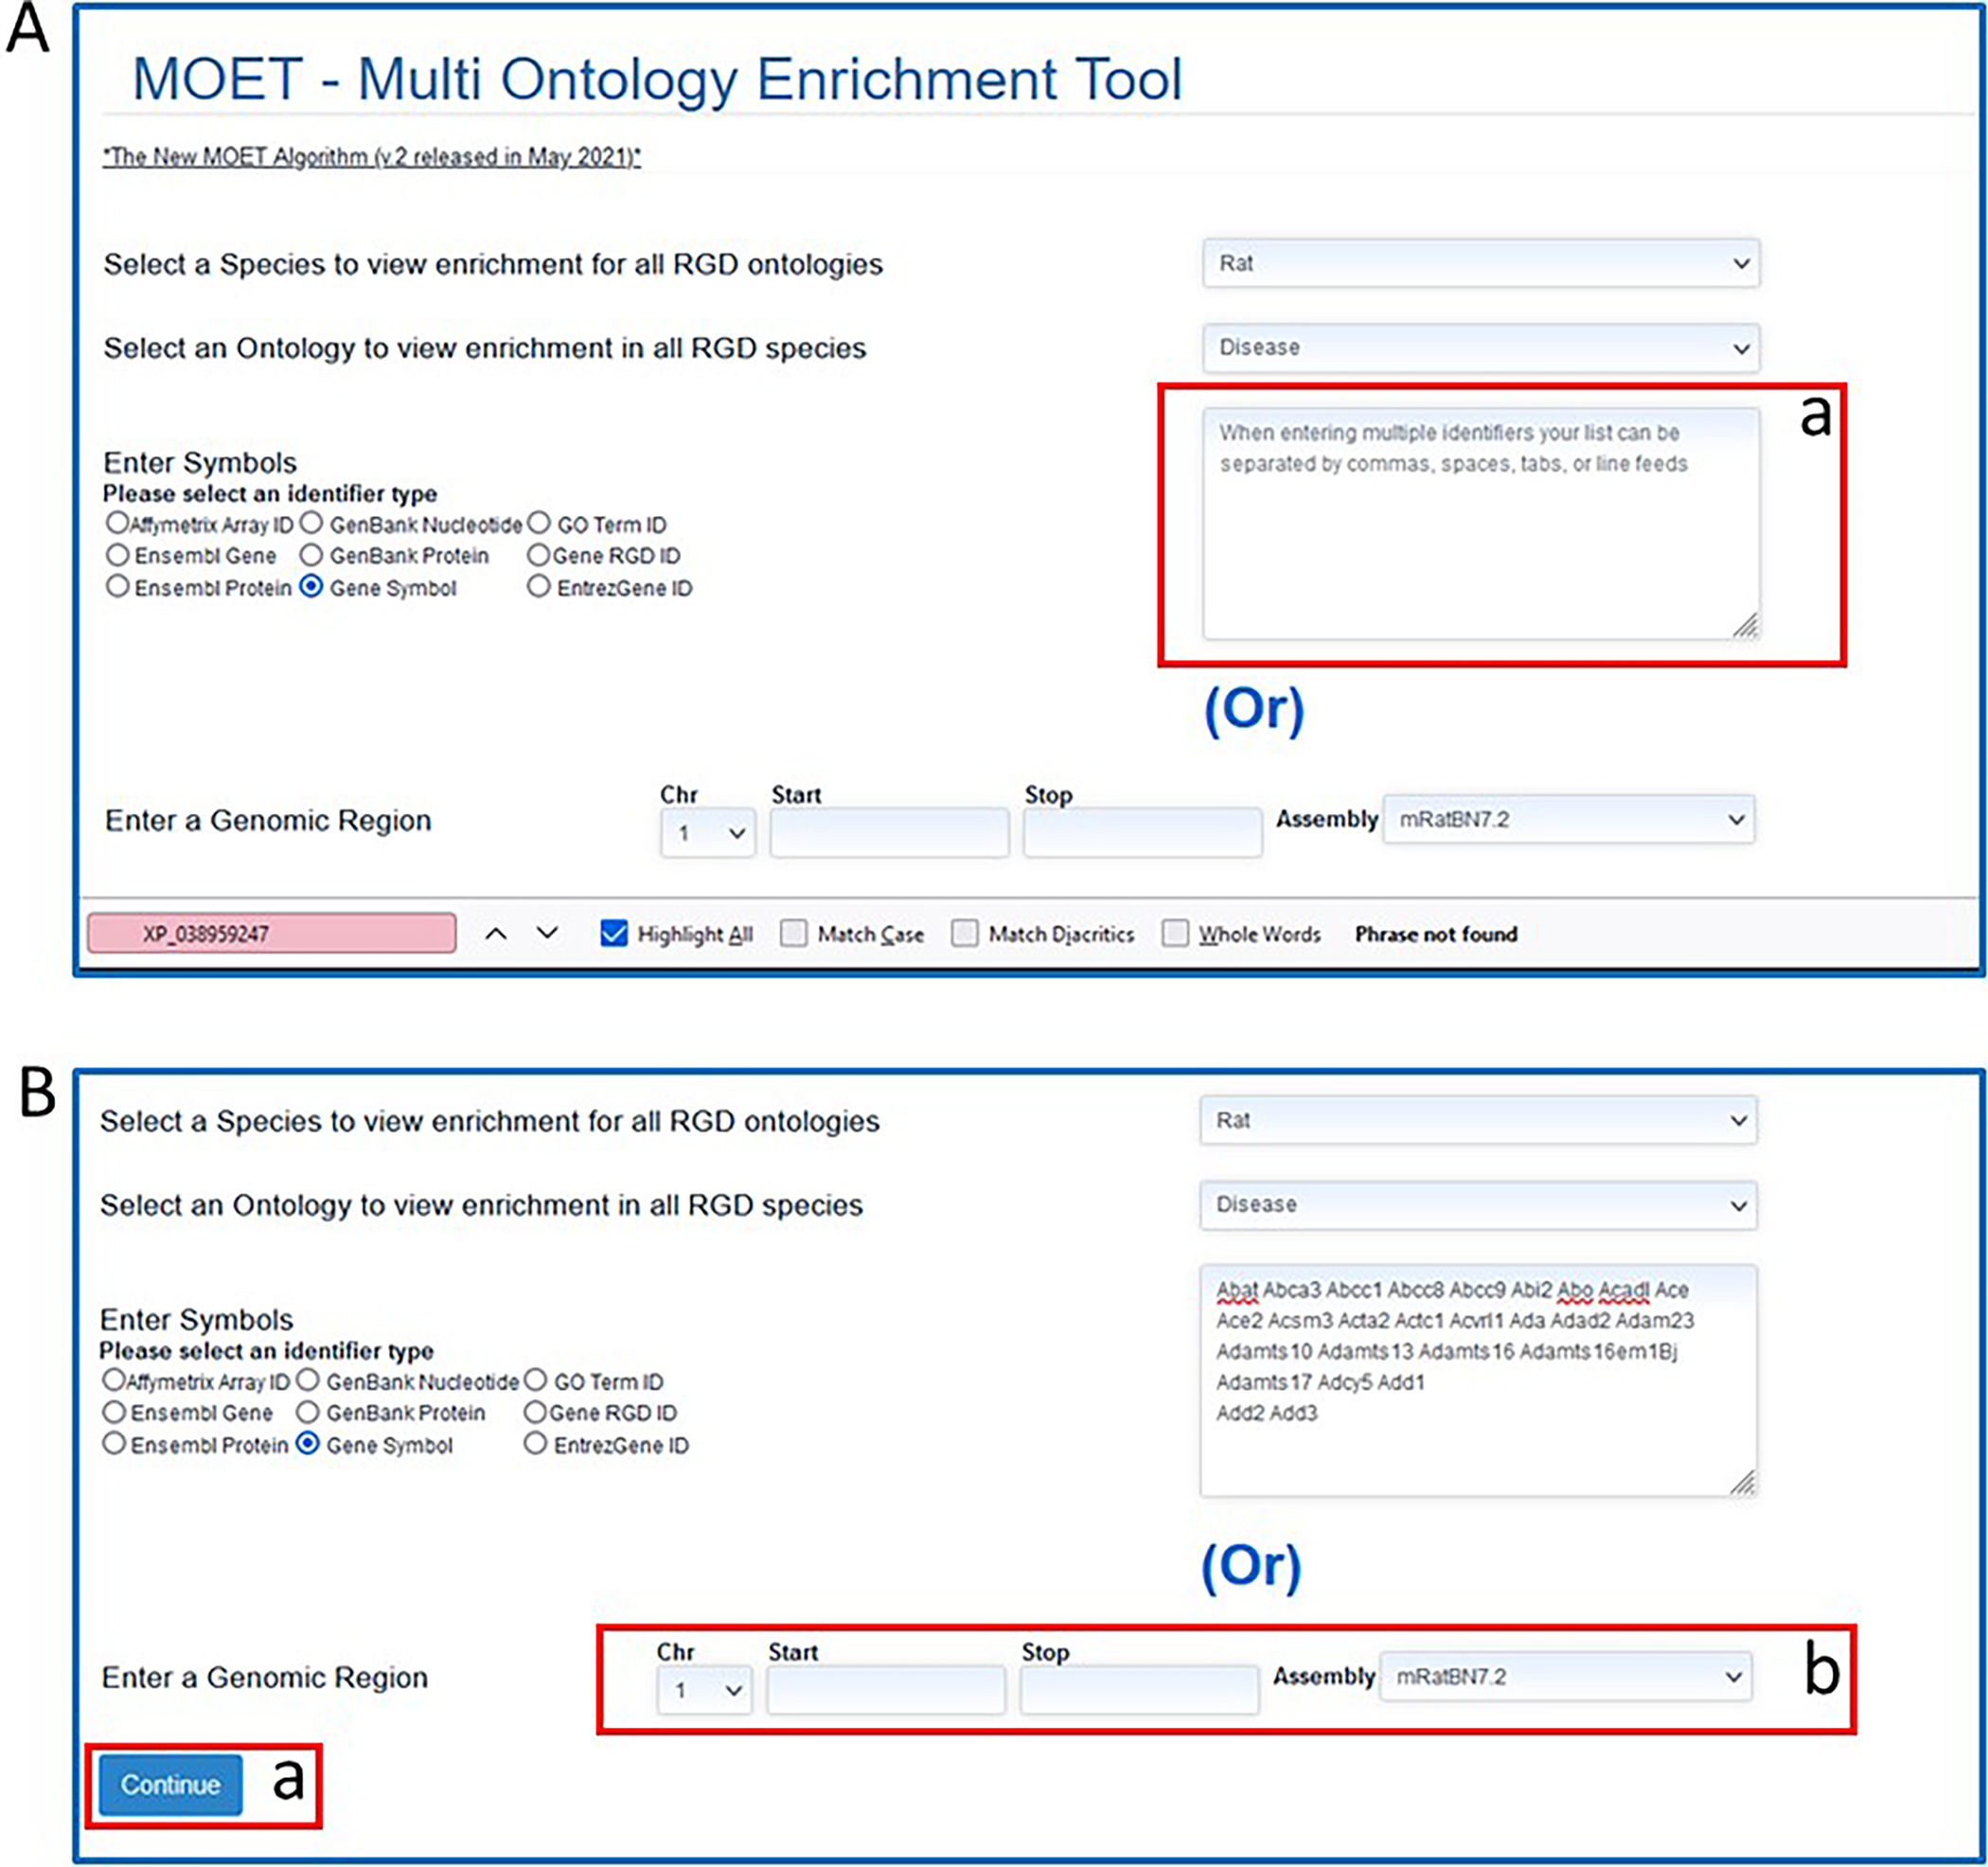
A. MOET tool homepage B. MOET homepage with gene list entered in textbox.
Figure 24.
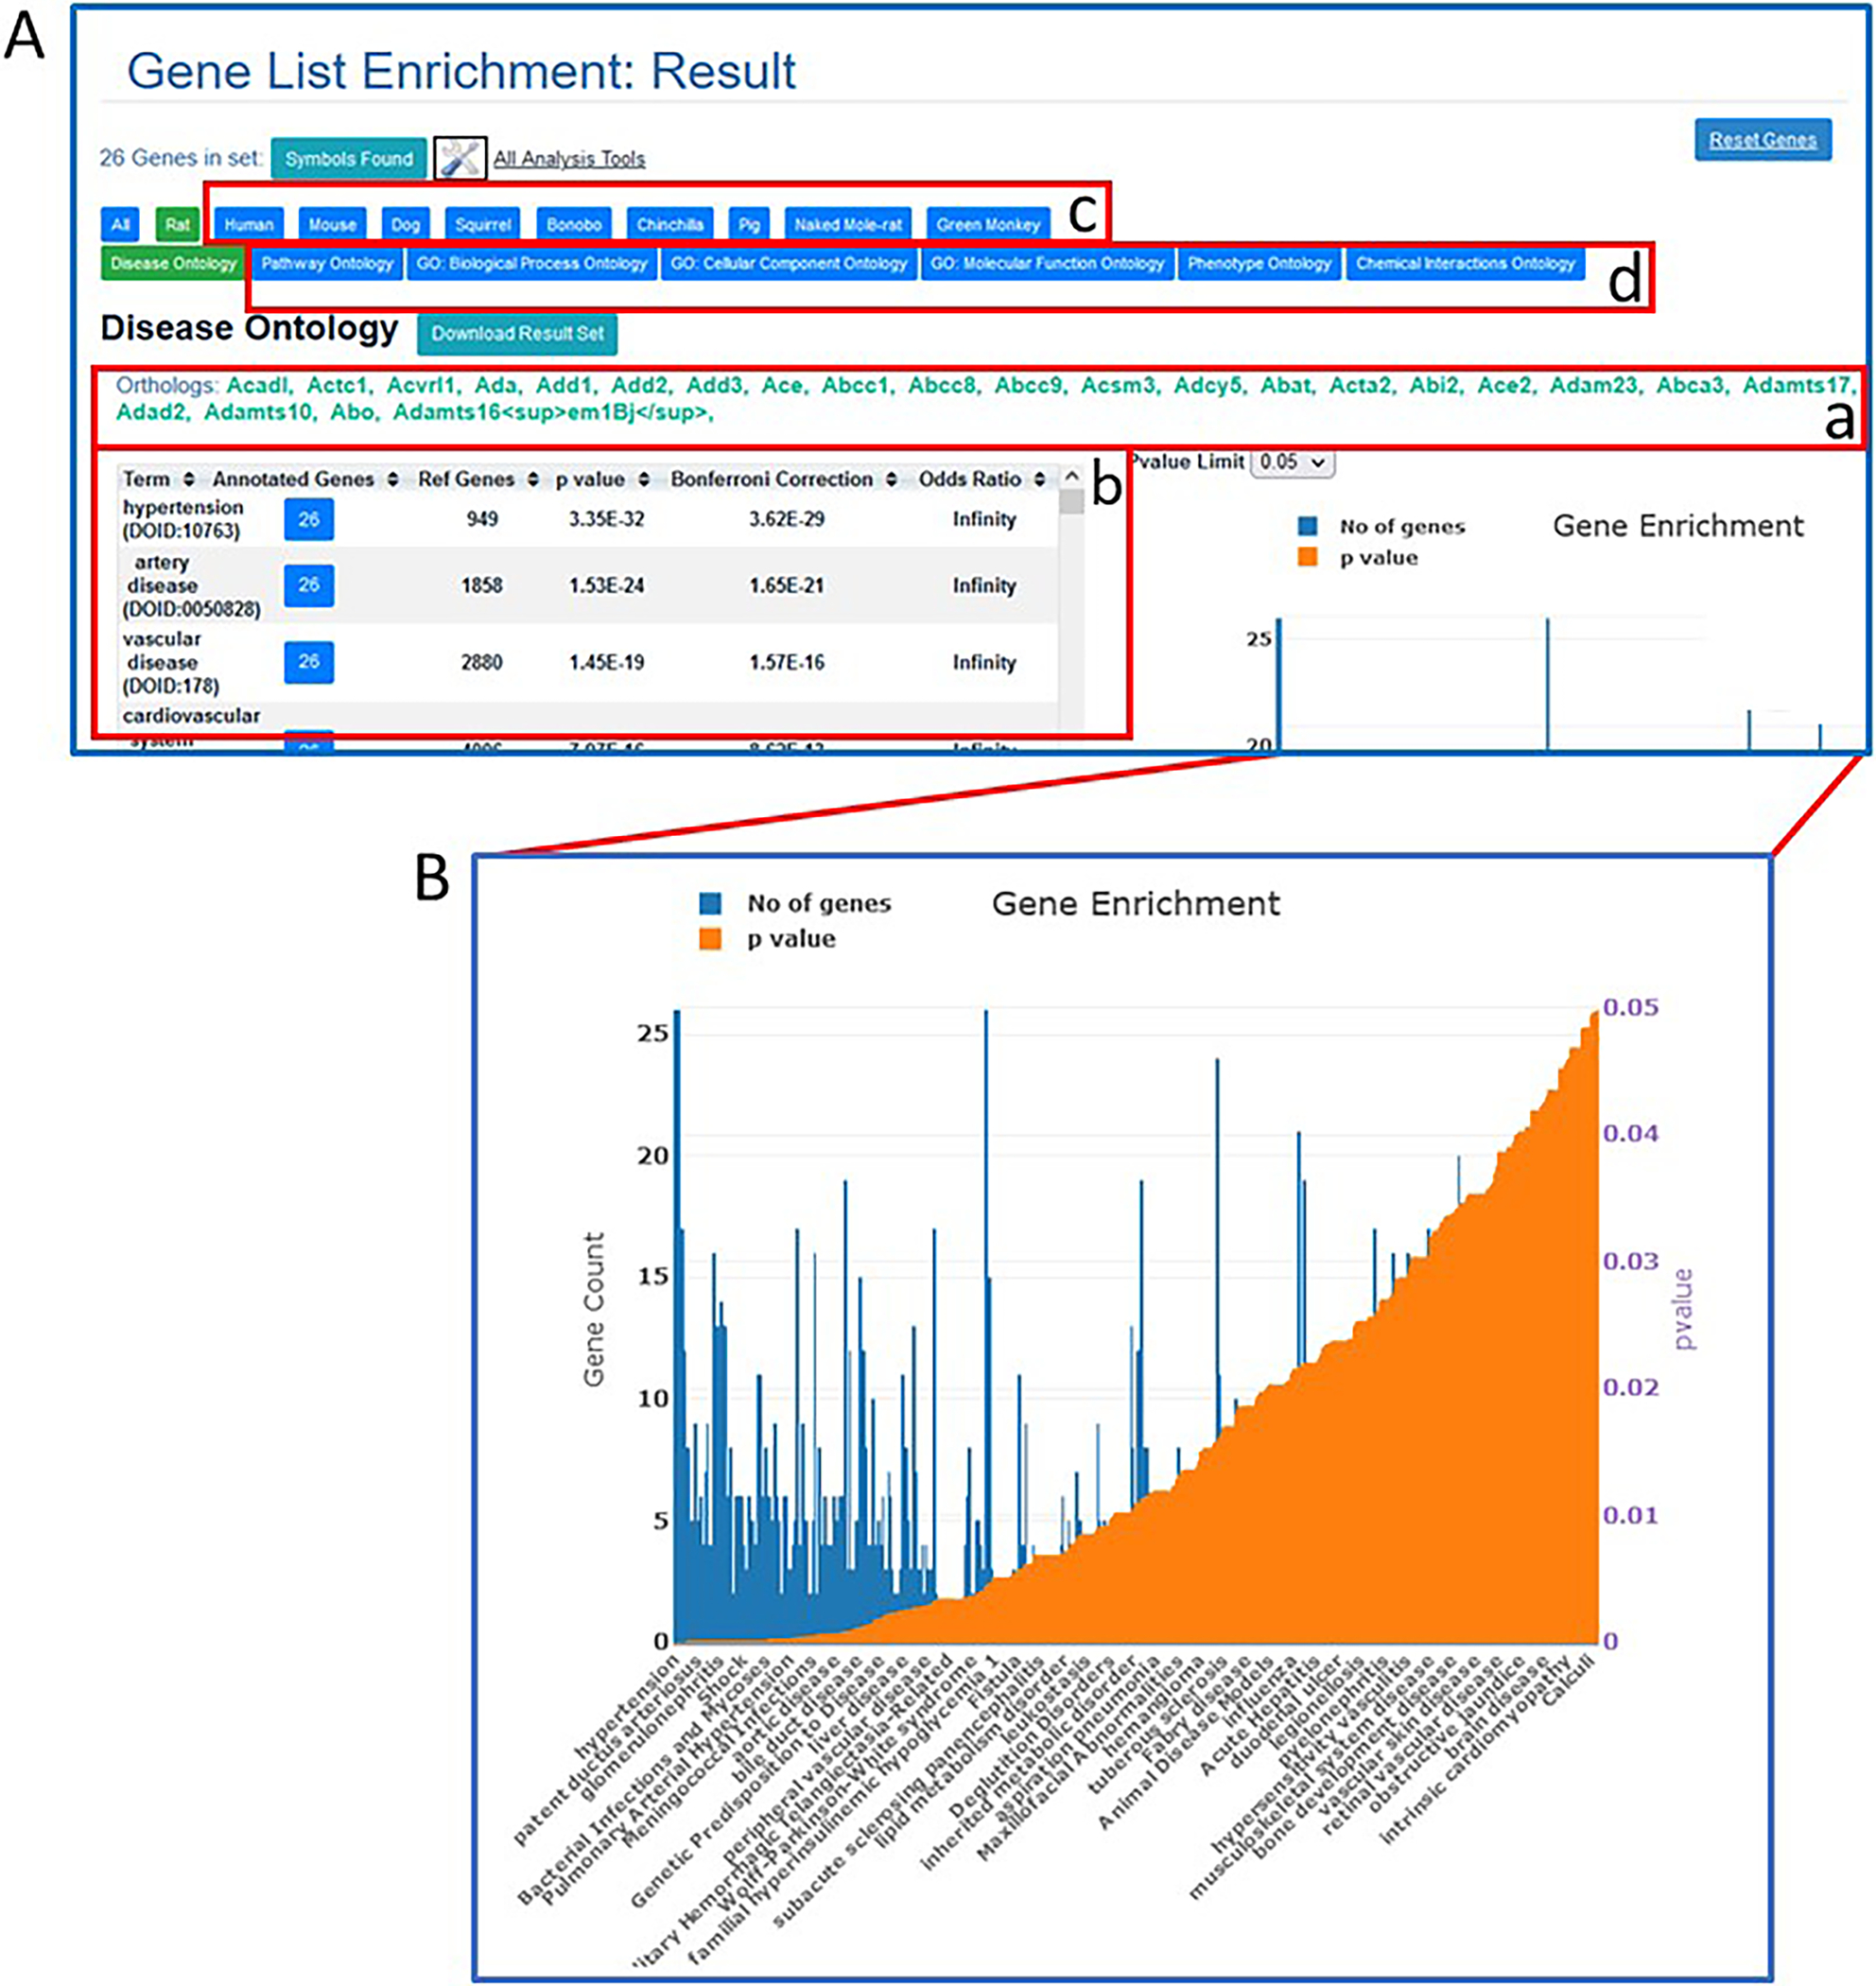
A. MOET results page with enrichment results for the entered rat gene list and Disease Ontology (default ontology view, table A-b). Data for orthologs in other species are accessed by the tabs shown in A-c. Data for the same genes in other ontologies are accessed by the tabs in A-d. B. Graph of results shown in table (A-b).
BASIC PROTOCOL 7
USING OLGA TO GENERATE GENE LISTS FOR ANALYSIS
The OLGA (object list generator) tool (Laulederkind, et al. 2018); https://rgd.mcw.edu/rgdweb/generator/list.html), at RGD allows the building of object lists for analysis of genes, QTLs, or rat strains. OLGA can find objects in RGD using any of RGD’s functional annotations or genomic positions.
The data available in OLGA comes from manual RGD literature curation, as well as imported data from external databases including the National Center for Biotechnology Information (NCBI), Mouse Genome Informatics (MGI), The Kyoto Encyclopedia of Genes and Genomes (KEGG), The Gene Ontology Consortium, UniProt-GOA, and others.
This protocol will show how users can generate a list of genes and analyze it.
Necessary Resources
Hardware
Computer with functioning Internet connection
Software
Web browser (Microsoft Edge, Mozilla Firefox, Google Chrome, or Apple Safari
Protocol steps with step annotations
- From the RGD homepage (https://rgd.mcw.edu/, Fig. 1), scroll over “Analysis & Visualization” on the menu bar at the top of the page and click on “OLGA (Gene List Generator)”.Alternatively, OLGA can be accessed by clicking the box labelled OLGA on the left side of the homepage or from the menu bar dropdown on most RGD web pages.
- Select “Ontology Annotation” at the top left of the OLGA homepage (Fig. 25A–a), followed by selecting “Disease Ontology” (Fig. 25B–a). Type “hypertension” in the autocomplete textbox that appears for Disease Ontology (Fig. 25C–a). Select “hypertension” and click the “continue” button (Fig. 25C–b) under the textbox to generate the gene list (Fig. 25D).The gene list returned is, by default, rat genes from rat genome assembly v7.2 (mRatBN7.2). Other results can be explored by changing the options in the drop-down menus at the top of the OLGA homepage. Other options are QTL or strain and genome assemblies of human, mouse, and other RGD species.
- Click “Add Another Gene List” (Fig. 25D–a) and proceed with “squamous cell carcinoma” as done with “hypertension”. On the results page select “intersection” (Fig. 26A–a). The consequent “Result Set” (Fig. 26B–a) is a list of genes found in both the “hypertension” list and the “squamous cell carcinoma” list.
Figure 25.
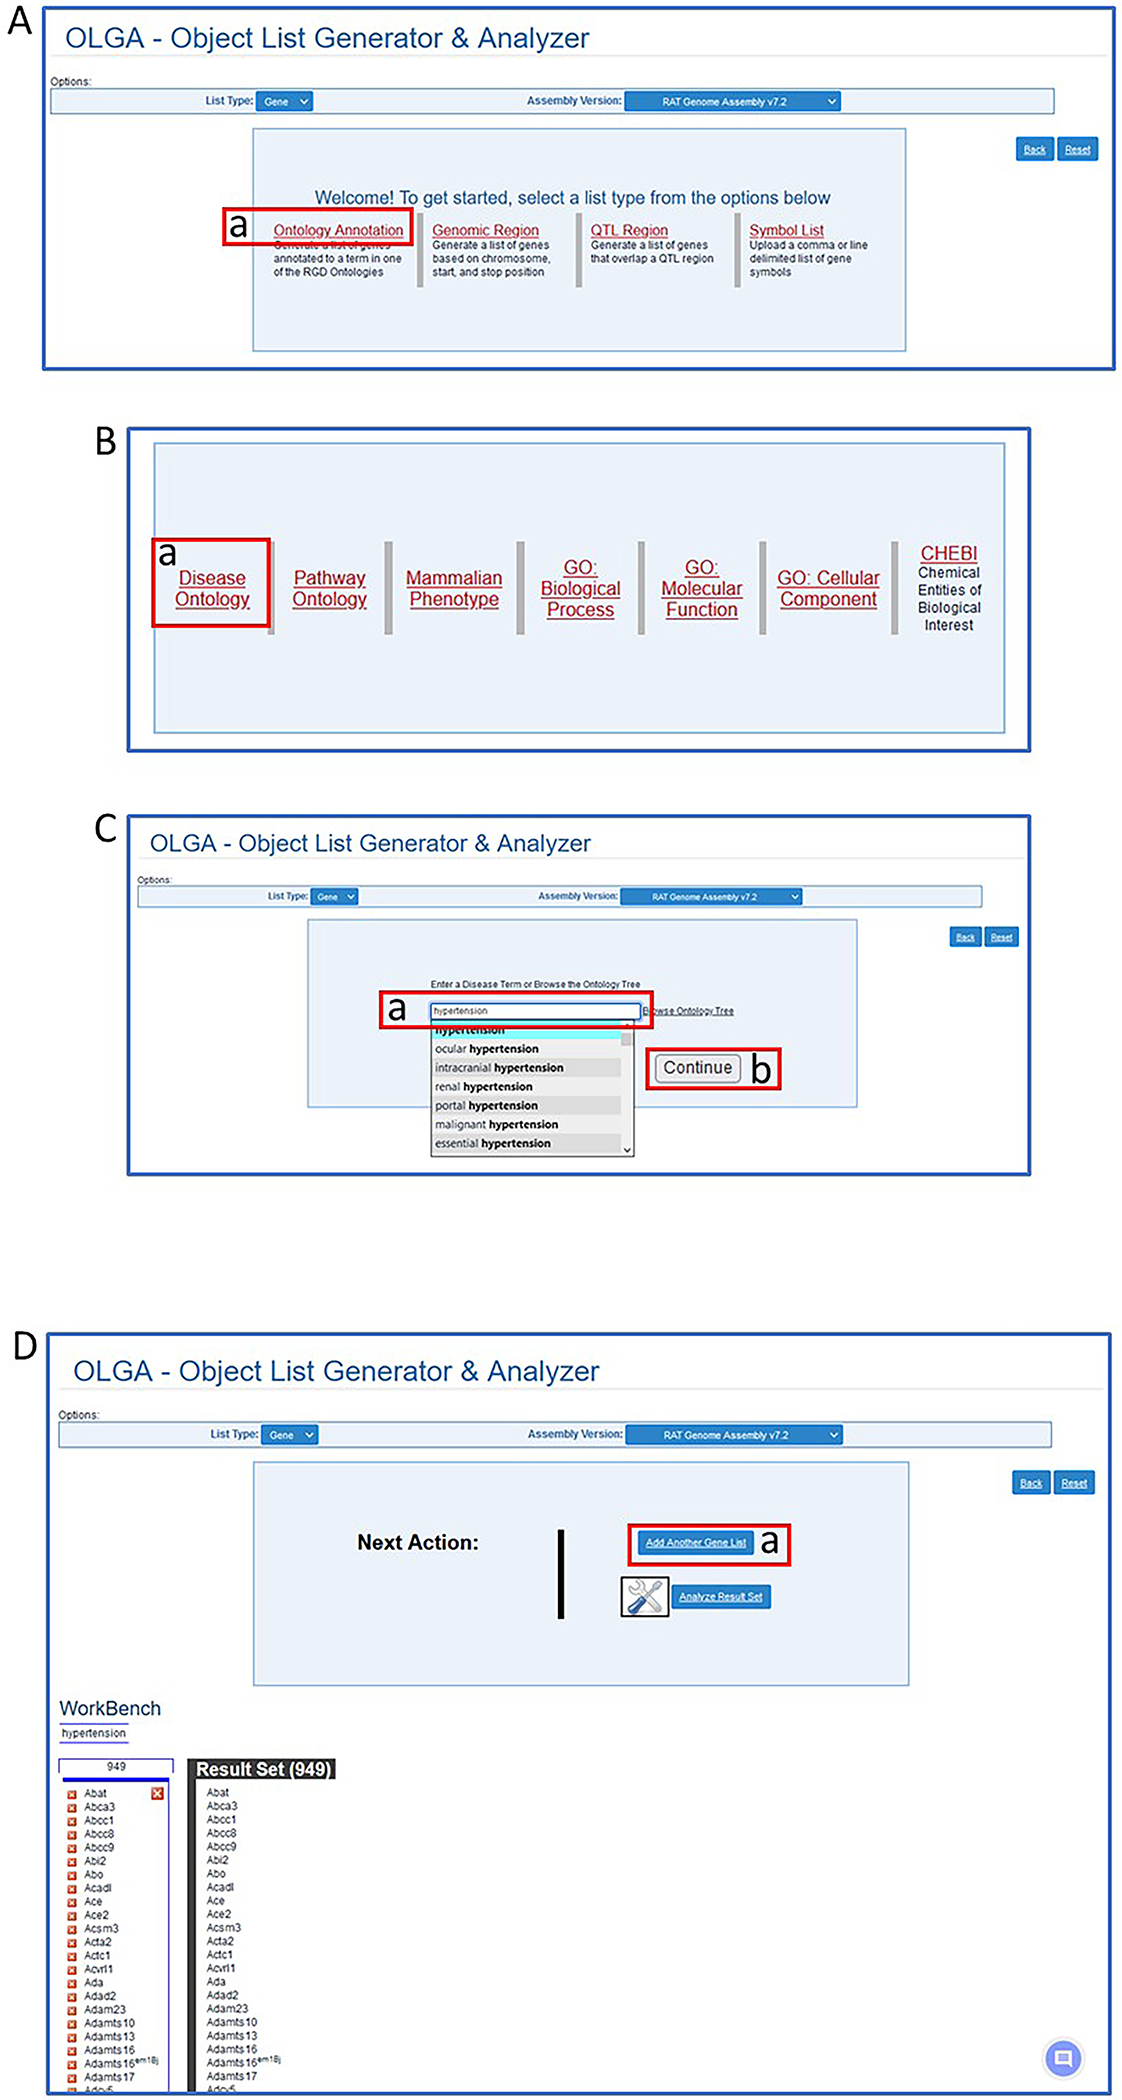
Steps in use of the OLGA tool. A. Selection of “Ontology Annotation”. B. Selection of “Disease Ontology”. C. Selection of “hypertension”. D. Preliminary results and selection of another list (D-a).
Figure 26.
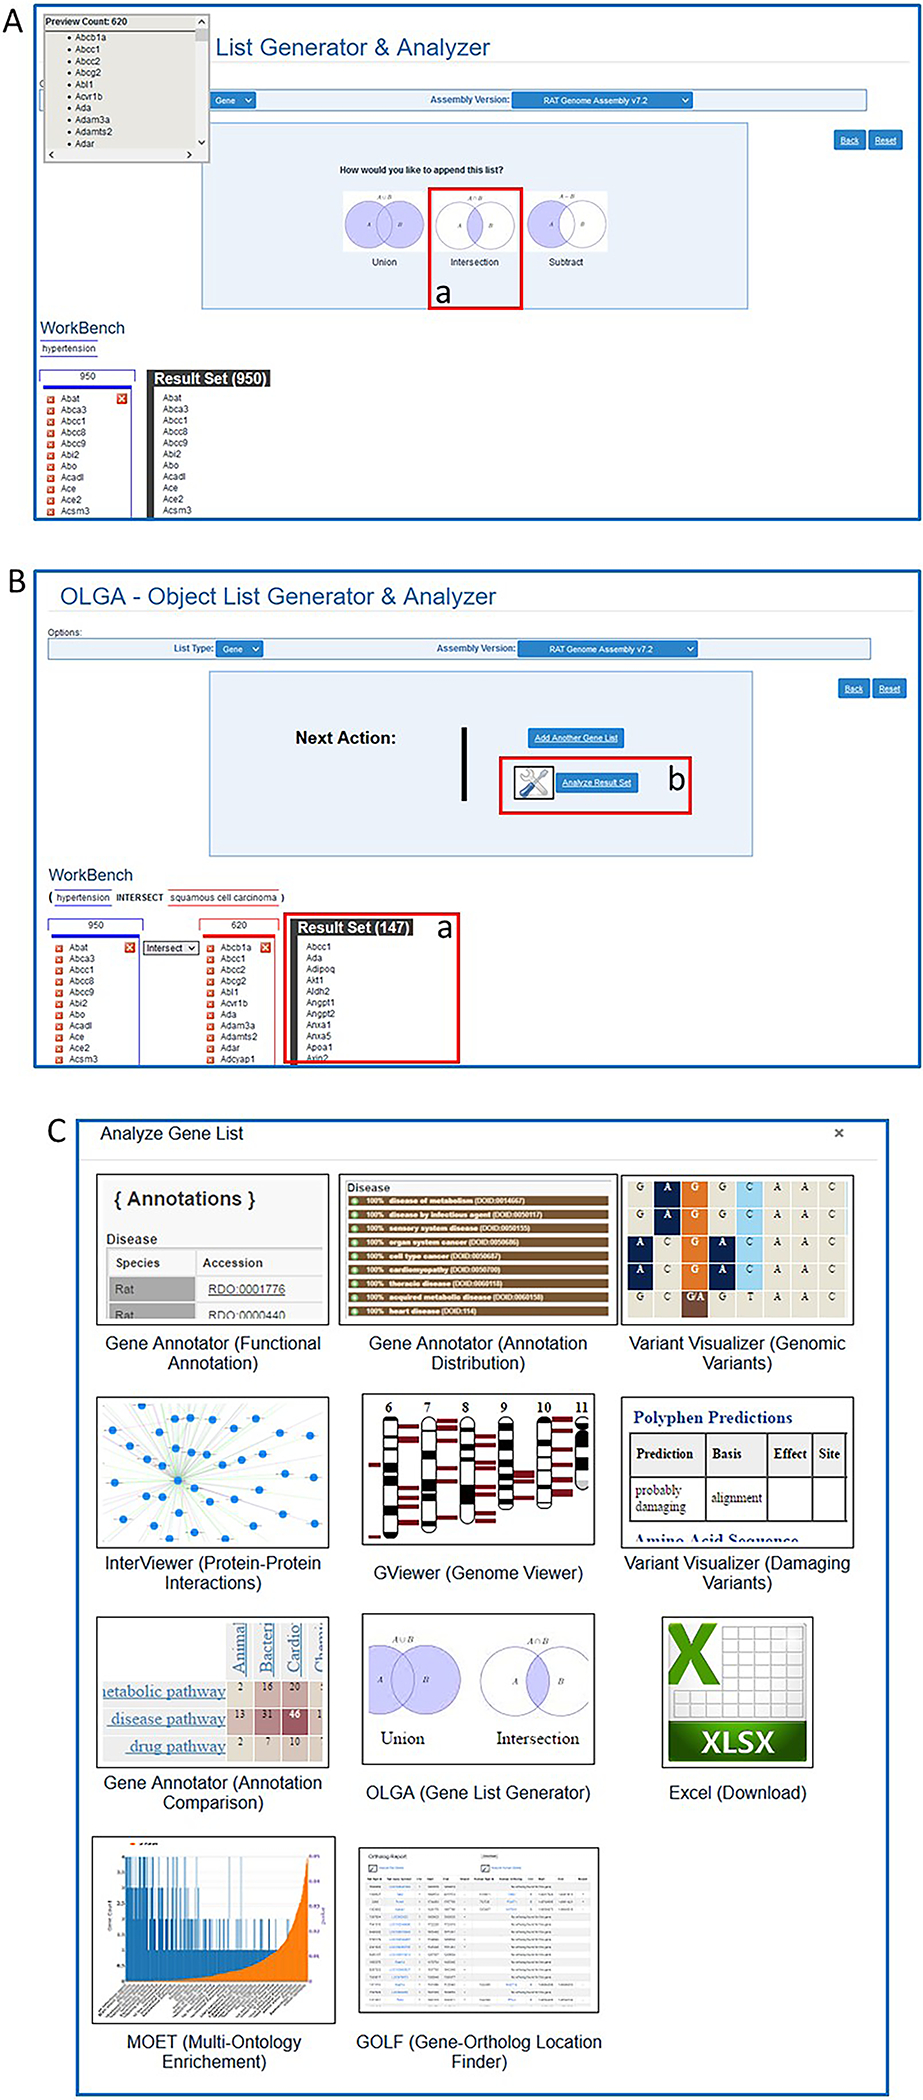
A. Further steps in OLGA tool for analysis of two gene lists. B. Final result of overlapping gene sets (B-a) and link to more analysis options (B-b). C. Page of links to other RGD tools for further analysis of final gene result list.
BASIC PROTOCOL 8
USING THE GA TOOL TO ANALYZE ONTOLOGY ANNOTATIONS FOR GENES
The purpose of the Gene Annotator (GA tool) (Laulederkind, et al. 2019); https://rgd.mcw.edu/rgdweb/generator/list.html), is to take a list of identifiers or a chromosomal region and retrieve gene annotation data stored at RGD. The tool retrieves annotations for rat genes and their orthologs, as well as additional information.
The analysis function of the tool allows an enrichment type view of the data and a cross-ontology comparison of annotations for the list of genes.
This protocol will show how users can analyze genes via the annotations made to those genes.
Necessary Resources
Hardware
Computer with functioning Internet connection
Software
Web browser (Microsoft Edge, Mozilla Firefox, Google Chrome, or Apple Safari
Protocol steps with step annotations
- From the RGD homepage (https://rgd.mcw.edu/, Fig. 1), hover over “Analysis & Visualization” on the menu bar at the top of the page and click on “Gene Annotator”.Alternatively, the Gene Annotator can be accessed by clicking the box labelled “GA Tool” on the lower center of the homepage or from the menu bar dropdown on most RGD Web pages.
- In the large text box in the center side of the page (Fig. 27A), enter the following list of gene symbols:Abat Abca3 Abcc1 Abcc8 Abcc9 Abi2 Abo Acadl Ace Ace2 Acsm3 Acta2 Actc1 Acvrl1 Ada Adad2 Adam23 Adamts10 Adamts13 Adamts16 Adamts16em1Bj Adamts17 Adcy5 Add1 Add2 Add3
-
The first GA page after a search is a selection page where the user chooses amongst species, annotations, and external links. The tool retrieves annotations across many ontologies for genes and their orthologs, as well as links to other information.
Deselect all the ontology annotation categories except “disease” (Fig. 27B–a). Deselect all the “External Links” by clicking “(toggle)” (Fig. 27B–b). Deselect all species under “Select Orthologs” except Human and Mouse (Fig. 27B–c).
- From the list of links at the top of the page, select “Annotation Distribution” (Fig. 27C–b) for an enrichment analysis-type of view (Fig. 28A) of the whole list of genes submitted.The “Annotation Distribution” lists all ontology terms assigned to genes in the list and reports what percentage of the genes in the list are annotated to that term.
- Click the “+” beside any term to toggle a list of the genes annotated with that term and/or its children term(s) (Fig. 28B–a).The gene symbols in the toggled list link to the “Annotations” page of the GA tool for that gene and its orthologs. The “Explore this Gene Set” link at the top right of the toggled list refreshes the whole page with just the subset of genes from the toggled list.
- Select “Comparison Heat Map” (Fig. 28B–b) to see a cross-ontology analysis of the gene list. The map shows by number/color density how many genes are annotated with two terms from two ontologies (horizontal and vertical axis) (Fig. 29).The default heat map view compares disease terms versus pathway terms associated with all genes in the submitted list. Any other ontology comparisons can be made by using the drop-down menus to the upper left of the heat map (Fig. 29-a). Clicking on any of the terms labeling the rows or columns of the heat map will display a subset that only shows child terms of the selected term. By clicking any numbered square in the heat map, a list of all genes annotated to both intersecting terms will be displayed.
- Select “All Analysis Tools” (Fig. 29-b) to see a pop-up window (Fig. 27C) with options to send the gene list from the GA tool to another analysis tool at RGD.The option of sending data object lists to other tools via the “All Analysis Tools” choice is on many of the RGD pages that feature individual analysis tools.
Figure 27.

A. GA tool homepage with sample gene list entered in textbox and option of entering genomic region (A-b). B. Selection page for annotation ontologies, external links, and orthologs desired in search result. C. Result page with annotations for entered gene list (C-a) and further options for results display (C-b).
Figure 28.
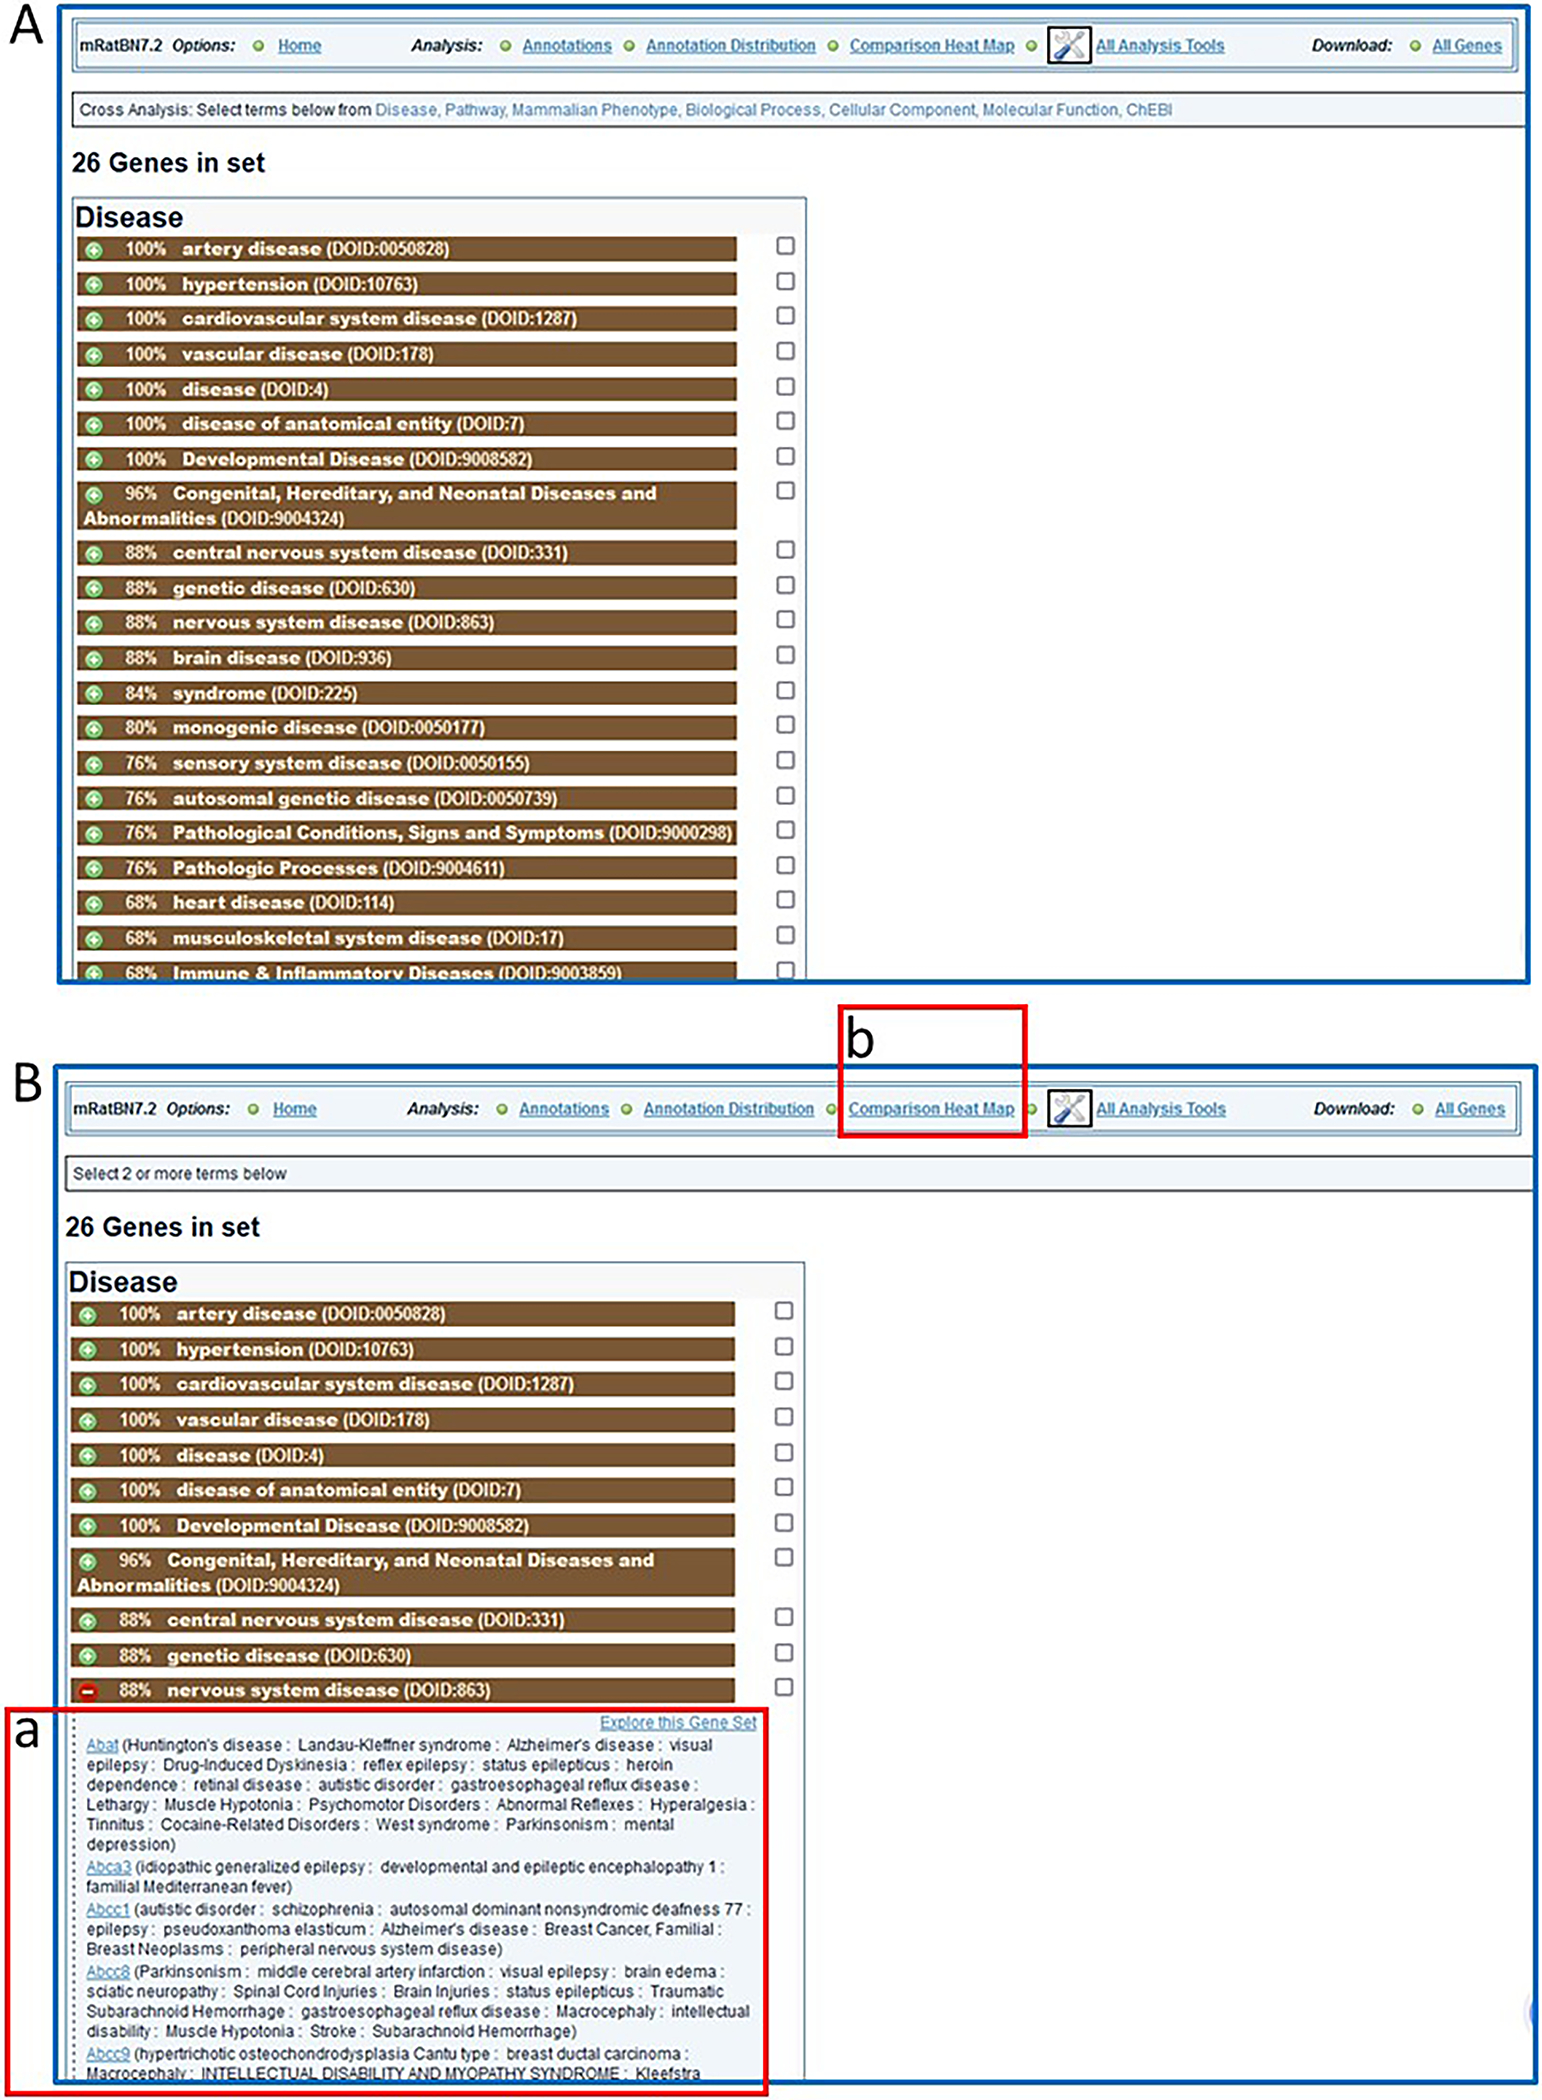
A. Display of “Annotation Distribution” (enrichment-type analysis). B. Details for genes associated with one of the disease terms (nervous system disease, B-a) in the list and link (B-b) to “Comparison Heat Map” analysis.
Figure 29.
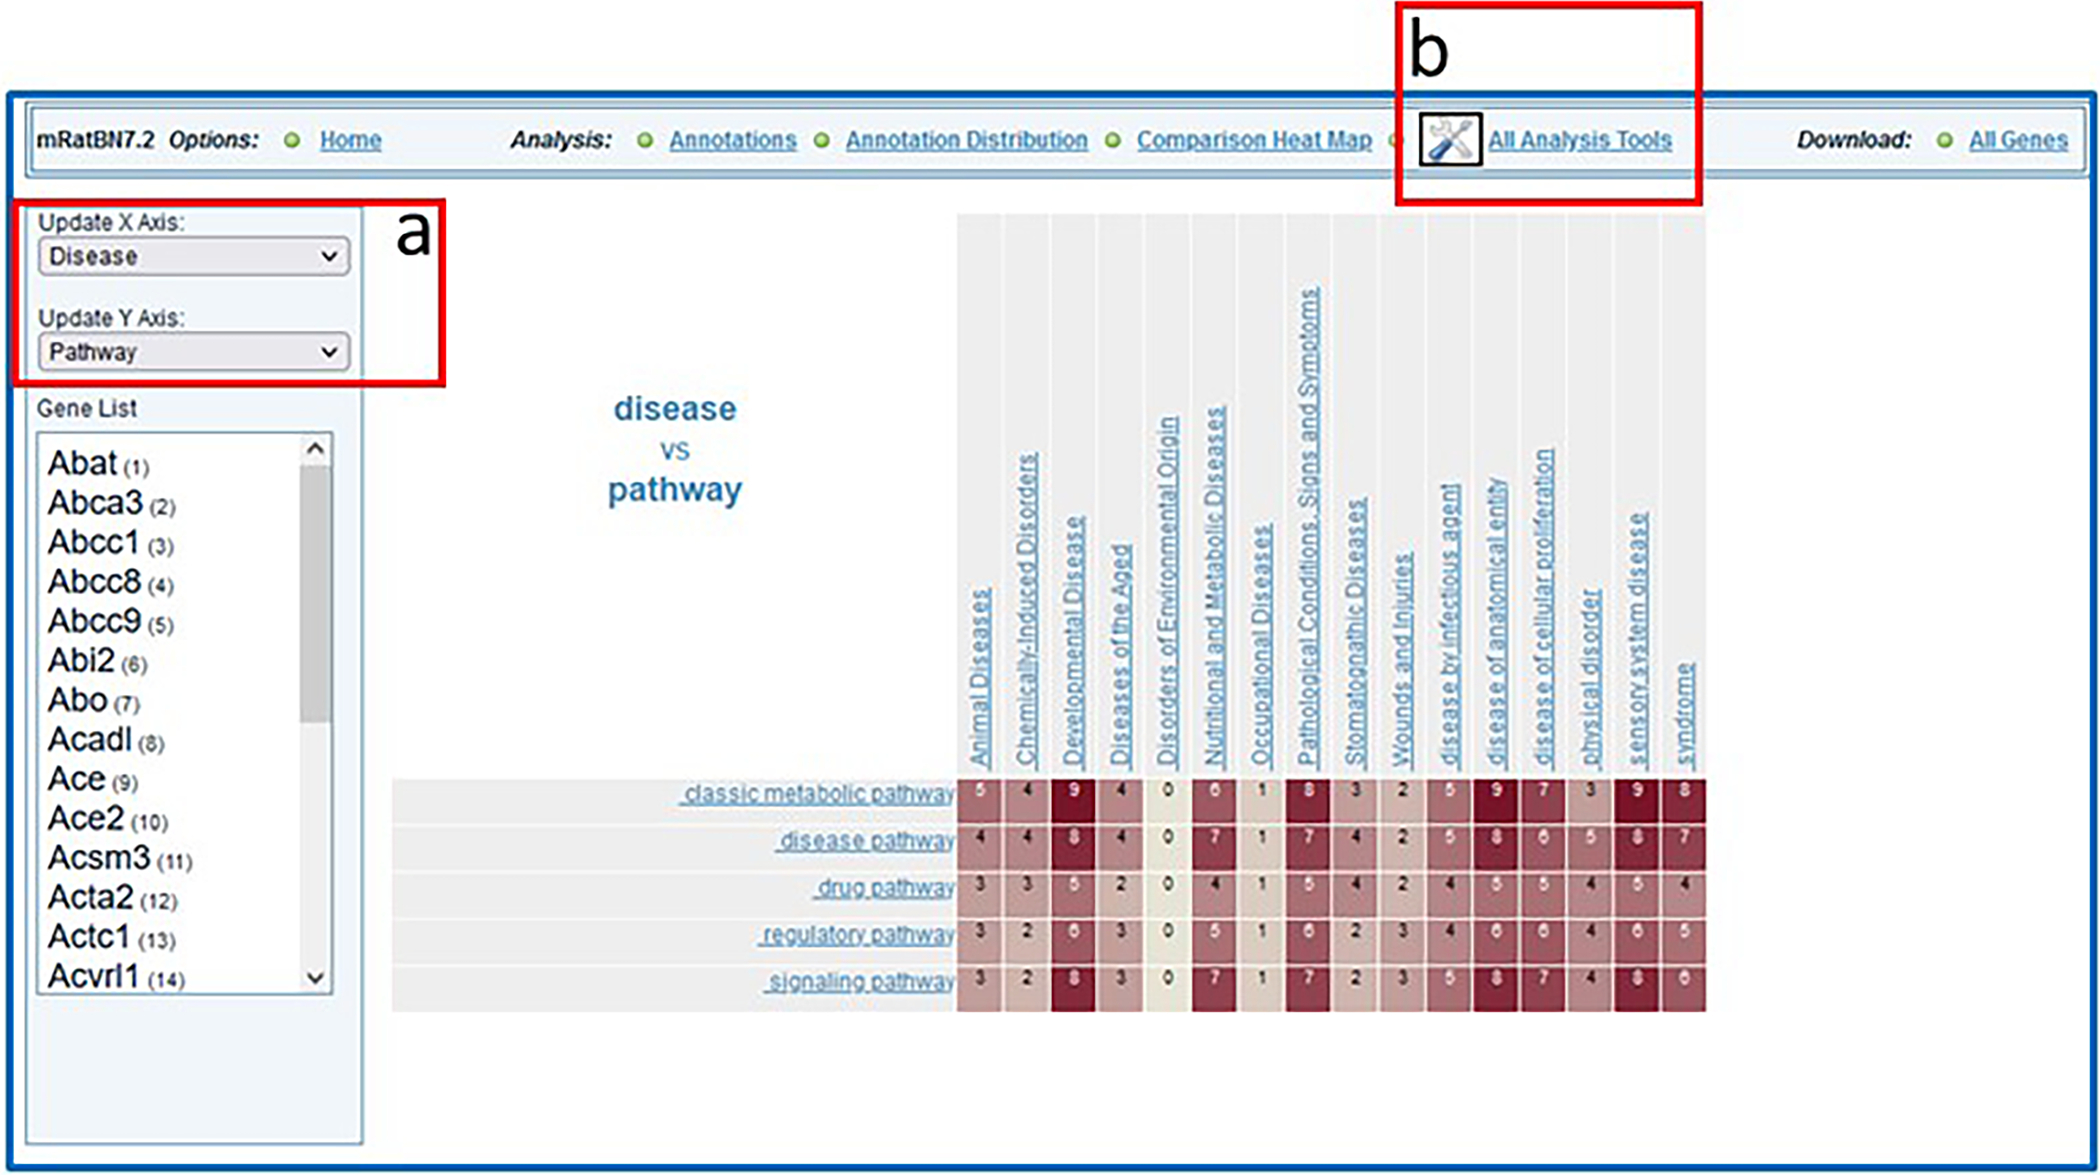
Display of “Comparison Heat Map” results from data entered in Figure 27 with viewing options (29-a) and a link (29-b) to additional analysis tools.
BASIC PROTOCOL 9
USING THE RGD INTERVIEWER TOOL TO FIND PROTEIN INTERACTION DATA
InterViewer, RGD’s Cytoscape-based (https://www.cytoscape.org/) (Shannon, et al. 2003) protein–protein interaction visualization software, takes gene or protein symbols and/or IDs for rat, mouse, human, and/or dog and creates an interactive display of pairwise protein interactions for them. Information about the interactions, links to the associated genes in RGD, and links to the originating interaction records at IMEX (Orchard, et al. 2012) (Orchard, et al. 2014) are provided.
Necessary Resources
Hardware
Computer with functioning Internet connection
Software
Web browser (Microsoft Edge, Mozilla Firefox, Google Chrome, or Apple Safari
Protocol steps with step annotations
- On the RGD homepage (https://rgd.mcw.edu/, Fig. 1), hover over “Analysis & Visualization” on the menu bar at the top of the page and click on “Interviewer (Protein-Protein Interactions)”.This action leads to the Interviewer homepage (Fig. 30). The Interviewer can also be accessed by clicking on the box labelled “Interviewer Protein-Protein Interactions” in the lower left-center of the RGD homepage.
- In the large text box on the left-center of the page (Fig. 30-a), enter the gene “Acadl”.More than one gene name/protein name/identifier may be entered at the same time.
- Click the “Submit” button on the lower left side of the page to see the protein-protein interaction results for the gene (Fig. 31A).
- Click on the red circle in the center of the largest interaction graphic (Fig. 31B). This action highlights all the nodes in the interaction group and enlarges the labels. Also, this action generates a detail box in the details/control frame (Fig. 31B–a), which gives information about the protein and provides a link to the UniProt page for that protein.Clicking on any circle in the display generates a detail box in the details/control frame, which gives information about the protein and provides a link to the UniProt page for that protein. The interaction edges between circles can also be clicked. Again, a detail box appears with information about the specific interaction. A link to the PubMed source(s) of information is included.
On the upper right-hand side of the page, click “Report” to see an option to print the graphic display with the data table or “Graph PNG” to see an option to print the graphic display alone (Fig. 31B–b). A download link for the interactions list is available at the upper right side of the table (Fig. 31B–c).
Figure 30.
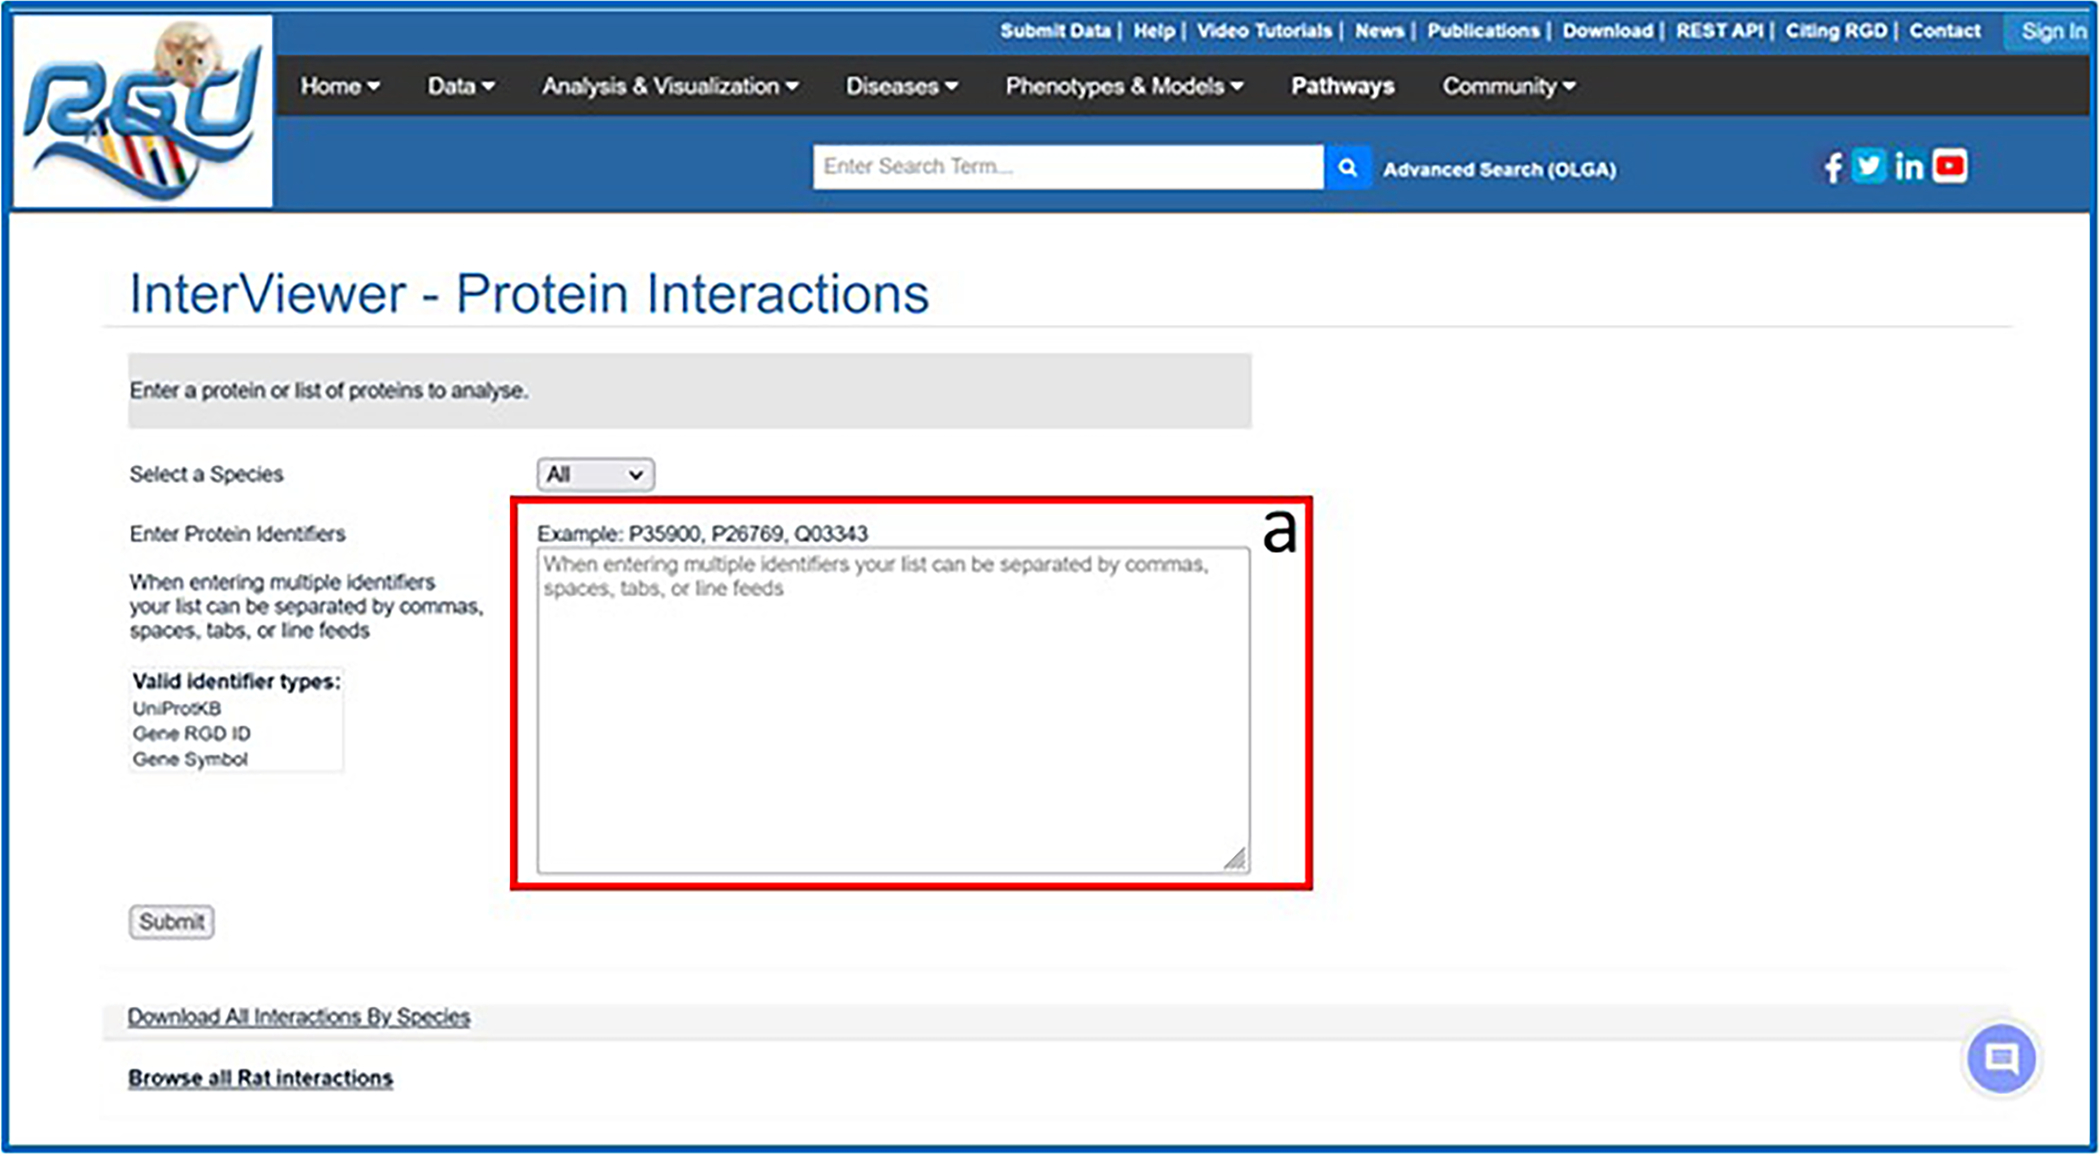
The Interviewer homepage with textbox (30-a) for entering protein/gene identifiers.
Figure 31.
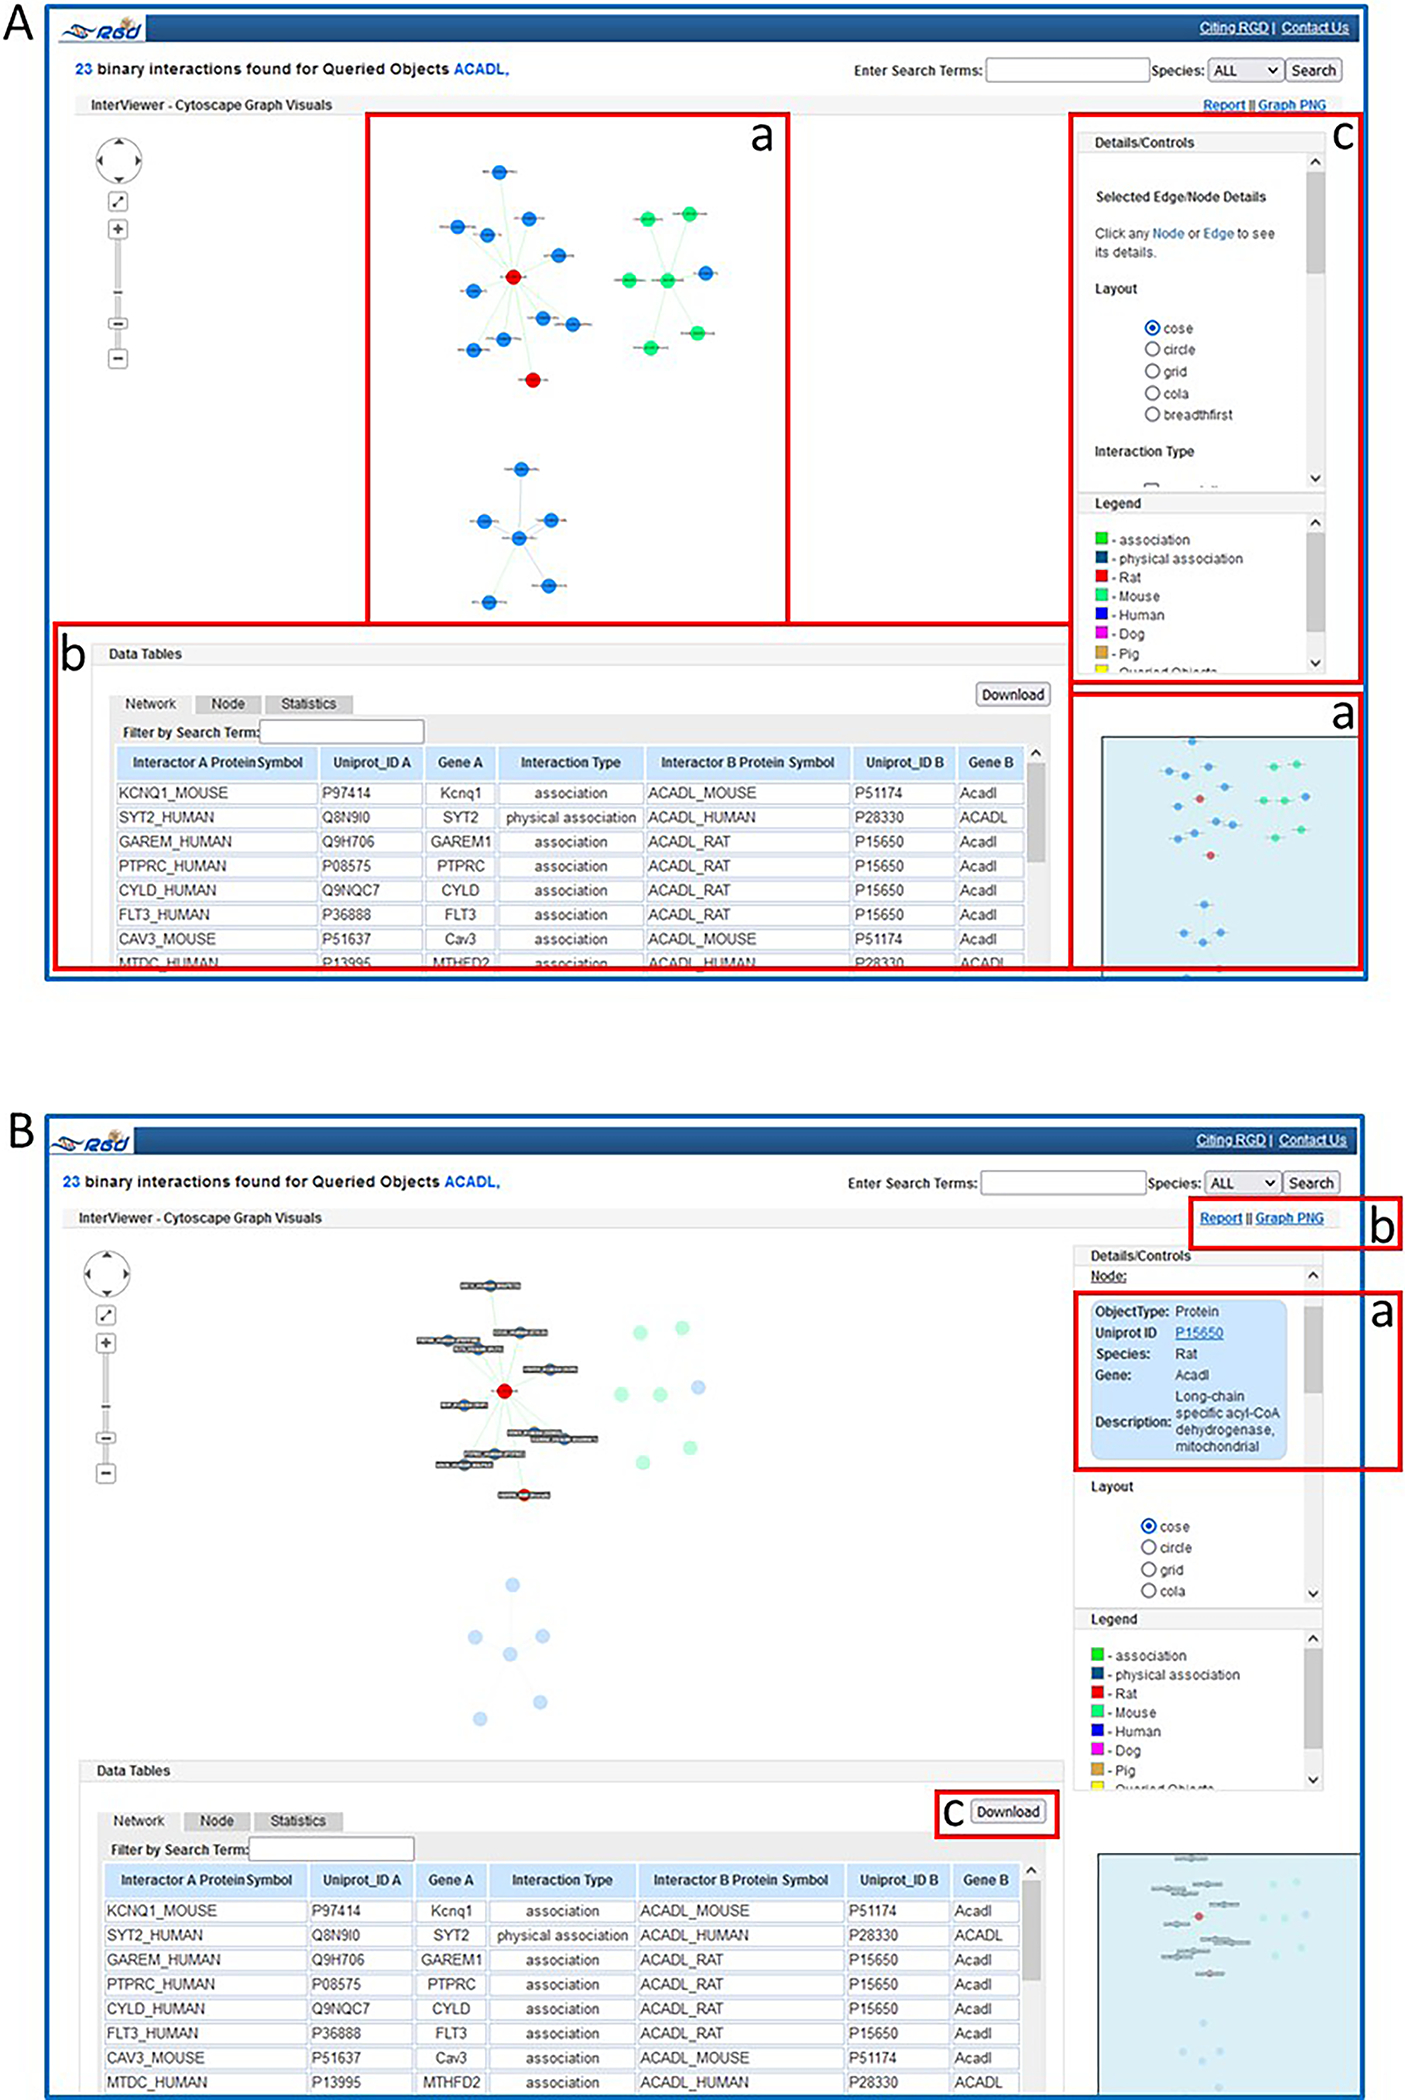
A. The Interviewer results page for rat protein ACADL with graphic display (A-a), data table (A-b), and tool controls (A-c). B. Highlighted gene in graphic with details pane (B-a) and download options (B-b & B-c).
BASIC PROTOCOL 10
USING THE RGD VARIANT VISUALIZER TOOL TO FIND GENETIC VARIANT DATA
Variant Visualizer is a viewing and analysis software tool for rat strain-specific sequence variants and human ClinVar variants. Rat strains or a variety of human assemblies may be selected, defined by genomic regions and, if desired, parameters may be set for the type(s) of desired variants. The tool will display all the single nucleotide variants (SNVs) matching the input criteria, with information on read depth, zygosity, conservation score and more.
Necessary Resources
Hardware
Computer with functioning Internet connection
Software
Web browser (Microsoft Edge, Mozilla Firefox, Google Chrome, or Apple Safari
Protocol steps with step annotations
- On the RGD homepage (https://rgd.mcw.edu/, Fig. 1), hover over “Analysis & Visualization” on the menu bar at the top of the page and click on “Variant Visualizer”.The Variant Visualizer can also be accessed by clicking on the box labelled “Variant Visualizer” in the center of the RGD homepage. Either action leads to the Variant Visualizer homepage (Fig. 32A).
- Under “Select Samples” choose BN/NHsdMcwi (2020), LEW/Crl (2019), and MWF/Hsd (2019) by clicking the toggle boxes to the left of each strain name (Fig. 32B–a), followed by clicking “Continue” on the right side of the page (Fig. 32B–b).Clicking “Continue” takes you to another selection page (Fig. 32C) to limit the variant search by genomic position, function, or gene.
- Click the “Enter a Gene List” button on the right side of the page. In the large text box that appears on the subsequent page (Fig. 32D), enter this list of genes:Abat Abca3 Abcc1 Abcc8 Abcc9 Abi2 Abo Acadl Ace Ace2 Acsm3 Acta2 Actc1 Acvrl1 Ada Adad2 Adam23 Adamts10 Adamts13 Adamts16 Adamts16em1Bj Adamts17 Adcy5 Add1 Add2 Add3
- Click the “Find Variants” button on the top right side of the page to see the variant distribution across the chosen rat strains and genes as shown via heat map of variant numbers (Fig. 33A). Click on the square at the intersection of MWF/Hsd and Acvrl1 (Fig. 33A–a) to see the 29 variants of the MWF/Hsd strain and the 11 variants of the LEW/Crl strain within the sequence of the Acvrl1 gene (Fig. 33B).The results feature a horizontal view of DNA sequence of strain/assembly compared to reference sequence (Fig. 33B). Variants are labeled with chromosome coordinates and base designations. The graphic display makes it easy to compare many rat strains simultaneously because the variants are shown vertically aligned based on chromosome coordinate in a scrollable display frame.
- For details of any variant, click on the base to (Fig. 32B–a) open a popup window with details (Fig. 33C).From the sequence display page optional views and a link to additional analysis options in the upper right corner of the display page (Fig. 33B–b) are available. The options include an overview plot of the data, a distribution graph of the data, help documentation, a download link for the data, and a link to the GA tool (Gene Annotator—see Basic Protocol 8) for functional analysis of the selected region.
Figure 32.
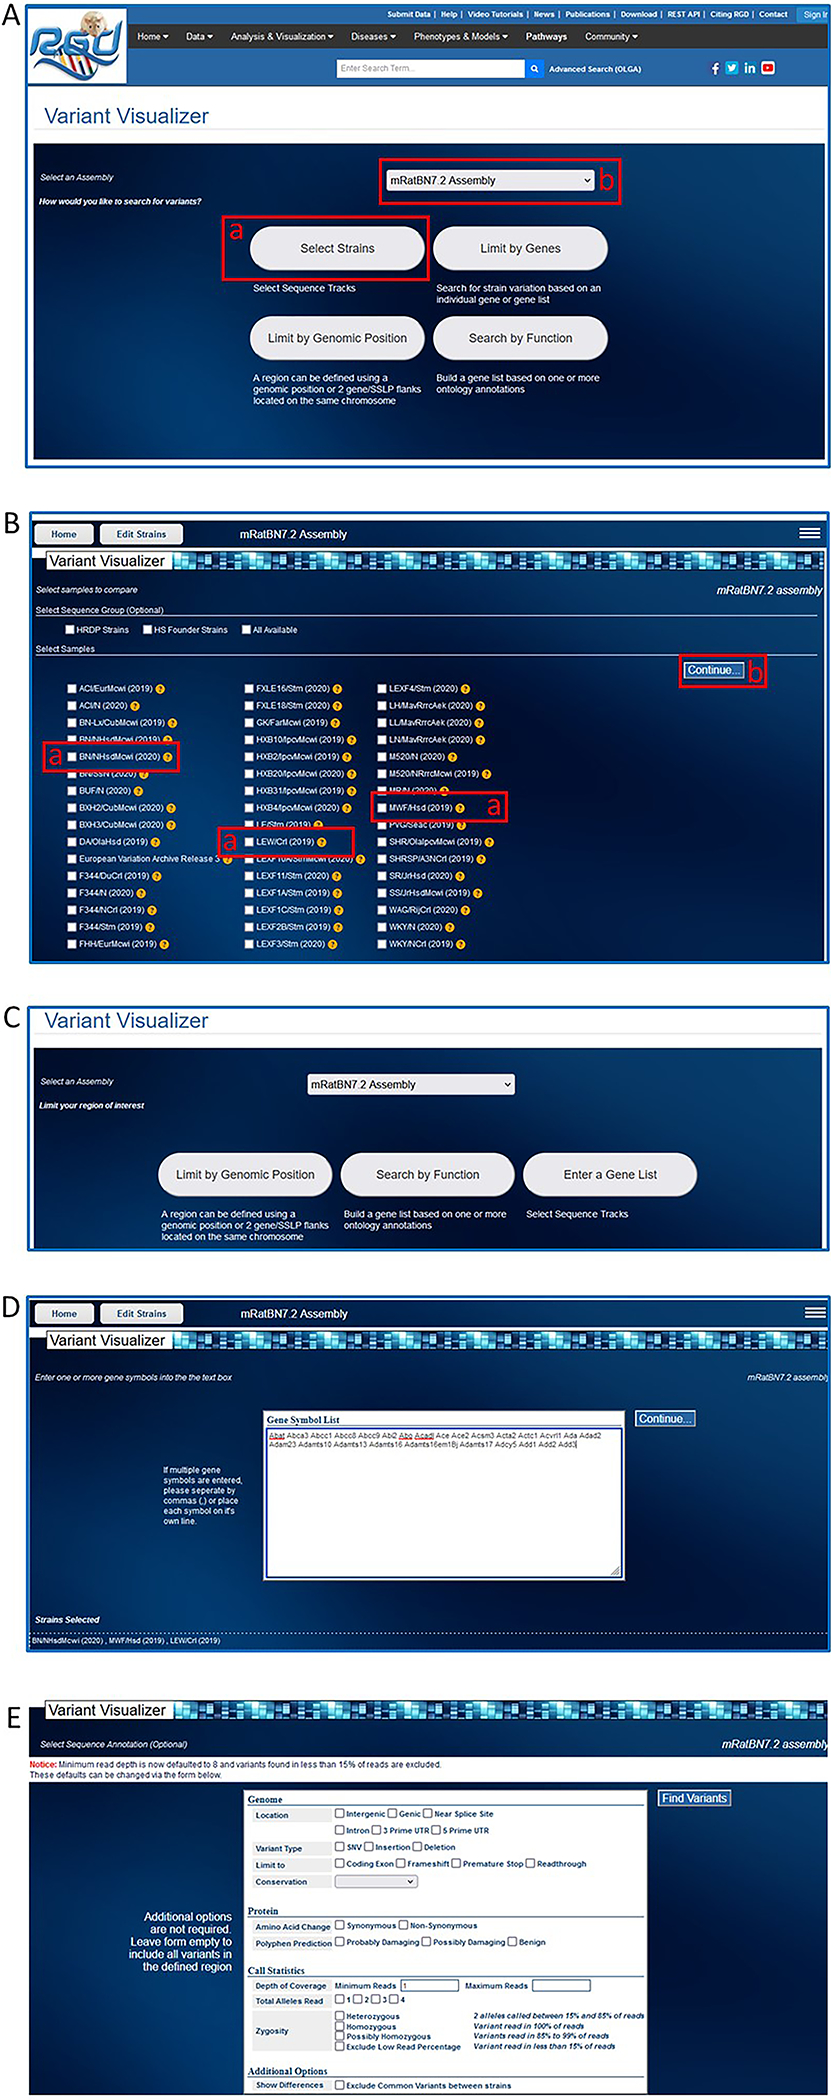
Steps in use of the Variant Visualizer tool. A. Variant Visualizer homepage showing rat strain selection button (A-a) and default assembly (A-b) ready for analysis. B. Rat strain selection page. C. Options for limiting analysis based on assembly, genomic position, function, and gene(s). D. Entry page for a selected gene list. E. Option page for limiting the analysis.
Figure 33.
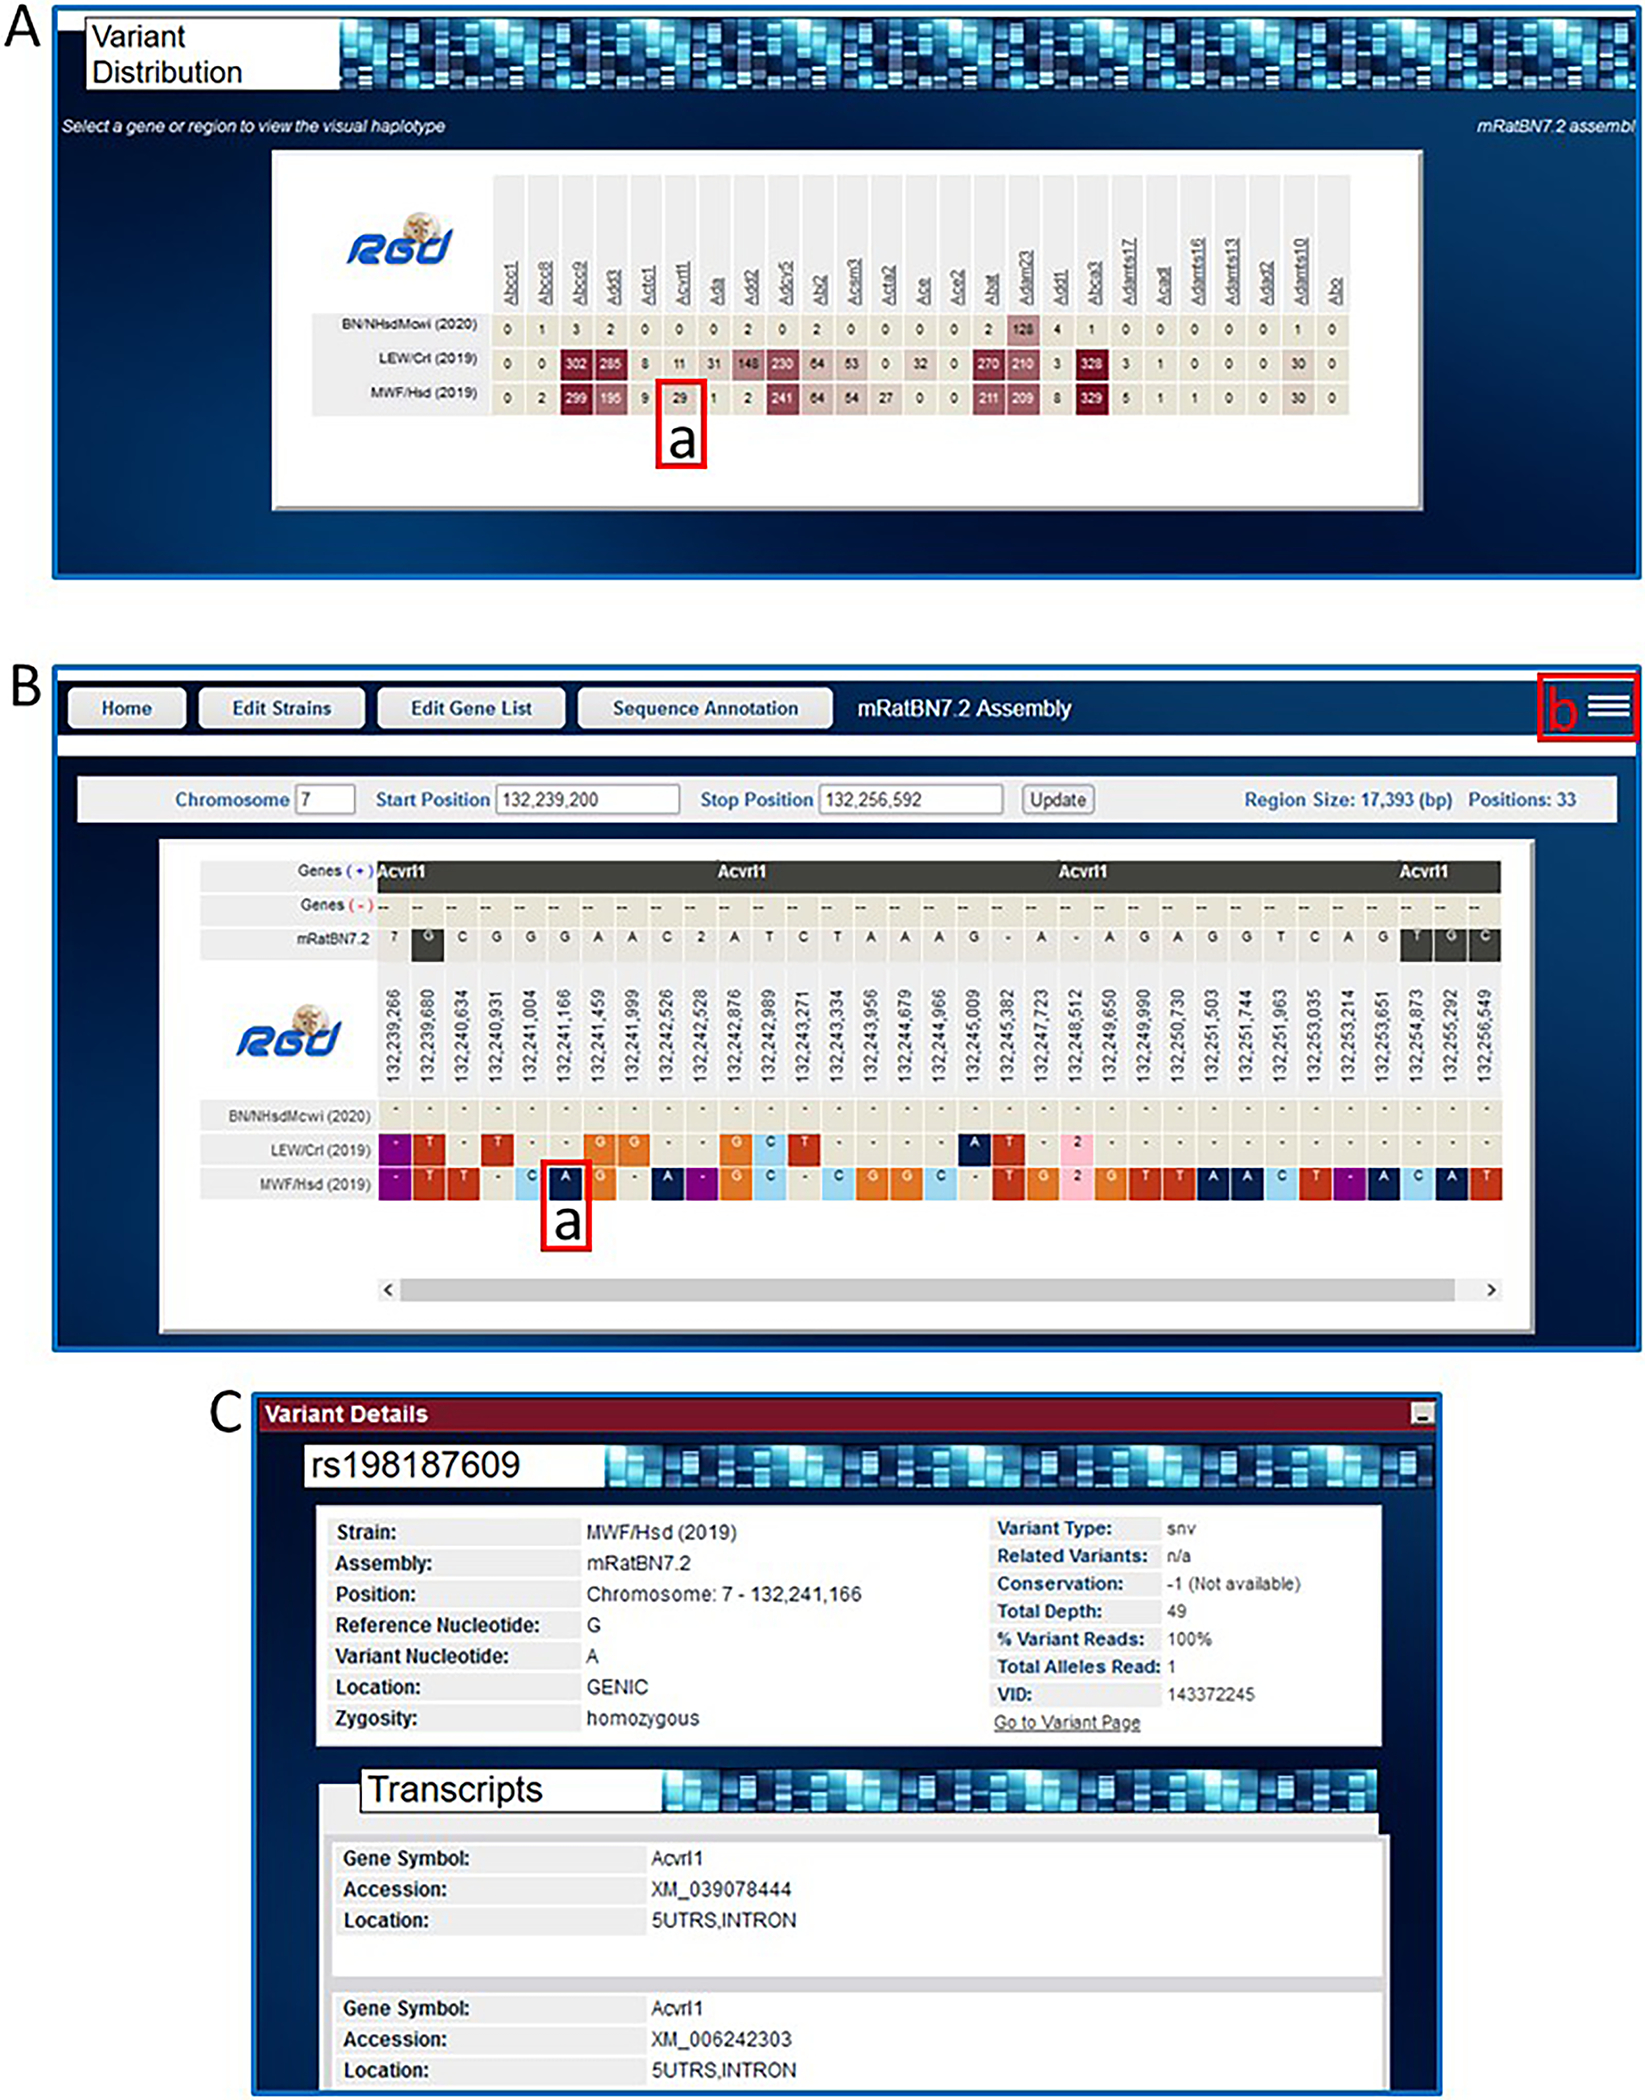
A. Variant Visualizer results page for the entered genes showing variant distribution across the three selected strains (A-a, Acvrl1 in MWF/Hsd). B. Results page showing nucleotide variants for Acvrl1 across the three strains compared to the reference assembly mRatBN7.2. Individual color-coded variants (B-a) are linked to detailed pop-up pages (C). Optional views and links to further analysis are available from a pop-up selection box accessed by a link in the upper right corner of the display (B-b).
BASIC PROTOCOL 11
USING THE RGD DISEASE PORTALS TO FIND DISEASE, PHENOTYPE, AND OTHER INFORMATION
There are some types of data at RGD that are presented in their own sections of the web site called “portals.” Disease information is currently divided into 15 different “portals,” separated by disease category. Phenotype data is accessible through the “Phenotypes & Models” portal, which includes quantitative PhenoMiner data, strain medical records, and more. Finally, the pathway portal contains both molecular pathway and physiological pathway diagrams. Whereas the physiological pathways are limited to a few interactive diagrams, the pathway portal currently has 200 interactive molecular pathway diagrams across five nodes (classic metabolic pathway, signaling pathway, regulatory pathway, disease pathway, and drug pathway) of the Pathway Ontology. Related pathway diagrams are organized in “suites” and “suite networks.”
The RGD Disease Portals home page (Fig. 34A) has icons that link to the individual disease portals. RGD maintains a growing list of disease portals, each designed to be an entry point for researchers to access consolidated data and tools related to a particular category of disease.
Figure 34.
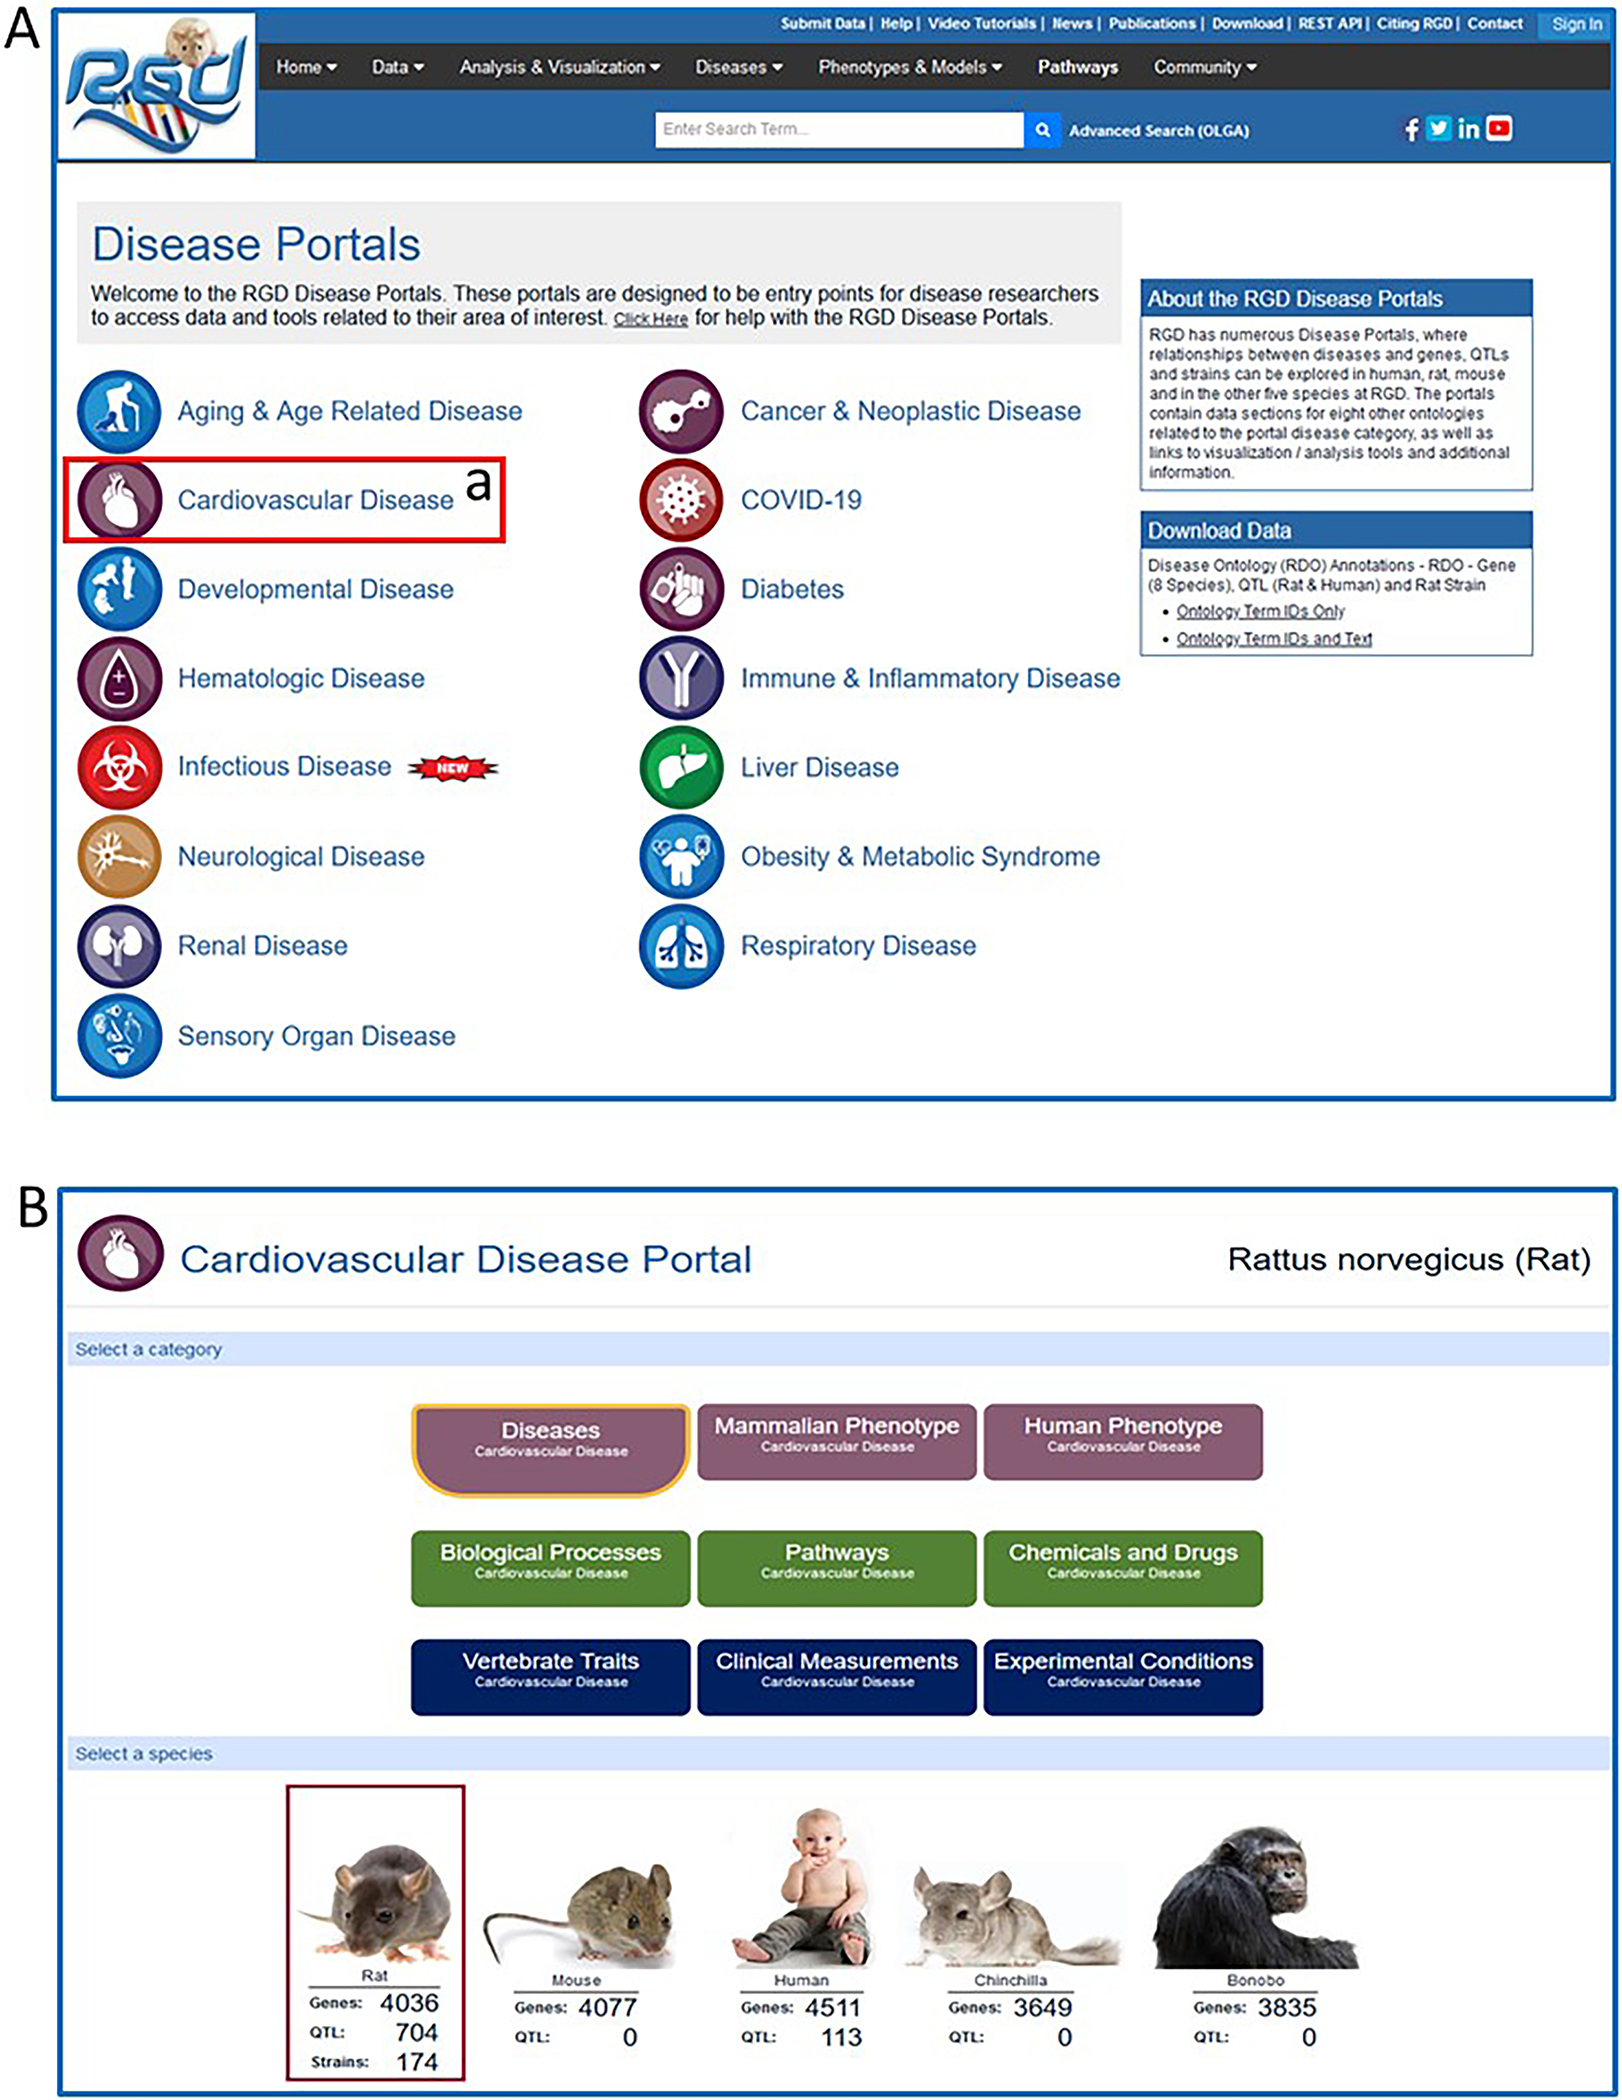
A. RGD Disease Portals homepage with link (A-a) to Cardiovascular Disease Portal. B. Cardiovascular Disease Portal homepage with default selection of “Rattus norvegicus (rat)”.
Necessary Resources
Hardware
Computer with functioning Internet connection
Software
Web browser (Microsoft Edge, Mozilla Firefox, Google Chrome, or Apple Safari
Protocol steps with step annotations
- From the RGD homepage (https://rgd.mcw.edu/, Fig. 1), click “Diseases” on the menu bar at the top of the page to display the Disease Portals homepage. Alternately, click the “Disease Portals” box on the lower left middle of the RGD homepage to access the Disease Portals homepage.The disease portals homepage has fifteen different disease logos/names/links displayed. Any of the portals can also be accessed by hovering the computer cursor over “Disease”in the menu bar and clicking on the portal of choice.
- Click on “Cardiovascular Disease” (Fig. 34A–a) to access the Cardiovascular Disease Portal (Fig. 34B)The default selected species is rat with the other nine RGD species pictured to the right and below “Rat”. To change the data shown on the lower half of the page, click on any of the species’ icons.
To find genes, QTLs, and strains annotated to “hypertension”, click “vascular disease” in the embedded term browser (Fig. 35A–a), followed by “artery disease” (Fig. 35B–a), and finally “hypertension” (Fig. 35C–a).
Genes, QTLs, and strains annotated to “hypertension” are listed in separate columns (Fig. 36A) below the term browser and shown visually in the GViewer-style ideogram (Fig. 36B) (genes-brown bars, QTLs – blue bars, strains – green bars) under “Genome View”. Click on any of the choices under “Gene Enrichment Set” (Fig. 36B–a) to see an analysis as in Fig. 24. Enrichment analysis can be done with disease (DO), pathway (PW), phenotype (MP/HP), Gene Ontology (BP, CC, or MF), or chemical (ChEBI) annotations.
Figure 35.
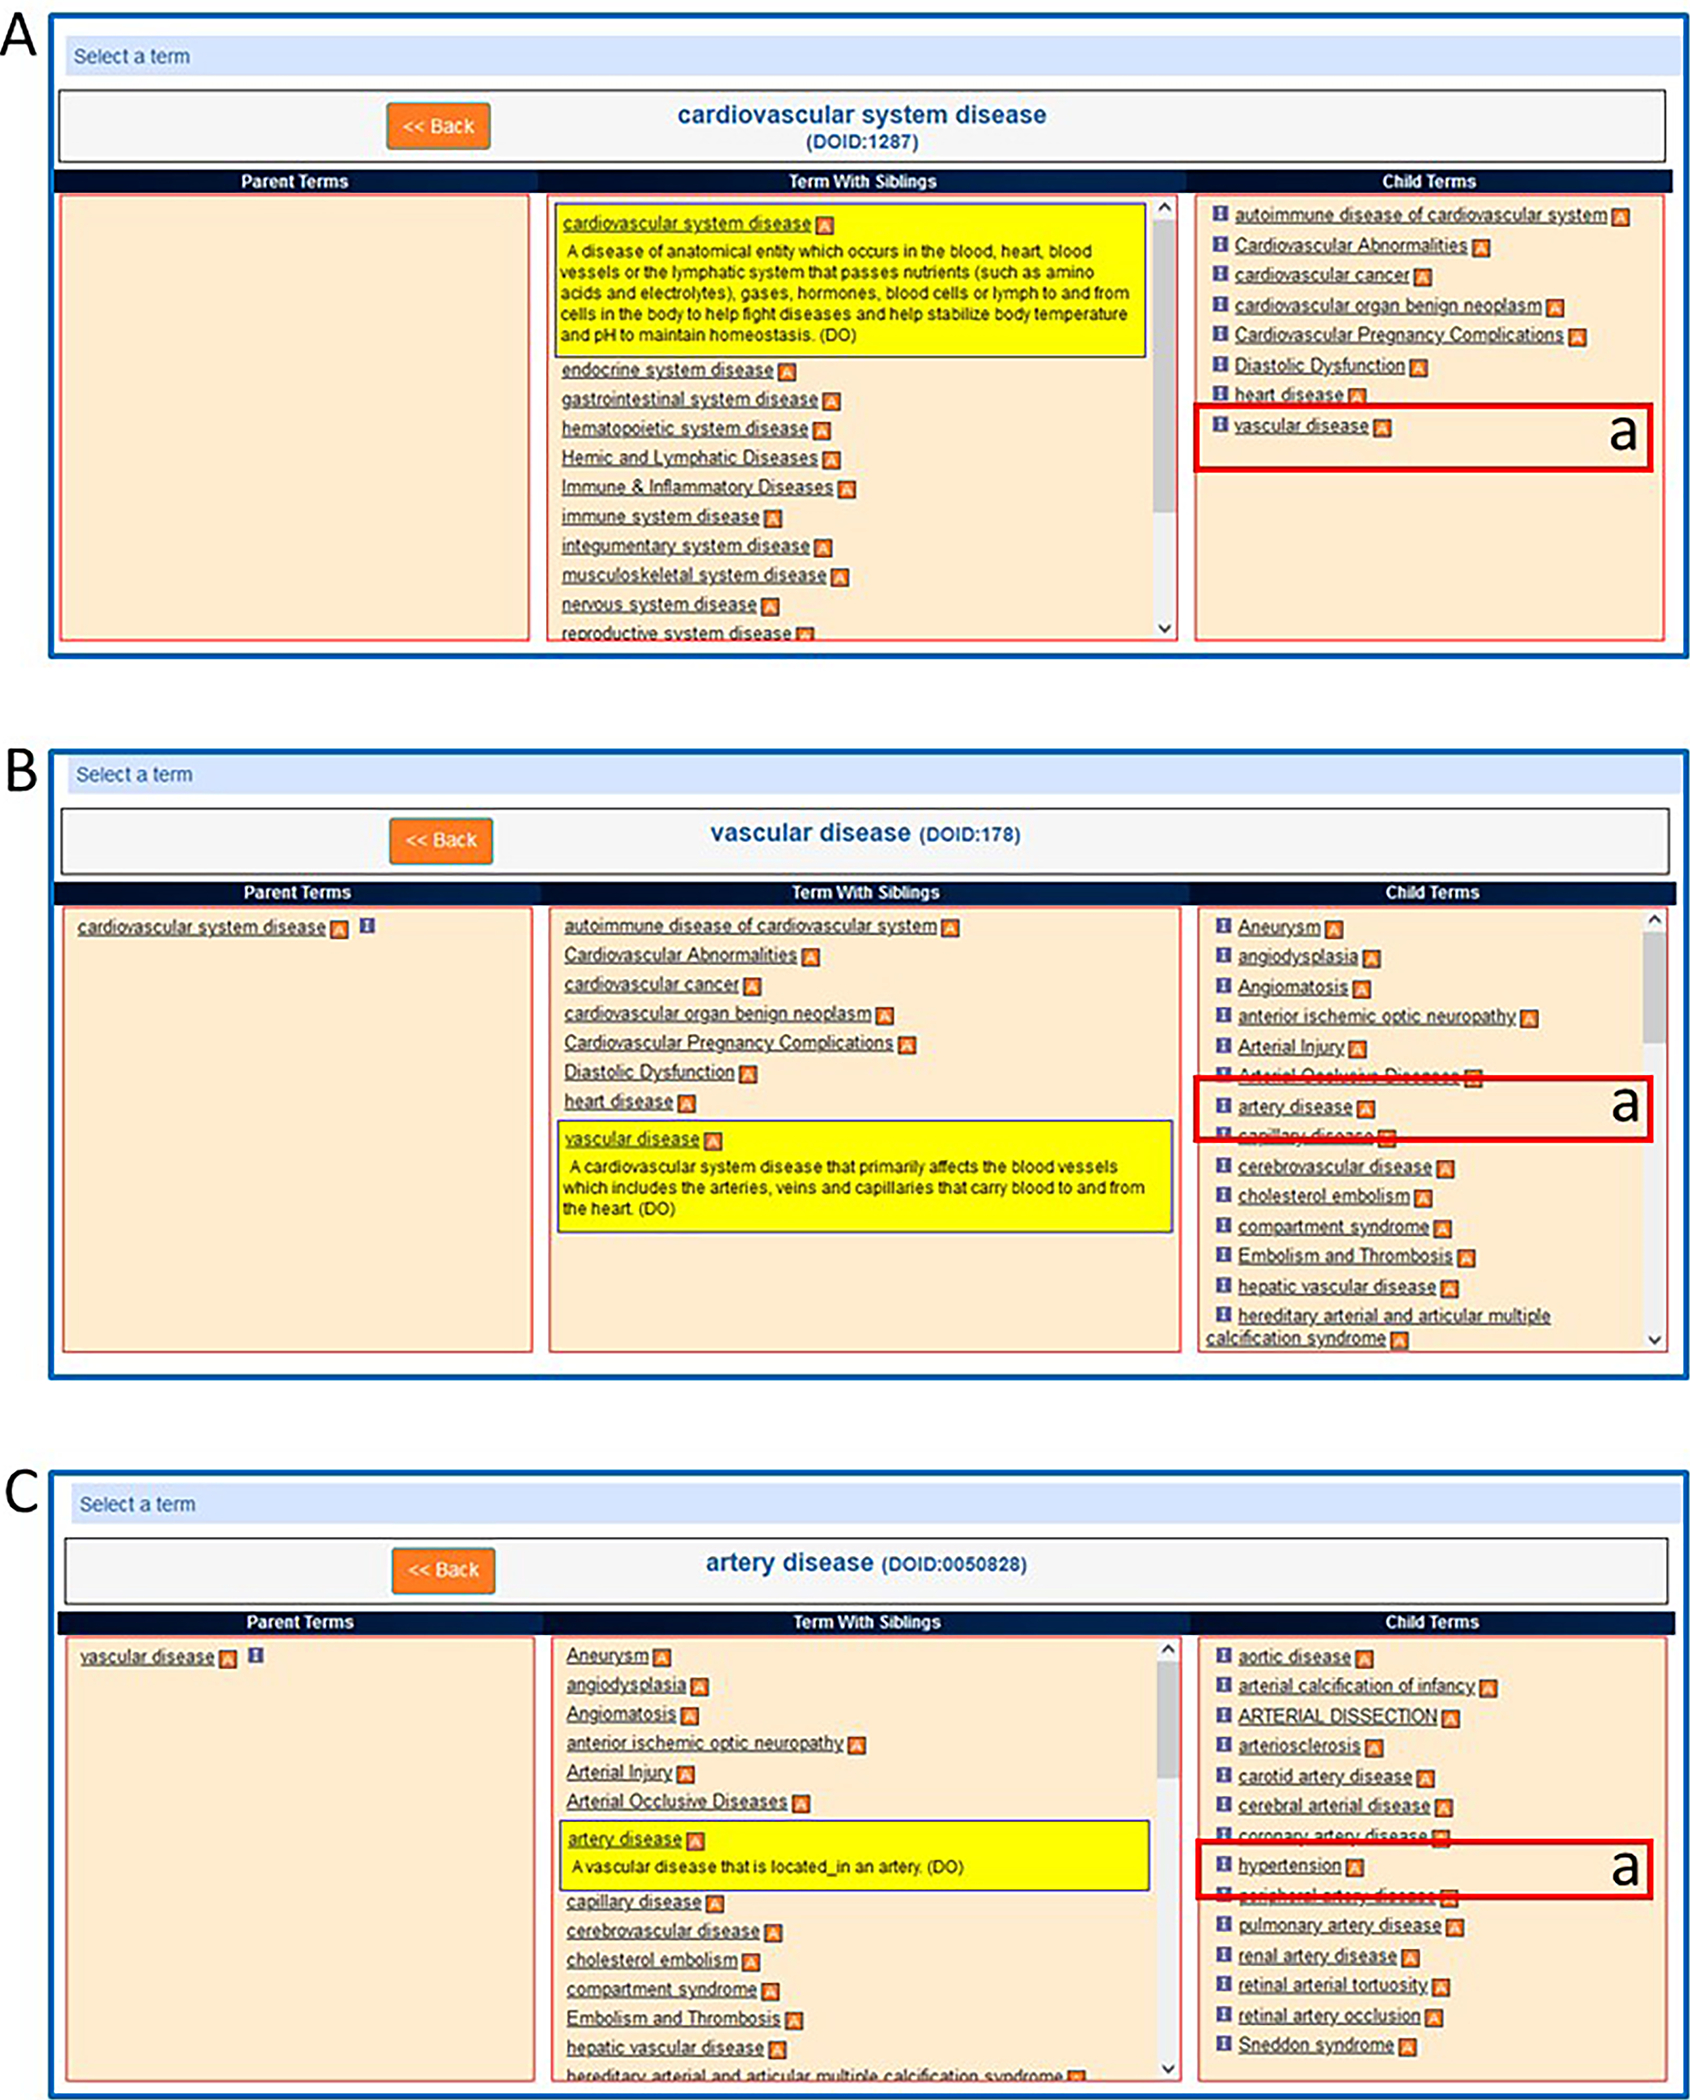
The embedded onytology term browser in the Cardiovascular Disease Portal showing a sequence of selections: A-a. vascular disease B-a. artery disease C-a. hypertension.
Figure 36.
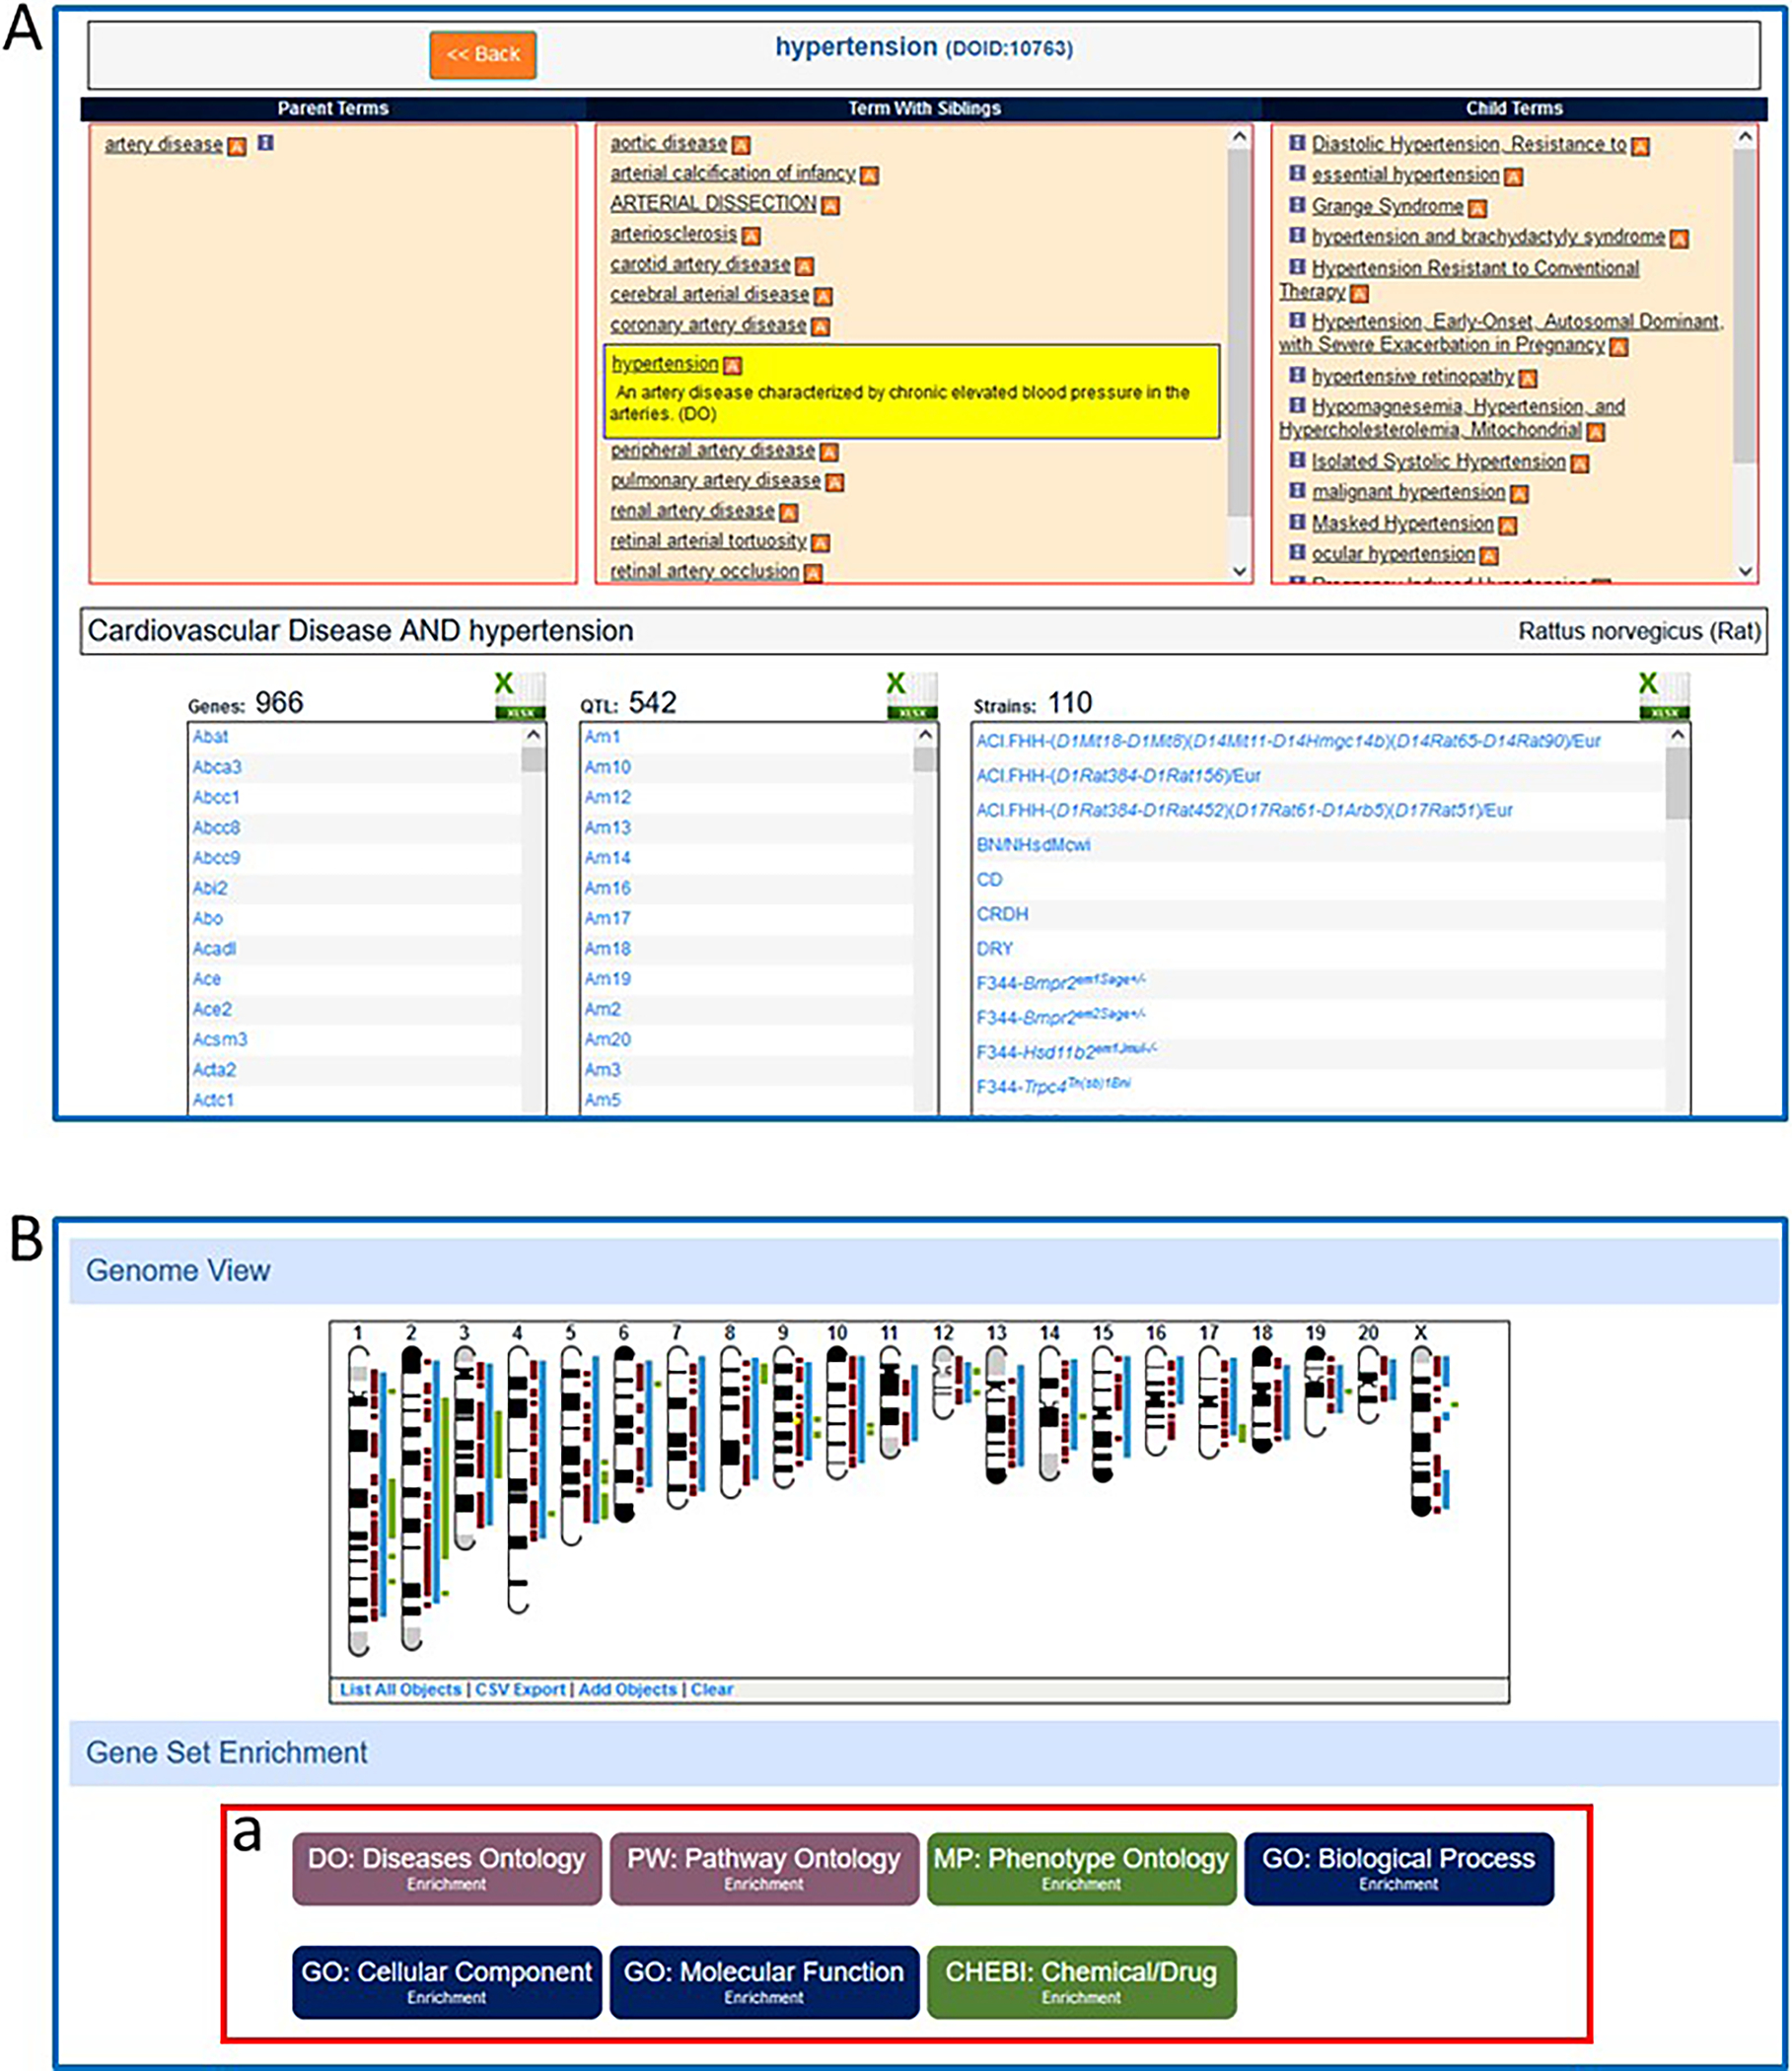
A. The embedded ontology term browser in the Cardiovascular Disease Portal showing the selection of “hypertension” and the lists of genes, QTLs, and strains annotated with the term “hypertension”. B. The Cardiovascular Disease Portal page for “hypertension” with an ideogram showing the genomic locations of genes, QTLs, and regions responsible for strains annotated to “hypertension”. B-a. Gene Set Enrichment section of the Cardiovascular Disease Portal page for “hypertension” which shows the option of MOET enrichment analysis of genes in the “hypertension” annotation set.
BASIC PROTOCOL 12
USING THE RGD PHENOTYPE & MODELS PORTAL TO FIND QUALITATIVE AND QUANTITATIVE PHENOTYPE DATA AND OTHER RAT STRAIN-RELATED INFORMATION
The Phenotypes & Models Portal contains data related to rat strains, phenotypes, identifying disease models, community forums for gathering feedback from the scientific community and essential information for conducting physiological research. Icons on the portal home page link to the respective data or tools, which include the “PhenoMiner” quantitative phenotype tool, phenotype analysis in “Expected Ranges” and “PhenoMiner Term Comparisons”, extensive aid in finding appropriate animal models, commercial rat strain availability, animal husbandry, and links to outside sources of rat strain information.
This protocol will show how users can customize their queries in PhenoMiner by selecting from four categories: rat strains, experimental conditions, clinical measurements, and measurement methods. The queries are built step by step and a tally of results obtained at each step of the query building process is provided.
The data currently in PhenoMiner is comprised of results from the rat physiological literature, two large-scale phenotyping projects (the PhysGen Program for Genomic Applications at the Medical College of Wisconsin (Malek, et al. 2006) and the National BioResource Project in Japan (Serikawa, et al. 2009), and data submitted directly from laboratories engaged in the study of rat physiology.
Necessary Resources
Hardware
Computer with functioning Internet connection
Software
Web browser (Microsoft Edge, Mozilla Firefox, Google Chrome, or Apple Safari
Protocol steps with step annotations
-
From the RGD homepage (https://rgd.mcw.edu/, Fig. 1), click “Phenotypes & Models” on the menu bar at the top of the page to display the Phenotypes and Models Portal homepage (Fig. 36). The Phenotypes and Models portal homepage can also be accessed by clicking on the box labelled “Phenotypes and Models” in the lower middle of the RGD homepage.
To access PhenoMiner (the RGD quantitative phenotype database) click on the “Phenominer” box on the left side of the Phenotypes and Models Portal homepage (Fig. 37a) or hover over “Phenotypes & Models” on the menu bar at the top of the page and select “PhenoMiner (Quantitative Phenotypes)”.
The PhenoMiner homepage has selection data input options of Rat Strains, Clinical Measurements, Measurement Methods, and Experimental Conditions. Rat Strains is the default start point in the selection area at the bottom of the page, but the term selection may begin in any of the four options.
- Click on the “Clinical Measurements” tab on the lower right side of the page (38A-a), followed by typing “systolic blood pressure” in the text box (38A-b) under “Clinical Measurement Selection” in the lower left side of the page. Then click “select” adjacent to “systolic blood pressure” (38A-c) under the text box.The selections made in the lower part of the page are tracked in the boxes in the top half of the page.
- Click on the “strains” tab on the lower right side of the page (38B-a), followed by typing “SR” in the text box on the lower left side of the page (38B-b), and finally click “select” next to “SR” under the text box (38B-c).The boxes in the top half of the page now contain “SR (6)” and “systolic blood pressure (6)” with the numbers in parentheses meaning there are six records in Phenominer that have both “SR” and “systolic blood pressure” as annotated terms.
Repeat step 3 with the strain “SS”. Repeat step 3 again with “Experimental Conditions” (38C-a) and “controlled sodium content diet” (Fig. 38C–b).
- To see systolic blood pressure data from SS and SR strains on controlled sodium content diets click “Generate Report” (Fig. 38C–c).“Generate Report” may be selected at any time during the term selection process. “Generate Report” returns a graph that compiles all records that meet the combined criteria of the term selection process (Fig. 39). The final data selected for the graph can be filtered by selecting boxes adjacent to terms listed in the left frame of the results page (Fig. 39A–a). The data from the graph is also available in the table beneath the graph (Fig. 39A–b).
- Hover over the first column on the left side of the graph (Fig. 40-a) to see all the details of the experiment record associated with that column.This view gives finer detail than the mean values shown in the graph and is the same data shown in the table below the graph. The data seen in the experiment-specific pop-up can be changed by hovering over any of the columns in the graph.
Figure 37.
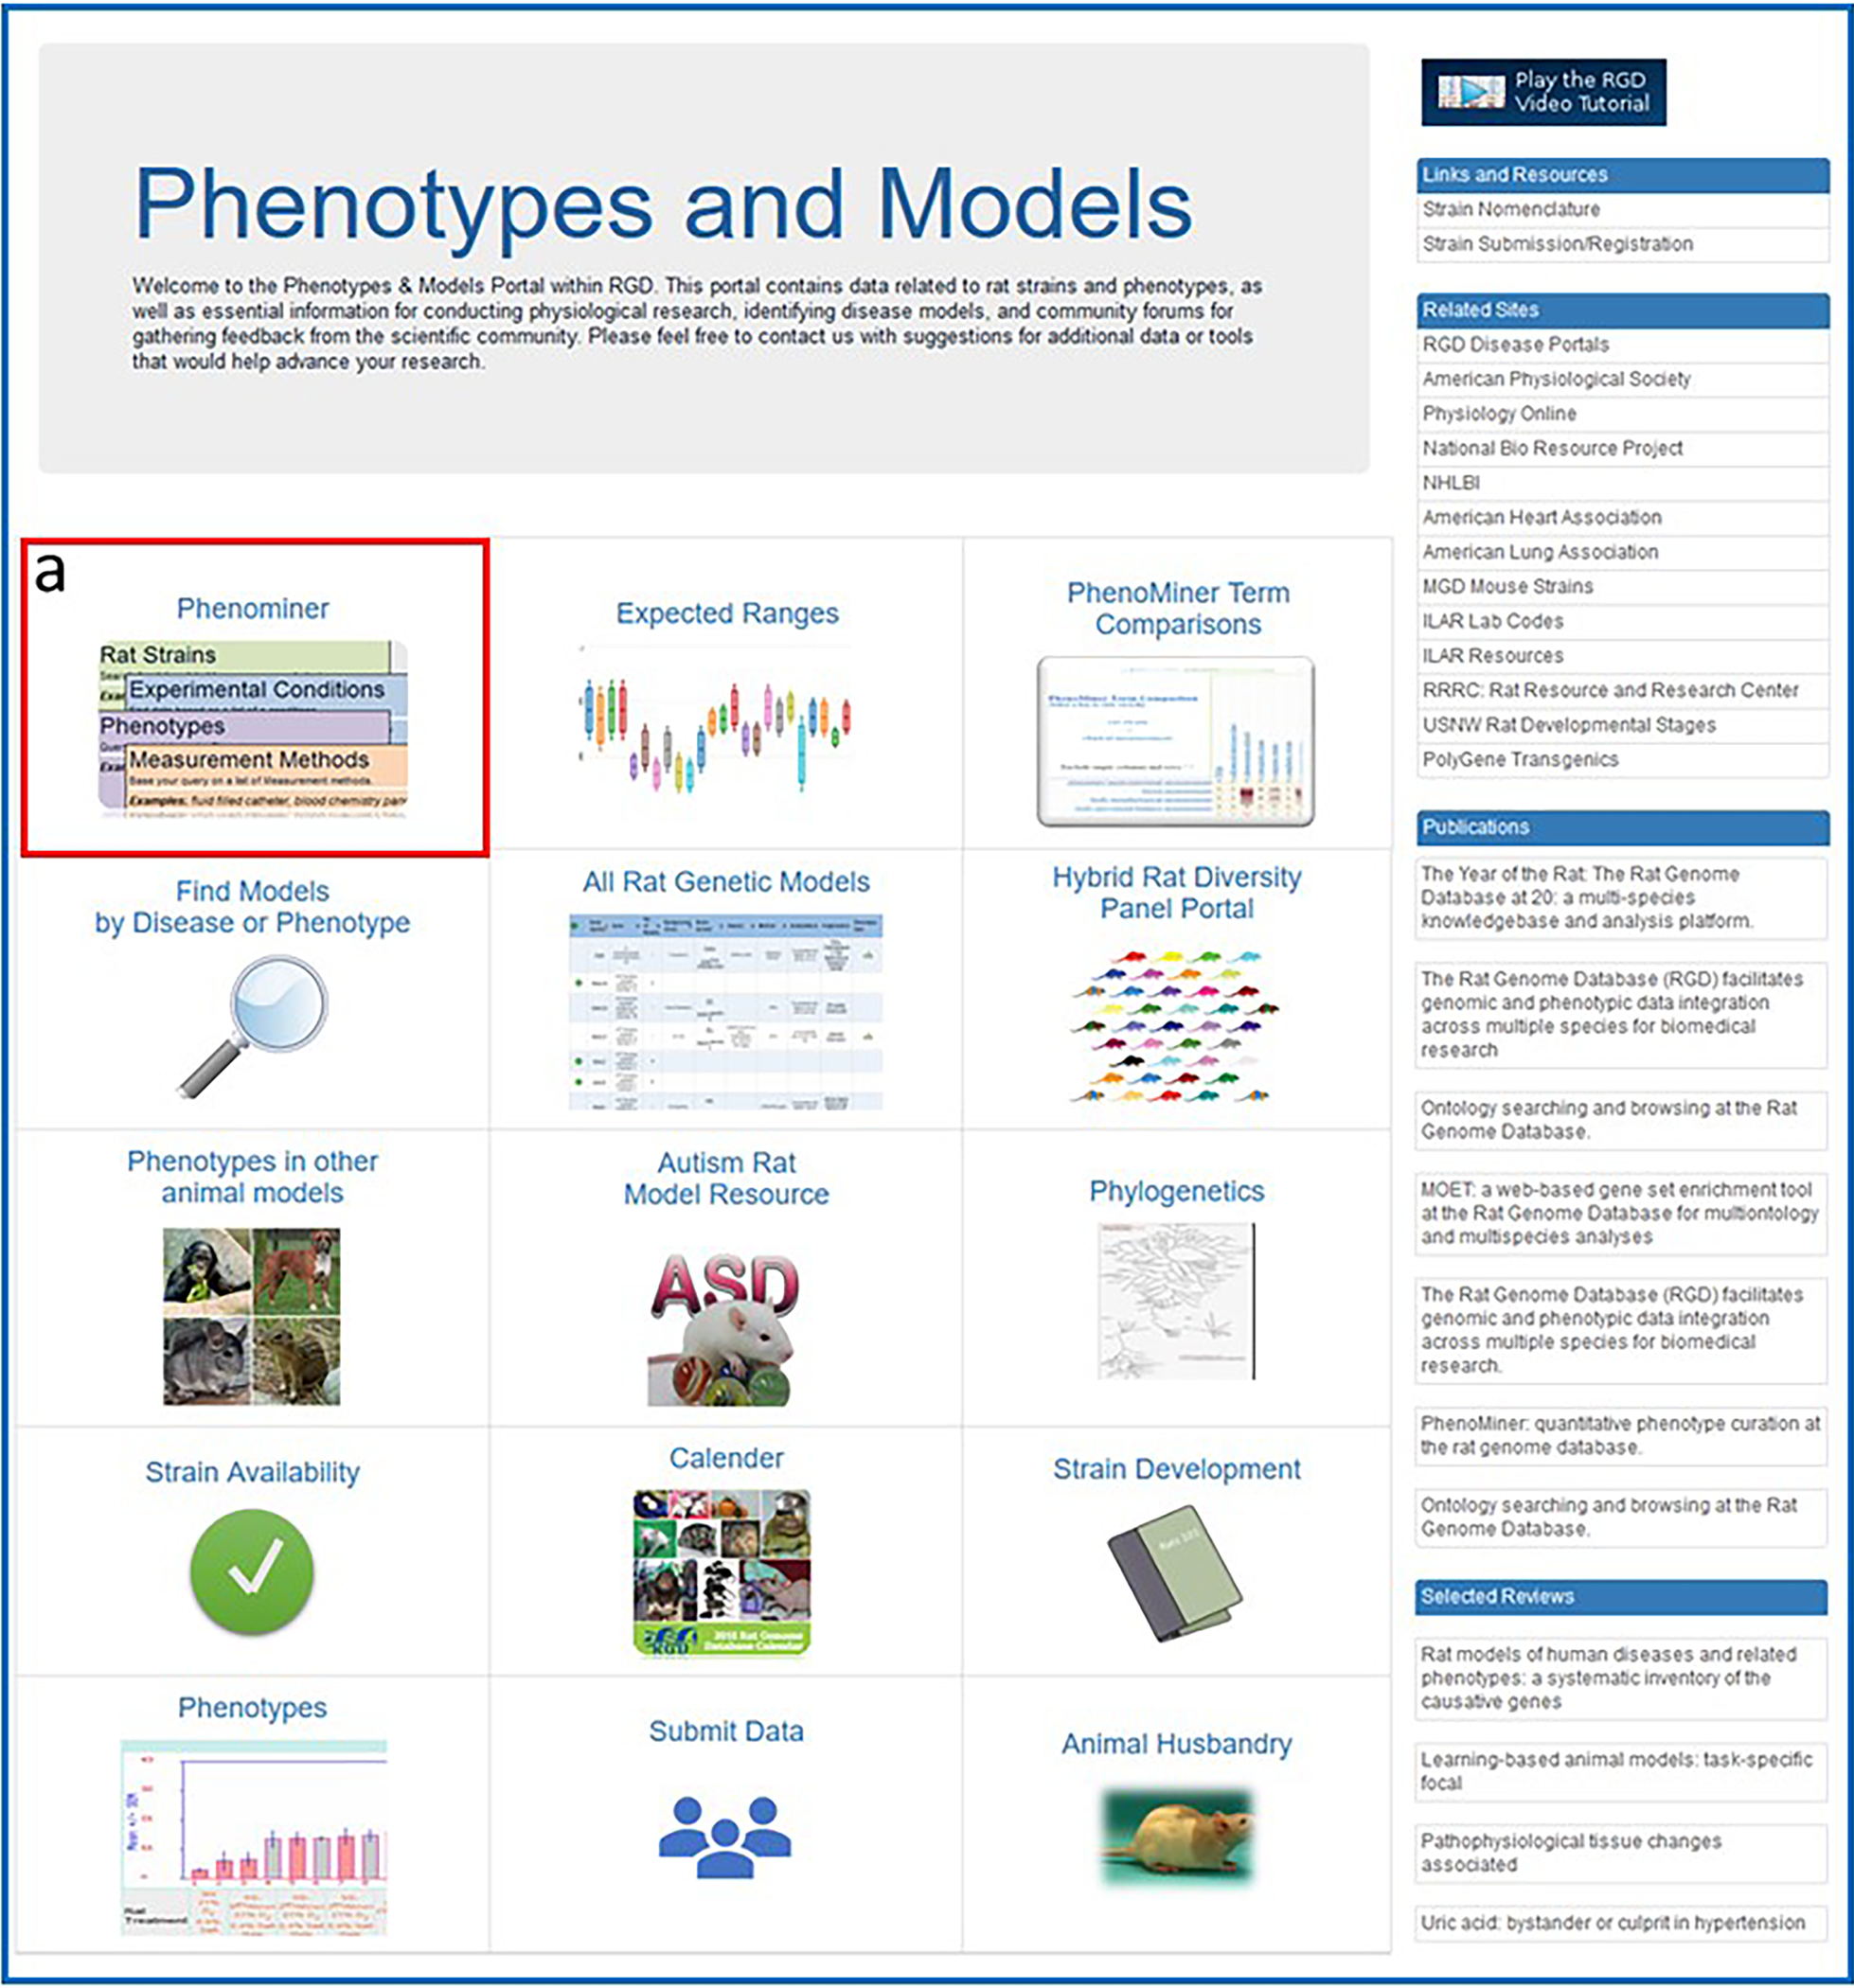
The Phenotypes and Models homepage showing the various options of data and tools available, including the PhenoMiner tool (37-a).
Figure 38.
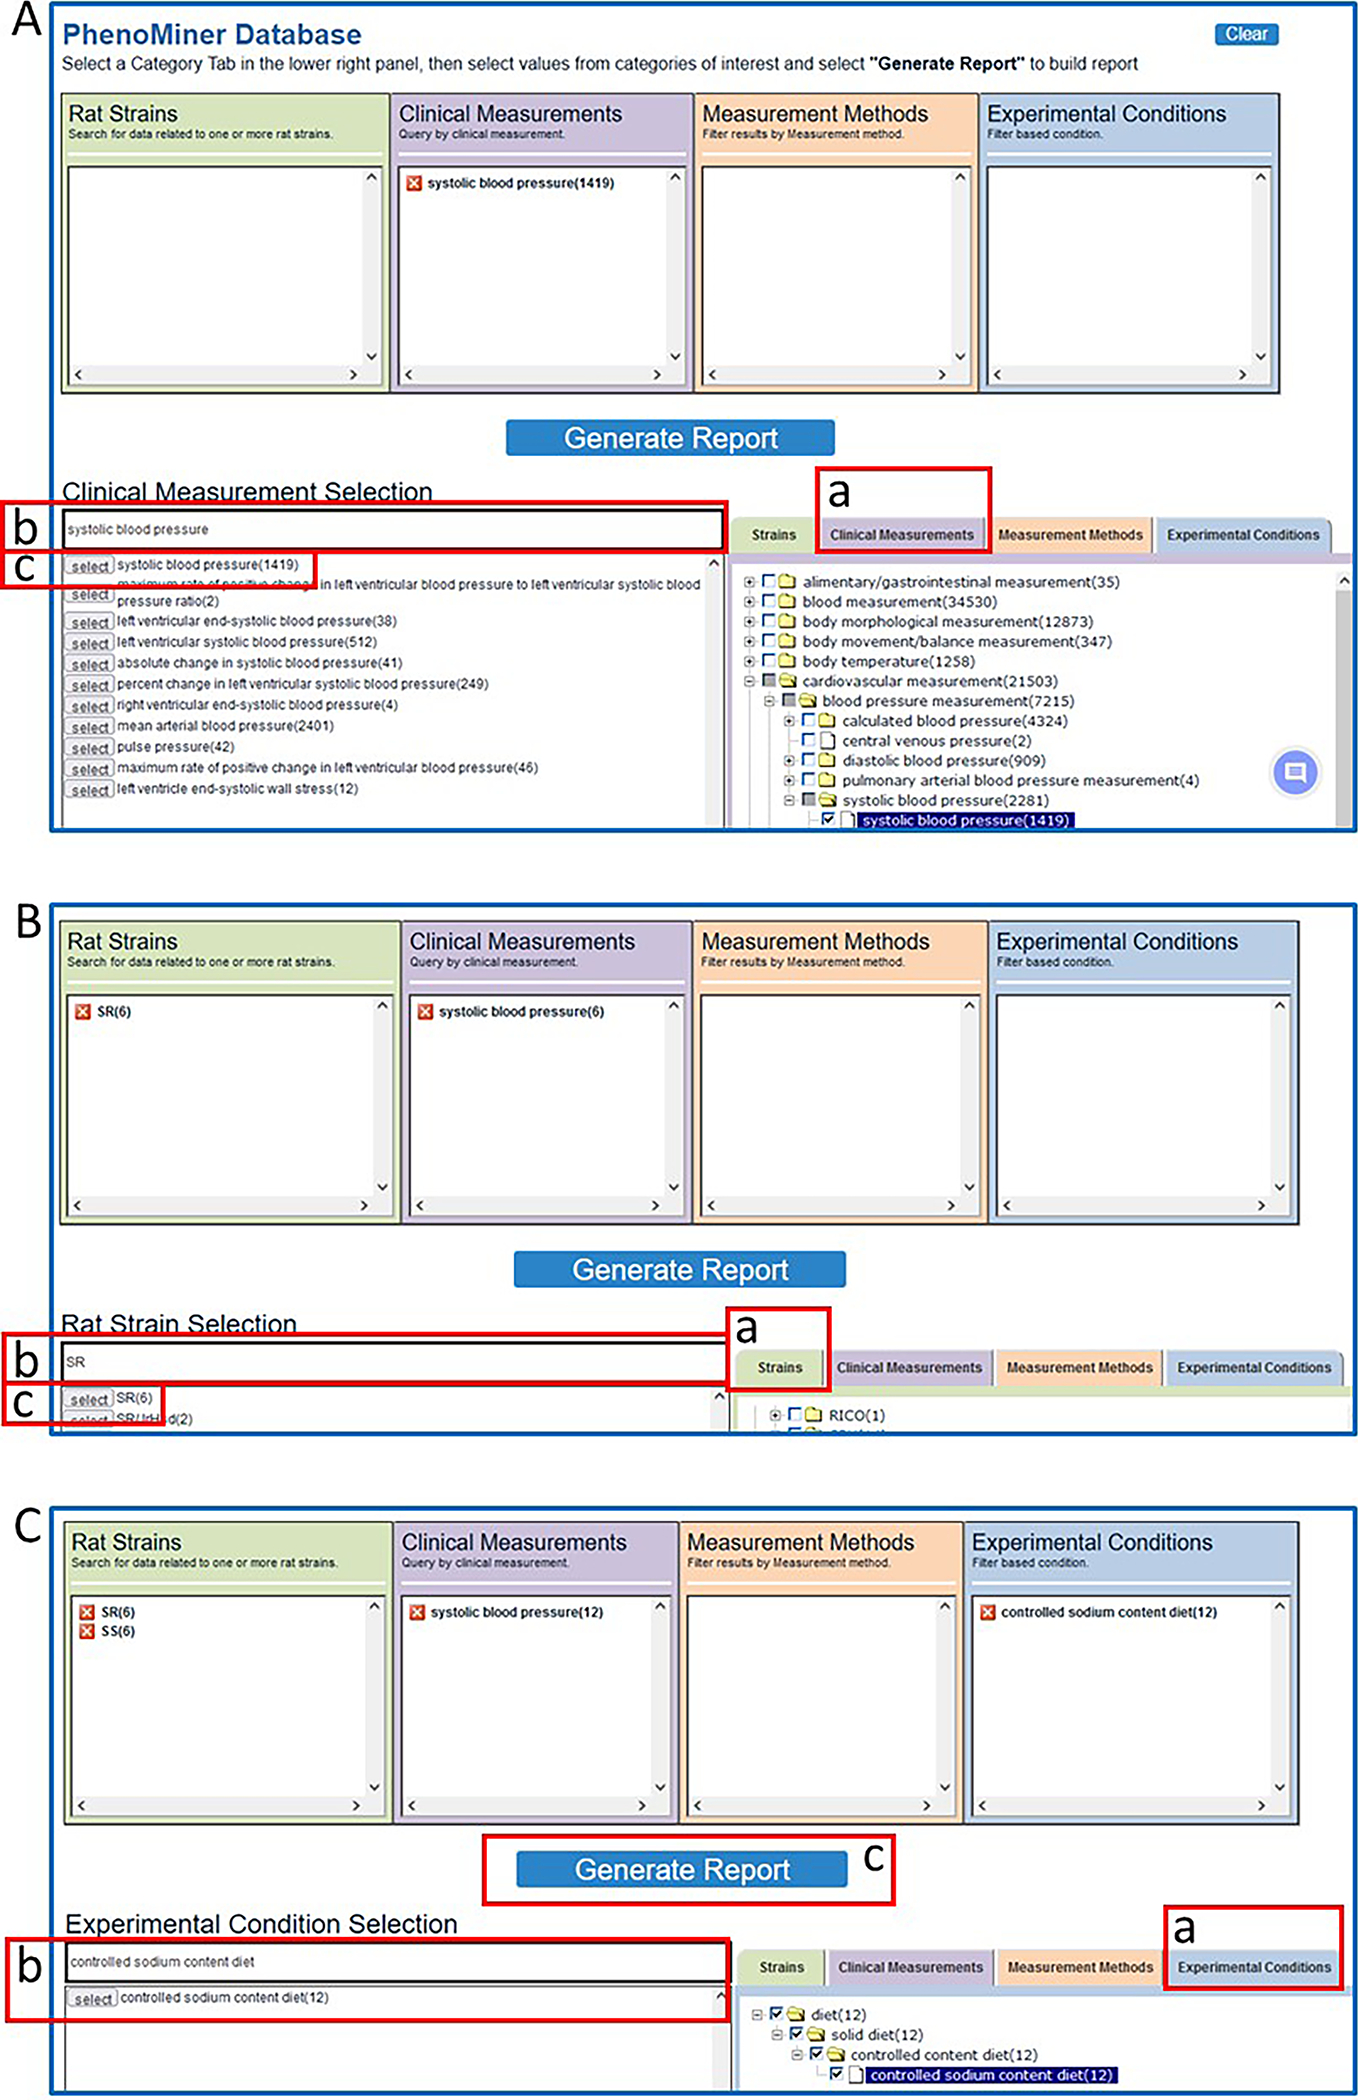
Steps in querying the PhenoMiner database. A. After a selection of “Clinical Measurements” (A-a), “systolic blood pressure” is entered in a textbox (A-b) and selected (A-c). B. After a selection of “Strains” (B-a), “SR” is entered in a textbox (B-b) and selected (B-c). C. After repeating B-a, -b, -c for “SS”, “Experimental Conditions” (C-a) is selected, “controlled sodium content diet” is entered in a textbox and selected (C-b), and “Generate Report” is selected to activate the query.
Figure 39.
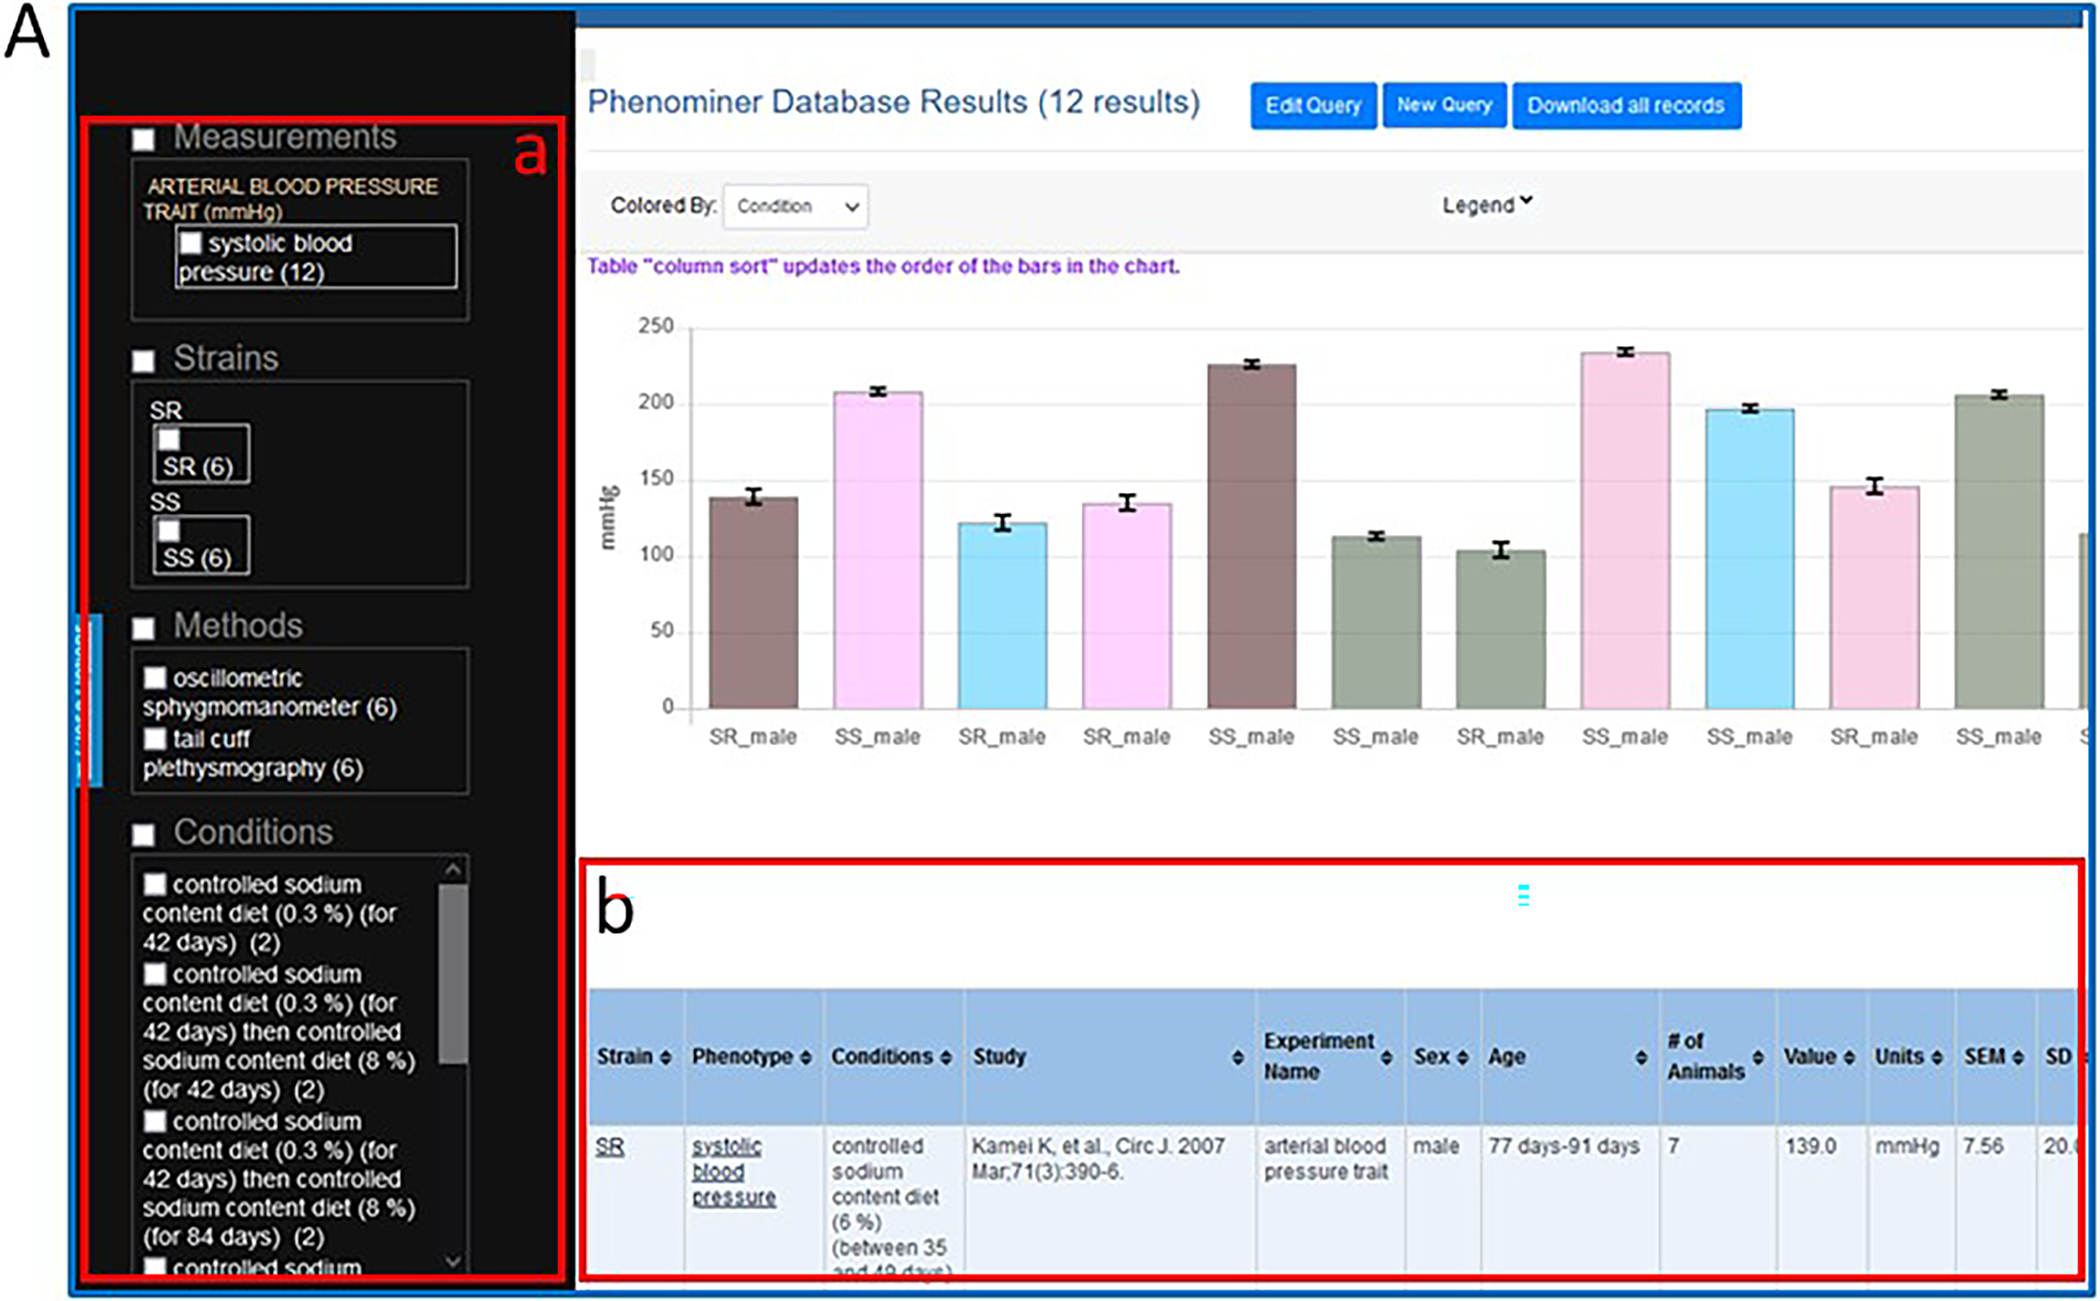
A. The PhenoMiner results page showing the graphed results of the SR/SS/systolic blood pressure/controlled sodium content diet query, the data filtering options (A-a), and the query results in table form (A-b).
Figure 40.
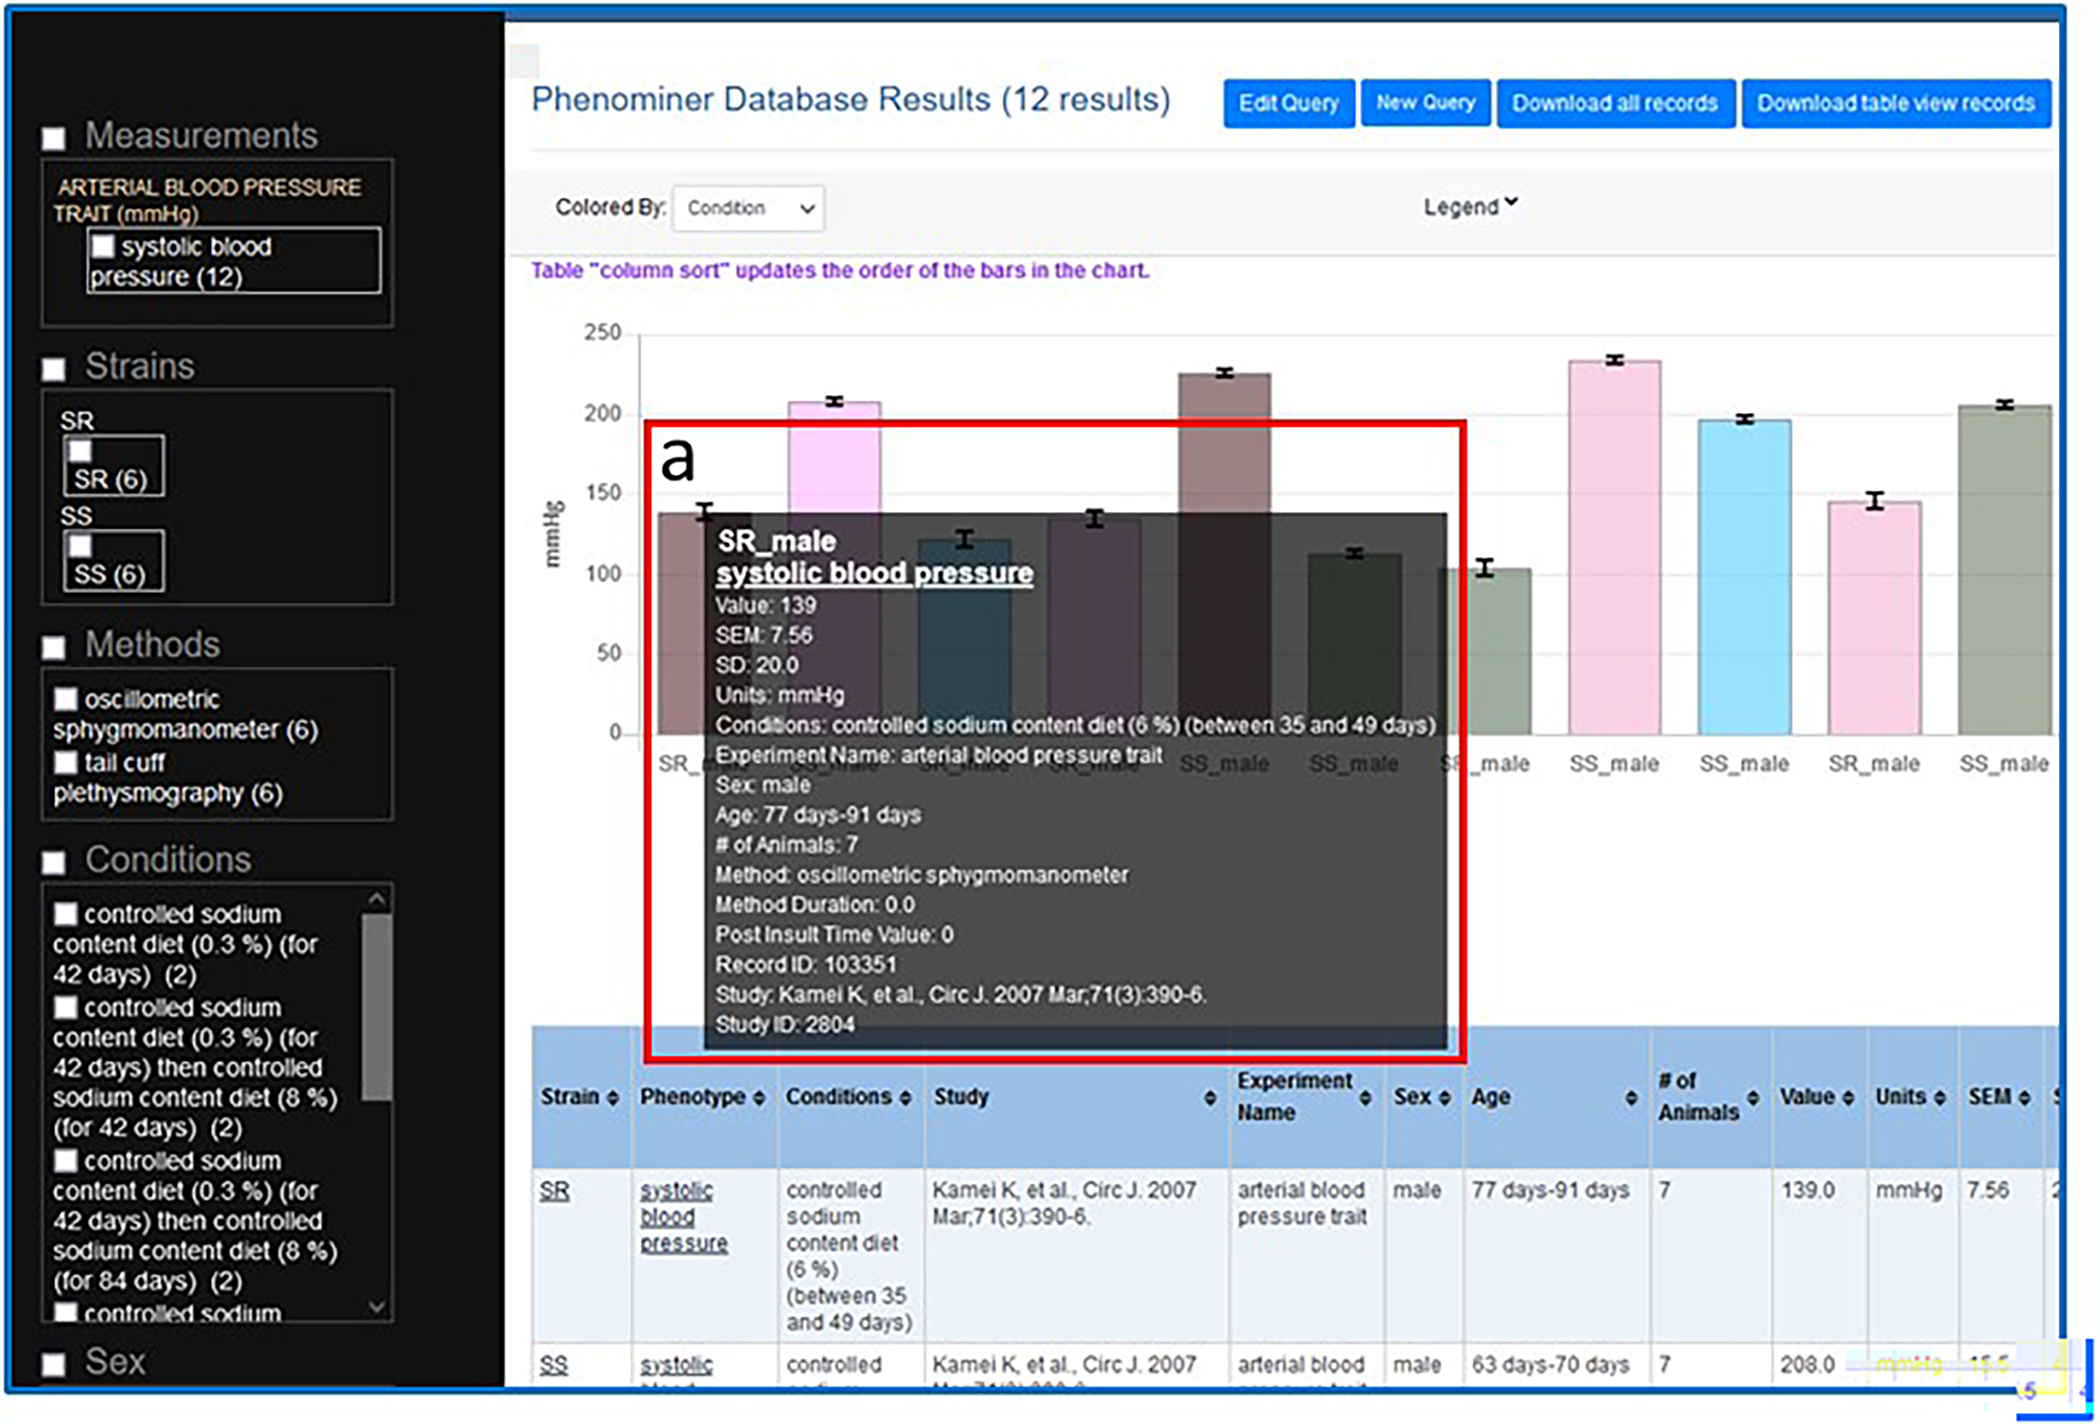
The PhenoMiner results page showing the graphed results of the SR/SS/systolic blood pressure/controlled sodium content diet query with details of the first column (a) being shown in a pop-up window when the mouse cursor hovers over the column.
BASIC PROTOCOL 13
USING THE RGD PATHWAY PORTAL TO FIND DISEASE AND PHENOTYPE DATA VIA MOLECULAR PATHWAYS
The RGD Pathway Portal is a way to access the list of molecular pathway diagrams via the Pathway Portal homepage. The molecular pathway diagrams were designed at RGD using Elsevier’s Pathway Studio software (http://support.pathwaystudio.com/). The diagrams feature hyperlinks from most of the objects in the diagram to RGD pages representing the respective term, gene, chemical, or associated secondary pathway. Additional relevant data can be found beneath the diagrams on the molecular pathway pages in several lists: pathway genes/associated disease annotations, pathway genes/all associated pathway annotations, and pathway genes/associated phenotype annotations.
This protocol shows how users can access RGD pathway diagrams and related data.
Necessary Resources
Hardware
Computer with functioning Internet connection
Software
Web browser (Microsoft Edge, Mozilla Firefox, Google Chrome, or Apple Safari
Protocol steps with step annotations
- To access pathway diagrams from the Pathway Portal homepage, click the “Pathway Explorer” box on the lower left side of the RGD homepage (Fig. 1) or click “Pathways” on the menu bar at the top of the page. On the Pathway Portal homepage click the “Individual Diagram Pages” icon on the top left side of the page (Fig. 41A–a) or the “Molecular Pathway Suites and Suite Networks” on the top right side of the page (Fig. 41A–b).Both icons link to a page (“Molecular Pathways”) (Fig. 41B) with lists of pathway diagrams available at RGD.
Figure 41.
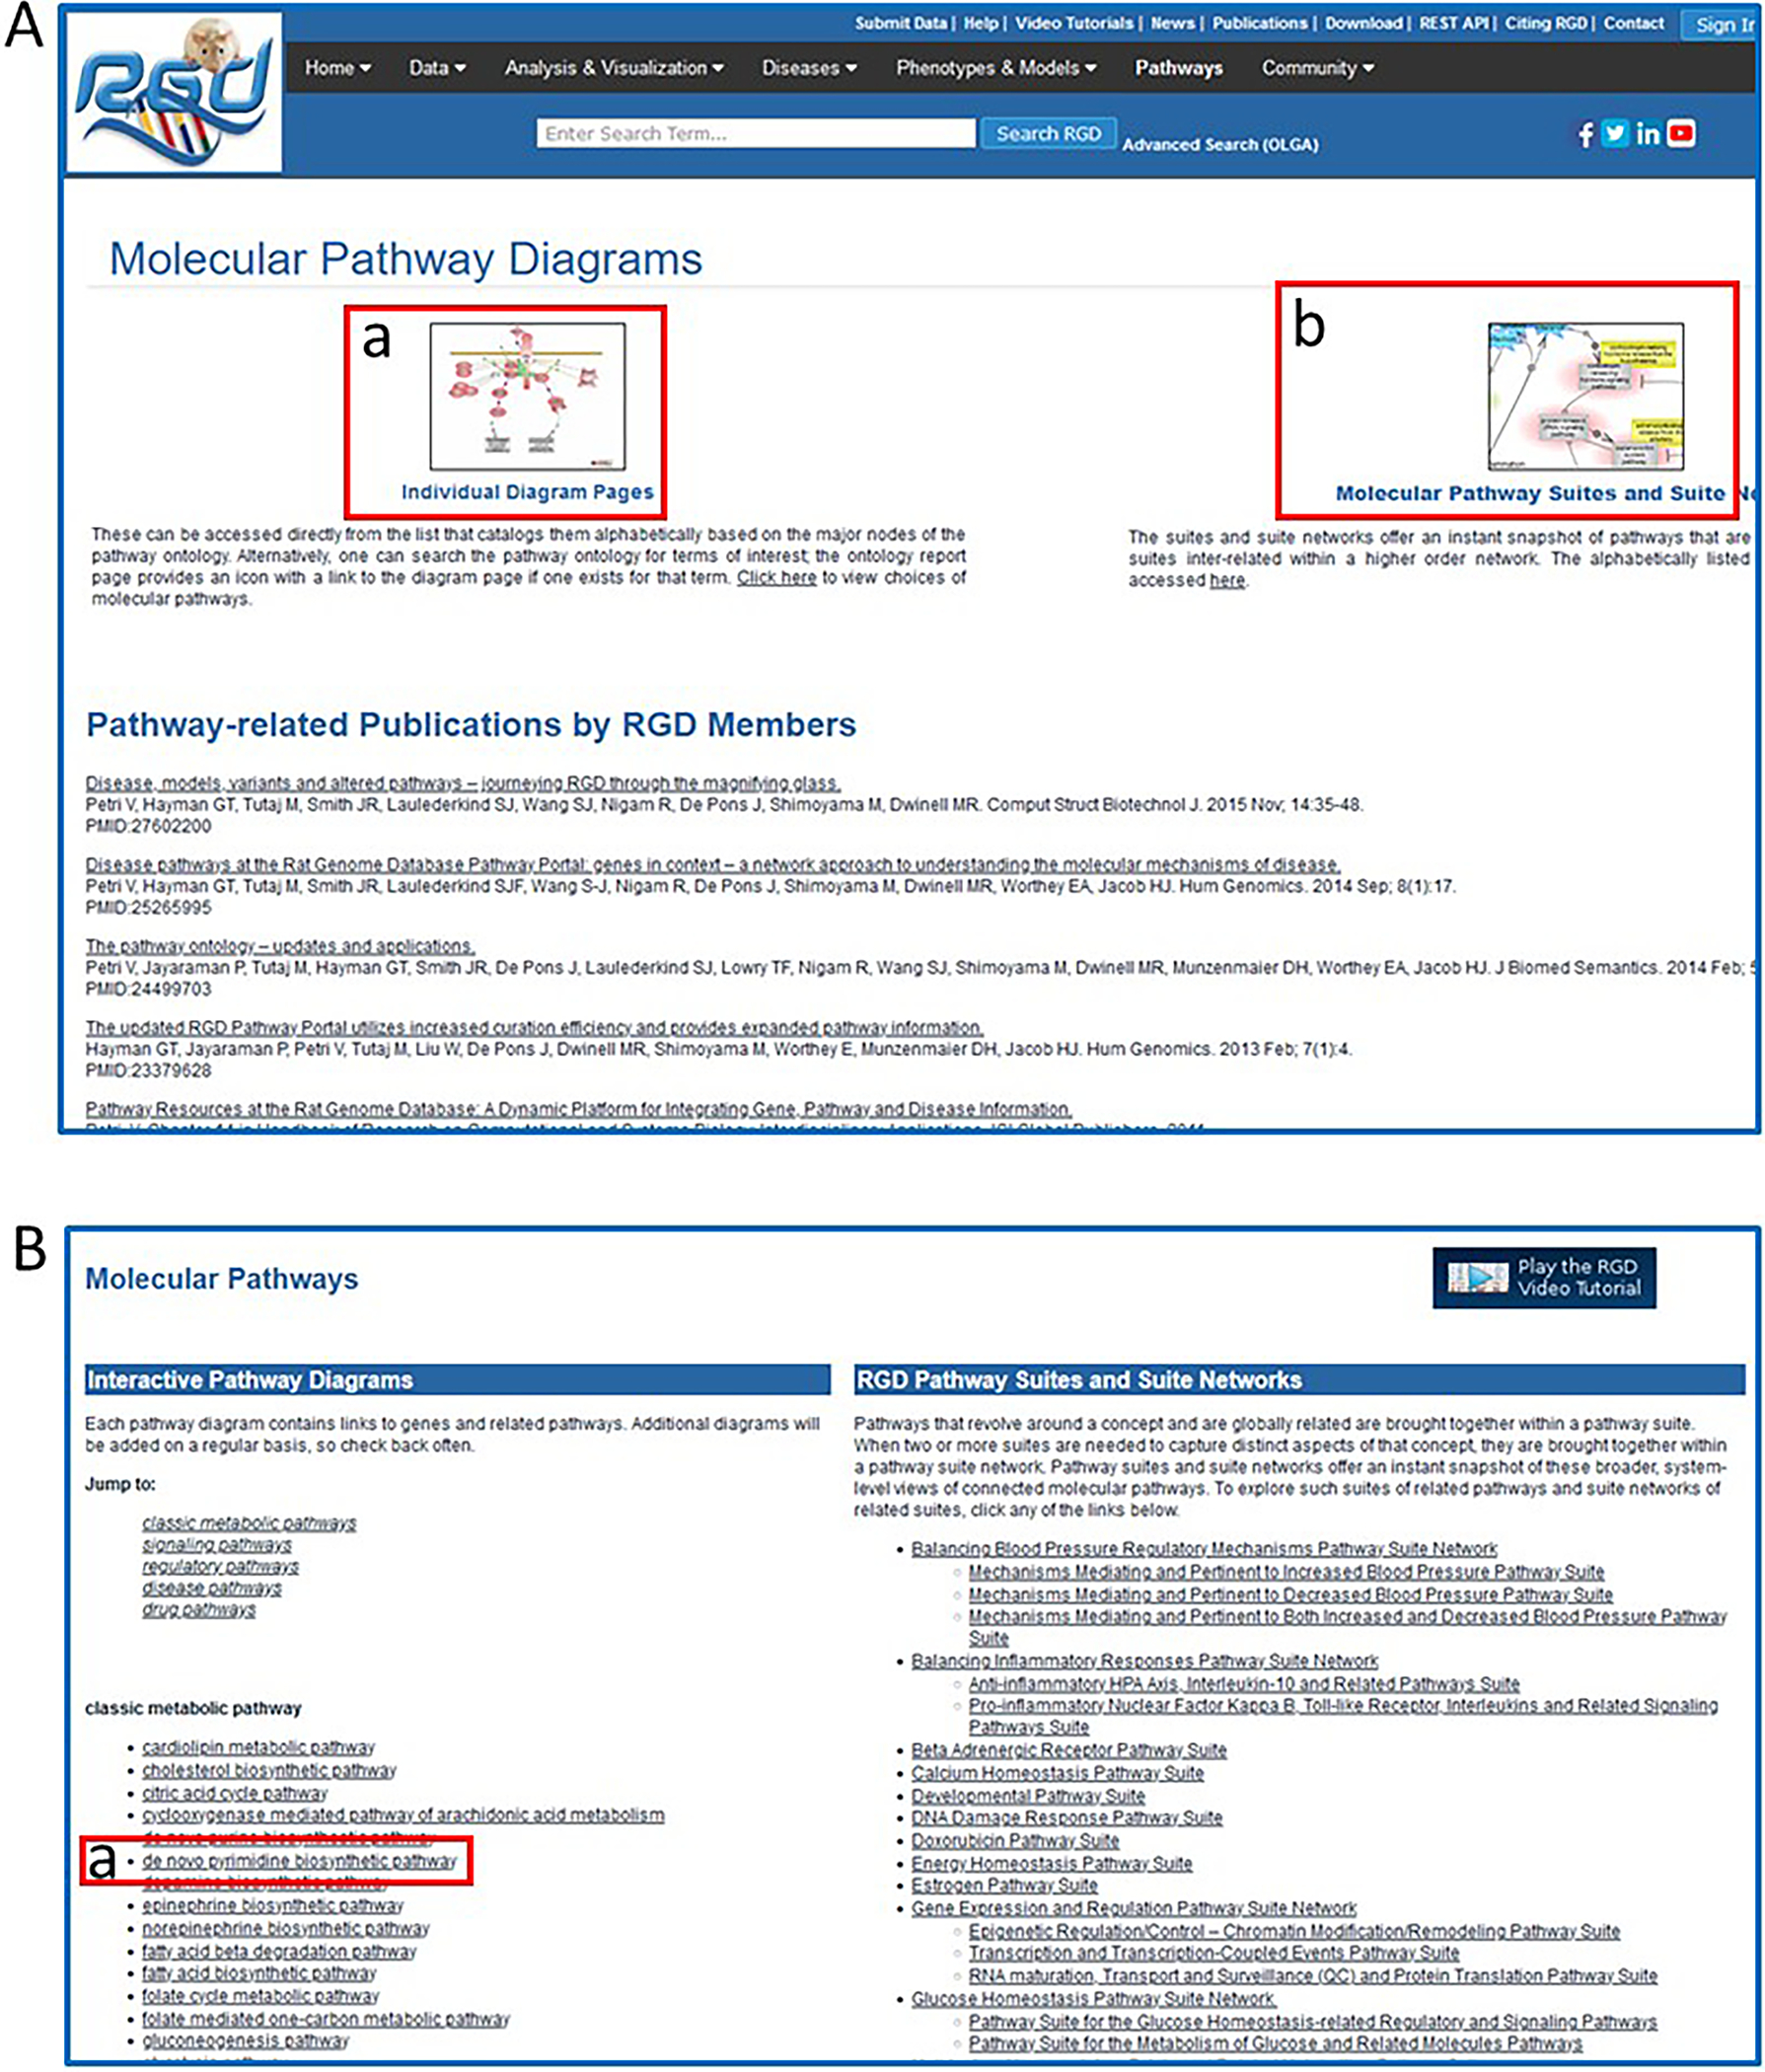
A. Homepage of the RGD Pathway Portal showing the options of “Molecular Pathway Diagrams” (41-a) and “Molecular Pathway Suites and Suite Networks” (41-b), links that lead to the pathway diagrams homepage (41B). B. Pathway diagram homepage with links to all pathway diagrams in RGD, including “de novo pyrimidine biosynthetic pathway” (B-a).
Click on “de novo pyrimidine biosynthetic pathway” in the “classic metabolic pathway” list (Fig. 41B–a). This link accesses the de novo Below the diagrams on the pages of molecular pathways there are several lists: 1. “Genes in Pathway”: A list of genes showing annotations to the title term of the diagram and to children terms of the title term from the Pathway Ontology (Petri, et al. 2014) (Fig. 43A). 2. “Additional Elements in Pathway”: A list found on a subset of pathway diagram pages. This list may include small molecules, gene groups, other pathways, etc. (Fig. 43B). 3. “Pathway Gene Annotations”: A list of disease terms annotated to the genes involved in the pathway. This list can be toggled between disease term to genes and gene to disease terms (Fig. 43C). 4. A list of additional pathways in which the genes in the diagram are involved. This list can be toggled between pathway term to genes and gene to pathway terms (Fig. 43D). 5. A subset of diagram pages have a list of phenotype terms annotated to the genes involved in the pathway. This list can be toggled between phenotype term to genes and gene to phenotype terms (Fig. 43E).
Figure 43.
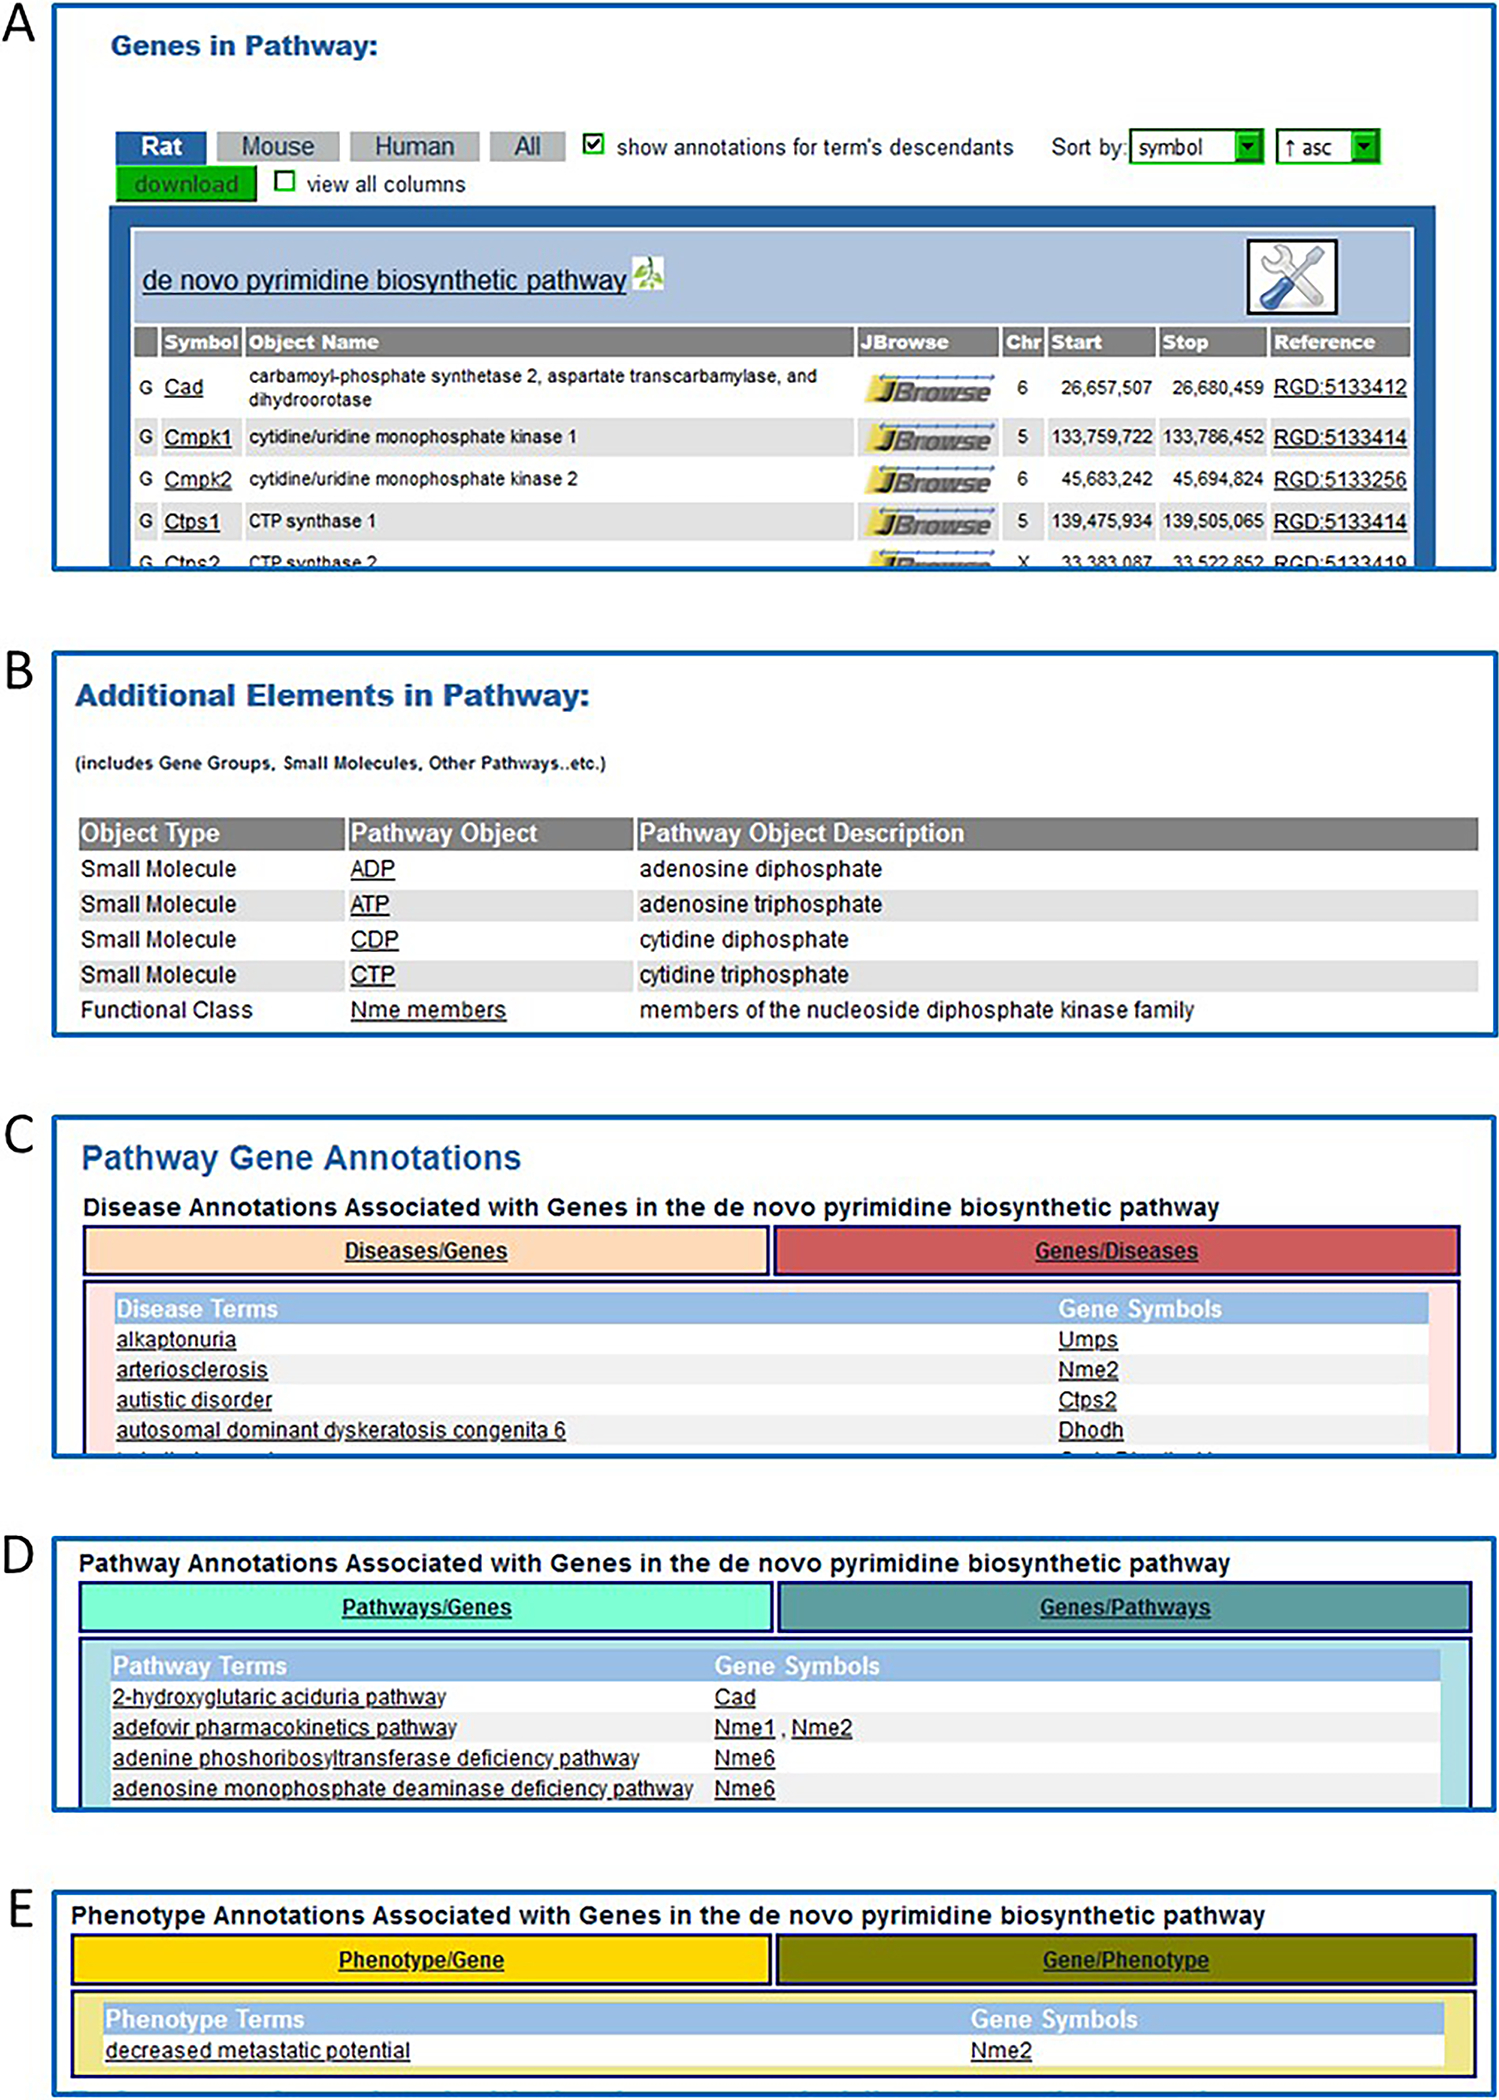
Additional sections of the “de novo pyrimidine biosynthetic pathway” diagram page which appear below the diagram on the webpage. A. “Genes in Pathway”: A list of genes with annotations to the title term of the diagram and to child terms of the title pathway from the Pathway Ontology. B. “Additional Elements in Pathway” is a list of small molecules and a gene group. C. “Pathway Gene Annotations” is a list of disease terms associated with the genes involved in the diagrammed pathway. This list toggles between disease term to genes and gene to disease terms. D. A list of additional pathways with which the diagrammed pathway genes are involved. This list toggles between pathway term to genes and gene to pathway terms. E. A list of phenotype terms associated with the genes involved in the diagrammed pathway. This list toggles between phenotype term to genes and gene to phenotype terms.
Background Information
The Rat Genome Database was established in 1999 as a resource to support the already growing set of genomic reagents for the rat. This role has continued to expand with continuing work on the rat reference genome sequence (Aitman, et al. 2008) (Howe, et al. 2021), strain-specific DNA sequencing (Kalbfleisch, et al. 2023), expanded SNP discovery, and large-scale phenotyping projects such as the PhysGen project (Kunert, et al. 2008) and NBRP (Serikawa, et al. 2009) (http://www.anim.med.kyoto-u.ac.jp/nbr/). All of the indicated sequence and phenotypic data has been integrated with existing and newly published research data. As the amount of data has grown, so has the need to add more types of data and more ways to present that data. Much effort has gone into the development and incorporation of biomedical ontologies such as the Gene Ontology (Ashburner, et al. 2000), the Mammalian Phenotype Ontology (Smith, et al. 2005), the Pathway Ontology (Petri, et al. 2011), and others (Laulederkind, et al. 2012) (Laulederkind and Peoples 2022; Shimoyama, et al. 2012). These are incorporated into the search and analysis tools, greatly facilitating the discovery of information and interpretation of its meaning.
As this unit has demonstrated, interaction with a database is primarily through a web browser and other software developed on top of the database. A concerted effort has gone into developing tools that provide access to the underlying data in a manner that is aligned with a researcher’s overall goal. GViewer presents data in the context of the entire genome; JBrowse shows genes, QTLs, markers, and phenotypic annotations also from a genome-based perspective; and PhenoMiner presents quantitative phenotype data in an easy modular format. With the fundamental data curation processes in place to acquire and integrate data, the tools constructed to visualize and analyze this data are important to provide access to the data for researchers.
Many researchers using the rat as a model system are ultimately studying a specific phenotype or disease with the goal of applying this knowledge to humans. To meet this need, RGD has developed “disease portals” that present RGD data and tools from the perspective of a particular disease. The disease portals allow researchers to visit a single page that is focused on a single disease area like cardiovascular, neurological, or respiratory disease (https://rgd.mcw.edu/rgdweb/portal/index.jsp). These disease categories have been targeted by specific curation projects to create portals which cover most of the breadth of human pathology. The rest of RGD is accessible via these portals, but researchers can find the items of greatest relevance to their disease interest first, reducing the challenge of finding the data and interpreting its meaning.
Utilizing RGD beyond the Web site
RGD has a staff of experienced curators and bioinformaticians that have a great deal of experience dealing with rat data specifically and genomic data in general. The authors of this unit welcome the opportunity to discuss data from impending publications to work with researchers to establish correct nomenclature for rat strains, genes, QTLs, and markers. Nomenclature guidelines are available online (https://rgd.mcw.edu/nomen/nomen.shtml). Authors can also make direct submissions of published data so that they can be more rapidly integrated into RGD and other online resources (https://rgd.mcw.edu/registration-entry.shtml). If users have questions about tools or data or would like advice on methods of online data mining of RGD resources and integration of this data with the experimental work of an individual laboratory, they should contact the RGD team via the Contact page (https://rgd.mcw.edu/contact/), and each request will be answered to the best of the staff’s ability.
Suggestions for Further Analysis
Other databases relevant to the rat
RGD maintains a resources page that contains links to other online resources for rat research (https://rgd.mcw.edu/wg/resource-links). The sequence and genomic databases are well known, but for the animals themselves, some very useful rat strain resources exist, including the Rat Resource and Research Center (http://www.rrrc.us/) at the University of Missouri and The National Bio Resource for the Rat in Japan (http://www.anim.med.kyoto-u.ac.jp/nbr/) at Kyoto University.
Downloading bulk data
The RGD download site maintains regularly updated files of all RGD data that can be downloaded and used in subsequent studies. These include the curated gene, QTL, strain and marker datasets, mapping information, genome annotation (in GFF format), and sequence files for RGD data. The download site can be reached by clicking the “Download” link found in the menu bar on the top of most RGD web pages (Fig. 1). This link will lead to the download page (https://download.rgd.mcw.edu/) where one can browse the files available for download.
Figure 42.
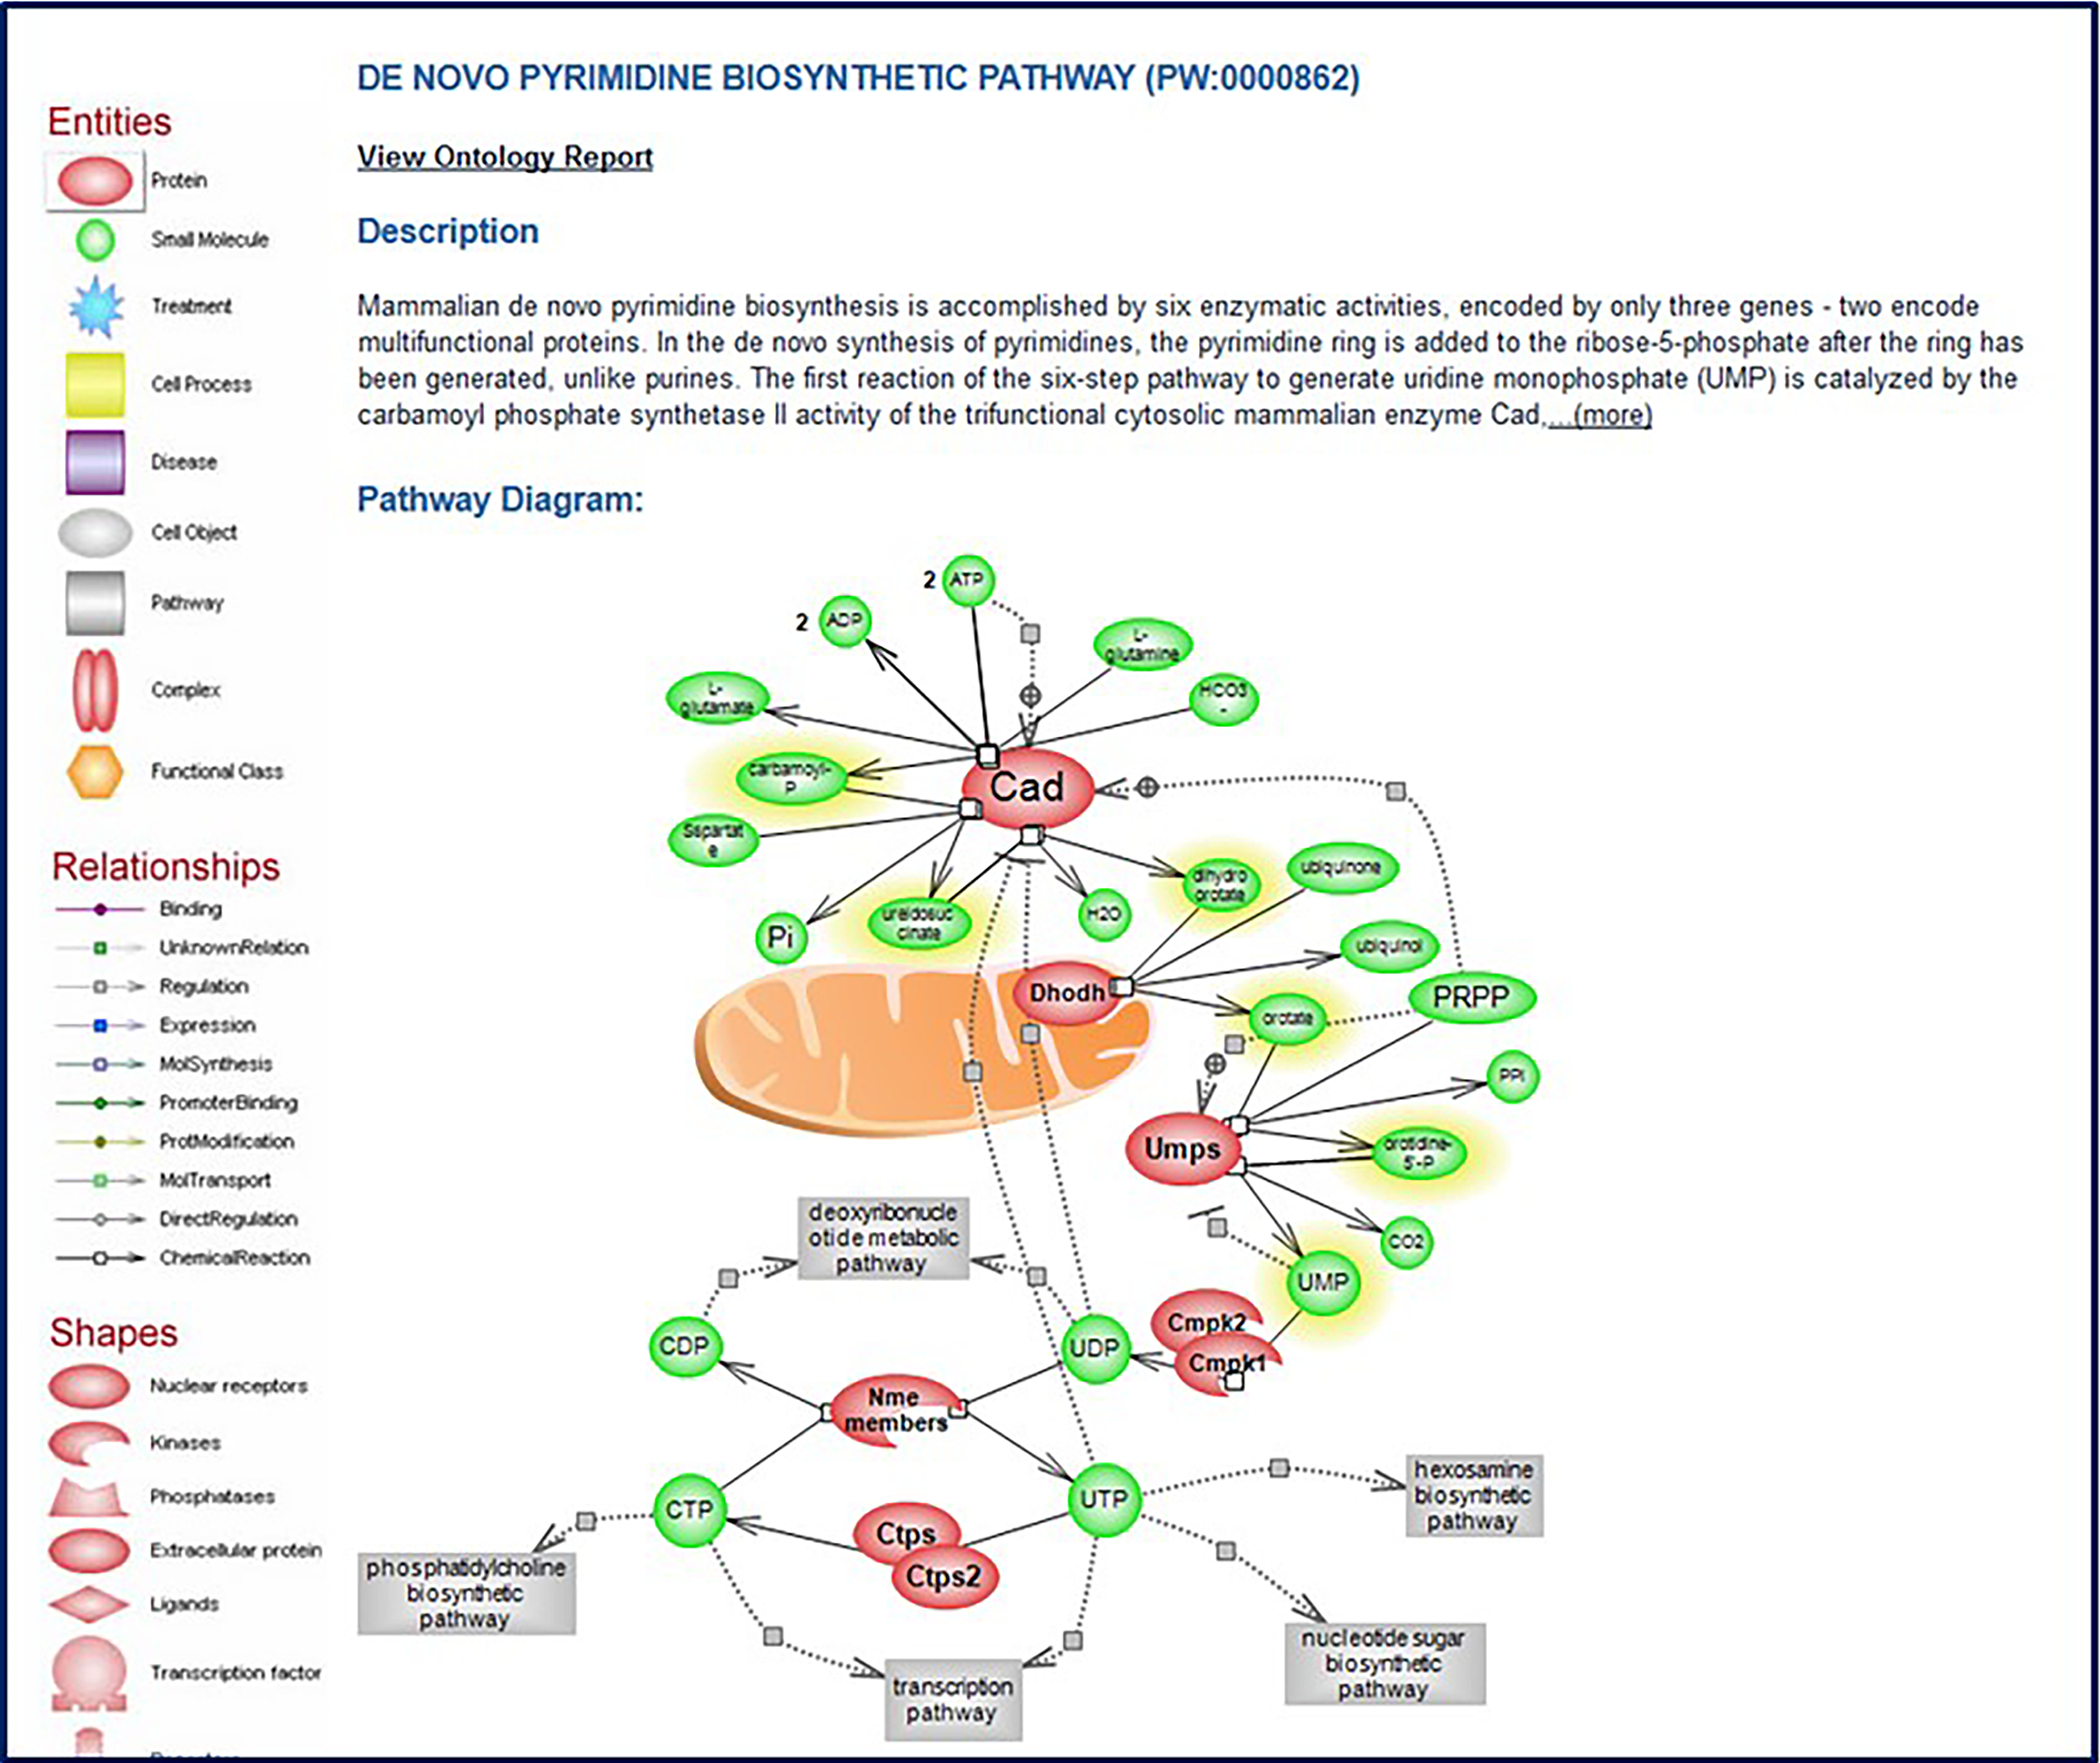
The pathway diagram page for “de novo pyrimidine biosynthetic pathway” (PW:0000862).
Acknowledgments
RGD is supported by the National Heart, Lung, and Blood Institute on behalf of the National Institutes of Health [HL64541].
Footnotes
CONFLICT OF INTEREST STATEMENT:
Disclosure Statement: The authors have no conflicts of interest to declare.
Internet Resources
The Rat Genome Database home page.
Site to download flat files of RGD data including genes, QTLs, microsatellites (SSLPs), maps (genetic, radiation hybrid), strains, genome annotations, and sequence files.
http://mailman.mcw.edu/mailman/listinfo/rat-forum
Rat Community Forum, online bulletin board for rat-related questions.
https://www.facebook.com/RatGenomeDatabase/
RGD on Facebook: updates on rats, rat research, and new features at the Rat Genome Database.
RGD on Twitter: updates on rats, rat research, and new features at the Rat Genome Database
https://www.linkedin.com/company/rat-genome-database
RGD on Linkedin: updates on rats, rat research, new features, and general information about the Rat Genome Database.
DATA AVAILABILITY STATEMENT:
The data referenced in this report are available in the Rat Genome Database at https://rgd.mcw.edu/. These data were derived from the following resources available in the public domain: PubMed (https://pubmed.ncbi.nlm.nih.gov/), Gene Ontology Consortium (http://geneontology.org/), Mouse Genome Informatics (https://www.informatics.jax.org/), HGNC (https://www.genenames.org/), UniProt (https://www.uniprot.org/), Ensembl (http://useast.ensembl.org/index.html), and NCBI (https://www.ncbi.nlm.nih.gov/).
Literature Cited
- Aitman TJ, et al. 2008. Progress and prospects in rat genetics: a community view. Nat Genet 40(5):516–22. [DOI] [PubMed] [Google Scholar]
- Ashburner M, et al. 2000. Gene ontology: tool for the unification of biology. The Gene Ontology Consortium. Nat Genet 25(1):25–9. [DOI] [PMC free article] [PubMed] [Google Scholar]
- Buels R, et al. 2016. JBrowse: a dynamic web platform for genome visualization and analysis. Genome Biol 17:66. [DOI] [PMC free article] [PubMed] [Google Scholar]
- Howe K, et al. 2021. The genome sequence of the Norway rat, Rattus norvegicus Berkenhout 1769. Wellcome Open Res 6:118. [DOI] [PMC free article] [PubMed] [Google Scholar]
- Kalbfleisch TS, et al. 2023. The Assembled Genome of the Stroke-Prone Spontaneously Hypertensive Rat. Hypertension 80(1):138–146. [DOI] [PMC free article] [PubMed] [Google Scholar]
- Kunert MP, et al. 2008. Sex-specific differences in chromosome-dependent regulation of vascular reactivity in female consomic rat strains from a SSxBN cross. Am J Physiol Regul Integr Comp Physiol 295(2):R516–27. [DOI] [PMC free article] [PubMed] [Google Scholar]
- Laulederkind SJF, et al. 2019. Rat Genome Databases, Repositories, and Tools. Methods Mol Biol 2018:71–96. [DOI] [PubMed] [Google Scholar]
- Laulederkind SJF, et al. 2018. A Primer for the Rat Genome Database (RGD). Methods Mol Biol 1757:163–209. [DOI] [PMC free article] [PubMed] [Google Scholar]
- Laulederkind SJ, et al. 2012. Ontology searching and browsing at the Rat Genome Database. Database (Oxford) 2012:bas016. [DOI] [PMC free article] [PubMed] [Google Scholar]
- Laulederkind Zoe, and Peoples James 2022. Productivity and Cost Patterns in the All-Cargo US Airline Sector. In The International Air Cargo Industry. Nolan J and Peoples J, eds. Pp. 83–116. Advances in Airline Economics: Emerald Publishing Limited. [Google Scholar]
- Malek RL, et al. 2006. Physiogenomic resources for rat models of heart, lung and blood disorders. Nat Genet 38(2):234–9. [DOI] [PubMed] [Google Scholar]
- Orchard S, et al. 2014. The MIntAct project--IntAct as a common curation platform for 11 molecular interaction databases. Nucleic Acids Res 42(Database issue):D358–63. [DOI] [PMC free article] [PubMed] [Google Scholar]
- Orchard S, et al. 2012. Protein interaction data curation: the International Molecular Exchange (IMEx) consortium. Nat Methods 9(4):345–50. [DOI] [PMC free article] [PubMed] [Google Scholar]
- Petri V, et al. 2014. The pathway ontology - updates and applications. J Biomed Semantics 5(1):7. [DOI] [PMC free article] [PubMed] [Google Scholar]
- Petri V, et al. 2011. The Rat Genome Database pathway portal. Database (Oxford) 2011:bar010. [DOI] [PMC free article] [PubMed] [Google Scholar]
- Serikawa T, et al. 2009. National BioResource Project-Rat and related activities. Exp Anim 58(4):333–41. [DOI] [PubMed] [Google Scholar]
- Shannon P, et al. 2003. Cytoscape: a software environment for integrated models of biomolecular interaction networks. Genome Res 13(11):2498–504. [DOI] [PMC free article] [PubMed] [Google Scholar]
- Shimoyama M, et al. 2012. Three ontologies to define phenotype measurement data. Front Genet 3:87. [DOI] [PMC free article] [PubMed] [Google Scholar]
- Smith CL, Goldsmith CA, and Eppig JT 2005. The Mammalian Phenotype Ontology as a tool for annotating, analyzing and comparing phenotypic information. Genome Biol 6(1):R7. [DOI] [PMC free article] [PubMed] [Google Scholar]
- Smith JR, et al. 2020. The Year of the Rat: The Rat Genome Database at 20: a multi-species knowledgebase and analysis platform. Nucleic Acids Res 48(D1):D731–d742. [DOI] [PMC free article] [PubMed] [Google Scholar]
- Vedi M, et al. 2022. MOET: a web-based gene set enrichment tool at the Rat Genome Database for multiontology and multispecies analyses. Genetics 220(4). [DOI] [PMC free article] [PubMed] [Google Scholar]
Associated Data
This section collects any data citations, data availability statements, or supplementary materials included in this article.
Data Availability Statement
The data referenced in this report are available in the Rat Genome Database at https://rgd.mcw.edu/. These data were derived from the following resources available in the public domain: PubMed (https://pubmed.ncbi.nlm.nih.gov/), Gene Ontology Consortium (http://geneontology.org/), Mouse Genome Informatics (https://www.informatics.jax.org/), HGNC (https://www.genenames.org/), UniProt (https://www.uniprot.org/), Ensembl (http://useast.ensembl.org/index.html), and NCBI (https://www.ncbi.nlm.nih.gov/).


