Abstract
Hereditary congenital facial paresis type 1 (HCFP1) is an autosomal dominant disorder of absent or limited facial movement that maps to chromosome 3q21-q22 and is hypothesized to result from facial branchial motor neuron (FBMN) maldevelopment. In the present study, we report that HCFP1 results from heterozygous duplications within a neuron-specific GATA2 regulatory region that includes two enhancers and one silencer, and from noncoding single-nucleotide variants (SNVs) within the silencer. Some SNVs impair binding of NR2F1 to the silencer in vitro and in vivo and attenuate in vivo enhancer reporter expression in FBMNs. Gata2 and its effector Gata3 are essential for inner-ear efferent neuron (IEE) but not FBMN development. A humanized HCFP1 mouse model extends Gata2 expression, favors the formation of IEEs over FBMNs and is rescued by conditional loss of Gata3. These findings highlight the importance of temporal gene regulation in development and of noncoding variation in rare mendelian disease.
Subject terms: Neurodevelopmental disorders, Neurological disorders, Neurogenesis, Transcriptomics, Gene regulation
GATA2 regulatory mutations are associated with hereditary congenital facial paresis in humans. A genetically engineered mouse model recapitulates the human phenotype, showing altered neuron-specific Gata2 expression and a bias in formation of inner-ear efferent neurons over facial branchial motor neurons.
Main
The noncoding human genome contains cis-regulatory elements (cREs) that can be bound by transcription factors (TFs) and act as cell-type-specific enhancers or silencers to define complex gene regulatory programs1–3. Recent advances have revealed that cRE variants may cause rare disease4–6; however, determination of the precise mechanism is difficult due to the need to study cREs in their relevant cellular and temporal context. Such studies are particularly challenging for developmental disorders where the fate of a small number of progenitors is defined by dynamic transcriptional states7–13.
HCFP1 is a rare autosomal dominant disorder of absent or limited facial movement that was mapped to a 3-cM region of chromosome 3q21.2–22 (refs. 14,15). Neuropathology revealed a decreased number of FBMNs and facial nerve hypoplasia16. Sequencing of genes in the critical region, including GATA2, did not identify pathogenic coding variants17.
In the present study, we report that HCFP1 results from noncoding variants within a cell-type-specific GATA2 regulatory region. We identified two adjacent clusters of noncoding SNVs that alter a conserved cRE (cRE2) and overlapping tandem duplications of cRE2 and the adjacent GATA2 enhancers, cRE1 and cRE3. We demonstrate that one cRE2 SNV cluster impairs binding of nuclear receptor subfamily 2 group F member 1 (NR2F1; COUP-TF1) and attenuates its repressive activity in a cell-specific manner. We show that GATA2, and its downstream effector GATA3 (refs. 18,19), are necessary to differentiate rhombomere 4 motor neurons (r4MNs) to IEEs but are dispensable for FBMN development. By contrast, a humanized cRE1 duplication mouse has ectopic expression of Gata2 in developing FBMNs and this phenotype is rescued by genetically ablating Gata3. This mechanism highlights the importance of tight temporal control of TF expression in a cell-type-specific manner during development and supports whole-genome sequencing (WGS) to identify noncoding variation underlying rare Mendelian disorders.
Results
Tandem duplications and noncoding SNVs at the HCFP1 locus
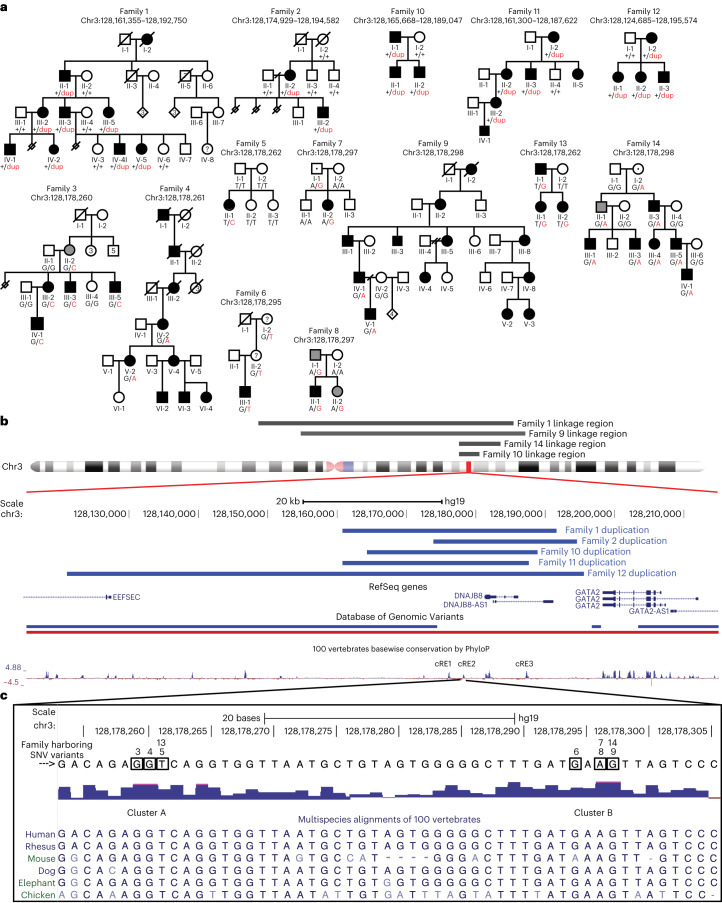
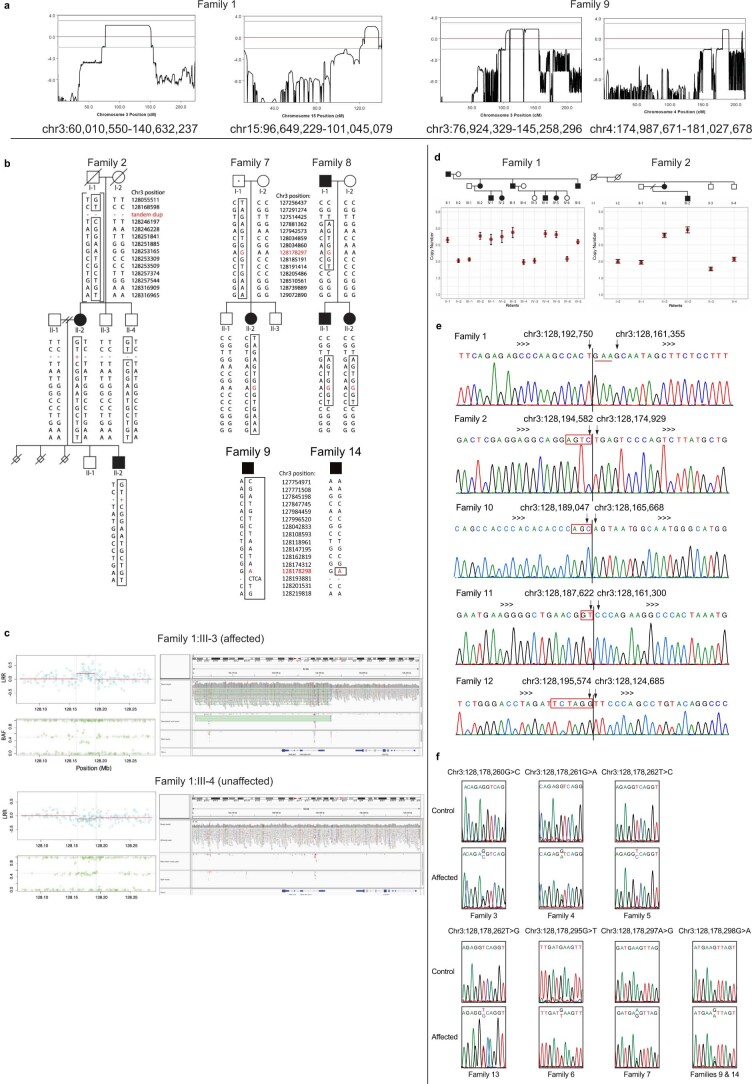
We enrolled families and simplex cases with nonsyndromic congenital facial paresis (CFP, cohort 1 US-based study) and performed genome-wide single-nucleotide polymorphism (SNP) analysis and whole-exome sequencing (WES) in two large dominant pedigrees, family 1 (Fam1) and family 9 (Fam9; Fig. 1a). SNP-based multipoint parametric linkage analysis assumed autosomal dominant inheritance and full penetrance yielded maximum lod (logarithm of odds) scores suggestive of linkage at an overlapping 63-Mb chr3 region encompassing the previously reported HCFP1 locus14,15 (Fig. 1b and Extended Data Fig. 1a). WES analysis did not identify pathogenic coding variants within the suggestive regions of linkage in either family. To identify HCPF1 variants, we performed WGS from members of Fam1, Fam9 and seven additional HCFP pedigrees in cohort 1 (two vertical, one horizontal transmission and four simplex cases). Structural variation analysis20 revealed 31-kb and 20-kb overlapping tandem duplications within the HCPF1 locus in Fam1 and Fam2 (de novo), respectively (Fig. 1a,b and Extended Data Fig. 1b,c). We next analyzed WGS for SNVs or indels (insertions and deletions) within the Fam1/Fam2 ~18-kb minimum duplication region. Fam3, Fam7 and Fam9 each harbored a unique SNV within an ~270-bp, noncoding, conserved element (chr3:128,178,158–128,178,397; GRCh37/hg19). We resequenced and conducted double droplet PCR (ddPCR) of this element in the remaining cohort 1 probands: 2 pedigrees with vertical transmission, 4 sibling pairs and 31 simplex cases. SNVs were identified in dominant Fam4 and Fam8 and simplex Fam5 (de novo) and Fam6 (Fig. 1a,c and Extended Data Fig. 1d–f).
Fig. 1. Tandem duplications and noncoding heterozygous variants segregate with HCFP1.
a, Pedigrees of families 1–14. Above each pedigree is the chromosomal location of its CFP-causing variant. Below each individual is the pedigree position and, for participating individuals, the genotype for the variant allele (abbreviated pedigree is shown for Fam10, see ref. 15, and for Fam14, see ref. 14). For Fam1, -2 and -10 to -12, the WT allele is denoted by a black ‘+’ and the duplication allele by a red ‘dup’. For Fam3–9, -13 and -14, the WT and variant nucleotides are denoted by black and red letters, respectively. Squares show males, circles females; black fill shows affected and gray fill shows self-reported, unaffected but mild facial weakness on examination; and dotted square or circle shows nonpenetrant phenotype. b, Schematic genomic representation based on UCSC (University of California, Santa Cruz) Genome Browser output. Gray horizontal bars above chr3 ideogram denote previously reported HCFP1 linkage regions (chr3:127,454,048–130,530,963, all human coordinates are from GRCh37/hg19) (refs. 14,15) for Fam10 and Fam14, and regions consistent with linkage for Fam1 and Fam9 (63 Mb minimum overlap chr3:76,924,329–140,632,237). Under the ideogram are: GRCh37/hg19 nucleotide positions; thick blue horizontal bars denoting Fam1, -2 and -10 to -12 overlapping duplications; genes in the region; structural variants in the DGV (blue duplications, red deletions); and conservation based on the PhyloP score. Hg19 genomic coordinates are: GATA2 (chr3:128,198,270–128,212,044), cRE1 (chr3:128,176,017–128,176,396), cRE2 (chr3:128,178,158–128,178,397) and cRE3 (chr3:128,187,090–128,187,620). c, Magnification of the sequence and multispecies alignment of the cRE2-conserved region harboring all seven SNVs. The WT nucleotide of each SNV is boxed with the family ID harboring an SNV indicated above the box. The two clusters of variants lie 32 bp apart and are labeled ‘Cluster A’ and ‘Cluster B’. Multispecies alignment reveals, in mice, a 4-bp deletion between Cluster A and Cluster B, and lack of conservation of the Fam6 variant. See also Extended Data Figs. 1 and 2.
Extended Data Fig. 1. Genetic analysis of HCFP1 pedigrees.
(a) The HCFP1 locus linkage data in Fam1 (LOD 2.1) and Fam9 (LOD 1.8). (b) Fam2, Fam7-9, Fam14 haplotypes. hg19 position of each SNP on chromosome 3 provided; disease-causing variants are indicated in red. Fam2 duplication arose de novo in II-2 on an allele inherited from I-1 (Fam2:I-1 haplotypes assumed). Fam7 and Fam8 harbored the same HCFP1 SNV and shared a >310 kb haploidentical region (chr3:127,881,362-chr3:128,191,414), suggesting the SNV is derived from a common ancestor. Fam9 and Fam14 harbor the same SNV on different haplotypes, suggesting independent mutational events. (c) SNP array data (left) and genome sequence (right) encompassing the Fam1 duplication; affected Fam1:III-3 (top), unaffected Fam1:III-4 (bottom). For SNP arrays, the Log R Ratio (LRR) is displayed in blue (top) and the B Allele Frequency (BAF) in green (bottom). Boundaries of the duplication are indicated by vertical dashed lines. LRR value reflects total copy number with the mean value, indicated by red horizontal lines, higher in duplicated than in flanking regions. BAF value is the proportion of B allele among A and B alleles at each SNP; 0, 0.5, and 1 correspond to AA, AB, and BB genotypes. The deviation from 0.5 to 0.33 or 0.66 within Fam1:III-3 corresponds to unbalanced genotypes AAB or ABB, reflecting a duplication signal. (Right) Aligned reads near the breakpoints of each of the two duplications visualized with Integrative Genomics Viewer. Location of the chromosomal region along with read depth, all read pairs, discordant read pairs, and split reads is shown. Duplicated region is highlighted in green. (d) Copy number quantification using digital droplet PCR for Fam1 and Fam2 duplications. Copy number values are the average of three experiments. Error bars indicate standard error. (e) Sanger sequencing traces that define duplication breakpoints (vertical black line) for each pedigree. Arrows preceding and following the vertical line indicate the most distal and proximal nucleotide in the duplication, respectively. Fam1 has an insertion of nucleotides GAA at the breakpoint (underlined). Fam2, Fam10-Fam12 have microhomology identified at the breakpoint (red-boxed nucleotides). (f) Sanger sequencing traces for each SNV with representative results of an affected and control individual.
Cohort 2 (Europe-based study) included the two pedigrees that originally defined the HCFP1 locus14,15, in whom we identified a 23-kb tandem duplication in Fam10 and an SNV in Fam14. WGS analysis of 14 additional probands in cohort 2 (4 vertical, 2 horizontal, 2 unknown transmission and 6 simplex cases) identified variations that segregated with affected individuals in three dominant pedigrees: duplications were detected in Fam11 and Fam12 and an SNV was detected in Fam13 (Fig. 1a–c and Extended Data Fig. 1b,e,f).
Each copy number variant (CNV) was fully penetrant and breakpoints were confirmed (Fig. 1a,b and Extended Data Fig. 1e). The five overlapping duplications defined a 12.7-kb minimum region (chr3:128,174,929–128,187,620) absent from the Database of Genomic Variants (DGV)21 and gnomAD (v.2.1.1) (ref. 22). Fam2 and Fam10–12 had breakpoint microhomology, suggesting that they originated by replication-based, microhomology-mediated repair23,24, whereas Fam1 had a three-nucleotide base-pair insertion (GAA) at the breakpoint (Extended Data Fig. 1e).
All seven SNVs fall within a conserved noncoding region and alter six highly conserved nucleotides located in two clusters (Fig. 1a and Extended Data Fig. 1f). Cluster A variants alter three adjacent nucleotides whereas Cluster B variants alter three of four adjacent nucleotides (Fig. 1c). Six SNVs are absent from gnomAD and other public databases, including chr3:128,178,298G>A, which appears to have risen independently in Fam9 and Fam14 (Extended Data Fig. 1b). By contrast, Fam7 and Fam8 share a rare ancestral haplotype flanking chr3:128,178,297A>G (Extended Data Fig. 1b), a variant present in six gnomAD v.3.1.2 individuals (rs987263273, minor allele frequency = 4 × 10⁻⁵). Although Cluster A variants were fully penetrant, Cluster B variants in Fam7, Fam14 and possibly Fam6 had reduced penetrance.
HCFP1 facial weakness is a neurogenic disorder
We examined a subset of participants to determine whether SNVs and duplications resulted in similar phenotypes. Among the 37 variant-positive participants with detailed phenotypic documentation, 2 were clinically unaffected and 4 had mild weakness but considered themselves unaffected (Fig. 1a and Supplementary Table 1). These six individuals all harbor SNVs, suggesting that SNVs can cause a milder phenotype. Among the 35 participants with visible facial weakness, 83% (29 of 35) had bilateral weakness, which was typically asymmetrical with regard to both sidedness and upper versus lower face, and facial nerves (cranial nerve VII) were hypoplastic on magnetic resonance imaging (MRI; Fig. 2a–q). Electromyography, nerve conduction studies, blink studies, acoustic stapedial reflex testing and auditory brainstem response studies were consistent with facial nerve neuropathy in the seven participants tested (Supplementary Clinical Note and Supplementary Tables 1 and 2). Thus, HCFP1 is neurogenic16 and both SNVs and duplications cause nonsyndromic, mild-to-moderate severity CFP, supporting a shared neurodevelopmental mechanism.
Fig. 2. HCFP1 phenotype and facial nerve MRI.
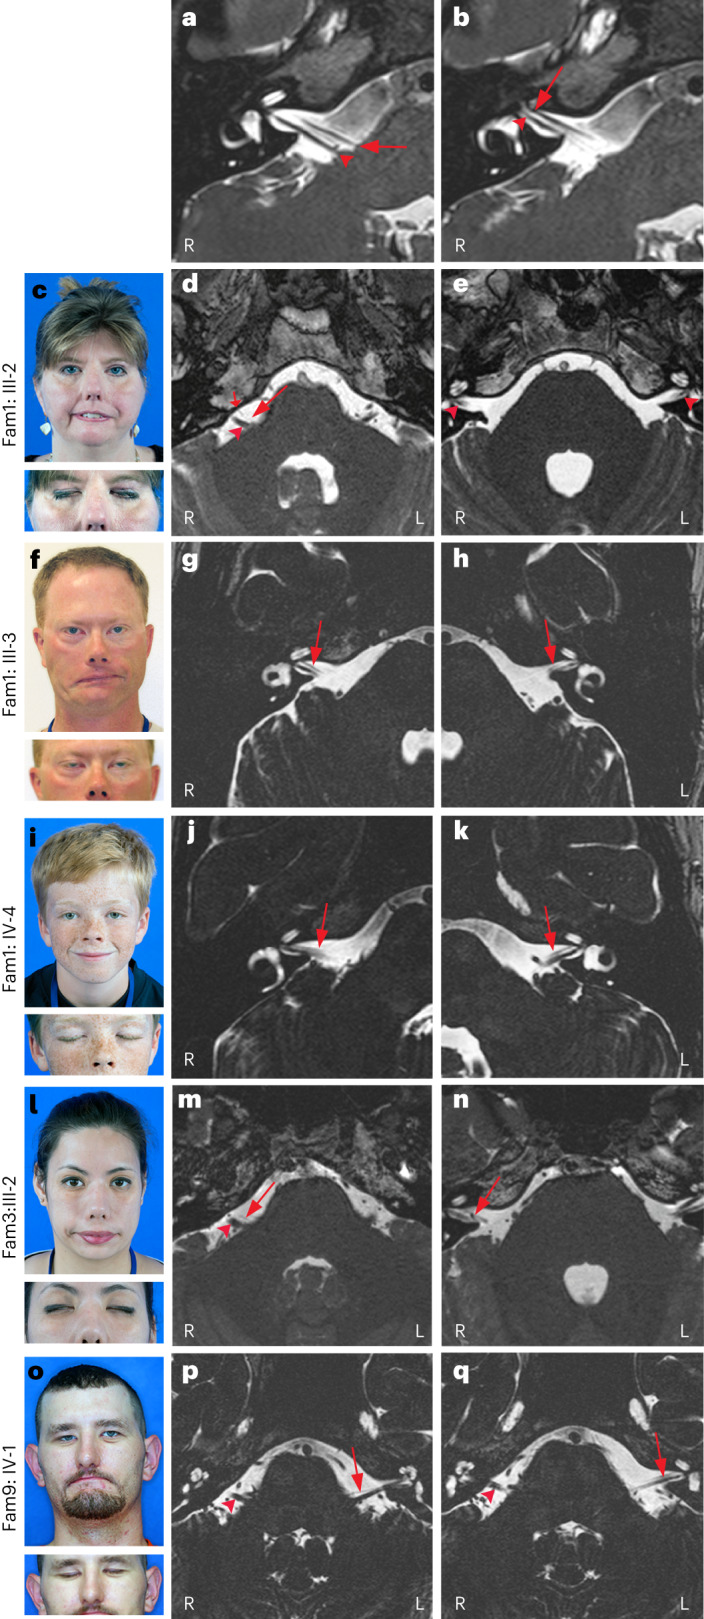
c,f,i,l,o, Photos of affected individuals attempting to smile (top) and close eyes (bottom) highlighting facial weakness (FW), lagophthalmos, absent forehead wrinkles and nasolabial folds, asymmetrical smile, upturned nasal tip and slit-like nares. a,b,d,e,g,h,j,k,m,n,p,q, MR images of facial nerve (VII, arrows) and vestibulocochlear nerve (VIII, arrowheads) in normal and HCFP1 individuals. R, right side; L, left side. a,b, Normal VII anatomy at the level of the right internal auditory canal (IAC) demonstrates origin and cisternal segments of right VII coursing parallel and ventral to VIII (a) and, more laterally, the right VII coursing through the IAC ventral to the superior vestibular branch of VIII (b). c–e, Fam1: III-2, L > R: FW, mild left lagophthalmos (c); markedly hypoplastic right and absent left VII (short arrow: anterior inferior cerebellar artery) (d); and VII not visualized within the IACs (e). f–h, Fam1: III-3, R > L: FW, bilateral lagophthalmos despite gold weight insertions (f); mild right VII hypoplasia (g); and left IAC narrowed, left VII markedly hypoplastic (h). i–k, Fam1: IV-4: asymmetrical R > L FW with good eyelid closure (i); and bilateral R > L VII hypoplasia (j,k). l–n, Fam3: III-2: bilateral L > R FW, R > L lagophthalmos (l); markedly hypoplastic right VII cisternal segment (m); mildly hypoplastic right VII IAC segment (n); and absent left VII cisternal segment (m,n). o–q, Fam9: IV-1: L > R FW, minimal lagophthalmos (o); right VII cisternal segment not visible; hypoplastic left VII cisternal and IAC segments (p,q).
Variants alter cREs within a GATA2 regulatory region
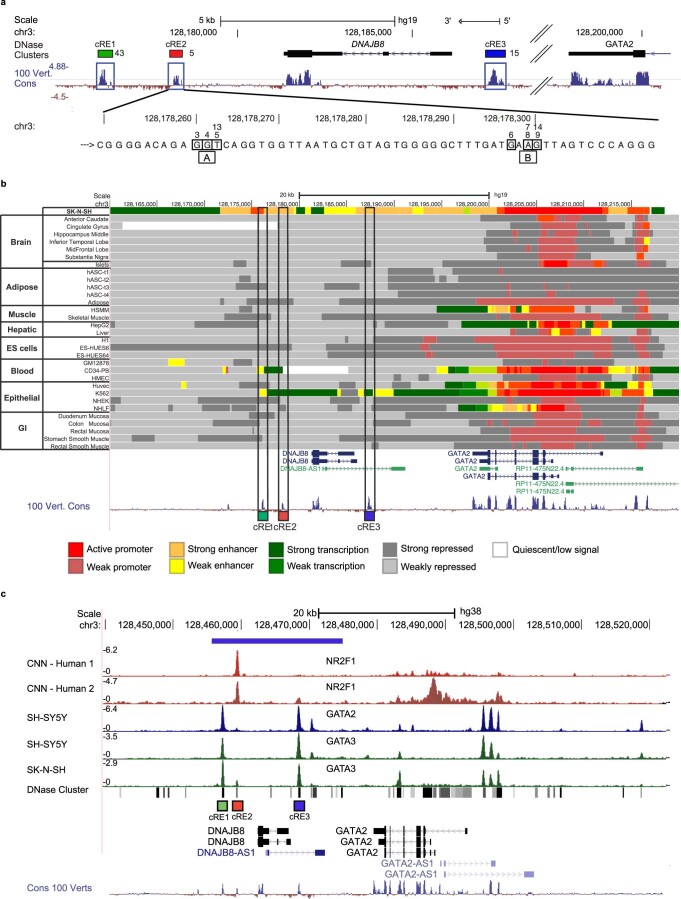
All five CNVs duplicate highly conserved noncoding regions that we refer to as cRE1, cRE2 and cRE3 located 3′ of GATA2 and flanking DNAJB8. All seven SNVs are located within cRE2 (Fig. 1b,c and Extended Data Fig. 2a). GATA2 encodes a pleiotropic TF that regulates numerous genes critical for embryonic development and neuronal cell fate25,26 and haploinsufficiency results in blood and immune disorders. Multiple cREs contribute to regulation of GATA2 expression in the blood, kidney and brain27,28. Among these, cRE1 and cRE3 function as enhancers and drive β-galactosidase expression in mice in a pattern recapitulating native Gata2 expression, including in r4 of the developing hindbrain29. Examination of published data1,30,31 (Extended Data Fig. 2b) reveals that GATA2, but not DNAJB8, is transcribed in many cell types. The cRE1–3 overlaps with regions of chromatin open only in neuroblastoma cell lines, where GATA2 is also transcribed. Published chromatin immunoprecipitation sequencing (ChIP-seq) experiments in neuroblastoma lines show binding of GATA2 and GATA3 to cRE1 and cRE3, but not cRE2 (Extended Data Fig. 2c)1,32. These data highlight co-regulation and cell-type specificity of cRE1–3 and support them as part of a GATA2 regulatory region in human neuroblastoma cell lines and in mice29,33.
Extended Data Fig. 2. Detailed analysis of HCFP1 region.
(a) Magnification of the UCSC Genome Browser output from Fig. 1 with multispecies conservation and the three cREs boxed in blue. Green, red, and blue boxes above cREs denote DNAse clusters reported by ENCODE with the number of unique cell lines/tissue in which the cRE has been found open. (b) Chromatin state segmentation of the HCFP1 region in different human tissues and cell lines from CistromeDB30,31 and ENCODE1 data. In SK-N-SH neuroblastoma cells (top track), there are uninterrupted stretch enhancer regions 14.8kb in length encompassing cRE3 and 3.4kb in length encompassing cRE1 and cRE287. The active promoter and active transcription chromatin states indicate an overall high regulatory activity of this region in SK-N-SH cells. The largely repressive chromatin state of the corresponding region in a wide range of other tissues and cells (remaining tracks) highlights how cell-type-specific epigenomic states could potentially influence cRE activity and GATA2 expression. DNAJB8, a molecular chaperone not known to be associated with human disease, is not widely transcribed. (c) ChIP-seq results for NR2F1 and GATA3 from published datasets58. Blue horizontal bar above the ChIP-seq results indicates the minimal duplication region, and the green, red, and blue squares under the ChIP-seq results indicate the positions of cRE1, cRE2, and cRE3, respectively. NR2F1 shows specific binding to cRE2 in human iPSC-derived neural crest cells. By contrast, GATA2 and its effector transcription factor (TF) GATA3 bind specifically to cRE1 and cRE3, but not to cRE2 in neuroblastoma SK-N-SH and SH-SY5Y cells.
Gata2 and Gata3 are regulators of IEE but not FBMN fate
The overall organization of the developing and mature facial nucleus is conserved between mice and humans34 (Fig. 3a). In mice, Hoxb1 expression begins at approximately embryonic day 8.5 (~E8.5) and determines the identity of hindbrain r4 (refs. 19,35). FBMNs are born in the r4 ventricular zone between ~E9 and E12 and migrate caudally to r6 (refs. 36,37), while simultaneously extending axons into the periphery to form the facial nerve that innervates facial muscles36–39. FBMNs share their ventricular zone origin with a second population of r4 cholinergic ‘motor neurons’ (r4MNs), the IEEs. IEEs migrate laterally or contralaterally within r4, dividing into ventral olivocochlear neurons (OCNs) that modulate auditory gain and focus and dorsal vestibular efferent neurons (VENs) that may reduce sensitivity to self-induced head movements40,41.
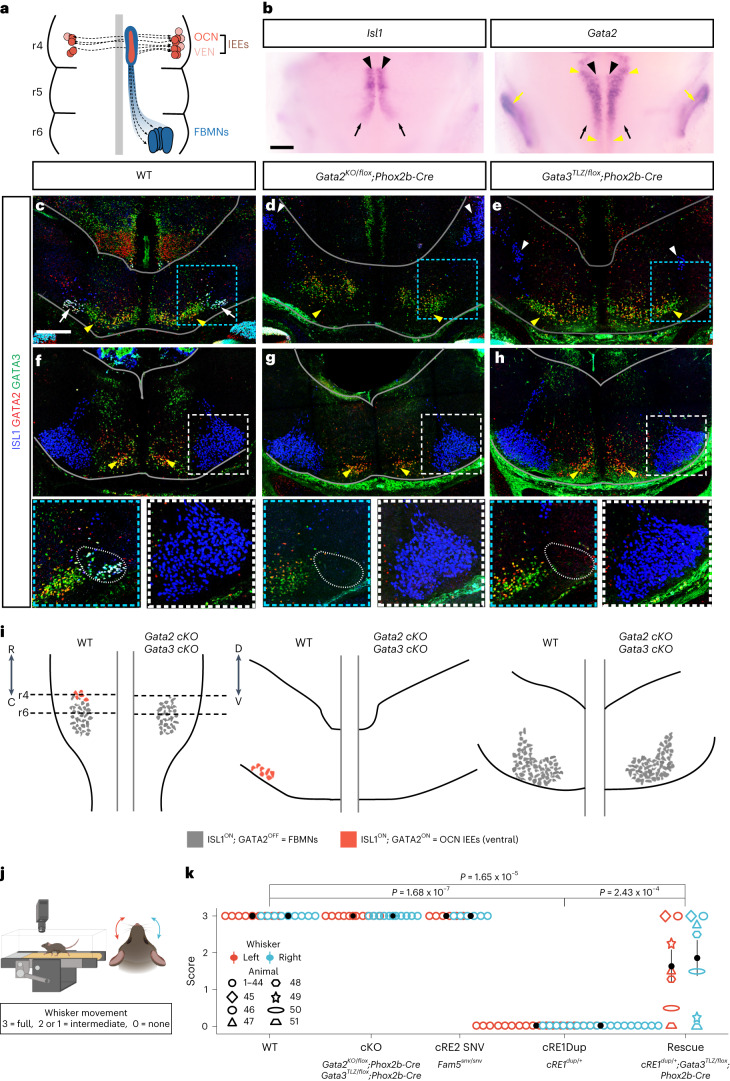
Fig. 3. Conditional loss of Gata2 or Gata3 prevents IEE development but does not impede FBMN development.
a, Migration schema of OCN (orange) and VEN (pink) IEEs and FBMNs (blue). b, E11.5 whole-mount Isl1 and Gata2 in situ hybridization: r4MN progenitor zone (black arrowheads), caudally migrating FBMNs (black arrows), parasagittal interneuron column (yellow arrowheads), developing inner ear (yellow arrows) (n = 3 WT, 10 cRE1dup/+ embryos). Scale bar, 200 μm. c–h, ISL1 (blue), GATA2 (red) and GATA3 (green) immunofluorescence on E14.5 WT (c,f), conditional Gata2KO/flox;Phox2b-Cre+ (d,g) and Gata3tlz/flox;Phox2b-Cre+ (e,h) KO hindbrains at r4 (c–e) and r6 (f–h). White arrows show OCN IEEs, yellow arrowheads show interneurons and the white arrowhead shows the trigeminal motor nucleus. Blue (r4) and white (r6) boxed regions are magnified below with a dotted oval denoting OCN IEE location (n = 3 (c,f), 6 (d,g) and 3 (e,h)). The borders of the hindbrain are outlined in gray. Scale bar, 200 μm (c) and applies to c–h. i, Schematics of E14.5 hindbrain cytoarchitecture based on c–h as viewed ventrally (left) and in cross-section at the level of r4 (middle) and r6 (right) in WT (left side of each schema) and Gata2 or Gata3 cKOs (right side of each schema). ISL1ON;GATA2ON IEEs (orange neurons) were absent from cKOs whereas ISL1ON;GATA2OFF FBMNs (gray) appeared normal. j, Whisking assay schematic. k, Whisker movement assessment. Both left and right whiskers scored 3 for all WT (n = 5 male (M), 4 female (F), Gata2KO/flox;Phox2b-Cre+ (n = 2 M, 3 F), Gata3tlz/flox;Phoxb2-Cre+ (n = 2 M, 4 F) and cRE2 Fam5snv/snv (n = 2 M, 4 F) mice). Both left and right whiskers scored 0 for all cRE1dup/+ mice (n = 8 M, 10 F). Of the cRE1dup/+;Gata3tlz/flox;Phox2b-Cre+ rescue mice (n = 1 M, 6 F), 2 had full (3) and 1 had no (0) whisker movement bilaterally, whereas the remaining 4 had intermediate movement (0 < x < 3). Pairwise, two-sided Bonferroni’s corrected Wilcoxon’s test (P values as shown). The filled circle shows mean and the error bar the s.e.m. Schemas in j were created with BioRender.com.
Gata2 is expressed in r4 as early as E8.5 (ref. 19) and has been proposed to work through Gata3 to regulate IEE and FBMN development under the control of HOXB1 (refs. 19,42–45). We found that expression of Isl1, a crucial determinant of motor neuron identity46, marked both developing r4MNs and the stream of caudally migrating FBMNs (Fig. 3a,b). Gata2 expression overlapped with Isl1 in r4 and was prominent in parasagittal stripes of interneurons19 but absent from migrating FBMNs (Fig. 3b).
The precise role of Gata2 and Gata3 in FBMN development has not been delineated due to early embryonic lethality of constitutive knockout mice47. To circumvent this, we crossed Gata2KO/flox and Gata3tlz/flox mice to Phox2b-Cre+ mice, conditionally deleting Gata2 or Gata3 from developing r4MNs47–50. IEEs were not visualized in either conditional knockout (cKO) mice at E14.5, based on the absence of ISL1 protein in r4MNs in appropriate anatomical positions compared with wild-type (WT) littermates (Fig. 3c,d,e,i). By contrast, embryonic facial motor nuclei appeared normal (Fig. 3f,g,h,i).
The mouse facial nerve innervates large, extrinsic muscles that displace the whisker pad and small, intrinsic muscles surrounding each vibrissal follicle51. To examine facial nerve function, we developed a semiquantitative whisking assay, collecting high-speed video recordings of vibrissal movement as mice ran on a treadmill, and scored left and right whisker movements (Fig. 3j). Gata2KO/flox;Phox2b-Cre+ and Gata3tlz/flox;Phoxb2-Cre+ mice showed full and indistinguishable whisking from WT (Fig. 3k and Supplementary Videos 1a–c). Thus, Gata2 and Gata3 are master regulators of IEE but not FBMN development.
WT but not mutant cRE2 silences cRE1 and cRE3 in FBMNs
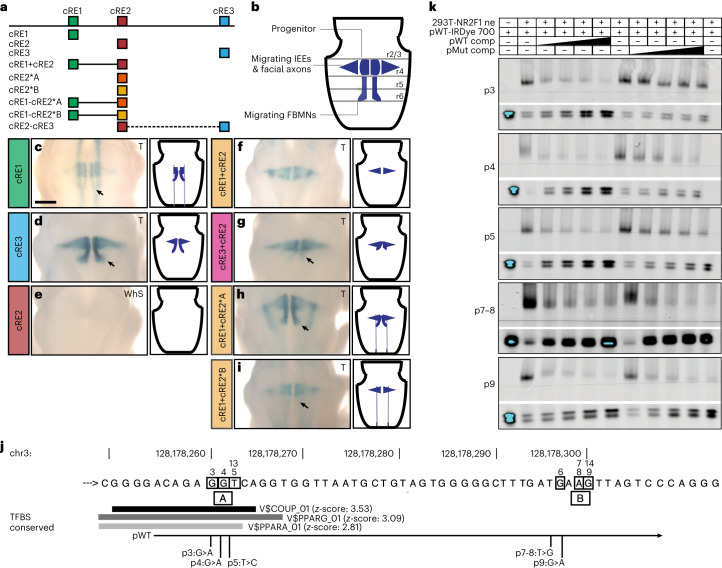
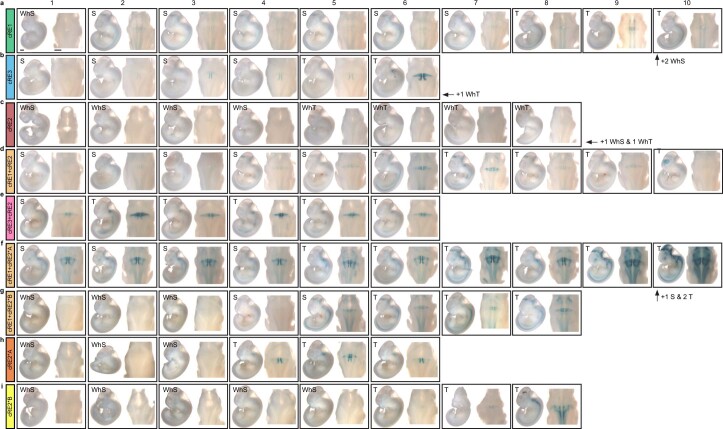
As HCFP1 duplications and SNVs cause the same phenotype in humans and cRE1 and cRE3 are Gata2 enhancers in mice29, we hypothesized that cRE2 was a cell-type-specific Gata2 silencer13,52. If so, SNVs could weaken the silencing by attenuating TF binding and duplications could disrupt regulatory balance. Either would cause abnormal Gata2 expression. To test this hypothesis in vivo, we evaluated whether different cRE combinations drove β-galactosidase expression when coupled to a lacZ reporter targeting a specific locus in the mouse genome53. We designed donor DNA constructs containing different cRE combinations (Fig. 4a). The cRE1 alone drove β-galactosidase expression in the region of r4MN precursors and migrating FBMNs, as well as in midbrain and spinal cord (Fig. 4b,c and Extended Data Fig. 3a), similar to published data29. The cRE3 alone drove expression restricted to r4MNs, lateral r4 where migrating IEEs and nascent FBMN/IEE axons overlap, and migrating FBMNs (Fig. 4d and Extended Data Fig. 3b). Thus, although cRE1 and cRE3 enhance β-galactosidase expression in a Gata2 pattern, they also mark Gata2-negative migrating FBMNs. By contrast, cRE2 alone did not drive β-galactosidase expression, consistent with silencing activity (Fig. 4e and Extended Data Fig. 3c). Combining cRE2 with cRE1 or cRE3, we detected β-galactosidase expression in r4MNs and migrating IEEs but no longer in migrating FBMNs, consistent with absence of Gata2 expression in these cells (Figs. 3b and 4f,g and Extended Data Fig. 3d,e).
Fig. 4. Cluster A SNVs impair cRE2-mediated silencing in a reporter expression assay in vivo and reduce NR2F1 binding in vitro.
a,b, Schematics for in vivo lacZ reporter assay constructs (a) and hindbrain β-galactosidase expression viewed dorsally through the fourth ventricle (b). In b, midline ovals denote IEE/FBMN progenitors, triangles denote migrating IEEs and leg-like columns denote migrating FBMNs that are highlighted by black arrows in c, d and g–i. c–i, Selected images of ectopic β-galactosidase in transfected embryos (left) and schema (right): cRE1 alone (c, n = 13), cRE3 alone (d, n = 6) cRE2 alone (e, n = 8), cRE1 with cRE2 (f, n = 10), cRE3 with cRE2 (g, n = 7), cRE1 with cRE2 carrying Cluster A variants (h, n = 13) and cRE1 with cRE2 carrying Cluster B variants (i, n = 8). The asterisk denotes a mutant cluster. Scale bar (c), 500 μm and applies to c–i. Additional images are shown in Extended Data Fig. 3. j, Partial cRE2 sequence, as per Fig. 1. Gray horizontal bars denote overlap with in silico, conserved, transcription-binding consensus sequences from TRANSFAC (indicated by $). The shade of gray correlates with a prediction z-score. WT (pWT) and mutant (pMut) EMSA probes are aligned below. TFBS, TF-binding sites. k, EMSA results showing the effect of SNVs on NR2F1-binding activity from transfected nuclear extract (293T-NR2F1 ne) in the presence of increasing molar excess (25× to 50× to 100× to 200× as denoted by black slope) of pWT or pMut competitor ‘cold’ probes compared with conjugated ‘hot’ probe (pWT-IRDye 700). For each SNV: NR2F1 binding (upper gel); free probe (bottom gel, lower and upper bands reflect unannealed and annealed probe, respectively). In all five experiments, pWT shows decreasing NR2F1 binding and increasing free probes. Cluster A variant competitor probes (p3, p4 and p5) compete less well than pWT for NR2F1 binding (more NR2F1 shifted and less free probe available). Cluster B variants (p7–8 and p9), where no NR2F1 binding is expected, show no substantial effect. The same trend was observed in replicate experiments: WT = 11; p3 = 5; p4 = 8; p5 = 4; p7-8 = 3; and p9 = 7. Full gels are given in Source data.
Extended Data Fig. 3. Summary of LacZ expression experiments.
(a-i) Replicate embryos from the lacZ reporter injections as indicated in schematic in Fig. 4a. (a) cRE1, (b) cRE3, (c) cRE2, (d) cRE1+cRE2, (e) cRE2+cRE3, (f) cRE1+cRE2*A, (g) cRE1+cRE2*B, (h) cRE2*A, (i) cRE2*B. Shown are all embryos up to a maximum of 10 per genotype, with text denoting embryos >10. ‘S’ and ‘T’ indicate embryos with single or tandem transgene insertion, respectively. Tandem insertions show stronger signals but less specificity than single insertions. White Single (WhS) and White Tandem (WhT) indicate embryos carrying single or tandem transgene insertion, respectively, that do not show β-galactosidase coloration. Embryos have an average crown-rump length of 6 mm. Scale bars in (a) = 500μm for the whole embryo (left) and dorsal hindbrain view through 4th ventricle (right) images and apply to (a-i) as approximate measurements.
The cRE2 with Fam3-5 Cluster A SNVs, when combined with cRE1 (cRE1 + cRE2*A), no longer attenuated cRE1-driven lacZ signal in migrating FBMNs, indicating that these SNVs prevented cRE2-mediated silencing (Fig. 4h and Extended Data Fig. 3f). The effect of cRE1 with the three Cluster B SNVs (CRE1 + CRE2*B) was less clear, because the signal was attenuated in only one of eight embryos tested (Fig. 4i and Extended Data Fig. 3g). It is interesting that expression of cRE2-mutant clusters alone (cRE2*A or cRE2*B) showed some neuronal signal only in tandem, not single, transgenic embryos (Extended Data Fig. 3h,i). Similarly, cRE1 + cRE2*A showed an overall stronger and more intricate lacZ pattern compared with cRE1 + cRE2 (Extended Data Fig. 3d,f). Overall, these in vivo data support our hypothesis that HCFP1 SNVs disrupt a cell-specific regulatory element (cRE2) that normally downregulates Gata2 expression in developing FBMNs.
Cluster A SNVs attenuate binding of NR2F1 to cRE2
We performed in silico prediction of TF-binding sites conserved between the cRE2 of humans and that of mice54. Cluster B SNVs were not predicted to alter conserved TF-binding sites. By contrast, Cluster A SNVs alter three nucleotides (5′-AGGTCA-3′) of a consensus sequence of the COUP-TF family, NR2F1 and NR2F2 (Fig. 4j)55. Nr2f1 is a determinant of cell-type specification and temporal fate of the developing cortical neurons and glia55. It is expressed throughout the hindbrain by E8.5 and enriched in facial and other cranial motor nuclei by E9.5 (refs. 56,57). Re-analysis of published ChIP-seq data from human induced pluripotent stem cell-derived cranial neural crest cells58, which share a similar origin with neuroblastoma cells, revealed NR2F1 binding to cRE2 but not cRE1 or cRE3 (Extended Data Fig. 2c). NR2F2 did not bind cRE2 in human cranial neural crest cells59. Notably the mouse, but not the human, cRE1 sequence contains a COUP-TF-binding site (mm10 chr6:88,226,527–88,226,549). This, together with a murine-specific 4-bp deletion between cRE2 Clusters A and B (Fig. 1c), suggests differential cRE1–cRE3 binding and function of COUP-TF in the two species.
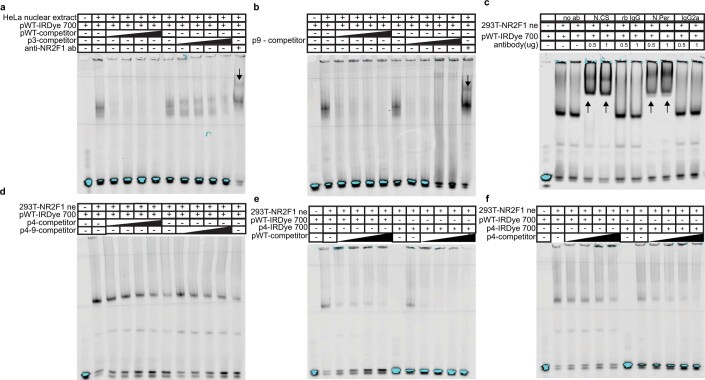
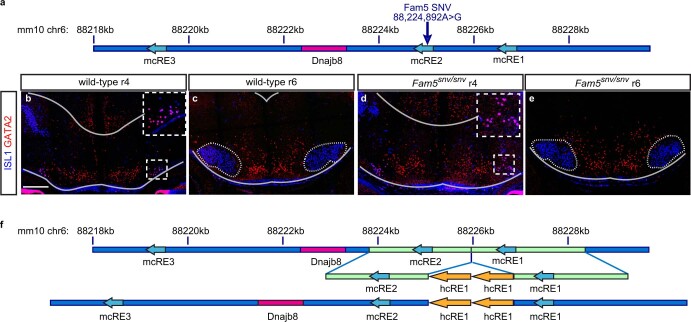
We performed an electrophoretic mobility shift assay (EMSA) that both confirmed interaction of NR2F1 with cRE2 sequence and demonstrated attenuated interaction with HCFP1 Cluster A variants in vitro (Fig. 4k and Extended Data Fig. 4a–f). To evaluate the effect of cRE2 Cluster A SNVs in vivo, we generated a knockin mouse carrying the Fam5 SNV (Extended Data Fig. 5a). Fam5snv/snv mice (chr6:88,224,892A>G) were viable and fertile and had normally developed facial motor nuclei and whisking (Fig. 3k, Supplementary Video 1d and Extended Data Fig. 5b–e). Despite the absent phenotype, conservation between mouse and human Cluster A sequences led us to test whether NR2F1 bound to WT Cluster A in r4MNs in vivo and whether the Fam5 SNV disrupted this interaction.
Extended Data Fig. 4. Additional EMSA data.
Electrophoretic mobility shift assay (EMSA) to confirm the interaction of NR2F1 with cRE2 sequence and to test whether HCFP1 SNVs attenuated this interaction in vitro. Blots are unmodified. Oligonucleotide probes containing the Cluster A and B region conjugated to a IRDye 700 fluorophore and competed with WT or mutant non-conjugated probes were designed. As per Fig. 4, EMSA results showing the effect of SNVs on NR2F1 binding (293T-NR2F1 ne denotes nuclear extract from NR2F1 transfected 293T cells) in the presence of increasing molar excess (25x-50x-100x-200x as denoted by black slope) of WT (pWT) or mutant (pMut) competitor probe compared to hot probe (pWT-IRDye 700). (a-b) EMSA for Cluster A p3 (a) and Cluster B p9 (b) using HeLa nuclear extract (refer to Fig. 4j for probe maps) (n = 4). The shifted band in the second lane of each gel is abolished with the addition of small amounts of WT or Cluster B p9 competitor. The Cluster A p3 is a less efficient competitor, suggesting that the variant alters the binding of a TF to the DNA. The addition of an anti-NR2F1 antibody causes a supershift of the TF-conjugated probe complex, indicating that this interaction is mediated by NR2F1. (c) A stronger shift is obtained with nuclear extract from NR2F1-transfected 293T cells. Specific supershift is observed using two different commercial NR2F1 antibody preparations (N.CS: Cell Signaling; N.Per: Perseus) each at two concentrations (0.5 ug and 1 ug). No supershift was observed using two isotype-specific controls (rabbit IgG for the N.CS antibody and IgG2a for the N.Per antibody), (n = 4). (d) No additional effects on competition are observed combining a variant in Cluster A and a variant in Cluster B on a single competitor probe (p4-p9 probe compared to p4 only (n = 6)). (e) Unlabeled pWT competes with labeled p4 more effectively than with labeled pWT (n = 2). (f) Unlabeled p4 does not compete well with labeled pWT. Comparing unlabeled pWT and unlabeled p4, the former competes better with labeled p4 (n = 2).
Extended Data Fig. 5. Facial motor nucleus formation in SNV HCFP1 mice.
(a) Schematic of the orthologous Fam5snv variant introduced into mouse. (b-e) Immunofluorescent staining for ISL1 (blue) and GATA2 (red) on cross sections from WT (b,c) and Fam5snv/snv (d,e) E14.5 hindbrains at r4 (b,d) and r6 (c,e) levels. Development of ISL1ON;GATA2ON IEEs was similar in WT (dashed region in b; inset) and Fam5snv/snv (dashed region in d; inset) embryos, as was the formation of the facial motor nucleus (dotted regions in c,e). n = 4 (b,c), 4 (d,e) embryos. Scale bar = 200μm in (b) and applies to (b-e). (f) Generation of a humanized cRE1 duplication model. Tandem copies of human cRE1 (yellow arrows, (hg19 chr3:128,175,708-128,176,563) were inserted between the endogenous murine cRE1 and cRE2 loci.
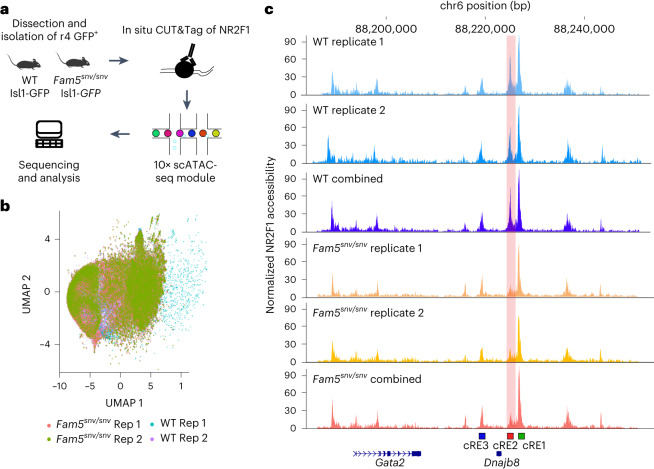
We dissected and FAC-sorted green fluorescent protein-positive (GFP+) cells from the r4 hindbrain of E10.5 WT;Isl1MN-GFP and Fam5snv/snv;Isl1MN-GFP embryos, in which GFP specifically labels motor neurons60, and performed single-cell CUT&Tag61 using an anti-NR2F1 antibody (Fig. 5a,b). We detected specific binding of NR2F1 to WT cRE1, cRE2 and, to a lesser extent, cRE3. By contrast, Fam5snv/snv r4MNs showed reduced cRE2 peak height compared with WT, without change in cRE1 and cRE3 peaks (Fig. 5c). Together, this shows that NR2F1 binds cRE2 in vitro and in r4MNs, and Cluster A SNVs attenuate this binding.
Fig. 5. NR2F1 binds cRE2 in E10.5 r4MNs and binding is reduced by Fam5 SNV.
a, Schematic representation of single-cell CUT&Tag of E10.5 WT and Fam5snv r4 Isl1+ neurons targeting NR2F1. scATAC-seq, single-cell assay for transposase-accessible chromatin with high-throughput sequencing. b, UMAP embedding of NR2F1 single-cell CUT&Tag experiment for two Fam5SNV/SNV (replicate (Rep) 1 = 2,274 cells, Rep 2 = 2,740 cells) and two WT (Rep 1 = 2,572 cells, Rep 2 = 1,377) age-matched biological replicates. c, Pseudobulk single-cell CUT&Tag profile of NR2F1 around the Gata2 regulatory region shown as individual and combined replicates (WT in blue and Fam5SNV/SNV in red–yellow). Location of the cREs relative to mouse Gata2 and Dnajb8 is shown. Note the reduction in the height of the cRE2 peaks (vertical pink shading) in the Fam5SNV/SNV replicates.
Mice heterozygous for a humanized cRE1 duplication have HCFP
We generated a human cRE1 duplication mouse by inserting tandem copies of the human cRE1 sequence between mouse cRE1 and cRE2 (Extended Data Fig. 5f). We chose this approach because the cRE1 NR2F1-binding site in mice but not humans could alter the mouse phenotype. Mice heterozygous for the human cRE1 duplication (cRE1dup/+) were viable and fertile, and had absent whisker movement consistent with HCFP1 (Fig. 3k and Supplementary Video 1e).
Gata2 expression is altered in developing cRE1dup/+ r4MNs
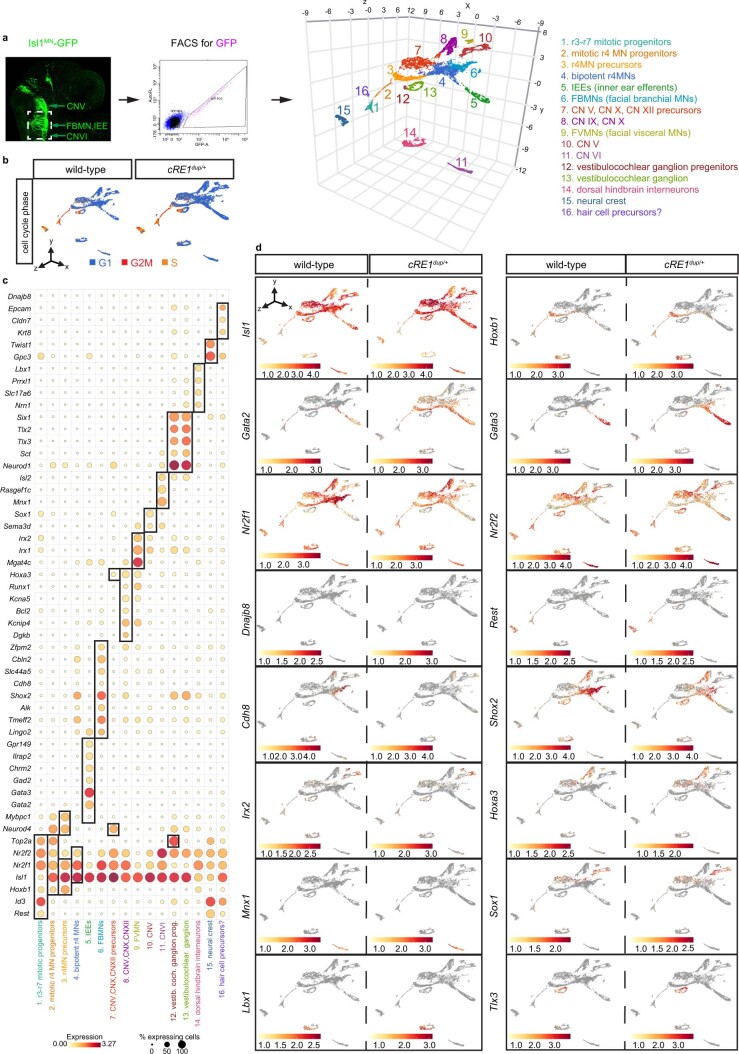
To identify transcriptomic changes in nascent and migrating FBMNs and IEEs caused by duplication of cRE1, we performed single-cell RNA-sequencing (scRNA-seq) on dissociated, FAC-sorted, GFP+ and the surrounding negative cells from hindbrain axial levels r3–r7 of E9.5–E12.5 cRE1dup/+;IslMN-GFP and WT;IslMN-GFP littermates (Extended Data Figs. 6a and 7). We limited bioinformatic analysis to Isl1+ and/or Hoxb1+ cells, thus focusing on developmental trajectories of r4 and neighboring IslMN-GFP-expressing motor neurons19,46.
Extended Data Fig. 6. cRE1dup-mediated transcriptomic changes in the context of the developing hindbrain.
(a) scRNAseq workflow. r3-r7 GFP-positive and surrounding GFP-negative tissues were microdissected from E9.5-12.5 Isl1MN-GFP control and cRE1dup/+;Isl1MN-GFP hindbrains, dissociated, pooled by age and genotype, and purified using FACS. In the FACS example shown, E11.5 WT Isl1MNGFP+ r4MNs comprised 2.0% of total cellular input. Non-linear dimension reduction (clustering) was performed on a composite WT and cRE1dup/+ scRNAseq dataset for timespoints E9.5-E12.5. Plotted expression data was limited to HoxB1+ and/or Isl1+ cells to capture r4 ventricular zone progenitors and MNs. Proposed cluster identities are listed on the right. FACS sequential gating/sorting strategies as per Extended Data Fig. 7. (b) Cell cycle phase UMAP plot of E9.5-E12.5 clusters showing WT cells (left) and cRE1dup/+ cells (right). Cluster 1 was entirely mitotic and the likely source of r4MN progenitors. (c) Dot plots for marker gene expression (Y axis) in the 16 Seurat clusters (X axis). (d) Feature plots for select markers of r4MNs and other clusters identified in the WT (left column) and cRE1dup/+ (right column) Hoxb1+ and/or Isl1+ scRNAseq object. A shared FVMN (facial visceral motor neuron), CN IX, CN X trajectory is defined in part by Hoxa3 expression (Clusters 7,8,9; see also Supplementary Table 3) and a motor CN V trajectory is marked by the expression of the previously unreported marker Sox1 (Clusters 7,10).
Extended Data Fig. 7. Representative fluorescence-activated cell sorting (FACS) gating strategy for E11.5 WT and cRE1dup/+ Isl1MNGFP+ r3-r7 cranial motor neurons.
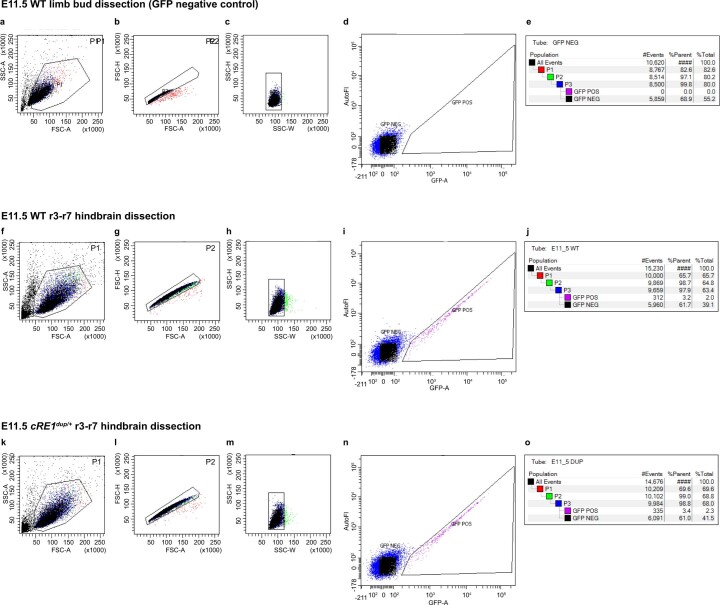
Gating strategy for dissociated GFP-free limb buds collected from E11.5 WT;Isl1MN-GFP embryos (a-e) and r3-r7 hindbrains collected from E11.5 WT (f-j) and cRE1dup/+ (k-o) embryos. (a,f,k) P1 was drawn to include all cells and exclude debris and dead cells based on SSC-A (side scatter area) VS FSC-A (forward scatter area). (b,g,l) P2 was drawn for primary doublet removal using the ratio of FSC-H (forward scatter height) vs FSC-A to exclude doublets entering the point of interrogation vertically. (c,h,m) P3 was drawn as a secondary exclusion for horizontal doublets using the side scatter parameter of SSC-H (side scatter height) vs SSC-W (side scatter width). (d,i,n) GFP positive gate was drawn to include true GFP positive cells and exclude any possible autofluorescent signals from live or dead cells. GFP signal was plotted against autofluorescence (autoFl) detected as a second channel from the GFP laser and an emission filter of 575/40. (e,j,o) Gating summary, GFP+ cells comprised 0% of WT limb bud input, 2.0% of WT input hindbrain cells, and 2.3% of cRE1dup/+ input hindbrain cells.
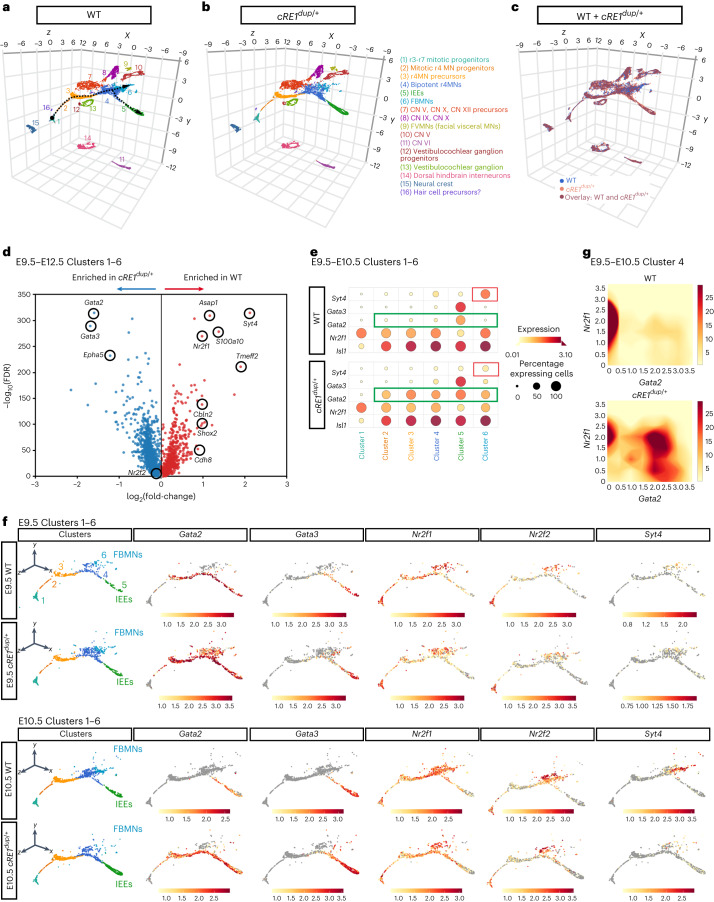
Informed by known cell identity markers and those identified in the present study, we merged data from both genotypes, classified 16 clusters on the Unifold Manifold Approximation and Projection (UMAP) plot and found that clustering and cell-cycle phase were similar between the two genotypes (Fig. 6a–c, Extended Data Fig. 6a,b and Supplementary Table 3). Clusters 1–6 defined a developmental trajectory of r4MNs comprising mitotic progenitors of r3–r7 neurons (Cluster 1) through to bipotent r4MNs (Cluster 4) that gave rise to IEEs (Cluster 5) and FBMNs (Cluster 6) (Fig. 6a–c and Extended Data Fig. 6c,d). Cluster 5 IEE cellular density was increased whereas Cluster 6 FBMN cellular density was decreased in cRE1dup/+ embryos compared with WT (Fig. 6a–c). Dnajb8 was not expressed in any clusters of either genotype (Extended Data Fig. 6c,d).
Fig. 6. Single-cell transcriptomic analysis of WT and cRE1dup/+ r4 motor neurons.
a,b, Three-dimensional (3D) UMAP plot of WT (a) and cRE1dup/+ (b) components of a E9.5–E12.5 scRNA-seq object comprising Isl1+ and/or Hoxb1+ FAC-sorted Isl1MN-GFP cranial motor neurons (MNs) (with GFP− cells spiked in) spanning r3–r7. Seurat clusters are numbered and annotated according to proposed cellular identity at the right. CN, cranial nucleus. The black dotted arrows trace the proposed pseudotime developmental trajectory of r4MNs from mitotic progenitors of r3–r7 neurons (Cluster 1), r4MN mitotic progenitors (Cluster 2) and r4MN precursors (Cluster 3), ‘bipotent r4MNs’ (Cluster 4), which gave rise to separate populations of IEEs (Cluster 5) defined by Gata2 and Gata3 expression18,19, and FBMNs (Cluster 6) defined by Syt4, Shox2 and Cdh8 expression and enriched for Nr2f1 (refs. 18,19,74,75) (Extended Data Fig. 6c,d). c, Overlapping feature plots of WT (blue, bottom layer) and cRE1dup/+ (peach, top layer) 3D UMAPs shown in a and b. Sixty percent opacity of cRE1dup/+ data points reveals WT data and highlights overlap of the genotypes (burgundy). d, Volcano plot of differential expression analysis between WT and cRE1dup/+ r4MN trajectories across the E9.5–E12.5 timepoints. Circled genes display log(fold-change) > 1 and −log10(FDR) > 200 or are additional genes of interest (where FDR is false recovery rate). e, Dotplot comparison of FBMN and IEE marker expression in E9.5–E10.5 Cluster 1–6 r4MN developmental trajectories in WT (upper) and cRE1dup/+ (lower) embryos. Red and green outlines highlight differences in Syt4 and Gata2 expression, respectively, between WT and cRE1dup/+ samples. Scales indicate the mean expression level and percentage expressing cells within each cluster. f, Feature plots of WT and cRE1dup/+ r4MN trajectory determinants and markers at E9.5 (upper two rows) and E10.5 (lower two rows). At E9.5 in both WT and cRE1dup/+ embryos, r4MN precursors, a subset of IEE-directed bipotent r4MNs and IEEs (Clusters 3–5), expressed Gata2, with additional ectopic expression seen in cRE1dup/+ FBMNs (Cluster 6). By E10.5, WT embryos expressed Gata2 only in Cluster 5 IEEs, but cRE1dup/+ embryos maintained Gata2 expression in Clusters 3–5. g, Density plots for Nr2f1 and Gata2 expression in E9.5–E10.5 WT and cRE1dup/+ r4MNs. See also Extended Data Fig. 6.
Differential expression analysis revealed Gata2 and Gata3 as the transcripts most enriched in cRE1dup/+ Clusters 1–6 compared with WT (Fig. 6d). The downregulation of Gata2 expression in WT Cluster 4 between E9.5 and E10.5 was not observed in cRE1dup/+ embryos (Fig. 6e,f). In both genotypes, Nr2f1 expression marked r4 progenitors and was maintained across the trajectory, declining only in maturing IEEs (Fig. 6e,f), whereas Nr2f2 was initially expressed in r4 progenitors and subsequently upregulated in bipotent r4MNs, FBMNs and, to a lesser degree, IEEs (Fig. 6f). Last, although only a small number of Nr2f1-expressing neurons from E9.5 and E10.5 Cluster 4 bipotent r4MNs coexpressed Gata2, the majority from cRE1dup/+ embryos did (Fig. 6g). Thus, the cRE1dup/+ scRNA-seq data revealed sustained Gata2 expression in r4MNs normally destined to become FBMNs.
GATA2 localization is expanded in developing cRE1dup/+ r4MNs
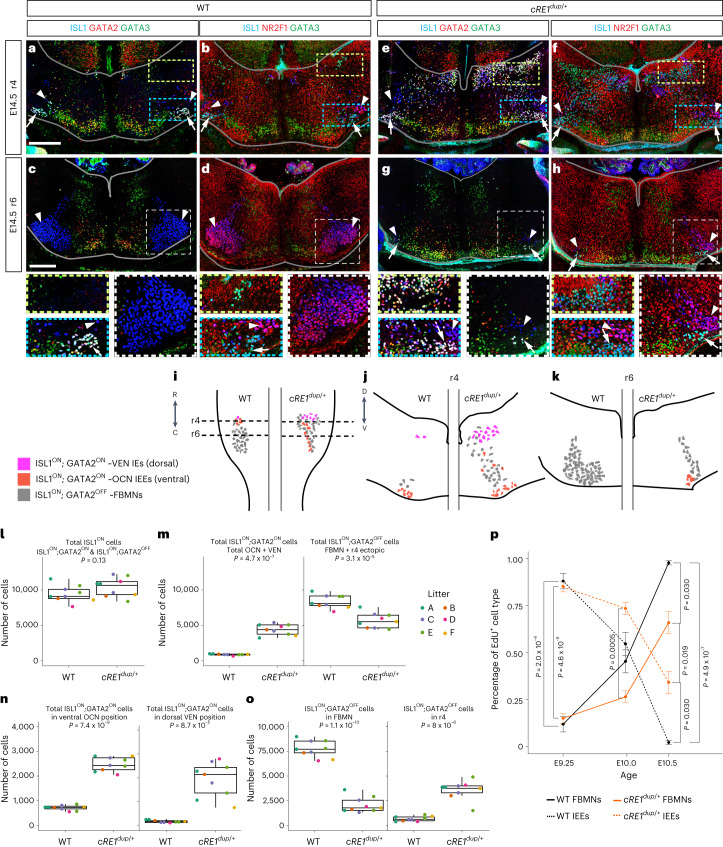
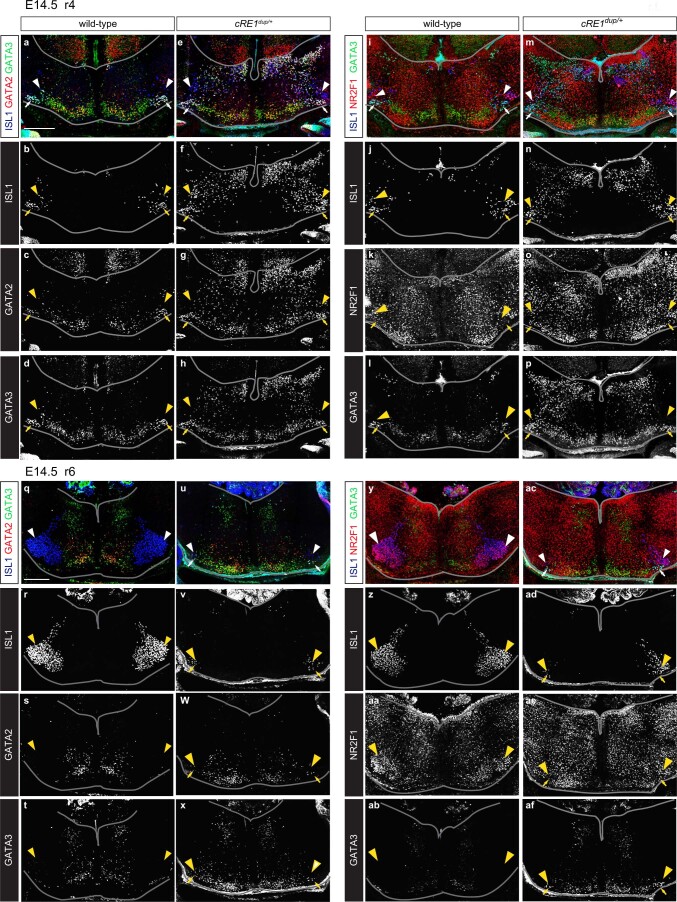
We used multichannel immunofluorescent staining of IEEs and FBMNs in E10.5–E16.5 r4–r6 hindbrain sections to determine whether changes in r4MN organization supported a WT IEE-to-FBMN developmental switch that was altered in cRE1dup/+ embryos. We focused on E14.5, when the broad contours of IEE and FBMN organization are first apparent and Gata2 is not yet downregulated (Fig. 7, single channels in Extended Data Fig. 8).
Fig. 7. GATA2 expression and IEE birth epoch are expanded in developing cRE1dup/+ hindbrain.
a–h, E14.5 WT (a–d) and cRE1dup/+ (e–h) hindbrain sections at r4 (a,b,e,f) and r6 (c,d,g,h) axial levels showing immunofluorescence with ISL1 (blue) and GATA3 (green) (a–h) together with GATA2 (red: a,c,e,g) or NR2F1 (red: b,d,f,h). Ectopic dorsal r4MNs are present in e and f compared with a and b. Dotted yellow and blue rectangles (a,b,e,f) surround IEE VEN and OCN regions, respectively, and are magnified below. Dashed white squares (c,d,g,h) surround facial nuclei and are magnified below. White arrows show OCNs and white arrowheads FBMNs. The borders of the hindbrain are outlined in gray. Scale bars, 200 μm (a,c) apply to a, b, e and f, and c, d, g and h, respectively (n = 3 (a,c), 3 (b,d), 8 (e,g) and 7 (f,h) embryos). i–k, Schematics of E14.5 hindbrain cytoarchitecture based on a–h as viewed ventrally (i) and in cross-section at the level of r4 (j) and r6 (k) in WT (left side) and cRE1dup/+ (right side) of hindbrains. l–o, Quantification of E14.5 r4MN transcriptional and positional identity in cRE1dup/+ and WT littermates detected in confocal z stacks. Unilateral counts are presented; each point represents an individual embryo and each color a litter (color coded A–F) (n = 9 cRE1dup/+ and nine WT littermate pairs from six litters). On average per side, WT versus cRE1dup/+ embryos had: 9,470 versus 10,422 r4-born MNs (l); 903 versus 4,405 IEEs (m); 8,408 versus 5,691 FBMNs (m); 719 versus 2,478 OCNs (n); 184 versus 1,927 VENs (n); and 7,721 versus 2,098 FBMNs completing migration into ventral r6 (o). In the box plot, the center line is the median, the box limits represent 50% of the values and the whiskers represent 98% of the values. p, The r4MN birthdating in the 18-mouse cohort in l–o using in utero labeling of mitotic cells with thymidine homolog EdU in IEE (OCN + VEN) and FBMN (FBMN + r4 ectopic); definitions as per m. Point is the mean. For l–p, all indicated P values are calculated using two-sided, pairwise Student’s t-test without correcting for multiple testing; the error bar = ± s.e.m. See also Extended Data Figs. 8 and 9.
Extended Data Fig. 8. Single channel images of Fig. 7 immunohistochemistry.
E14.5 r4 (a-p) and E14.5 r6 (q-af) Immunostaining from Fig. 7a–h presented as composite images (a,e,i,m,q,u,y,ac) with the corresponding single-channel images for each of the single antibodies shown below each composite image. Solid lines mark the approximate anatomic borders of the hindbrain, arrows indicate OCNs, and arrowheads mark FBMNs. 200μm scale bars in (a) and (q) apply to (a-p) and (q-af), respectively.
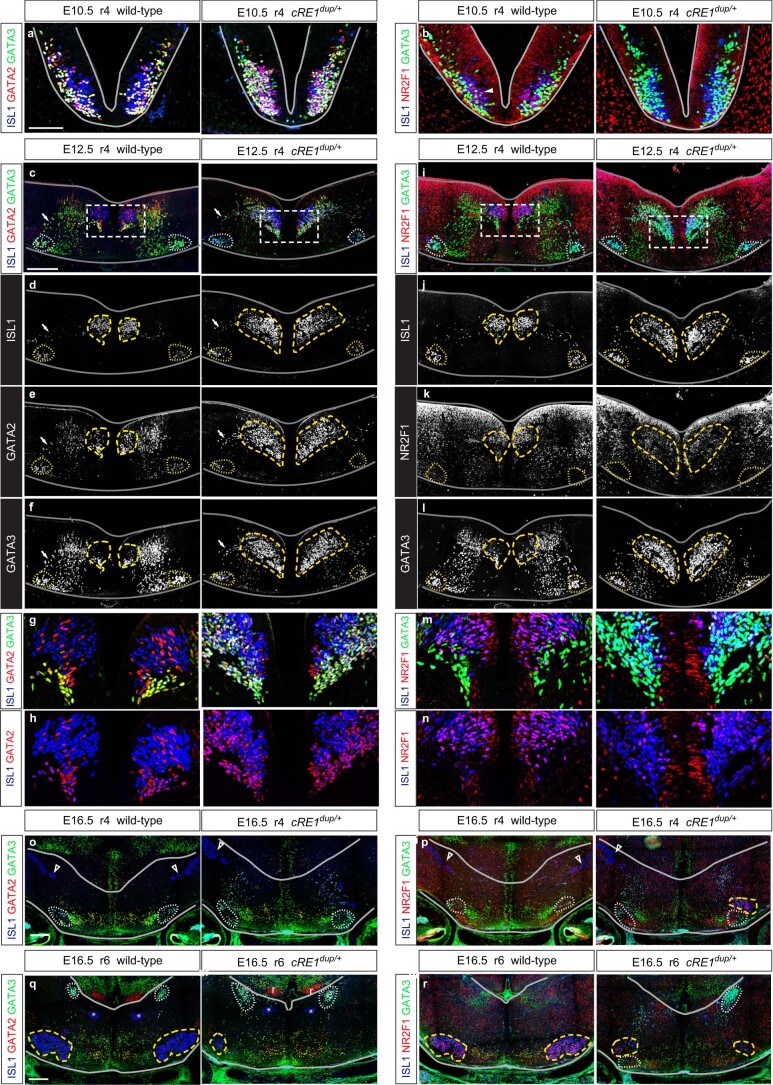
In WT embryos at E10.5, FBMNs (defined as ISL1ON;GATA2OFF;GATA3OFF) were distinguishable from IEEs (defined at this age as ISL1ON;GATA2ON with variable GATA3 expression and at later ages as ISL1ON;GATA2ON;GATA3ON) (Extended Data Fig. 9a,b). By E12.5, FBMNs formed dorsal clusters flanking the r4 midline, whereas GATA2 and GATA3 delineated smaller ventral populations of IEEs that were migrating laterally and ventrally to form the OCN nucleus. Bilateral columns of ISL1OFF;GATA2ON;GATA3ON interneurons were detected between the midline r4MN clusters and developing IEEs43 and NR2F1 expression was elevated in FBMNs and reduced in IEEs (Extended Data Fig. 9c–n). At E14.5, IEEs formed variably detected dorsal VEN clusters and more prominent ventral OCN clusters (Fig. 7a,b). FBMNs had largely completed migration to form the facial motor nucleus in the ventral r6 hindbrain and expressed NR2F1 and not GATA2 or GATA3, consistent with NR2F1 blocking IEE fate (Figs. 3a and 7c,d). By E16.5, IEEs formed compact dorsal VEN and ventral OCN clusters in which GATA2 was downregulated and FBMNs aggregated into facial motor nuclei (Extended Data Fig. 9o–r).
Extended Data Fig. 9. Transcriptional and positional r4MN identity is disrupted in the cRE1dup/+ embryonic hindbrain.
(a,b) Immunofluorescence of WT (left) and cRE1dup/+ (right) E10.5 r4 axial hindbrain cryosections stained in (a) for ISL1 (blue), GATA2 (red), GATA3 (green), and in (b) for IS1 (blue), NR2F1 (red), GATA3 (green). In WT, a medial population of r4MNs excludes GATA2 and GATA3 expression (a, left, blue cells); in cRE1dup/+, GATA2 and GATA3 expression overlaps extensively with ISL1 (a, right). A subset of medial r4MNs express NR2F1 in WT (b, left, arrowhead) but not in cRE1dup/+ hindbrains (b, right). (c-n) E12.5 r4 axial hindbrain cryosections stained in (c-h) as in (a), and in (i-n) as in (b) on WT (left) and cRE1dup/+ (right) sections. Compound (c,i) and single (d-f,j-l) channels. Arrows mark migrating IEEs (c-f). ISL1, GATA2, GATA3 midline r4MNs are expanded in number in cRE1dup/+ hindbrains. ISL1OFF;GATA2ON;GATA3ON interneurons form diffuse, bilateral columns overlapping r4MNs in WT and cRE1dup/+ hindbrains. Midline r4MN clusters in (c) are enlarged in (g,h), and (i) in (m,n). Ventral IEEs are delineated from dorsal FBMNs by GATA2 and GATA3 expression in WT (g,h, left), but not in cRE1dup/+ hindbrains (g,h right). GATA2ON; ISL1OFF cells in the FBMN compartment are likely interneurons (h, left, dorsal red cells). NR2F1 expression detected in WT FBMNs (m,n, left, purple cells) is decreased in cRE1dup/+ midline r4 MNs (m,n, right). (o-r) E16.5 r4 (o,p) and r6 (q,r) axial hindbrain cryosections with staining as per (a,b) on WT (o-r, left) and cRE1dup/+ (o-r, right) sections. GATA2 is downregulated in OCNs at this stage in both genotypes (o,q), and NR2F1 is detected in FBMNs but not IEEs (p,r). cRE1dup/+ but not WT embryos have scattered ectopic ISL1ON;GATA3ON r4 neurons (o,p right vs. left). The r6 VEN population is enlarged and FBMN nuclei smaller in cRE1dup/+ compared to WT (q, r right vs. left). Solid lines = anatomic borders of the hindbrain, dotted ovals encircle IEEs, dashed ovals encircle FBMNs. Open arrowheads = trigeminal motor neurons, asterisks in (q) = abducens nucleus. Scale bars = 200μm. Scale bar in (a) applies to (a,b); (c) applies to (c-f, i-l); (o) and (q) apply to (o,p) and (q,r), respectively. n = 3 (a-n) and 2 (o-r) embryos.
In cRE1dup/+ embryos at E10.5, GATA2 and GATA3 expression extended ectopically throughout r4MNs (Extended Data Fig. 9a,b). By E12.5, most r4MNs had adopted an ‘IEE’ molecular identity with many ectopically occupying the dorsal region of r4, and FBMNs expressed NR2F1 but were reduced at the r4 midline compared with WT (Extended Data Fig. 9c–n). At E14.5, OCNs occupied normal positions in the ventral hindbrain but also extended caudally into r6 and a larger population of ectopic ‘IEEs’ occupied positions in the dorsal hindbrain in the region of WT VENs (Fig. 7e,f). Ectopic ‘FBMNs’ were scattered throughout r4 and also formed a hypotrophic facial nucleus that extended from r4 to r6 (Fig. 7e–h; schema in Fig. 7i–k). At E16.5, the cRE1dup/+ ventral OCN cluster extended ectopically into r6, the dorsal ectopic IEEs formed an expanded VEN cluster and the facial nucleus appeared small to absent (Extended Data Fig. 9o–r).
We quantified ectopic cell positions and changes in r4MN gene expression caused by cRE1 duplication by determining the size and position of ISL1ON;GATA2ON IEE and ISL1ON;GATA2OFF FBMN subpopulations in E14.5 WT and cRE1dup/+ hindbrains. The average number of r4-born motor neurons did not differ between genotypes (Fig. 7l). However, although WT embryos generated a 1:9.3 ratio of IEE:FBMN cells, the cRE1dup/+ embryo ratio was 1:1.3, with the number of IEEs adopting an OCN and VEN identity increasing over threefold and tenfold, respectively (Fig. 7m,n). Last, cRE1dup/+ embryos had a 32% decrease in FBMNs (Fig. 7m) and, although 92% of E14.5 WT FBMNs completed migration into ventral r6, only 37% of cRE1dup/+ FBMNs had, with the balance assuming ectopic positions in r4–5 (Fig. 7o).
To determine IEE and FBMN birthdates, we applied 5-ethynyl-2′-deoxyuridine (EdU) in utero to litters containing WT and cRE1dup/+ embryos across an E9.25–E10.5 time course. High levels of EdU indelibly mark cells undergoing terminal cell division during the EdU pulse, permitting us to classify and count E14.5 EdU-positive cells as IEEs or FBMNs, regardless of position (Fig. 7p). After EdU injection at E9.25, 88% of WT and 85% of cRE1dup/+ r4-derived motor neurons adopted the IEE fate. Application of EdU in E10.0 WT embryos marked nearly equal proportions of IEEs (55%) and FBMNs (45%), but in cRE1dup/+ embryos a greater proportion of labeled cells became IEEs (73%). With EdU application at E10.5, 2% of WT versus 34% of cRE1dup/+-labeled r4MNs became IEEs.
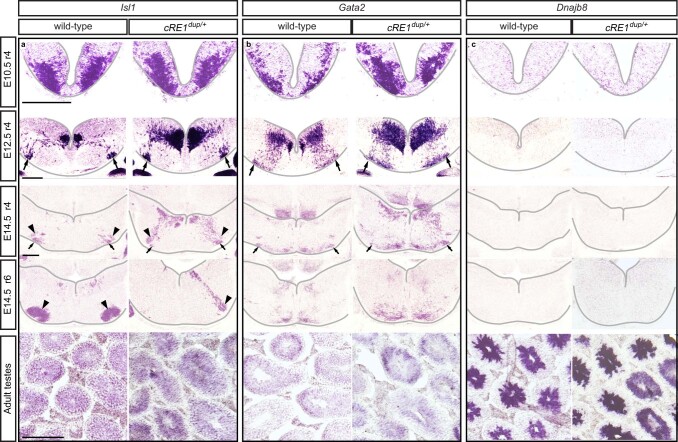
As Dnajb8 lies between cRE1 and Gata2, we evaluated it as an HCFP1 target gene. In situ hybridization with Dnajb8 riboprobe revealed no expression in developing WT or Cre1dup/+ hindbrain, whereas staining with Isl1 and Gata2 probes recapitulated protein antibody staining (Extended Data Fig. 10a–c). These observations are consistent with scRNA-seq data and confirm that changes in Dnajb8 expression are unlikely to underlie HCFP1.
Extended Data Fig. 10. Isl1, Gata2, and Dnajb8 in situ hybridization.
((a-c) In situ hybridization staining for Isl1 (a), Gata2 (b), and Dnajb8 (c) expression in wild type (left column) and cRE1dup/+ (right column) embryos at the indicated ages and axial levels. In the cRE1dup/+ embryos, Isl1 and Gata2 expression was expanded in r4, and fewer Isl1+ FBMNs were detected in r6 at E14.5. Dnajb8 expression was not detected in the hindbrain region of developing r4, but the same probe did detect robust and specific expression in developing spermatids in adult WT and cRE1dup/+ testis88. n = 2 (E10.5), 4 (E12.5), 2 (E14.5), 3 (adult testes) samples each for WT and cRE1dup/+. Arrows mark OCNs, arrowheads mark FBMNs. All scale bars = 200um and apply to all panels with the corresponding developmental age.
These data establish that the humanized duplication of cRE1 perturbs r4-derived MN expression of Gata2 but not Dnajb8. They provide evidence of an IEE-to-FBMN birth order, with a developmental switch active from E9.25 to E10.5 in WT embryos that extends beyond E11.0 in cRE1dup/+ embryos, producing IEEs at the expense of FBMNs. The 73% reduction in FBMNs correctly positioned in the caudal hindbrain in E14.5 cRE1dup/+ embryos probably underlies their facial paralysis.
Loss of Gata3 in cRE1dup/+ mice partially rescues CFP
If cRE1 duplication results in the HCFP1 phenotype by causing ectopic expansion of Gata2 in r4MNs, then removal of Gata2 from cRE1dup/+ mice should rescue the phenotype. Linkage disequilibrium prevented crossing the cRE1dup allele on to the Gata2KO/flox;Phox2b-Cre+ cKO background. As Gata3 is a Gata2 transcriptional target and conditional removal of Gata2 or Gata3 eliminates IEE generation but preserves FBMNs (Fig. 3), we tested whether conditional Gata3 deletion would rescue the cRE1dup CFP phenotype.
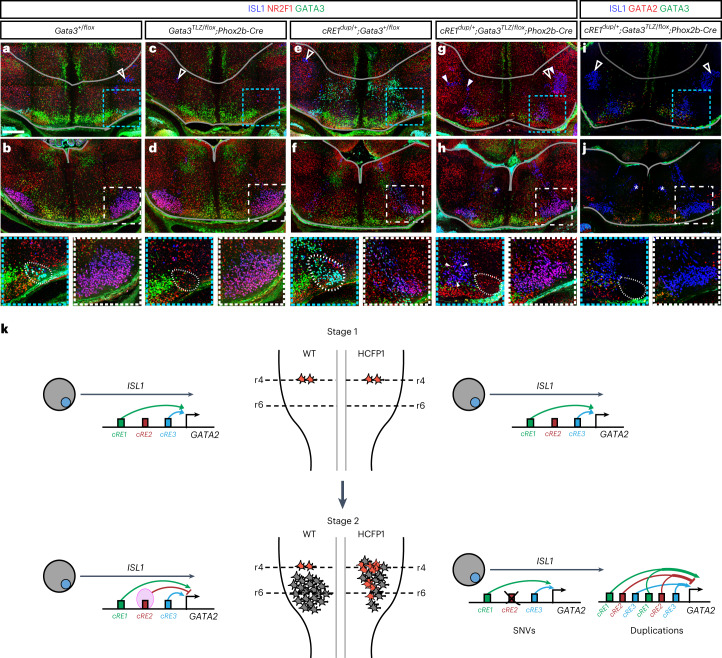
We evaluated whisking after conditional removal of Gata3 from cRE1dup/+ mice. Six of seven cRE1dup/+;Gata3tlz/flox;Phox2b-Cre+ mice had variable and often asymmetrical rescue of whisking, ranging from subtle movement in subsets of whiskers to complete restoration of whisking (Fig. 3k and Supplementary Video 1f–h). Comparison of E14.5 histologies revealed that conditional removal of Gata3 from cRE1dup/+ embryos eliminated the large r4 ectopic population of dorsal ISL1ON (and ISL1ON;GATA2ON) cells as well as IEEs, and generated an elongated column of FBMNs that extended into ventral r6 to form a structure closer in size and shape to the facial nucleus seen in WT controls (Fig. 8a–j). These data establish that human cRE1, in concert with cRE2 and cRE3, modulates the Gata2–Gata3 axis that defines the IEE-to-FBMN switch, and human HCFP1 pathogenic variants probably alter this regulatory pathway (Fig. 8k).
Fig. 8. Combining cRE1dup with Gata3 conditional inactivation partially rescues the HCFP1 phenotypes.
a–h, ISL1 (blue), NR2F1 (red) and GATA3 (green) immunofluorescent staining of hindbrain cross-sections at r4 (top row) and r6 (middle row) axial levels in E14.5 Gata3flox/+;Phox2b-Cre− WT (a,b), Gata3tlz/flox;Phox2b-Cre+ conditional Gata3 knockout (c,d), cRE1dup/+;Gata3flox/+ duplication (e,f) and cRE1dup/+;Gata3tlz/flox;Phox2b-Cre+ rescue (g,h) embryos. i,j, A rescue embryo with ISL1 (blue), GATA2 (red) and GATA3 (green) immunofluorescence (for WT and cRE1dup/+ comparators, see Fig. 7a,c,e,g). Dotted blue squares surround IEE OCNs in a, c, e, g and i and are magnified (bottom row). Dotted white squares marking the right facial nucleus are boxed in b, d, f, h and j and magnified (bottom row). Rescue embryos lack OCNs (g,i) and form an FBMN nucleus (h,j) intermediate in cross-sectional area between WT (b) and cRE1dup/+ (f) embryos. White arrows in magnification of g highlight r4 ISL1ON;NR2F1ON FBMNs. White open arrowheads show trigeminal motor neurons and asterisks the abducens nucleus. Dorsal and ventral borders of the hindbrain are outlined in gray. Scale bar, 200 μm in a applies to a–j (n = 3 (a,b), 3 (c,d), 4 (e,f), 3 (g,h) and 5 (i,j) embryos). k, Model depicting the effect of HCFP1 variants. Stage 1: in both WT (left side) and HCFP1 (right side) hindbrains, early born r4MN progenitors express Gata2, driven in part by cRE1 and cRE3 enhancers, and assume an IEE identity (red cells). Stage 2: in WT, NR2F1 (pink oval) binds to cRE2 in later-born r4MNs, silencing GATA2 and directing these cells to an FBMN identity (gray cells). In HCFP1, cRE2 SNVs disrupt NR2F1 binding (demarcated with X) and unimpeded cRE1 and cRE3 enhancers drive GATA2 expression in later-born r4MNs. Duplications of cRE1, cRE2 and cRE3 generate a net increase in GATA2 enhancer level, similarly expanding GATA2 expression. Either will increase IEEs at the expense of FBMNs, deplete the FBMN progenitor pool and result in CFP.
Discussion
We report that heterozygous noncoding SNVs and CNVs at the HCFP1 locus alter regulation of GATA2 and account for >90% of autosomal dominant, nonsyndromic CFP. Remarkably, the SNVs alter six nucleotides located in two clusters within a conserved noncoding region that we refer to as cRE2, located 3′ of DNAJB8 and GATA2. DNAJB8 is not a triplosensitive gene (pTriplo score 0.22) (ref. 62) nor is it expressed in r4MNs or surrounding tissue in WT or cRE1dup/+ mice, excluding its involvement in HCFP1. Instead, our data support cRE2 as a tissue-specific regulatory element to which NR2F1 binds, restricting r4MN GATA2 expression to developing IEEs.
The importance of Gata2 expression in an r4MN IEE-to-FBMN fate transition and the perturbation of its spatial and temporal hindbrain expression as the cause of HCFP1 are supported by our data and those of others. First, we established GATA2 and GATA3 as essential regulators of IEE fate and dispensable for FBMN development and migration. Second, we found that Gata2 enhancers cRE1 and cRE3 drive reporter expression in migrating FBMNs where Gata2 is not expressed and cRE2 silenced this expression. Moreover, this silencing is attenuated by HCFP1 SNVs. Although the cRE2 silencing mechanism remains unknown, cRE1–3 and Gata2 are within the same regulatory region and the cREs might compete for binding to the Gata2 promoter. Third, our humanized cRE1 duplication mouse model has CFP, and scRNA-seq and histology revealed ectopic Gata2 expression in later-born cRE1dup/+ r4MNs that expanded the IEE and depleted the FBMN populations. This phenotype could be partially rescued by removal of Gata3. Last, monoallelic loss-of-function variants in GATA2 and in the +9.5-kb blood GATA2 enhancer element cause blood and immune dysfunction without facial weakness63,64, consistent with altered, not reduced, GATA2 expression in HCFP1 and highlighting the importance of tissue-specific regulation.
Several lines of evidence support a cell-type-specific function of NR2F1 in r4MN IEE-to-FBMN fate transition and attenuation of this function in HCFP1. First, we demonstrated that NR2F1 binds to cRE1 and cRE2 in WT r4MNs, and binding to cRE2 is reduced in r4MNs isolated from mice carrying a Cluster A SNV. Second, we found dynamic expression of Nr2f1 in developing FBMNs, with reduced expression in IEEs. Third, although human haploinsufficiency of NR2F1 causes a variable phenotype characterized primarily by intellectual disability and optic nerve degeneration65, several individuals are reported to have a thin facial nerve or mild facial weakness66,67.
We favor NR2F1 over NR2F2 as key to the IEE-to-FBMN switch. We found no evidence that NR2F2 binds to cRE2 in public databases59, and it shows low expression in developing r4MN, despite being upregulated in lateral FBMNs at late embryonic stages38. NR2F2 appears important for metabolic and cardiac processes68 rather than neuronal development69 and NR2F2 haploinsufficiency in humans is associated with congenital heart defects without reports of facial weakness70.
It is of interest that we did not observe a CFP phenotype in the Cluster A Fam5SNV/SNV mice, despite alterations in NR2F1 binding. HCFP1 SNV variants are less penetrant than CNVs, and the Fam5SNV mouse may cause a perturbation too mild to cause CFP. It is also possible that the nonconserved NR2F1-binding site in mouse cRE1 attenuates the role of cRE2 in mouse r4MNs. Finally, introduction of cRE2 SNVs in our lacZ assay unveiled enhancer activity, probably through opportunistic binding of other TFs, which could vary between mice and humans71.
We do not know the mechanism of Cluster B SNVs. In silico analysis predicted few if any TF consensus sequences in the Cluster B WT sequence. By EMSA, Cluster B SNVs did not alter NR2F1 binding and had less effect on β-galactosidase reporter expression. Loss of a nonconserved TF-binding site in Cluster B that acts in concert with NR2F1 could result in the indistinguishable Cluster A and Cluster B SNV phenotypes. Alternatively, COUP-TFs recruit co-factors to leverage their inhibitory activity55,72 and aberrant binding of TFs to mutant Cluster B could attenuate NR2F1 function through steric hindrance or impaired cooperative binding73.
In summary, our results show that cell-type-specific Gata2 expression is critical for development of r4 IEEs and its subsequent downregulation drives a fate switch to FBMNs. This transition is tightly regulated by binding of TFs, including NR2F1, to the FBMN–IEE-specific regulatory elements cRE1, cRE2 and cRE3. HCFP1 noncoding variants alter this regulatory framework by pathologically prolonging Gata2 expression, favoring the formation of IEEs at the expense of FBMNs.
Methods
Additional methods information can be found in Supplementary Information. Data were excluded from the study only if rendered uninterpretable for technical reasons, including damage to cryosections that precluded quantification. In these instances, a replicate sample was processed and included in the study. For scRNA-seq, one E9.5 dataset was excluded from the study due to high free RNA content and the experiment was repeated to generate a usable dataset.
Research participants
For the US-based cohort 1, research participants were enrolled under protocols approved by the Institutional Review Boards of Boston Children’s Hospital, Boston (ClinicalTrials.gov identifier: NCT03059420); Icahn School of Medicine at Mount Sinai, New York; National Human Genome Research Institute, National Institutes of Health (NIH), Bethesda (ClinicalTrials.gov identifier: NCT02055248); American University of Beirut Medical Center, Beirut, Lebanon; and Royal Victorian Eye and Ear Hospital, Victoria, Australia. For the European-based cohort 2, research participants were enrolled under a protocol approved by the Institutional Review Board of CMO Radboudumc and METC East Nijmegen, the Netherlands.
Adult participants and guardians of children provided written informed consent for participation. No participant compensation was provided. The NIH paid travel and visit expenses for participation in the NIH Clinical Center evaluation. Photographs were selected from participants who consented to publication of identifying two-dimensional face photographs. Sex, number and age of participants are provided in Supplementary Table 1. Phenotypes of the affected members were obtained through a visit to the NIH Clinical Center or through examinations conducted by co-authors. A blood and/or saliva sample was collected from each participant for extraction of genomic DNA.
Clinical evaluation
Multidisciplinary phenotyping studies were performed prospectively during a 1-week visit to the NIH Clinical Center for the 12 participants indicated in Supplementary Table 1. Studies included standardized examinations by clinical genetics, ophthalmology, audiology, dental/craniofacial, rehabilitation medicine, speech therapy, neurology, cardiology, neurocognitive and behavioral testing, as well as brain imaging, neurophysiology and laboratory studies, per protocol NCT02055248. Additional details are provided in Supplementary Methods.
Genome build
Human genomic coordinates are GRCh37/hg19 and mouse genomic coordinates GRCm38/mm10.
SNP generation, linkage and CNV analysis
Infinium Omni2.5Exome-8 arrays (Illumina) were used to generate whole-genome SNP data from participating members of Fam9 and a subset of the participating members of Fam1 (II-1, II-2, III-1, III-3, III-5, IV-1, IV-2, IV-5 and IV-6). Infinium Omin2.5-8 arrays were used for the remaining individuals from Fam1 (III-2, III-4, IV-3 and IV-4). Omni2.5Exome-8 SNP data were generated at the National Human Genome Research Institute Genomics Core (NHGRI/DIR), and Omni2.5 data were generated at the HMS Ocular Genomics Institute (OGI, Massachusetts Eye and Ear Institute). SNPs were processed for linkage analysis using LINKDATAGEN76 (2016 release) and multipoint genome-wide parametric linkage analysis was performed using MERLIN v.0.5.4 (ref. 77) assuming an autosomal dominant model with full penetrance. For CNV analysis, informative SNPs were passed through PennCNV v.1.05 (ref. 78) and QuantiSNP v.2.3 (ref. 79) was used to generate CNV calls, and the resulting CNVs filtered based on specific criteria. Additional details are provided in Supplementary Methods.
Exome sequencing
DNA libraries were prepared using Nimblegen SeqCap EZ Exome v.2 (Roche) or SureSelect Human All Exon v.4 kit (Agilent) and sequenced on either Illumina Hiseq 2000 or Illumina Hiseq 2500. All samples had at least 98% of exonic regions with at least 10× coverage. Additional details are provided in Supplementary Methods.
Whole-genome sequencing
WGS was performed and interpreted independently for the two cohorts. Additional details are provided in Supplementary Methods.
Targeted sequencing and variant validation and haplotypes
The cRE2-conserved noncoding region on chromosome 3 was amplified with KAPA2G Fast ReadyMix (KAPA Biosystems) and Sanger sequenced bidirectionally (Genewiz). SNV confirmation and segregation were evaluated in all available family members by Sanger sequencing. Alignment of the electropherograms was performed using Geneious Prime v.2021.1.1 (Dotmatics). Screening by ddPCR was performed for CNV screening in the conserved chromosome 3 region and DNAJB8. The hTERT (catalog no. 4403316) or RNaseP probes (Thermo Fisher Scientific, catalog no. 4403326) served as an internal copy number control. CNVs were confirmed using breakpoint spanning PCR when possible. All primers and probes are listed in Supplementary Table 4. Additional details are provided in Supplementary Methods.
Electrophoretic mobility shift assays
For the EMSA experiment, 5′-IRDye 700-labeled high-performance liquid chromatography-purified probes from IDT were incubated with HeLaScribe nuclear extract, Gel shift assay grade (Promega, catalog no. E352A) or HEK293T cell nuclear extract (American Type Culture Collection, catalog no. CRL-3216). For the supershift assay, 1 µg of anti-NR2F1 antibody (D4H2 rabbit monoclonal antibody, Cell Signaling, catalog no. 6364; mouse monoclonal antibody, Perseus Proteomics, catalog no. PP-H8124-00) and respective isotype controls (WNT3A rabbit monoclonal antibody, Cell Signaling, catalog no. 2721; anti-hemagglutinin, immunoglobulin G2a mouse monoclonal antibody, Thermo Fisher Scientific, catalog no. 5B1D10) were added during the preincubation step. Gels were visualized using an Odyssey imaging system (LI-COR Biosciences). Additional details are provided in Supplementary Methods.
Mouse husbandry
Animal husbandry was according to NIH guidelines and approved by the Institutional Animal Care and Use Committees of Boston Children’s Hospital (protocol no. 00001852), the Icahn School of Medicine at Mount Sinai (protocol no. 2015-0052) and the Lawrence Berkeley National Laboratory (protocol nos. 290003 and 290008). Breeding pairs were separated after the detection of a vaginal plug at 9am, which was considered to be E0.5. The sex of the experimental embryos was not determined.
Experimental mouse lines
Generation and acquisition of transgenic mouse lines, breeding strategies for experimental crosses and species, strain, sex, number and age of experimental animals are described in Supplementary Methods.
LacZ assay
Transgenic E11.5 mouse embryos were generated and analyzed as described previously80. Additional details are provided in Supplementary Methods.
Whisker movement assay
Mice aged 4 weeks to 5 months (20 males, 31 females) of the indicated genotypes were recorded in the.MOV format with the ‘Slo-Mo’ function on an iPhone v.6 (which records at ~120 frames per s) while walking on a treadmill. Each video recorded the superior view of the mouse’s face and body and was at least 2 min in length at the decreased frame rate. After a training session to standardize interpretation, four independent reviewers blinded to mouse genotype reviewed the unedited videos using Apple QuickTime Player (v.10.5) and scored left-side and right-side whisker movement on a scale of 0–3: ‘3’ indicated the full trajectory of all whiskers as observed in WT mice, ‘2’ indicated a slight reduction in range of motion or in number of whiskers moving, ‘1’ indicated a dramatic reduction in range of motion or in number of whiskers moving and ‘0’ indicated no detected whisker movement. Statistical analysis was performed using unpaired, two-sided Wilcoxon’s testing. For presentation as a supplementary video, recordings were cropped, enlarged and edited for length in iMovie 10.3.5 (Apple, Inc.) for representative examples of treadmill walking 8–12 s in duration. Videos were ‘cropped to fit’ in iMovie to enlarge and focus on the head. Video segments were compiled into a single video file, with annotations generated in Microsoft 365 PowerPoint and imported as separate slides with iMovie.
Dissection and dissociation of embryonic r4 motor neurons
ISL1MN-GFP+ and surrounding GFP− tissues were microdissected from E9.5, E10.5, E11.5 and E12.5 WT, and cRE1dup/+ hindbrains. To capture the anatomical extent of lateral IEE and caudal FBMN migration, the developing hindbrain from the caudal edge, trigeminal motor nucleus through the rostral third of the glossopharyngeal/vagus nuclei was collected. Single-cell suspensions were generated from dissected hindbrain tissue with enzymatic digestion and trituration (Papain Dissociation System, catalog no. LK003150) (ref. 81).
FACS
GFP+ cranial motor neurons were collected from single-cell suspensions of dissociated embryonic hindbrains using a BD FACSARIA II Cell Sorter equipped with BD FACSDiva 8.0.2 software and a 100-μm nozzle. Isl1MN-GFP r4MNs were selected based on GFP reporter expression and found to comprise 2–6% of the total cellular input. Immediately before completion of Isl1MNGFP+ cell sorting, GFP gates were lifted to sample a representative spike of GFP− cells from the surrounding tissues and to reach an optimal number of total cells for the 10× protocol. These cells were collected into a single well of a 96-well plate containing 5 μl of 0.4% bovine serum albumin (BSA) in Hibernate E Low Fluorescence medium (HE-Lf, Brainbits).
Single-cell CUT&Tag and data analysis
Single-cell CUT&Tag experiments were performed using the protocol single-cell CUT&Tag on 10× Genomics platform from www.protocol.io (https://www.protocols.io/view/single-cell-cut-and-tag-on-10x-genomics-platform-bqbnmsme) with the modification of using the CUTANA pAG-Tn5 enzyme (Epicypher, 15-1117) and all buffers (antibody, digitonin, digitonin-300 and tagmentation) contain 2% of BSA. Raw single-cell CUT&Tag data were processed using Cell Ranger-ATAC 2.0.0 (10× Genomics). Data analysis was performed using Signac v.1.5.0ca (ref. 82) and Seurat v.4.2.0 (ref. 83) packages. Additional details are provided in Supplementary Methods.
ScRNA-seq
ScRNA-seq was performed using the Single Cell 3′ Reagent kits v.3.1 User Guide (10× Genomics). The resulting libraries were sequenced on a NextSeq500 platform (Illumina). Additional details are provided in Supplementary Methods.
ScRNA-seq analysis
The raw scRNA-seq data were processed using the Cell Ranger v.7.1 analysis toolkit (10× Genomics). Data analysis was performed using R v.4.2.1, and Seurat v.4.2.0. Differential gene expression analysis was performed with the BBrowser Single Cell Browser v.3.5.26 and the BioVinci data visualization package v.3.0.0 (BioTuring)84. Additional details are provided in Supplementary Methods.
Immunohistochemistry and in situ hybridization
Timed litters from crosses of WT female C57/Bl6 mice to cRE1dup/+ males were collected at E10.5, E12.5, E14.5 and E16.5, cryosectioned and processed for immunofluorescent staining as described previously38, using combinations of primary antibodies against ISL1, GATA2, GATA3 and ISL1, NR2F1 and GATA3. Similar E10.5, E12.5 and E14.5 litters, as well as testes from WT and cRE1dup/+ adult males, were collected, cryosectioned and processed for in situ hybridization as described previously85 using riboprobes for Isl1 and Gata2. Whole-mount E11.5 embryos were collected from WT crosses and processed for in situ hybridization as described previously86 using the Isl1 and Gata2 riboprobes. Additional details are provided in Supplementary Methods.
Histological examination of r4MN identity, migration and birthdate
For examination of r4MN migration, cell identity and birthdate, WT female C57/Bl6 mice were crossed to cRE1dup/+ males and received single 50 mg kg−1 of intraperitoneal injections of EdU (Thermo Fisher Scientific, catalog no. A10044) at E9.25, E10 or E10.5 development timepoints. E14.5 embryos were dissected, fixed, cryosectioned, collected on to glass slides, immunostained with guinea-pig anti-ISL1 and rabbit anti-GATA2 primary antibodies, incubated with Alexa Fluor-488 anti-guinea-pig and Alexa Fluor-647 anti-rabbit secondary antibodies, processed for EdU detection using azide-conjugated Alexa Fluor-555 and coverslipped. The methods used are as described previously38. Sections were imaged on a Zeiss LSM 980 confocal microscope with a ×20 objective and a 3-μm step size. For each embryo, bilateral ISL1ON r4MNs were analyzed caudally to rostrally, beginning at the first section rostral to the hypoglossal nucleus and ending at the first section in which IEEs were no longer present (at the level of the trigeminal motor nucleus). Cells from every fourth cryosection were counted semiautomatically in three dimensions using arivis Vision4D ×64 analysis operations. Additional details are provided in Supplementary Methods.
Cell count statistical analysis
Statistical analysis and all plotting were performed using Rstudio build 554 and R v.4.2.1 with tidyverse package v.1.3.1. Statistics was calculated using unpaired, two-sided Student’s t-test using the function Stat_compare_means from the ggpubr 0.4.0 package.
Birthdating statistical analysis
The average unilateral number of r4MNs labeled by single EdU injections at E8.5, E9.25, E10.0 and E10.5 was determined as above and in Supplementary Methods. The proportions of EdU-labeled IEEs and FBMNs were calculated by dividing the number of cells labeled from each population by the total number of EdU-labeled r4MNs detected for each embryo and averaging these percentages. Statistical significance was defined by P < 0.05 from an unpaired, two-sided Student’s t-test, calculated and plotted using R v.4.2.1.
Reporting summary
Further information on research design is available in the Nature Portfolio Reporting Summary linked to this article.
Online content
Any methods, additional references, Nature Portfolio reporting summaries, source data, extended data, supplementary information, acknowledgements, peer review information; details of author contributions and competing interests; and statements of data and code availability are available at 10.1038/s41588-023-01424-9.
Supplementary information
Supplementary Clinical note, Tables 1–4, Methods and References.
Whisking videos of WT (a), Gata2cKO (b), Gata3cKO (c), cRE2 Fam5SNV (d), cRE1dup (e), cRE1dup partial rescue 1 (f), cRE1dup partial rescue 2 (g) and cRE1dup full rescue (h).
Acknowledgements
We thank the following: all members of the U01HD079068 Consortium; V. McCarrell and the Moebius Syndrome Foundation, C. Andrews, K. Hao, K. Ismail, J. Lee, B. B. Biesecker, A. Zingaro, S. Dogar, L. Goodrich, B. Fritzsch and members of the Engle laboratory for their contributions and insightful discussions; the Regev laboratory and Broad Institute Klarman Cell Observatory; and the BioTuring User Support Team: E. van Beusekom, M. Kwint, Ro. van Beek, T. Mantere, K. Neveling, E. van der Looij, M. Schouten, J. van Reeuwijk, A. den Ouden, R. Derks, J. C. Galbany, C. Gilissen, the Radboudumc Technology Center Genomics and the Radboudumc Cell Culture Facility for their clinical, technical and bioinformatic support. The Gata3tlz and Gata3flox mice were kindly shared by F. Grosveld (Erasmus Medical Center, the Netherlands) and J. Zhu (NIH–National Institute of Allergy and Infectious Diseases), respectively, and provided to us by L. Goodrich (Harvard Medical School). The anti-ISL1 antibody was a generous gift from S. Morton and T. Jessell (Columbia University). We also acknowledge the use of: Boston Children’s Hospital F.M. Kirby Neurobiology Center and IDDRC Gene Editing, Neurodevelopmental Behavioral, Molecular Genetics and Administrative Cores; Boston Children’s Hospital Hematology/Oncology Flow Cytometry Research Facility; the Broad Institute Genomics Platform; Harvard Medical School OGI Core; the NIH Intramural Sequencing Center; the NHGRI Genomic Core; and the Gene Targeting and Transgenic Facility at Albert Einstein College of Medicine. The work was supported by: an NIH Gabriella Miller Kids First Pediatric Research Program (grant no. X01 HL132377 to E.C.E.); NIH (grant no. U01HD079068 to E.W.J., I.M. and E.C.E.); William Randolph Hearst Fund Grant (to S.A.D.G.); Moebius Syndrome Foundation grants (to A.P.T., B.D.W., Z.Z. and F.M.F.); Boston Children’s Hospital—Broad Institute Collaborative Grant (to E.C.E.); NIH (grant no. R01HG003988 to L.A.P.); NIH Intramural Research Programs of the National Institute on Deafness and Other Communication Disorders (to C.Z., K.A.K. and C.C.B.), National Institute of Neurological Disorders and Stroke (T.J.L.), National Institute of Mental Health (J.S.); NIH Intramural projects (no. 1ZICMH002961 to A.T.) and NIH ZIA (grant no. HG200389 to F.S.C., N.N., L.B. and A.S.); Boston Children’s Hospital Intellectual and Developmental Disabilities Research Center (grant no. 1U54HD090255); Solve-RD project (to E.d.B., T.K. and L.V.) which received funding from the European Union’s Horizon 2020 research and innovation program under grant agreement no. 779257; HMS George Cheyne Shattuck Memorial Fund (to S.J.G.); American University of Beirut OpenMinds Fund (to R.-M.B.); and National Health and Medical Research Council CRE Translation of Genetic Eye research grant (no. GNT1116360 to S.E.S. and A.M.). This work was supported in part through the computational resources and staff expertise provided by Scientific Computing at the Icahn School of Medicine at Mount Sinai and Clinical and Translational Science Awards (grant no. UL1TR004419) from the National Center for Advancing Translational Sciences, NIH. The research of L.A.P. and M.K. was conducted at the E.O. Lawrence Berkeley National Laboratory and performed under the US Department of Energy contract (no. DE-AC02-05CH11231), University of California. The Centre for Eye Research Australia (S.E.S.) receives operational infrastructure support from the government in Victoria. E.C.E. and S.H.O. are Howard Hughes Medical Institute investigators.
Extended data
Source data
Unprocessed EMSA blots from Fig. 4k.
Author contributions
A.P.T., S.A.D.G., B.D.W. and E.C.E. conceptualized the experimental design. S.A.D.G., B.D.W., W.-M.C., E.D.B., S.J.G., L.E.L.M.V. and H.V.B. performed linkage analysis, haplotype analysis, WGS analysis, ddPCR and targeted sequencing. A.S. and P.S.C. generated and Z.Z. analyzed SNP-based CNV analysis. S.A.D.G., B.D.W., W.-M.C., N.N., L.L.B., A.S. and P.S.C. analyzed exome sequences. E.D.B., Z.Z. and M.L. performed genome-based CNV analysis. A.V., N.N., L.L.B., S.C.J.P. and F.S.C. aligned and analyzed ENCODE data. S.A.D.G. interpreted epigenetic data and conducted the EMSA experiments. A.P.T. and W.-M.C. performed the single-cell CUT&Tag experiments. Y.F. and S.H.O. developed the Gata2flox mouse line. A.P.T. developed the Fam5SNV mouse line. B.D.W. developed the cRE1dup mouse line and, with P.E.W., confirmed the sequence. B.D.W. performed initial gross phenotyping of the cRE1dup mouse line. A.P.T. performed the whisking, birthdating and immunohistochemistry experiments. S.A.D.G., B.D.W., W.-M.C. and E.C.E. blindly scored whisking. A.P.T., T.R. and E.C.E. conducted the neuron counting experiments. A.P.T., W.-M.C., J.L.B., S.M., M.C.W. and E.C.E. performed Fam5snv/snv mouse phenotyping. W.-M.C., A.P.T., B.M.P. and A.G. performed RNA-seq library preparations and sequencing. W.-M.C., A.P.T. and T.E.C. analyzed RNA-seq data. M.K. and L.A.P. conducted the mouse enhancer lacZ experiments. I.M. supervised and C.V.R. and F.M.F. coordinated the NIH phenotyping studies. I.M., T.J.L., C.Z., K.A.K., C.C.B., A.T. and J.S. conducted phenotyping studies at the NIH. B.J.B. coordinated non-NIH phenotyping studies. C.D.R. and E.C.E. interpreted MR images. B.D.W., E.D.B., S.E.S., J.E.E., J.L.D., A.T., E.R., C.A.-H., R.-M.B., D.A.M., A.F.B., M.F.-C., M.F., T.K., G.W.P., S.R., M.T.S., T.A.H., E.W.J. and E.C.E. provided biospecimens and clinical data. I.M., F.S.C., E.W.J., H.V.B., L.E.L.M.V. and E.C.E. conceived the study. E.C.E. supervised the overall study. A.P.T., S.A.D.G. and E.C.E. wrote the initial manuscript. All authors saw, had the opportunity to comment on and approved the final manuscript.
Peer review
Peer review information
Nature Genetics thanks Malte Spielmann and the other, anonymous, reviewer(s) for their contribution to the peer review of this work. Peer reviewer reports are available.
Data availability
Publicly available ChIP-seq datasets used in the present study: accession nos. GSM1817193 and GSM714811 for NR2F1; GSM714812 for NR2F2; GSM935589 for GATA2; and GSM1010738 and GSM1602667 for GATA3. Conserved TF-binding sites were obtained using rVista 2.0 (https://rvista.dcode.org). Additional epigenetic data were explored using the ENCODE database (https://www.encodeproject.org). GRCh37/hg19 human reference genome under Sequence Read Archive (SRA) accession no. PRJNA31257 and GRCm38/mm10 mouse reference genome under SRA accession no. PRJNA20689 were used for the alignment of human and mouse sequencing data, respectively. GnomAD and 1,000 genome frequencies were extracted from https://gnomad.broadinstitute.org and https://www.internationalgenome.org, respectively. Common structural variant data were obtained from the DGV (http://dgv.tcag.ca/dgv/app/home) and GoNL SV database (https://www.nlgenome.nl/login). Exome sequence and SNP data from a subset of participants are available through dbGaP Phs001383.v1.p1. WGS data from Cohort 1 participants are available through dbGaP Phs001247.v1.p1; Radboudumc consent does not allow for broad sharing via repositories and, thus, Cohort 2 WGS data are available on request and after a positive evaluation by a local data access committee confirming that the proposed re-use is in line with original consent obtained. ScRNA-seq and CUT&Tag sequencing data are available through the National Center for Biotechnology Information Gene Expression Omnibus SuperSeries accession no. GSE223274. LacZ images are uploaded to the Vista enhancer browser (https://enhancer.lbl.gov) and can be retrieved by their human coordinates as follows: hs2664 (cRE1) chr3:128,175,331–128,177,163; hs2665 (cRE2) chr3:128,177,164–128,179,169; hs2666 (cRE3) chr3:128,186,421–128,188,215; hs2667 (cRE1 + cRE2) chr3:128,175,331–128,179,169; and hs2668 (cRE2 + cRE3) chr3:128,177,164–128,188,215. Mice are available on request. Source data are provided with this paper.
Code availability
The codes used for scRNA-seq and single-cell CUT&Tag data processing and analyses are available at https://zenodo.org/badge/latestdoi/637923997.
Competing interests
S.A.D.G. is a Regeneron Pharmaceuticals employee and stockholder.
Footnotes
Publisher’s note Springer Nature remains neutral with regard to jurisdictional claims in published maps and institutional affiliations.
These authors contributed equally: Alan P. Tenney, Silvio Alessandro Di Gioia, Bryn D. Webb
Deceased: Peter S. Chines
Extended data
is available for this paper at 10.1038/s41588-023-01424-9.
Supplementary information
The online version contains supplementary material available at 10.1038/s41588-023-01424-9.
References
- 1.ENCODE Project Consortium. An integrated encyclopedia of DNA elements in the human genome. Nature. 2012;489:57–74. doi: 10.1038/nature11247. [DOI] [PMC free article] [PubMed] [Google Scholar]
- 2.Kvon EZ, et al. Progressive loss of function in a limb enhancer during snake evolution. Cell. 2016;167:633–642.e11. doi: 10.1016/j.cell.2016.09.028. [DOI] [PMC free article] [PubMed] [Google Scholar]
- 3.Lee B-K, et al. Cell-type specific and combinatorial usage of diverse transcription factors revealed by genome-wide binding studies in multiple human cells. Genome Res. 2012;22:9–24. doi: 10.1101/gr.127597.111. [DOI] [PMC free article] [PubMed] [Google Scholar]
- 4.Zhang F, Lupski JR. Non-coding genetic variants in human disease. Hum. Mol. Genet. 2015;24:R102–R110. doi: 10.1093/hmg/ddv259. [DOI] [PMC free article] [PubMed] [Google Scholar]
- 5.Spielmann M, Mundlos S. Looking beyond the genes: the role of non-coding variants in human disease. Hum. Mol. Genet. 2016;25:R157–R165. doi: 10.1093/hmg/ddw205. [DOI] [PubMed] [Google Scholar]
- 6.Karnuta JM, Scacheri PC. Enhancers: bridging the gap between gene control and human disease. Hum. Mol. Genet. 2018;27:R219–R227. doi: 10.1093/hmg/ddy167. [DOI] [PMC free article] [PubMed] [Google Scholar]
- 7.Lettice LA, et al. A long-range Shh enhancer regulates expression in the developing limb and fin and is associated with preaxial polydactyly. Hum. Mol. Genet. 2003;12:1725–1735. doi: 10.1093/hmg/ddg180. [DOI] [PubMed] [Google Scholar]
- 8.Lettice LA, Devenney P, De Angelis C, Hill RE. The conserved sonic hedgehog limb enhancer consists of discrete functional elements that regulate precise spatial expression. Cell Rep. 2017;20:1396–1408. doi: 10.1016/j.celrep.2017.07.037. [DOI] [PMC free article] [PubMed] [Google Scholar]
- 9.Benko S, et al. Highly conserved non-coding elements on either side of SOX9 associated with Pierre Robin sequence. Nat. Genet. 2009;41:359–364. doi: 10.1038/ng.329. [DOI] [PubMed] [Google Scholar]
- 10.Dathe K, et al. Duplications involving a conserved regulatory element downstream of BMP2 are associated with brachydactyly type A2. Am. J. Hum. Genet. 2009;84:483–492. doi: 10.1016/j.ajhg.2009.03.001. [DOI] [PMC free article] [PubMed] [Google Scholar]
- 11.Bauer DE, et al. An erythroid enhancer of BCL11A subject to genetic variation determines fetal hemoglobin level. Science. 2013;342:253–257. doi: 10.1126/science.1242088. [DOI] [PMC free article] [PubMed] [Google Scholar]
- 12.Will AJ, et al. Composition and dosage of a multipartite enhancer cluster control developmental expression of Ihh (Indian hedgehog) Nat. Genet. 2017;49:1539–1545. doi: 10.1038/ng.3939. [DOI] [PMC free article] [PubMed] [Google Scholar]
- 13.Wakeling MN, et al. Non-coding variants disrupting a tissue-specific regulatory element in HK1 cause congenital hyperinsulinism. Nat. Genet. 2022;54:1615–1620. doi: 10.1038/s41588-022-01204-x. [DOI] [PMC free article] [PubMed] [Google Scholar]
- 14.Kremer H, et al. Localization of a gene for Möbius syndrome to chromosome 3q by linkage analysis in a Dutch family. Hum. Mol. Genet. 1996;5:1367–1371. doi: 10.1093/hmg/5.9.1367. [DOI] [PubMed] [Google Scholar]
- 15.Michielse CB, et al. Refinement of the locus for hereditary congenital facial palsy on chromosome 3q21 in two unrelated families and screening of positional candidate genes. Eur. J. Hum. Genet. 2006;14:1306–1312. doi: 10.1038/sj.ejhg.5201706. [DOI] [PubMed] [Google Scholar]
- 16.Verzijl HTFM, van der Zwaag B, Lammens M, ten Donkelaar HJ, Padberg GW. The neuropathology of hereditary congenital facial palsy vs Möbius syndrome. Neurology. 2005;64:649–653. doi: 10.1212/01.WNL.0000151848.65094.55. [DOI] [PubMed] [Google Scholar]
- 17.Van Der Zwaag B, et al. Mutation analysis in the candidate Möbius syndrome genes PGT and GATA2 on chromosome 3 and EGR2 on chromosome 10. J. Med. Genet. 2002;39:E30. doi: 10.1136/jmg.39.6.e30. [DOI] [PMC free article] [PubMed] [Google Scholar]
- 18.Karis A, et al. Transcription factor GATA-3 alters pathway selection of olivocochlear neurons and affects morphogenesis of the ear. J. Comp. Neurol. 2001;429:615–630. doi: 10.1002/1096-9861(20010122)429:4<615::AID-CNE8>3.0.CO;2-F. [DOI] [PubMed] [Google Scholar]
- 19.Pata I, et al. The transcription factor GATA3 is a downstream effector of Hoxb1 specification in rhombomere 4. Development. 1999;126:5523–5531. doi: 10.1242/dev.126.23.5523. [DOI] [PubMed] [Google Scholar]
- 20.Chen X, et al. Manta: rapid detection of structural variants and indels for germline and cancer sequencing applications. Bioinformatics. 2016;32:1220–1222. doi: 10.1093/bioinformatics/btv710. [DOI] [PubMed] [Google Scholar]
- 21.MacDonald JR, Ziman R, Yuen RKC, Feuk L, Scherer SW. The Database of Genomic Variants: a curated collection of structural variation in the human genome. Nucleic Acids Res. 2014;42:D986–D992. doi: 10.1093/nar/gkt958. [DOI] [PMC free article] [PubMed] [Google Scholar]
- 22.Karczewski KJ, et al. The mutational constraint spectrum quantified from variation in 141,456 humans. Nature. 2020;581:434–443. doi: 10.1038/s41586-020-2308-7. [DOI] [PMC free article] [PubMed] [Google Scholar]
- 23.Lee JA, Carvalho CMB, Lupski JR. A DNA replication mechanism for generating nonrecurrent rearrangements associated with genomic disorders. Cell. 2007;131:1235–1247. doi: 10.1016/j.cell.2007.11.037. [DOI] [PubMed] [Google Scholar]
- 24.Hastings PJ, Ira G, Lupski JR. A microhomology-mediated break-induced replication model for the origin of human copy number variation. PLoS Genet. 2009;5:e1000327. doi: 10.1371/journal.pgen.1000327. [DOI] [PMC free article] [PubMed] [Google Scholar]
- 25.Francius C, et al. Genetic dissection of Gata2 selective functions during specification of V2 interneurons in the developing spinal cord. Dev. Neurobiol. 2015;75:721–737. doi: 10.1002/dneu.22244. [DOI] [PubMed] [Google Scholar]
- 26.Kala K, et al. Gata2 is a tissue-specific post-mitotic selector gene for midbrain GABAergic neurons. Development. 2009;136:253–262. doi: 10.1242/dev.029900. [DOI] [PubMed] [Google Scholar]
- 27.Khandekar M, et al. A Gata2 intronic enhancer confers its pan-endothelia-specific regulation. Development. 2007;134:1703–1712. doi: 10.1242/dev.001297. [DOI] [PubMed] [Google Scholar]
- 28.Khandekar M, Suzuki N, Lewton J, Yamamoto M, Engel JD. Multiple, distant Gata2 enhancers specify temporally and tissue-specific patterning in the developing urogenital system. Mol. Cell. Biol. 2004;24:10263–10276. doi: 10.1128/MCB.24.23.10263-10276.2004. [DOI] [PMC free article] [PubMed] [Google Scholar]
- 29.Holloway AK, Bruneau BG, Sukonnik T, Rubenstein JL, Pollard KS. Accelerated evolution of enhancer hotspots in the mammal ancestor. Mol. Biol. Evol. 2016;33:1008–1018. doi: 10.1093/molbev/msv344. [DOI] [PMC free article] [PubMed] [Google Scholar]
- 30.Zheng R, et al. Cistrome Data Browser: expanded datasets and new tools for gene regulatory analysis. Nucleic Acids Res. 2019;47:D729–D735. doi: 10.1093/nar/gky1094. [DOI] [PMC free article] [PubMed] [Google Scholar]
- 31.Mei S, et al. Cistrome Data Browser: a data portal for ChIP-Seq and chromatin accessibility data in human and mouse. Nucleic Acids Res. 2017;45:D658–D662. doi: 10.1093/nar/gkw983. [DOI] [PMC free article] [PubMed] [Google Scholar]
- 32.Gertz J, et al. Distinct properties of cell-type-specific and shared transcription factor binding sites. Mol. Cell. 2013;52:25–36. doi: 10.1016/j.molcel.2013.08.037. [DOI] [PMC free article] [PubMed] [Google Scholar]
- 33.Boeva V, et al. Heterogeneity of neuroblastoma cell identity defined by transcriptional circuitries. Nat. Genet. 2017;49:1408–1413. doi: 10.1038/ng.3921. [DOI] [PubMed] [Google Scholar]
- 34.Sherwood CC. Comparative anatomy of the facial motor nucleus in mammals, with an analysis of neuron numbers in primates. Anat. Rec. A Discov. Mol. Cell. Evol. Biol. 2005;287:1067–1079. doi: 10.1002/ar.a.20259. [DOI] [PubMed] [Google Scholar]
- 35.Studer M, Lumsden A, Ariza-McNaughton L, Bradley A, Krumlauf R. Altered segmental identity and abnormal migration of motor neurons in mice lacking Hoxb-1. Nature. 1996;384:630–634. doi: 10.1038/384630a0. [DOI] [PubMed] [Google Scholar]
- 36.Guthrie S. Patterning and axon guidance of cranial motor neurons. Nat. Rev. Neurosci. 2007;8:859–871. doi: 10.1038/nrn2254. [DOI] [PubMed] [Google Scholar]
- 37.Fritzsch B, et al. Neuronal migration generates new populations of neurons that develop unique connections, physiological properties and pathologies. Front. Cell Dev. Biol. 2019;7:59. doi: 10.3389/fcell.2019.00059. [DOI] [PMC free article] [PubMed] [Google Scholar]
- 38.Tenney AP, et al. Etv1 controls the establishment of non-overlapping motor Innervation of neighboring facial muscles during development. Cell Rep. 2019;29:437–452.e4. doi: 10.1016/j.celrep.2019.08.078. [DOI] [PMC free article] [PubMed] [Google Scholar]
- 39.Cattaneo L, Pavesi G. The facial motor system. Neurosci. Biobehav. Rev. 2014;38:135–159. doi: 10.1016/j.neubiorev.2013.11.002. [DOI] [PubMed] [Google Scholar]
- 40.Fritzsch B, Elliott KL. Evolution and development of the inner ear efferent system: transforming a motor neuron population to connect to the most unusual motor protein via ancient nicotinic receptors. Front. Cell. Neurosci. 2017;11:114. doi: 10.3389/fncel.2017.00114. [DOI] [PMC free article] [PubMed] [Google Scholar]
- 41.Sienknecht UJ, Köppl C, Fritzsch B. Evolution and development of hair cell polarity and efferent function in the inner ear. Brain Behav. Evol. 2014;83:150–161. doi: 10.1159/000357752. [DOI] [PubMed] [Google Scholar]
- 42.Frank MM, Goodrich LV. Talking back: development of the olivocochlear efferent system. Wiley Interdiscip. Rev. Dev. Biol. 2018;7:e324. doi: 10.1002/wdev.324. [DOI] [PMC free article] [PubMed] [Google Scholar]
- 43.Tiveron MC, Pattyn A, Hirsch MR, Brunet JF. Role of Phox2b and Mash1 in the generation of the vestibular efferent nucleus. Dev. Biol. 2003;260:46–57. doi: 10.1016/S0012-1606(03)00213-6. [DOI] [PubMed] [Google Scholar]
- 44.Song M-R, et al. T-Box transcription factor Tbx20 regulates a genetic program for cranial motor neuron cell body migration. Development. 2006;133:4945–4955. doi: 10.1242/dev.02694. [DOI] [PMC free article] [PubMed] [Google Scholar]
- 45.Nardelli J, Thiesson D, Fujiwara Y, Tsai FY, Orkin SH. Expression and genetic interaction of transcription factors GATA-2 and GATA-3 during development of the mouse central nervous system. Dev. Biol. 1999;210:305–321. doi: 10.1006/dbio.1999.9278. [DOI] [PubMed] [Google Scholar]
- 46.Pfaff SL, Mendelsohn M, Stewart CL, Edlund T, Jessell TM. Requirement for LIM homeobox gene Isl1 in motor neuron generation reveals a motor neuron-dependent step in interneuron differentiation. Cell. 1996;84:309–320. doi: 10.1016/S0092-8674(00)80985-X. [DOI] [PubMed] [Google Scholar]
- 47.Tsai FY, et al. An early haematopoietic defect in mice lacking the transcription factor GATA-2. Nature. 1994;371:221–226. doi: 10.1038/371221a0. [DOI] [PubMed] [Google Scholar]
- 48.Kurek D, Garinis GA, van Doorninck JH, van der Wees J, Grosveld FG. Transcriptome and phenotypic analysis reveals Gata3-dependent signalling pathways in murine hair follicles. Development. 2007;134:261–272. doi: 10.1242/dev.02721. [DOI] [PubMed] [Google Scholar]
- 49.van Doorninck JH, et al. GATA-3 is involved in the development of serotonergic neurons in the caudal raphe nuclei. J. Neurosci. 1999;19:RC12. doi: 10.1523/JNEUROSCI.19-12-j0002.1999. [DOI] [PMC free article] [PubMed] [Google Scholar]
- 50.Scott MM, Williams KW, Rossi J, Lee CE, Elmquist JK. Leptin receptor expression in hindbrain Glp-1 neurons regulates food intake and energy balance in mice. J. Clin. Invest. 2011;121:2413–2421. doi: 10.1172/JCI43703. [DOI] [PMC free article] [PubMed] [Google Scholar]
- 51.Dörfl J. The musculature of the mystacial vibrissae of the white mouse. J. Anat. 1982;135:147–154. [PMC free article] [PubMed] [Google Scholar]
- 52.Rosenbauer F, et al. Lymphoid cell growth and transformation are suppressed by a key regulatory element of the gene encoding PU.1. Nat. Genet. 2006;38:27–37. doi: 10.1038/ng1679. [DOI] [PubMed] [Google Scholar]
- 53.Kvon EZ, et al. Comprehensive in vivo interrogation reveals phenotypic impact of human enhancer variants. Cell. 2020;180:1262–1271.e15. doi: 10.1016/j.cell.2020.02.031. [DOI] [PMC free article] [PubMed] [Google Scholar]
- 54.Ovcharenko I, Nobrega MA, Loots GG, Stubbs L. ECR browser: a tool for visualizing and accessing data from comparisons of multiple vertebrate genomes. Nucleic Acids Res. 2004;32:W280–W286. doi: 10.1093/nar/gkh355. [DOI] [PMC free article] [PubMed] [Google Scholar]
- 55.Bertacchi M, Parisot J, Studer M. The pleiotropic transcriptional regulator COUP-TFI plays multiple roles in neural development and disease. Brain Res. 2019;1705:75–94. doi: 10.1016/j.brainres.2018.04.024. [DOI] [PubMed] [Google Scholar]
- 56.Qiu Y, et al. Null mutation of mCOUP-TFI results in defects in morphogenesis of the glossopharyngeal ganglion, axonal projection, and arborization. Genes Dev. 1997;11:1925–1937. doi: 10.1101/gad.11.15.1925. [DOI] [PMC free article] [PubMed] [Google Scholar]
- 57.Berenguer M, Meyer KF, Yin J, Duester G. Discovery of genes required for body axis and limb formation by global identification of retinoic acid-regulated epigenetic marks. PLoS Biol. 2020;18:e3000719. doi: 10.1371/journal.pbio.3000719. [DOI] [PMC free article] [PubMed] [Google Scholar]
- 58.Prescott SL, et al. Enhancer divergence and cis-regulatory evolution in the human and chimp neural crest. Cell. 2015;163:68–83. doi: 10.1016/j.cell.2015.08.036. [DOI] [PMC free article] [PubMed] [Google Scholar]
- 59.Rada-Iglesias A, et al. Epigenomic annotation of enhancers predicts transcriptional regulators of human neural crest. Cell Stem Cell. 2012;11:633–648. doi: 10.1016/j.stem.2012.07.006. [DOI] [PMC free article] [PubMed] [Google Scholar]
- 60.Lewcock JW, Genoud N, Lettieri K, Pfaff SL. The ubiquitin ligase Phr1 regulates axon outgrowth through modulation of microtubule dynamics. Neuron. 2007;56:604–620. doi: 10.1016/j.neuron.2007.09.009. [DOI] [PubMed] [Google Scholar]
- 61.Bartosovic M, Kabbe M, Castelo-Branco G. Single-cell CUT&Tag profiles histone modifications and transcription factors in complex tissues. Nat. Biotechnol. 2021;39:825–835. doi: 10.1038/s41587-021-00869-9. [DOI] [PMC free article] [PubMed] [Google Scholar]
- 62.Collins RL, et al. A cross-disorder dosage sensitivity map of the human genome. Cell. 2022;185:3041–3055.e25. doi: 10.1016/j.cell.2022.06.036. [DOI] [PMC free article] [PubMed] [Google Scholar]
- 63.Johnson KD, et al. Cis-element mutated in GATA2-dependent immunodeficiency governs hematopoiesis and vascular integrity. J. Clin. Invest. 2012;122:3692–3704. doi: 10.1172/JCI61623. [DOI] [PMC free article] [PubMed] [Google Scholar]
- 64.Soukup AA, et al. Single-nucleotide human disease mutation inactivates a blood-regenerative GATA2 enhancer. J. Clin. Invest. 2019;129:1180–1192. doi: 10.1172/JCI122694. [DOI] [PMC free article] [PubMed] [Google Scholar]
- 65.Bosch DGM, et al. NR2F1 mutations cause optic atrophy with intellectual disability. Am. J. Hum. Genet. 2014;94:303–309. doi: 10.1016/j.ajhg.2014.01.002. [DOI] [PMC free article] [PubMed] [Google Scholar]
- 66.Kaiwar C, et al. Novel NR2F1 variants likely disrupt DNA binding: molecular modeling in two cases, review of published cases, genotype–phenotype correlation, and phenotypic expansion of the Bosch–Boonstra–Schaaf optic atrophy syndrome. Cold Spring Harb. Mol. Case Stud. 2017;3:a002162. doi: 10.1101/mcs.a002162. [DOI] [PMC free article] [PubMed] [Google Scholar]
- 67.Brown KK, et al. NR2F1 deletion in a patient with a de novo paracentric inversion, inv(5)(q15q33.2), and syndromic deafness. Am. J. Med. Genet. A. 2009;149A:931–938. doi: 10.1002/ajmg.a.32764. [DOI] [PMC free article] [PubMed] [Google Scholar]
- 68.Ashraf UM, Sanchez ER, Kumarasamy S. COUP-TFII revisited: its role in metabolic gene regulation. Steroids. 2019;141:63–69. doi: 10.1016/j.steroids.2018.11.013. [DOI] [PMC free article] [PubMed] [Google Scholar]
- 69.Polvani S, Pepe S, Milani S, Galli A. COUP-TFII in health and disease. Cells. 2019;9:101. doi: 10.3390/cells9010101. [DOI] [PMC free article] [PubMed] [Google Scholar]
- 70.Al Turki S, et al. Rare variants in NR2F2 cause congenital heart defects in humans. Am. J. Hum. Genet. 2014;94:574–585. doi: 10.1016/j.ajhg.2014.03.007. [DOI] [PMC free article] [PubMed] [Google Scholar]
- 71.Cheng Y, et al. Principles of regulatory information conservation between mouse and human. Nature. 2014;515:371–375. doi: 10.1038/nature13985. [DOI] [PMC free article] [PubMed] [Google Scholar]
- 72.Huggins GS, Bacani CJ, Boltax J, Aikawa R, Leiden JM. Friend of GATA 2 physically interacts with chicken ovalbumin upstream promoter-TF2 (COUP-TF2) and COUP-TF3 and represses COUP-TF2-dependent activation of the atrial natriuretic factor promoter. J. Biol. Chem. 2001;276:28029–28036. doi: 10.1074/jbc.M103577200. [DOI] [PubMed] [Google Scholar]
- 73.Deplancke B, Alpern D, Gardeux V. The genetics of transcription factor DNA binding variation. Cell. 2016;166:538–554. doi: 10.1016/j.cell.2016.07.012. [DOI] [PubMed] [Google Scholar]
- 74.Rosin JM, Kurrasch DM, Cobb J. Shox2 is required for the proper development of the facial motor nucleus and the establishment of the facial nerves. BMC Neurosci. 2015;16:39. doi: 10.1186/s12868-015-0176-0. [DOI] [PMC free article] [PubMed] [Google Scholar]
- 75.Garel S, Garcia-Dominguez M, Charnay P. Control of the migratory pathway of facial branchiomotor neurones. Development. 2000;127:5297–5307. doi: 10.1242/dev.127.24.5297. [DOI] [PubMed] [Google Scholar]
- 76.Bahlo M, Bromhead CJ. Generating linkage mapping files from Affymetrix SNP chip data. Bioinformatics. 2009;25:1961–1962. doi: 10.1093/bioinformatics/btp313. [DOI] [PubMed] [Google Scholar]
- 77.Abecasis GR, Cherny SS, Cookson WO, Cardon LR. Merlin–rapid analysis of dense genetic maps using sparse gene flow trees. Nat. Genet. 2002;30:97–101. doi: 10.1038/ng786. [DOI] [PubMed] [Google Scholar]
- 78.Wang K, et al. PennCNV: an integrated hidden Markov model designed for high-resolution copy number variation detection in whole-genome SNP genotyping data. Genome Res. 2007;17:1665–1674. doi: 10.1101/gr.6861907. [DOI] [PMC free article] [PubMed] [Google Scholar]
- 79.Colella S, et al. QuantiSNP: an Objective Bayes Hidden-Markov Model to detect and accurately map copy number variation using SNP genotyping data. Nucleic Acids Res. 2007;35:2013–2025. doi: 10.1093/nar/gkm076. [DOI] [PMC free article] [PubMed] [Google Scholar]
- 80.Osterwalder M, et al. Characterization of mammalian in vivo enhancers using mouse transgenesis and CRISPR genome editing. Methods Mol. Biol. 2022;2403:147–186. doi: 10.1007/978-1-0716-1847-9_11. [DOI] [PubMed] [Google Scholar]
- 81.Fujiki R, Lee JY, Jurgens JA, Whitman MC, Engle EC. Isolation and culture of oculomotor, trochlear, and spinal motor neurons from prenatal Islmn:GFP transgenic mice. J. Vis. Exp. 2019 doi: 10.3791/60440. [DOI] [PMC free article] [PubMed] [Google Scholar]
- 82.Stuart T, Srivastava A, Madad S, Lareau CA, Satija R. Single-cell chromatin state analysis with Signac. Nat. Methods. 2021;18:1333–1341. doi: 10.1038/s41592-021-01282-5. [DOI] [PMC free article] [PubMed] [Google Scholar]
- 83.Hao Y, et al. Integrated analysis of multimodal single-cell data. Cell. 2021;184:3573–3587.e29. doi: 10.1016/j.cell.2021.04.048. [DOI] [PMC free article] [PubMed] [Google Scholar]
- 84.Le T, et al. BBrowser: making single-cell data easily accessible. bioRxiv. 2020 doi: 10.1101/2020.12.11.414136. [DOI] [Google Scholar]
- 85.Garcès A, et al. GFRalpha 1 is required for development of distinct subpopulations of motoneuron. J. Neurosci. 2000;20:4992–5000. doi: 10.1523/JNEUROSCI.20-13-04992.2000. [DOI] [PMC free article] [PubMed] [Google Scholar]
- 86.Schaeren-Wiemers N, Gerfin-Moser A. A single protocol to detect transcripts of various types and expression levels in neural tissue and cultured cells: in situ hybridization using digoxigenin-labelled cRNA probes. Histochemistry. 1993;100:431–440. doi: 10.1007/BF00267823. [DOI] [PubMed] [Google Scholar]
- 87.Parker SCJ, et al. Chromatin stretch enhancer states drive cell-specific gene regulation and harbor human disease risk variants. Proc. Natl Acad. Sci. USA. 2013;110:17921–17926. doi: 10.1073/pnas.1317023110. [DOI] [PMC free article] [PubMed] [Google Scholar]
- 88.Nishizawa S, et al. HSP DNAJB8 controls tumor-initiating ability in renal cancer stem-like cells. Cancer Res. 2012;72:2844–2854. doi: 10.1158/0008-5472.CAN-11-3062. [DOI] [PubMed] [Google Scholar]
Associated Data
This section collects any data citations, data availability statements, or supplementary materials included in this article.
Supplementary Materials
Supplementary Clinical note, Tables 1–4, Methods and References.
Whisking videos of WT (a), Gata2cKO (b), Gata3cKO (c), cRE2 Fam5SNV (d), cRE1dup (e), cRE1dup partial rescue 1 (f), cRE1dup partial rescue 2 (g) and cRE1dup full rescue (h).
Data Availability Statement
Publicly available ChIP-seq datasets used in the present study: accession nos. GSM1817193 and GSM714811 for NR2F1; GSM714812 for NR2F2; GSM935589 for GATA2; and GSM1010738 and GSM1602667 for GATA3. Conserved TF-binding sites were obtained using rVista 2.0 (https://rvista.dcode.org). Additional epigenetic data were explored using the ENCODE database (https://www.encodeproject.org). GRCh37/hg19 human reference genome under Sequence Read Archive (SRA) accession no. PRJNA31257 and GRCm38/mm10 mouse reference genome under SRA accession no. PRJNA20689 were used for the alignment of human and mouse sequencing data, respectively. GnomAD and 1,000 genome frequencies were extracted from https://gnomad.broadinstitute.org and https://www.internationalgenome.org, respectively. Common structural variant data were obtained from the DGV (http://dgv.tcag.ca/dgv/app/home) and GoNL SV database (https://www.nlgenome.nl/login). Exome sequence and SNP data from a subset of participants are available through dbGaP Phs001383.v1.p1. WGS data from Cohort 1 participants are available through dbGaP Phs001247.v1.p1; Radboudumc consent does not allow for broad sharing via repositories and, thus, Cohort 2 WGS data are available on request and after a positive evaluation by a local data access committee confirming that the proposed re-use is in line with original consent obtained. ScRNA-seq and CUT&Tag sequencing data are available through the National Center for Biotechnology Information Gene Expression Omnibus SuperSeries accession no. GSE223274. LacZ images are uploaded to the Vista enhancer browser (https://enhancer.lbl.gov) and can be retrieved by their human coordinates as follows: hs2664 (cRE1) chr3:128,175,331–128,177,163; hs2665 (cRE2) chr3:128,177,164–128,179,169; hs2666 (cRE3) chr3:128,186,421–128,188,215; hs2667 (cRE1 + cRE2) chr3:128,175,331–128,179,169; and hs2668 (cRE2 + cRE3) chr3:128,177,164–128,188,215. Mice are available on request. Source data are provided with this paper.
The codes used for scRNA-seq and single-cell CUT&Tag data processing and analyses are available at https://zenodo.org/badge/latestdoi/637923997.


