

Abstract
The levels, profiles of Phthalate acid esters (PAEs) and their associated health risk in children and adults using indoor dust samples were assessed from nine (9) microenvironments in Nigeria. Six PAEs congeners were determined using Gas Chromatography–Mass Spectrometry and the human health risk assessments of PAEs exposure to children and adults were computed using the United States Environmental Protection Agency (USEPA) exposure model. The mean concentrations of the total PAEs (Σ6PAEs) in indoor dust across the study locations ranged from 1.61 ± 0.12 to 53.3 ± 5.27 μg/g with 72.0% of di-n-octyl phthalate (DnOP) as the most predominant contributor of PAEs in sample locations B, C, D, E, F and G. PAEs estimated daily intake results exceeded the USEPA value of 20 and 50 kg/bw/day for children and adults respectively in some locations. Non-carcinogenic risk exposure indicated no risk (HI < 1), while the carcinogenic risk was within the recommended threshold of 1.00 × 10⁻⁴ to 1.00 × 10⁻⁶ for benzyl butyl phthalate and bis-2-ethylhexyl phthalate. From our findings, lower levels of PAEs were observed in locations with good ventilation system. Also, the human health risk evaluation indicated indoor dust ingestion as the dominant exposure route of PAEs for both children and adults, while the children were at a higher risk of PAEs exposure. To protect children susceptible to these endocrine-disrupting pollutants, soft vinyl children’s toys and teething rings should be avoided. Appropriate policies and procedures on the reduction of PAEs exposure to humans should be enacted by all stakeholders, including government regulatory agencies, industries, school administrators and the entire community.
Subject terms: Environmental chemistry, Environmental sciences
Introduction
There is a growing concern about environmental chemical exposure and its adverse effects on human physiology across the globe1,2. The indoor environment is becoming a major concern because people spend about 90% of their time indoors3,4. This environmental risk factor is critical to the susceptible populace, such as infants and children1,5–7. The outcome of this environmental risk factor is pronounced more during their sensitive periods of growth8,9. This is because their dose intake is higher compared to adults due to their increased breathing rate per unit of body weight10–13. Also, children growing immunological and physiological functions make them more vulnerable to these chemical toxins3,10,14. Moreover, ambient air affects indoor air quality, and it has been scientifically validated that pollutants concentration is more in indoor air than in an outdoor environment7,15. This is due to several indoor sources, behavioural patterns, cleaning habits and building characteristics16,17. Consequently, the United Nations Sustainable Development Goal (SDG) 3.9 continues to address this issue as it seeks to minimize the number of illnesses and deaths resulting from toxic chemicals in the environment.
Phthalate acid esters (PAEs) are a group of chemicals with a basic structure characterized by phthalic acid with alkyl groups’ alcohol through an ester bond. PAEs are one of the major emerging pollutants of critical concern18,19. They are also endocrine-disrupting chemicals (EDCs). EDCs are chemical compounds that interfere with the endocrine system in humans and trigger cancerous cells, birth defects, and developmental disorders19,20. Although regulatory limits for a few chemical pollutants have been established due to the harm they cause to the human body, endocrine-disrupting chemicals such as PAEs are still widely used in a diversity of consumer and household items21. PAEs are also known as semi-volatile organic compounds (SVOCs). SVOCs have been found in indoor environments, and they have been proven to be about two to five times more prevalent than those present in outdoor environments22,23. PAEs are known to be ubiquitous in indoor environments due to their primary use as plasticizers and solvent carriers in diverse industrial applications2,3,19,24.
Dust ingestion is children’s most common exposure route to this indoor chemical pollutants3. This is because of their frequent hand-to-mouth activities25. Previous reports have revealed that indoor dust on the impervious external layer serves as a reservoir for organic pollutants26,27. Therefore, it can be inferred that indoor dust is a major source of indoor environmental pollutants such as PAEs28. It is also an important entry point for many chemical contaminants in young children29. The existence and fate of PAEs in an indoor environment are attributed to leachability, indoor air volume, rate of air exchange between the indoor and outdoor environments, humidity, building features and indoor temperature11,30. The study of PAEs in indoor dust commenced in 1997. PAEs have been accessed globally in different microenvironments such as daycare centres, preschool centres and elementary schools, workplaces, dormitories and homes11,12,16,17,21,28,31. Table 1 briefly describes the six predominant PAEs congeners (Di-2-ethylhexyl phthalate (DEHP), Di-n-butyl phthalate (DBP), Di-n-octyl phthalate (DnOP), Butyl benzyl phthalate (BBP), Di-ethyl phthalate (DEP), and Di-methyl phthalate (DMP)), their uses, and product derivatives.
Table 1.
Description of predominant PAEs.
| Phthalate compound | Molecular weight (g/mol) | Use | Product |
|---|---|---|---|
| DEHP | 390.56 | Plasticizer for PVCs | Baby dolls, shoes, raincoats, clothing, medical devices, furniture, automobile upholstery, and floor tiles |
| DBP | 278.35 | Plasticizer for PVC, PVA, and rubber. Manufacture of solvent and preservatives in paint and cosmetic materials | Latex adhesives, sealants, car care accessories, cosmetic products, ink and dye materials, insecticides, herbicides and pesticides, food wrapping materials, furniture and upholstery, and pharmaceutical accessories |
| DNOP | 390.56 | Plasticizer for PVCs | Floorings, tarpaulins, pool liners, holes, and pipes |
| BBP | 312.37 | PVCs Plasticizer, polyurethane, polysulfide, and acrylic-based polymers | Poly-vinyl carpets, silicone sealants and adhesives, car care accessories, food wrapping material, and artificial leather materials |
| DEP | 222.24 | Cosmetics and perfumes | Skin-care products and fragrances |
| DMP | 194.19 | Cosmetics and fragrance | Skin-care products and fragrances |
Many investigations have ascertained the relationship between PAEs exposure and their associated human health risk predominantly in their reproductive and growth pattern33,34. Exposure to PAEs in children may lead to a high risk of atopic disorder35. They may also cause reproductive health problems, particularly in males36,37. They can also lead to premature development of the breast and loss of pregnancy in females11,38. Also, a significant relationship has been reported to exist between asthma and allergic signs due to PAEs exposure in preschool children25,38–40. There are also reported cases of obesity due to PAEs exposure33,41. Reports from Denmark42, Sweden42,43, Germany44, USA and China2,3,39,45–47 reveal that the sampled locations were contaminated with PAEs. Also, many epidemiological studies have shown that PAEs exposure to indoor dust has been linked to diverse reproductive effects, acute neurological disorders, inflammations and allergies36,37,48. Several studies on PAEs have been conducted in Nigeria, using water, food materials, PET bottles, breast milk and urine samples except for dust as environmental monitoring tools49–54. Hence, studying PAEs levels and the degree of exposure via the three predominant routes of indoor dust in different microenvironments is important. Therefore, the present study aimed to (1) determine the levels and profile of PAEs in indoor dust from nine (9) different microenvironments in Ikeja and Ota, Nigeria; and (2) assess the predominant route of PAEs exposure and evaluate the human health risk assessment for children and adults. To the best of our knowledge, this is the first study to report the levels and human health risk evaluation of PAEs in indoor dust from daycare centres in Nigeria and in Africa.
Materials and methods
Chemicals and solvents
PAEs mix standard inclusive of butyl benzoyl phthalate (BBP), di ethyl phthalate (DEP), di methyl phthalate (DMP), di butyl phthalate (DBP), di-n-octyly phthalate (DnOP), and bis-2-ethylhexyl phthalate (DEHP) along with benzyl benzoate (BB) internal standard was purchased from AccuStandard, USA, Inc. Analytical grade n-hexane was purchased from Merck, Germany while analytical grade acetone and methanol were purchased from Fisher Scientific, United Kingdom.
Description of the study area
Indoor dust samples were collected from nine microenvironments in the Nigerian cities of Ikeja and Ota, as depicted in Fig. 1 and Table S1. Ikeja is the capital and commercial heart of Nigeria, while Ota is known for major industrial activities, as many manufacturing industries in Nigeria have their factories there. Ikeja and Ota are located at 6° 31′ 46″ N; 3° 21′ 48″ E 78.2 km and 6° 39′ 27″ N; 3° 11′ 18″ E 78.2 km, respectively. The different microenvironments were assigned sample location codes A to I. Location A–F (preschools), G (hospital: pediatric section), H (hostel) and I (chapel). The locations were sampled for two months (December 2021–January 2022).
Figure 1.

Map of the study areas. The map was generated from geospatial analysis of ArcGIS desktop software (version 10.3).
Sample collection and preparation
Indoor dust particles were sucked from the sample locations using Tesco vacuum cleaner VCBL17. The vacuum brush was washed with methanol before and after each sampling to avoid cross-contamination of the samples2–4. Nine different indoor microenvironments were sampled twice during the dry season (December 2021–January 2022). In each of the locations, dust samples were collected every two hours throughout the day from different sections and a composite sample for each location was used for the analysis. A total of nine indoor dust samples and six control samples were collected. After sampling, the dust particles were transferred to aluminium foil and sealed in a ziploc bag, then transferred to the laboratory12. To remove unwanted substances and homogenize the sample, the collected dust samples were sieved with individual < 150 µm mesh and wrapped in aluminium foil, then stored in an airtight ziploc bag in the freezer at − 20 °C prior to further analysis2–4,12.
Sample extraction and clean up
Dust sample (100 mg) were measured with an analytical weighing balance and quantitatively transferred to a 10 mL glass tube. Exactly 3 mL of the extraction solvent (hexane and acetone) in the ratio of 1:1 was introduced into the glass and placed on the vortex mixer for 20 min at 1500 rotation per minute (rpm) to re-suspend and agitate the mixture. Afterwards, the agitated mixture was centrifuged for 20 min at 1500 rpm. This cycle was repeated two more times for better extraction efficiency, and the pool of extract was concentrated to 1 mL with the aid of a rotary evaporator and reconstituted with 2 mL of methanol5,12. After re-solubilisation, clean—up of samples was performed on a 30 mL glass chromatographic column packed with 10 g of activated silica gel (60–200 mesh size), and 1 g of activated anhydrous sodium sulphate (Na2SO4) was introduced into the packed column for absorption of moisture. The packed column was pre-eluted with n-hexane at a 2 mL/min flow rate. The extract was carefully transferred into the column, and 2 mL of n-hexane was used to thoroughly rinse and transfer the extract down the column. The column was eluted with 15 mL of n-hexane, allowing the non-polar fraction of the extract in the column to be collected and discarded. After that, 20 mL of acetone was added to the column to elute the targeted analyte. The eluent was collected and transferred to a 100 mL round bottom flask and pre-concentrated to 1 mL with a rotary evaporator. The concentrated extract was rinsed with 2 mL of methanol before being transferred to an aluminium-wrapped GC glass vial for instrumental analysis. This sample preparation and extraction methods are consistent with the USEPA 8061A method for PAEs analysis.
Instrumental analysis of PAEs using GC–MS
The extracts were analyzed with the use of Agilent J&W Gas chromatography–mass spectrometry coupled to an electron ionization (EI) source. Agilent J&W HP 5 Capillary column having a 30 m × 0.25 mm dimension of silica and a 0.25 μm thickness was used for the isolation. The single ion monitoring mode was used to quantify each target compound. The carrier gas, 99.9% pure ultra-high helium gas, was kept at a flow rate of 1.2 mL/min. The column temperature program began at 100 °C, was held for 1 min, and then ramped to 280 °C at a rate of 20 °C per minute for 7 min. The solvent delay lasted for 3 min. The temperatures of the ion source, injection port, quadruple, and transmission line were kept at 230 °C and 250 °C, respectively. An injection volume of 1 µL and an analysis time of 17 min was used for the six PAEs compounds12,16,55.
Human health risk assessments estimation
PAEs have been linked to serious health consequences in humans56. PAEs non-carcinogenic and carcinogenic human risk assessment for both children and adults in this study were evaluated by the USEPA 2011 model with a minor modification57. Based on the single PAEs congeners, DMP, DEP, DBP, and DnOP have been identified as non-carcinogenic, while BBP and DEHP are known to be carcinogenic3. To calculate the estimated daily intake (EDI) of PAEs through dust ingestion, Eq. (1) was used. The formulae outlined in Eqs. (2) to (4) were used to examine the average daily dose (ADD mg/kg/d) for children and adults through the different phthalate exposure pathways, namely; ingestion, dermal and inhalation17,29,56,58. These formulae have been extensively used in previous studies2,3,17,59,60.
| 1 |
Cdust = concentration of PAEs compound in dust particles (µg/g); f = ingestion rate of dust (g /day); m = body mass (kg)
| 2 |
| 3 |
| 4 |
IRinhalation = dust inhalation; SA = area of dermal exposure; ABF = fraction of dermal absorption; AF = dust dermal adherence factor; BW = body mass index expressed in kilogram; AT = average time (d); AT = ED × 365 (non-cancer risk); AT = LT 365 (cancer risk); ED = exposure period (y); EF = exposure frequency (d/y); CF = conversion factor (1.0 10–6 kg/mg); PEF = particle emission factor (1.36 10−9 m3/kg); The hazard quotient (HQ) and hazard index (HI) was used to calculate the non-carcinogenic risk of indoor dust PAEs exposure as shown in Eqs. (5) and (6);
| 5 |
| 6 |
where RfD is the independent phthalate compound reference dose value (mg/kg/d). The reference dose is defined as the maximum daily risk that can be imposed on the exposed population60. It is used as an indicator or measure to indicate the possibility of a serious health effect over the course of a person’s life. While HQ signifies the health risk of each PAE to humans through the diverse exposure routes, and i signifies the various exposure routes (dermal absorption, ingestion and inhalation). HI value greater than 1 indicates that adults and children exposure to PAEs might result in a non-cancer risk. DMP, DEP, DBP, and DnOP are non-carcinogenic, whereas DEHP and BBP are carcinogenic to humans. The carcinogenic route was evaluated using the lifetime average daily exposure doses (mg/kg/d) shown in Eqs. (7) and (9)
| 7 |
| 8 |
| 9 |
The carcinogenic risk (CR) was analyzed using Eq. (10)
| 10 |
CSF stands for cancer slope factor, inclusive of CSForal, CSFingestion, CSFinhalation, and CSFdermal. It is a measure of the likelihood or possibility of an individual being infected by cancer due to oral intake of the chemical61. To calculate the possibility of cancer risk via inhalation and dermal absorption exposure pathway, it was estimated that CSFinhalation and CSFdermal are equal to CSForal10. The evaluated values from cancer risk calculation are considered negligible if CR is below 10–6. The permissible limit is 10–6 to 10–4, while values higher than 10–4 are considered a threat to health3,17. Table 2 shows the parameters used to calculate the human risk assessment.
Table 2.
Human health risk assessment and exposure parameters.
| Parameters | Unit | Child | Adult |
|---|---|---|---|
| Concentration (C) | µg/g | – | – |
| IRingestion | mg/d | 200 | 100 |
| IRinhalation | m3/d | 5 | 20 |
| EF | d/y | 330 | 304 |
| ED | Y | 6 | 24 |
| CF | kg/mg | 1.0 × 10⁻⁶ | 1.0 × 10⁻⁶ |
| BW | Kg | 15 | 60 |
| AT | Days | 365 × ED | 365 × ED |
| AT (for non-cancer risk) | D | ED × 365 | – |
| AT (for carcinogenic risk) | D | LT × 365 | – |
| SA | cm2 | 1700 | 4000 |
| AF | mg/cm2/d | 0.2 | 0.07 |
| ABS | – | 0.001 | 0.001 |
| PEF | m3/kg | 1.36 × 10⁻⁹ | 1.36 × 10⁻⁹ |
| CFSoral | kg/d/mg | BBP | 0.0019 |
| DEHP | 0.014 | ||
| RfD | mg/kg/d | DMP | 10 |
| DEP | 0.8 | ||
| DBP | 0.1 | ||
| BBP | 0.2 | ||
| DEHP | 0.02 | ||
| DnOP | 0.4 | ||
| LT | Y | 54.44 | 54.20 |
Quality assurance/quality control
The suitability of the analytical and instrumental processes were ensured by avoiding all forms of plastics throughout the laboratory procedures. The glassware used for the work was thoroughly oven-baked for 6 h at 120 °C in line with the USEPA 8061A method for the treatment of glassware and rinsed with acetone and hexane thereafter. The instrumental system was calibrated by preparing an equal volume of the external and internal standards in 5 mL methanol. A five-point calibration curve was plotted between the areas of peak and calibration concentrations resulting in an overall linearity range of 0.996–1 for the six PAEs compounds. To test the suitability of each of the analytical procedures, blank samples were prepared, namely, field blank, sieve blank, method blank, and reagent blank. The six phthalate compounds for the study were found in the blank samples and deducted from the sample concentrations to obtain the exact value of PAEs in the sample set. The method precision from the duplicate blank was 11.14%. This value is within the expected range of < 20% and is consistent with other reported works on PAEs in indoor dust particles such as2,12,59,62. The recovery study was done to ascertain the extraction efficiency, and the value ranged from 70.9 to 72.6%. This range is in agreement with the expected range of 70–120% for PAEs recovery study in indoor dust particles12,29. The computation of the limit of detection (LOD) and limit of quantification (LOQ) was done using a signal-to-noise ratio of 3:1 and 10:1, respectively. The LODs and LOQ of PAEs ranged from 0.005 (DEP) to 0.025 (DBP) and 0.016 (DEP) to 0.083 (DnOP), respectively, as shown in Table S2.
Statistical analysis
Descriptive statistics were done using Microsoft Excel 2013 and Origin Pro 8.5. The Shapiro–Wilk test was applied to check the normality of the data. The data were not normally distributed as such, the non-parametric Kruskal–Wallis test was used to compare PAEs concentration differences between the various microenvironments. A p-value < 0.05 was considered significant.
Results and discussion
Concentrations of PAEs in indoor dust
The concentrations and detection frequency of PAEs from the sampled sites (Ikeja and Ota) are shown in Figure S1. There was a 100% detection frequency for the six PAEs compounds. The concentrations of total PAEs compound in each location are shown in Fig. 2 and Table S3. DnOP was the most abundantly detected compound in all nine samples, followed by DMP and DBP. The mean concentrations of the six PAEs compound in indoor dust ranged from 1.61 ± 0.12 to 53.3 ± 5.27 μg/g across the different microenvironments. There were variations in the concentration of PAEs in indoor dust across the sampled locations. An overview of the study locations' indoor characteristics and materials is shown in Table S1. Materials found in indoor environments like medical devices in the children’s ward in a hospital, floor tiles, wall covering decorative items, chairs, tables, children’s play toys and articles in preschool centres, television sets, adhesives, wires and cables have DnOP as the major plasticizers used in their production, which led to DnOP being the dominant pollutants found in seven out of the nine sampled locations. The highest level of Σ6PAEs was found in indoor dust from location G representing a paediatrics’ ward in the hospital, with a mean value of 53.3 ± 5.27 μg/g, followed by two preschool centres in locations B and F with mean concentrations of 33.6 ± 3.10 and 15.3 ± 0.62 μg/g. The high level of PAEs in these locations is attributed to inadequate ventilation as a result of little or no exposure to sunlight because the window blinds were permanently closed, thereby preventing the free flow of air and the penetration of sunlight63,64. Also, Liao et al.65 findings observed reduced levels of indoor PAEs, using mechanical ventilation and air cleaner than with only natural ventilation. Hence, they recommended the use of mechanical ventilation or natural ventilation along with air cleaners to reduce the concentration of PAEs indoors.
Figure 2.

Concentration of total PAEs compound in each location.
The lowest Σ6PAEs concentrations were from locations A (2.34 ± 1.86 μg/g) and C (1.61 ± 0.12 μg/g) day-care centres in Ikeja, Lagos, Nigeria. Both locations were observed as the most ventilated and spacious locations among all the microenvironments. Furthermore, levels of total PAEs reported in this work were lower than those reported in other regions, such as Greece 797 μg/g66, China 592 μg/g12, Saudi Arabia 663 μg/g10, and USA 214 μg/g55. The gas/particle partitioning of PAEs is integral to their indoor fate and health risks. However, the effects of indoor environmental parameters such as temperature, humidity and the partitioning of PAEs between air and particles is rarely known64,67. In addition, it is worth stating that the particle-air partition coefficient and vapour pressure properties affect the existence of PAEs congeners in both phases of individual PAEs. The equilibrium typically favours the gas phase for PAEs with higher vapour pressure and a lower particle air coefficient, while the particle phase is in parity with PAEs with lower vapour pressure and a higher particle air coefficient29,55. The high concentration of DEP and DBP in the hostel and chapel indoor dust might be connected to their solvent-carrying properties in the production of several household and skin care materials such as body lotion and deodorants, insecticides and pesticides, plastics and sealants during production in spite of the high volatility of DEP and their reported existence predominantly in the gas phase than dust phase12. The location with the highest concentration of DEHP was found in a preschool centre with PVC flooring. This result is in conformity with studies carried out by12,29,68,69. As they all found a significant correlation between PVC flooring and the concentration of DEHP in indoor dust. The variation in the mode of sampling, extraction and clean-up procedures, climatic factors, the lifestyle of the occupants, indoor maintenance, flooring type, building characteristics, and decorative wall items are all factors contributing to the levels of PAEs in indoor dust11,29,68–70. Apart from different analytical procedures, the lack of inter-laboratory comparisons of PAEs results in dust and the inability to analyze with standard reference material makes the comparison of results difficult. Consequently, a high variation was observed between concentrations determined in different study locations and similar neighborhoods in the same country.
One-way ANOVA of the parametric method could not be used since the data were not normally distributed58,71,72. Hence, the Kruskal–Wallis test of the non-parametric method was used to compare PAEs concentration differences between the various microenvironments. The result presented in Table 3 showed that there was a statistically significant difference between PAEs compounds and microenvironments since the p-value (0.001) < 0.05 level of significance. Kruskal–Wallis’ mean rank for each of the PAEs compounds is presented in Table 4.
Table 3.
Kruskal–Wallis test.
| Test statisticsa,b | |
|---|---|
| PAEs Scores | |
| Kruskal–Wallis H | 22.842 |
| df | 5 |
| Asymp. Sig. | 0.001 |
aKruskal Wallis test.
bGrouping variable: PAEs compound.
Table 4.
Kruskal–Wallis mean ranks for each of the PAEs compound.
| PAEs compounds | N | Mean rank | |
|---|---|---|---|
| PAEs Scores | DMP | 9 | 19.11 |
| DEP | 9 | 26.44 | |
| DBP | 9 | 36.56 | |
| BBP | 9 | 21.11 | |
| DnOP | 9 | 45.22 | |
| DEHP | 9 | 16.56 | |
| Total | 54 |
The Σ6PAEs concentrations in indoor dust from selected reports are presented in Table 5. Globally, PAEs are among the identified indoor chemical pollutants that thrive in children learning environments69. DEHP, DBP, DEP, and DMP were the most commonly reported across regions of the world, with DEHP being the highest PAEs compound detected across different countries studied. The trend of reported results in decreasing order include: South Korea > China > Denmark > Sweden > USA > Saudi Arabia > Nigeria. This study reported a different trend of result because DnOP was the most predominantly detected PAEs compound and there are a few other reported studies with similar trends of result16,42. As indicated in Table 5, the highest DEHP concentration of 3030 ug/g reported in South Korea far outweighs the 0.018–1.41 ug/g concentration obtained in this study. Since this is the first study of PAEs in indoor dust on the shores of Africa, there was no basis for comparison within the continent.
Table 5.
Concentrations (μg/g) of six PAEs in indoor dust from selected reports.
| Country | Sample size | Environment | DMP | DEP | DBP | BBP | DEHP | DnOP | References |
|---|---|---|---|---|---|---|---|---|---|
| Nigeria | 9 | Daycare centres, hospital, hostel and chapel | 0.074–0.400 | 0.023–8.86 | 0.12–5.06 | 0.068–0.620 | 0.018–1.410 | 0.363–46.09 | This study |
| Denmark | 500 | Children homes | NS | 1.7 | 15 | 3.7 | 210 | NS | 41 |
| 151 | Daycare centres | NS | 2.2 | 38 | 17 | 500 | NS | ||
| South Korea | 82 | Daycare centres | NS | 375 (66–556) | 107 (29–908) | 336(< LOD-1369) | 358 (222–673) | NS | 73 |
| 79 | Kindergartens | NS | 52.8 (< LOD-170 | 117 (31–719) | 333(< LOD-1422) | 375 (66–556) | NS | ||
| South Korea | 50 | Nursery schools | 2.1 | – | 52.0 | 50.4 | 3030 | – | 69 |
| China | 14 | Offices | – | NS | 135 | NS | 581.5 | – | 45 |
| USA (geometric mean) | 39 | Early child education centres | NS | 1.7 | 18.2 | 68.8 | 179.5 | NS | 74 |
| Sweden | 100 | Preschools | 0.1 | 0.46 | 6.4 | 8.7 | 290 | NS | 75 |
| China | 5 | Kindergartens | NS | ND | 31.2 | NS | 202 | ND | 3 |
| 10 | Offices | NS | ND | 145 | NS | 1310 | ND | ||
| Saudi Arabia (median–min–max) | 10 | Offices | ND | 28 (25–45) | 175 (100–260) | ND | 110 (90–125) | NS | 59 |
NS, not studied; ND, not detected.
Indoor dust composition profiles of Phthalate acid esters from different microenvironments
The composition profile of PAEs from indoor dust across sample locations A to I are shown in Fig. 3. The first three most abundant PAEs congeners of the Σ6PAEs, in indoor dust with associated proportions and concentrations respectively are as follows: Location A: DEP (1.04%, 1.43 ug/g), DnOP (15.3%, 0.36 ug/g), and DMP (13.4%, 0.31 ug/g); Location B: DnOP (97.2%, 32.7 ug/g), DMP (1.07%, 0.33 ug/g) and BBP: 0.84%, (0.29 ug/g); Location C: DnOP (53.1%, 0.86 ug/g), DBP(21.5%, 0.34 ug/g) and BBP (12.8%, 0.20 ug/g); Location D: DnOP (49.5%, 3.57 ug/g), DBP(35.7%, 2.64 ug/g) and BBP (4.76%, 0.34 ug/g); Location E: DnOP (47.6%, 1.53 ug/g), BBP(19.3%, 0.62 ug/g) and DBP (14.4%, 0.46 ug/g); Location F: DnOP (76.7%, 11.76 ug/g), DBP(11.3%, 1.74 ug/g) and DEHP (9.2%, 1.41 ug/g); Location G: DnOP (86.5%, 46.1 ug/g), DBP(9.50%, 5.06 ug/g) and DEHP (2.63%, 1.40 ug/g); Location H: DEP (39.2%, 4.65 ug/g), DnOP (33.1%, 3.93 ug/g) and DBP (23.4%, 2.80 ug/g); Location I: DEP (65.4%, 8.86 ug/g), DBP (18.2%, 2.46 ug/g) and DnOP (13.4%, 1.82 ug/g). The composition profiles of PAEs from the nine sampled locations show similarities in the first three most abundant PAEs congeners between locations C and D (DnOP > DBP > BBP) and locations F and G (DnOP > DBP > DEHP), respectively. This similar trend of PAEs composition profile indicates a common source of those specific PAEs in the indoor microenvironment and agrees with previously reported studies2,55,73,74,76. Other sample locations indicated variable PAEs congeners’ trends in the composition profiles. This is a pointer to the variation in the sources in the different indoor microenvironments. This finding is similar to that of Liu et al77, who opined that the variation in indoor pollution sources for different indoor spaces makes the mass transfer of PAEs in such environment more complicated. Also, six (6) locations recorded DnOP as the most predominant contributor of PAEs, except for locations A, H and I, where DEP was the most abundant contributor (61.0, 39.2 and 65.4%, respectively). The highest contributions of DnOP and DEP could be linked with plasticizers and personal care products containing DnOP and DEP in the indoor environment10,67. In addition, the result of a chamber study on the migration of DnOP between source surfaces and settled dust by Li et al78 is a pointer to the fact that direct contact contributes significantly to the migration of DnOP from the sources to the dust.
Figure 3.
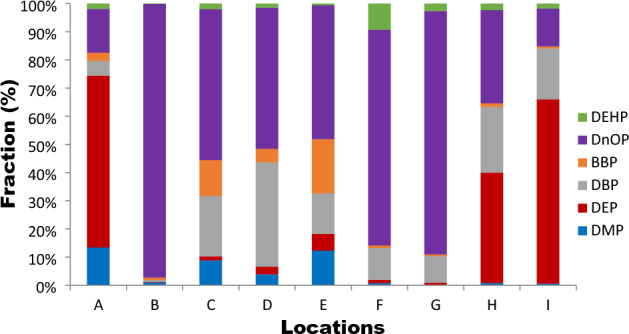
Composition profiles of PAEs in indoor dust.
Human health risk estimation
Tables 6 and 7 present the results of the human health risk assessments for this study. Table 6 reveals the estimated daily intake (EDI) of total PAEs in each microenvironment. Location G representing the children's ward in the hospital, had the highest concentration of EDI, 691 and 86.4 μg/g, respectively, for both children and adults. Exception of locations A and C, individual PAEs compounds recorded in other investigated locations (B, D, E, F, G, H, and I) were above the threshold of 20 kg /bw/day for children. Furthermore, the EDI for adults were above the stipulated limit of 50 kg /bw/day as estimated by USEPA in location B and G. This indicates that the daily exposure to PAEs compounds in these locations was very high, thus harmful to the occupants of the environment.
Table 6.
Human health risk exposure to PAEs in indoor dust in different microenvironments.
| Parameters | Human | A | B | C | D | E | F | G | H | I |
|---|---|---|---|---|---|---|---|---|---|---|
| DI | Children | 11.63 | 428.12 | 1.86 | 75.33 | 23.34 | 185.03 | 691.27 | 138.64 | 161.16 |
| Adult | 1.45 | 53.52 | 0.23 | 9.42 | 2.92 | 23.13 | 86.41 | 17.33 | 20.14 | |
| ADDing | Children | 1.05E−05 | 3.87E−04 | 1.67E−06 | 6.81E−05 | 2.11E−05 | 1.67E−04 | 6.24E−04 | 1.25E−04 | 1.45E−04 |
| Adult | 1.21E−06 | 4.45E−05 | 1.93E−07 | 7.84E−06 | 2.43E−06 | 1.93E−05 | 7.19E−05 | 1.44E−05 | 1.67E−05 | |
| ADDder | Children | 1.78E−08 | 6.58E−07 | 2.85E−09 | 1.16E−07 | 3.59E−08 | 2.84E−07 | 1.06E−06 | 2.13E−07 | 2.47E−07 |
| Adults | 3.39E−09 | 1.24E−07 | 5.41E−10 | 2.19E−08 | 6.80E−09 | 5.39E−08 | 2.01E−07 | 4.04E−08 | 4.70E−08 | |
| ADDinh | Children | 7.73E−09 | 2.84E−07 | 1.23E−09 | 5.01E−08 | 1.55E−08 | 1.23E−07 | 4.60E−07 | 9.22E−08 | 1.07E−07 |
| Adults | 8.91E−10 | 3.28E−08 | 1.42E−10 | 5.77E−09 | 1.79E−09 | 1.42E−08 | 5.29E−08 | 1.06E−08 | 1.23E−08 | |
| HI | Children | 2.56E−09 | 9.07E−04 | 3.85E−06 | 4.14E−04 | 6.49E−05 | 1.33E−03 | 2.79E−02 | 2.67E−03 | 1.89E−03 |
| Adults | 2.96E−07 | 4.20E−05 | 1.76E−06 | 4.80E−05 | 8.92E−06 | 1.54E−04 | 3.20E−04 | 3.08E−04 | 2.18E−04 |
Table 7.
Human health risk exposure.
| Non-carcinogenic intake | Carcinogenic intake | Total intake | ||||||
|---|---|---|---|---|---|---|---|---|
| Parameters | Human | DMP | DEP | DBP | DnOP | BBP | DEHP | Total |
| DI | Children | 13.16 | 190.41 | 180.11 | 1122.76 | 11.621 | 24.20 | 1542.26 |
| Adults | 1.31 | 23.69 | 22.41 | 156.38 | 1.971 | 5.30 | 211.06 | |
| ADDing | Children | 1.15E−05 | 1.72E−04 | 2.67E−04 | 5.61E−04 | 4.21E−05 | 6.14E−04 | 1.67E−03 |
| Adults | 1.17E−06 | 1.98E−05 | 3.09E−05 | 1.03E−04 | 4.94E−06 | 9.66E−06 | 1.69E−04 | |
| ADDder | Children | 2.02E−01 | 1.27E−01 | 2.77E−07 | 1.92E−06 | 6.45E−03 | 6.51E−08 | 3.35E-01 |
| Adults | 3.84E−09 | 5.55E−08 | 5.25E−08 | 3.65E−07 | 4.62E−09 | 4.98E−08 | 5.31E−07 | |
| ADDinh | Children | 8.75E-09 | 1.27E−07 | 1.20E−07 | 8.32E−07 | 1.05E−08 | 2.82E−08 | 1.13E−06 |
| Adults | 1.01E−09 | 4.16E−08 | 2.05E−08 | 9.90E−08 | 1.21E−09 | 3.81E−09 | 1.67E-07 | |
| HQing | Children | 1.15E−06 | 2.15E−04 | 2.67E−03 | 1.40E-03 | 2.10E−04 | 3.07E−02 | 3.52E−02 |
| Adults | 1.33E-07 | 2.05E−04 | 1.89E−03 | 6.09E−04 | 1.58E-04 | 3.26E−06 | 2.87E−03 | |
| HQder | Children | 2.02E-09 | 3.66E−07 | 2.77E−06 | 4.81E-06 | 1.22E−07 | 3.26E−06 | 1.13E-05 |
| Adults | 4.09E−10 | 3.50E−07 | 1.54E−07 | 1.54E−06 | 2.73E−08 | 2.09E-06 | 4.16E−06 | |
| HQinh | Children | 8.75E−10 | 1.58E−07 | 1.20E−06 | 2.08E-06 | 5.27E−08 | 1.41E−06 | 4.90E-06 |
| Adults | 1.01E−10 | 5.19E−08 | 2.05E−07 | 2.47E-07 | 6.08E−09 | 1.91E−07 | 7.01E-07 | |
| HI | Children | 1.15E−06 | 2.16E−04 | 2.67E−03 | 1.41E-03 | 2.11E−04 | 3.07E−02 | 3.52E−02 |
| Adults | 1.17E-07 | 2.49E−05 | 3.10E−04 | 2.58E−05 | 2.47E-05 | 4.84E−04 | 8.70E−04 | |
| LADD | Adults | – | – | – | – | 7.92E−08 | 1.27E−07 | 2.06E-07 |
| CR | Adults | – | – | – | – | 1.11E−09 | 2.42E−10 | 1.35E−09 |
The results of the average daily dose (ADDs) of six investigated PAEs via the three major exposure routes in indoor dust for children and adults are indicated in Table 7. PAEs total intake of ADDs (ADDing + ADDder + ADDinh) from indoor dust for children and adults was found to be 3.37 × 10⁻¹ and 1.70 × 10⁻⁴ mg/kg/d, respectively. This result implies that children are more susceptible to PAEs in indoor dust than adults. Children's ADDs from ingestion, dermal absorption, and inhalation of indoor dust were 9.84-, 6.31-, and 6.74- times higher than those of adults. This may be attributed to the frequent hand-to-mouth activities, increased exposure duration and children’s lower body weight. The ADDs of PAEs for children and adults via dust ingestion exposure were significantly higher than other exposure pathways in the study locations. The ADDs of PAEs for children and adults through dust ingestion were 1.46–1.56 orders higher than that of dust inhalation and dermal adsorption. Similar results have been reported and documented by other researchers and reviewers12,76,78–80.
The degree of PAEs exposure in adults was assessed via two approaches, the carcinogenic and the non-carcinogenic routes, as shown in Table 7. The findings revealed that the non-carcinogenic risks for adults and children were less than the stipulated limit of (HI > 1). Humans are considered exposed to non-cancer risks if the value of the hazard index (HI) is greater than 1. All the HI values were below one (1), indicating the absence of non-carcinogenic risk. However, the HI of DEHP (3.07 × 10⁻²), DBP (2.67 × 10⁻³) and DnOP (1.40 × 10⁻³) via indoor dust ingestion were close to the threshold value. Also, the hazard quotient of non-cancer risk for both children and adults for the six priority PAEs compounds in the sampled locations were in the ascending order of DEHP > DnOP > DBP > BBP > DEP > DMP. DEHP (3.07 10−2) and DnOP (2.58 × 10⁻⁴) contributed the most to the degree of hazard index among the nine study locations for children and adults, respectively.
Table 7 indicates that the carcinogenic risk for BBP and DEHP in indoor dust for adults through the three key predominant routes were 1.11 × 10⁻⁹ and 2.42 × 10⁻¹⁰, respectively. These values were below the carcinogenic threshold limits of 1.00 × 10⁻⁴ to 1.00 × 10⁻⁶ for PAEs exposure in humans. As a result, the carcinogenic risk of human exposure to BBP and DEHP in indoor dust was negligible. This is consistent with other reported research works on PAEs in indoor dust for BBP and DEHP, respectively: Li and Wang61 (9.30 × 10⁻⁷), (1.81 × 10⁻⁴); Li et al12 (1.30 × 10⁻¹⁰), (3.97 × 10⁻⁷); Abdi et al11(3.17 × 10⁻¹⁰), (2.45 × 10⁻⁶).
However, the three predominant exposure routes for children were significantly higher than those of adults in both carcinogenic and non-carcinogenic risk estimation. This increase may be attributed to the explorative nature of children, their frequent hand-to-mouth activities, lower body weight and higher exposure duration. On the contrary, the dermal absorption and ingestion exposure routes were relatively similar and comparable for adults. This study’s results clearly highlight dust ingestion as the predominant route of PAEs in children and adults. Also, the total exposure of children to PAEs via ingestion route in indoor dust particles, as shown in Fig. 4, indicated that DEHP had the highest contribution of 87.2%, followed by DBP (7.61%) and DnOP (4.0%). DMP, DEP and BBP made an insignificant contribution of 0.01%, 1.23% and 0.60%, respectively. Similarly as shown in Fig. 5 for adults, DEHP (54.6%) contributed the highest, followed by DBP (29.9%) and DnOP (9.7%). While DMP, DEP and BBP had 0.01%, 3.25%, and 2.51% contributions, respectively. This study’s results corroborate with other reported work12,29,69.
Figure 4.
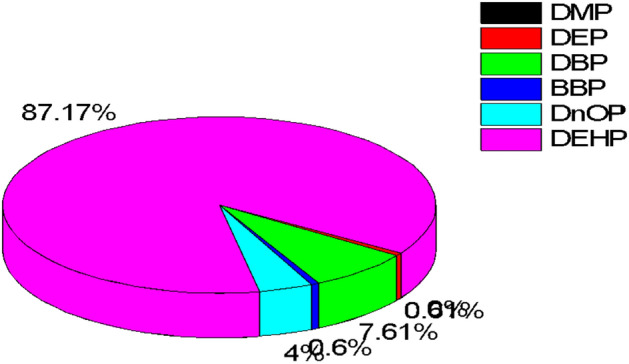
Percentage detection frequency of PAEs congener in indoor dust via ingestion route for children.
Figure 5.
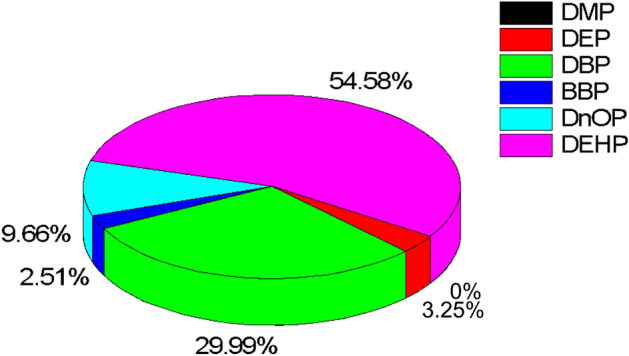
Percentage detection frequency of PAEs congener in indoor dust via ingestion route for adults.
Conclusion and recommendations
This study is the first to report the occurrence of six predominant PAEs compounds, namely DnOP, DBP, DEP, BBP, DMP and DEHP and their human health risk assessments using indoor dust as the environmental monitoring tool. Fifteen samples were collected from nine different indoor microenvironments in Ikeja, Lagos and Ota, Ogun States, Nigeria. DnOP was the most predominant contributor of PAEs, in indoor dust except for locations A, H and I, where DEP was the dominant contaminant. The mean levels of Σ6PAEs in indoor dust ranged from 1.61 ± 0.12 to 53.3 ± 5.27 μg/g across the different microenvironments. The highest level of Σ6PAEs in the microenvironments was in the order of location G (53.3 ± 5.27 μg/g) > location B (33.6 ± 3.10) and > F (15.3 ± 0.62 μg/g). The highest contributions of DnOP and DEP could be linked with plasticizers and personal care products containing DnOP and DEP, in addition to the contribution from flooring types, cleaning habits, and building materials in the indoor environment. The human health risk evaluation indicated ingestion of indoor dust as the dominant exposure route of PAEs for both children and adults, while the children were at a greater risk of PAEs. The non-carcinogenic risk exposure was below the threshold limit of (HI > 1), indicating no risk. Also, the result of the carcinogenic risk exposure of DEHP and BBP from indoor dust by adults was within the recommended threshold of 1.00 × 10⁻⁴ to 1.00 × 10⁻⁶. More attention should be paid to the indoor environment, and appropriate policies and procedures should be enacted by all stakeholders in order to reduce PAEs exposure to humans. A major limitation is the difficulty in obtaining the required permissions to access preschool centres and financial constrains in the analysis of samples thus resulting in the small sample size reported in this study. As a result, studies with a large pool of samples are required for a comprehensive understanding of the occurrence and distribution of PAEs in children’s microenvironments and the availability of research grants specifically for PAES analysis in children’s microenvironments is required to conduct a better comparative analysis of result in Africa. Also, future studies should include a comparative analysis of PAEs in both indoor and outdoor environments, source apportionment to ascertain the primary sources of PAE emissions and the environmental fate of PAEs in indoor environments. This will provide a scientific and robust understanding of the occurrence of PAEs in indoor environments.
Supplementary Information
Acknowledgements
The authors appreciate the proprietors and directors of the study locations for granting us access to their facilities. We also thank Covenant University for creating an enabling environment that encourages research.
Author contributions
W.U.A.: Conceptualization; W.U.A. and E.A.N.: methodology, validation, formal analysis, resources, data curation; investigation, writing-original draft preparation; W.U.A.: writing-review and editing, visualization, supervision, project administration. All authors have read and agreed to the published version of the manuscript.
Funding
This research received financial support covering sample collection and part of laboratory analysis from Global corp Ltd.
Data availability
The data supporting the findings of this study are available on request from the corresponding author.
Competing interests
The authors declare no competing interests.
Footnotes
Publisher's note
Springer Nature remains neutral with regard to jurisdictional claims in published maps and institutional affiliations.
Supplementary Information
The online version contains supplementary material available at 10.1038/s41598-023-38062-4.
References
- 1.Science E. A brief review on emerging indoor chemical pollutants. IOP Conf. Ser. Earth Environ. Sci. 2022 doi: 10.1088/1755-1315/1054/1/012012. [DOI] [Google Scholar]
- 2.Zhu Q, et al. Phthalate acid esters in indoor dust from several regions, China and their implications for human exposure. Sci. Total Environ. 2019;652:1187–1194. doi: 10.1016/j.scitotenv.2018.10.326. [DOI] [PubMed] [Google Scholar]
- 3.Wang L, Gong M, Xu Y, Zhang Y. Phthalates in dust collected from various indoor environments in Beijing, China and resulting non-dietary human exposure. Build. Environ. 2017;124:315–322. doi: 10.1016/j.buildenv.2017.08.006. [DOI] [Google Scholar]
- 4.Clark H, et al. A future for the world’s children? A WHO–UNICEF–Lancet Commission. Lancet. 2020;395:605–658. doi: 10.1016/S0140-6736(19)32540-1. [DOI] [PubMed] [Google Scholar]
- 5.Zhang Q, et al. Concentrations and distribution of phthalate acid esters in the seamount area of the Tropical Western Pacific Ocean. Mar. Pollut. Bull. 2019;140:107–115. doi: 10.1016/j.marpolbul.2019.01.015. [DOI] [PubMed] [Google Scholar]
- 6.Mariana M, Cairrao E. Phthalates implications in the cardiovascular system. J. Cardiovasc. Dev. Dis. 2020;7:26. doi: 10.3390/jcdd7030026. [DOI] [PMC free article] [PubMed] [Google Scholar]
- 7.Oliveira M, Slezakova K, Delerue-Matos C, Pereira MC, Morais S. Children environmental exposure to particulate matter and polycyclic aromatic hydrocarbons and biomonitoring in school environments: A review on indoor and outdoor exposure levels, major sources and health impacts. Environ. Int. 2019;124:180–204. doi: 10.1016/j.envint.2018.12.052. [DOI] [PubMed] [Google Scholar]
- 8.Anake WU, Oyeyemi KD, Ana GREE. Fine particulate matter-based air quality index: A case study. Int. J. Mech. Eng. Technol. 2018;9:1321–1328. [Google Scholar]
- 9.Branco PTBS, Alvim-Ferraz MCM, Martins FG, Sousa SIV. Quantifying indoor air quality determinants in urban and rural nursery and primary schools. Environ. Res. 2019;176:108534. doi: 10.1016/j.envres.2019.108534. [DOI] [PubMed] [Google Scholar]
- 10.Albar HMSA, et al. Phthalate acid esters in settled dust of different indoor microenvironments; source of non-dietary human exposure. Microchem. J. 2017;132:227–232. doi: 10.1016/j.microc.2017.02.008. [DOI] [Google Scholar]
- 11.Abdi S, Sobhanardakani S, Lorestani B, Cheraghi M, Panahi HA. Analysis and health risk assessment of phthalate acid esters (PAEs) in indoor dust of preschool and elementary school centers in city of Tehran, Iran. Environ. Sci. Pollut. Res. 2021;28:61151–61162. doi: 10.1007/s11356-021-14845-y. [DOI] [PubMed] [Google Scholar]
- 12.Li X, et al. Distribution, source apportionment, and health risk assessment of phthalate acid esters in indoor dust samples across China. Environ. Sci. Eur. 2021;33:1–14. doi: 10.1186/s12302-021-00457-3. [DOI] [Google Scholar]
- 13.Lizana J, et al. Contribution of indoor microenvironments to the daily inhaled dose of air pollutants in children. The importance of bedrooms. Build. Environ. 2020;183:107188. doi: 10.1016/j.buildenv.2020.107188. [DOI] [Google Scholar]
- 14.Martins V, et al. Relationship between indoor and outdoor size-fractionated particulate matter in urban microenvironments: Levels, chemical composition and sources. Environ. Res. 2020;183:109203. doi: 10.1016/j.envres.2020.109203. [DOI] [PubMed] [Google Scholar]
- 15.Bouchriti Y, et al. Household dust from a city in Morocco: Characterization by scanning electron microscopy. Pollution. 2022;8:513–527. [Google Scholar]
- 16.Kolarik B, et al. The concentrations of phthalates in settled dust in Bulgarian homes in relation to building characteristic and cleaning habits in the family. Atmos. Environ. 2008;42:8553–8559. doi: 10.1016/j.atmosenv.2008.08.028. [DOI] [Google Scholar]
- 17.Li H, Chen L. Pollution characteristics and health risk assessment of phthalate acid esters in household dust in Chengdu, China. Hum. Ecol. Risk Assess. 2022;28(9):958–971. doi: 10.1080/10807039.2022.2112506. [DOI] [Google Scholar]
- 18.Rasheed T, Bilal M, Nabeel F, Adeel M, Iqbal HMN. Environmentally-related contaminants of high concern: Potential sources and analytical modalities for detection, quantification, and treatment. Environ. Int. 2019;122:52–66. doi: 10.1016/j.envint.2018.11.038. [DOI] [PubMed] [Google Scholar]
- 19.Anake WU, Nnamani EA. A brief review on emerging indoor chemical pollutants. IOP Conf. Ser. Earth Environ. Sci. 2022;1054:012022. doi: 10.1088/1755-1315/1054/1/012012. [DOI] [Google Scholar]
- 20.Martyniuk CJ, et al. Emerging concepts and opportunities for endocrine disruptor screening of the non-EATS modalities. Environ. Res. 2022;204:111904. doi: 10.1016/j.envres.2021.111904. [DOI] [PMC free article] [PubMed] [Google Scholar]
- 21.Lee B-C, et al. Occurrence of bisphenols and phthalates in indoor dust collected from Korean homes. J. Ind. Eng. Chem. 2021;99:68–73. doi: 10.1016/j.jiec.2021.03.051. [DOI] [Google Scholar]
- 22.Baurès E, et al. Indoor air quality in two French hospitals: Measurement of chemical and microbiological contaminants. Sci. Total Environ. 2018;642:168–179. doi: 10.1016/j.scitotenv.2018.06.047. [DOI] [PubMed] [Google Scholar]
- 23.Deng WJ, et al. Phosphorus flame retardants and bisphenol A in indoor dust and PM2.5 in kindergartens and primary schools in Hong Kong. Environ. Pollut. 2018;235:365–371. doi: 10.1016/j.envpol.2017.12.093. [DOI] [PubMed] [Google Scholar]
- 24.Porras SP, Koponen J, Hartonen M, Kiviranta H, Santonen T. Non-occupational exposure to phthalates in Finland. Toxicol. Lett. 2020;332:107–117. doi: 10.1016/j.toxlet.2020.06.021. [DOI] [PubMed] [Google Scholar]
- 25.Navaranjan G, et al. Early life exposure to phthalates and the development of childhood asthma among Canadian children. Environ. Res. 2021;197:110981. doi: 10.1016/j.envres.2021.110981. [DOI] [PubMed] [Google Scholar]
- 26.Borges Ramirez MM, Dzul Caamal R, Rendón von Osten J. Occurrence and seasonal distribution of microplastics and phthalates in sediments from the urban channel of the Ria and coast of Campeche, Mexico. Sci. Total Environ. 2019;672:97–105. doi: 10.1016/j.scitotenv.2019.03.472. [DOI] [PubMed] [Google Scholar]
- 27.Mitro SD, et al. Consumer product chemicals in indoor dust: A quantitative meta-analysis of U.S. studies. Environ. Sci. Technol. 2016;50:10661–10672. doi: 10.1021/acs.est.6b02023. [DOI] [PMC free article] [PubMed] [Google Scholar]
- 28.Zhang J, et al. Associations between phthalic acid esters in household dust and childhood asthma in Shanghai, China. Environ. Res. 2021;200:111760. doi: 10.1016/j.envres.2021.111760. [DOI] [PubMed] [Google Scholar]
- 29.Başaran B, Soylu GN, Yılmaz Civan M. Concentration of Phthalate acid esters in indoor and outdoor dust in Kocaeli, Turkey: implications for human exposure and risk. Environ. Sci. Pollut. Res. 2020;27:1808–1824. doi: 10.1007/s11356-019-06815-2. [DOI] [PubMed] [Google Scholar]
- 30.Xia M, Ouyang X, Wang X, Shen X, Zhan Y. Occupational exposure assessment of phthalate acid esters in indoor and outdoor microenvironments. J. Environ. Sci. (China) 2018;72:75–88. doi: 10.1016/j.jes.2017.12.013. [DOI] [PubMed] [Google Scholar]
- 31.Al Touqi F, Sulaiman H, Babu SPS, Al-Reasi H. Concentrations of selected phthalate acid esters in surface dust in Omani houses. Int. J. Environ. Sci. Dev. 2018;9:345–348. doi: 10.18178/ijesd.2018.9.11.1127. [DOI] [Google Scholar]
- 32.Chang WH, Herianto S, Lee CC, Hung H, Chen HL. The effects of phthalate ester exposure on human health: A review. Sci. Total Environ. 2021;786:147371. doi: 10.1016/j.scitotenv.2021.147371. [DOI] [PubMed] [Google Scholar]
- 33.Luís C, Algarra M, Câmara JS, Perestrelo R. Comprehensive insight from phthalates occurrence: From health outcomes to emerging analytical approaches. Toxics. 2021;9:1–26. doi: 10.3390/toxics9070157. [DOI] [PMC free article] [PubMed] [Google Scholar]
- 34.Net S, Sempéré R, Delmont A, Paluselli A, Ouddane B. Occurrence, fate, behavior and ecotoxicological state of phthalates in different environmental matrices. Environ. Sci. Technol. 2015;49:4019–4035. doi: 10.1021/es505233b. [DOI] [PubMed] [Google Scholar]
- 35.Ait Bamai Y, et al. Exposure to house dust phthalates in relation to asthma and allergies in both children and adults. Sci. Total Environ. 2014;485–486:153–163. doi: 10.1016/j.scitotenv.2014.03.059. [DOI] [PubMed] [Google Scholar]
- 36.Radke EG, Braun JM, Meeker JD, Cooper GS. Phthalate exposure and male reproductive outcomes: A systematic review of the human epidemiological evidence. Environ. Int. 2018;121:764–793. doi: 10.1016/j.envint.2018.07.029. [DOI] [PMC free article] [PubMed] [Google Scholar]
- 37.Radke EG, Glenn BS, Braun JM, Cooper GS. Phthalate exposure and female reproductive and developmental outcomes: A systematic review of the human epidemiological evidence. Environ. Int. 2019;130:104580. doi: 10.1016/j.envint.2019.02.003. [DOI] [PMC free article] [PubMed] [Google Scholar]
- 38.Bornehag CG, et al. The association between asthma and allergic symptoms in children and phthalates in house dust: A nested case-control study. Environ. Health Perspect. 2004;112:1393–1397. doi: 10.1289/ehp.7187. [DOI] [PMC free article] [PubMed] [Google Scholar]
- 39.Sun Y, Zhang Q, Hou J, Wang P, Sundell J. Exposure of phthalates in residential buildings and its health effects. Procedia Eng. 2017;205:1901–1904. doi: 10.1016/j.proeng.2017.10.286. [DOI] [Google Scholar]
- 40.Nidens N, Vogel M, Körner A, Kiess W. Prenatal exposure to phthalate acid esters and its impact on child development. Best Pract. Res. Clin. Endocrinol. Metab. 2021;35:101478. doi: 10.1016/j.beem.2020.101478. [DOI] [PubMed] [Google Scholar]
- 41.Langer S, et al. Phthalate and PAH concentrations in dust collected from Danish homes and daycare centers. Atmos. Environ. 2010;44:2294–2301. doi: 10.1016/j.atmosenv.2010.04.001. [DOI] [Google Scholar]
- 42.Kolarik, B., Naydenov, K., Bornehag, C. G. & Sundell, J. Concentrations of phthalate acid esters’ found in homes of healthy and allergic children. In IAQVEC 2007 Proceedings of 6th International Conference on Indoor Air Quality, Ventilation and Energy Conservation in Buildings: Sustainable Built Environment 2, 255–262 (2007).
- 43.Langer S, et al. Study of the measured and perceived indoor air quality in Swedish school classrooms. IOP Conf. Ser. Earth Environ. Sci. 2020;588:032070. doi: 10.1088/1755-1315/588/3/032070. [DOI] [Google Scholar]
- 44.Nagorka R, Koschorreck J. Trends for plasticizers in German freshwater environments—Evidence for the substitution of DEHP with emerging phthalate and non-phthalate alternatives. Environ. Pollut. 2020;262:114237. doi: 10.1016/j.envpol.2020.114237. [DOI] [PubMed] [Google Scholar]
- 45.Wang X, Tao W, Xu Y, Feng J, Wang F. Indoor phthalate concentration and exposure in residential and office buildings in Xi’an, China. Atmos. Environ. 2014;87:146–152. doi: 10.1016/j.atmosenv.2014.01.018. [DOI] [Google Scholar]
- 46.Wang Y, et al. Characteristics of indoor and outdoor fine phthalates during different seasons and haze periods in Beijing. Aerosol Air Qual. Res. 2019;19:364–374. doi: 10.4209/aaqr.2018.03.0114. [DOI] [Google Scholar]
- 47.Mukherjee A, Agrawal M. World air particulate matter: Sources, distribution and health effects. Environ. Chem. Lett. 2017;15:283–309. doi: 10.1007/s10311-017-0611-9. [DOI] [Google Scholar]
- 48.Xu S, Li C. Phthalates in house and dormitory dust: Occurrence, human exposure and risk assessment. Bull. Environ. Contam. Toxicol. 2021;106:393–398. doi: 10.1007/s00128-020-03058-7. [DOI] [PubMed] [Google Scholar]
- 49.Adewuyi GO. High performance liquid chromatographic identification and estimation of phthalates in sewer waste and a receiving river in Ibadan city, Southwestern Nigeria. J. Water Resour. Prot. 2012;04:851–858. doi: 10.4236/jwarp.2012.410099. [DOI] [Google Scholar]
- 50.Dada EO, Ikeh RK. Phthalate and metal concentrations in drinking water in Lagos, Nigeria. J. Health Pollut. 2018;8:180603. doi: 10.5696/2156-9614-8.18.30. [DOI] [PMC free article] [PubMed] [Google Scholar]
- 51.Edjere O, Asibor IG, Otolo SE. Evaluation of the levels of phthalate ester plasticizers in surface water of Ethiope river system, Delta State, Nigeria. J. Appl. Sci. Environ. Manag. 2016;20:608. [Google Scholar]
- 52.Ayobami N, Olusakin P, Olaoluwa D. Extraction and quantification of phthalates in plastic coca-cola soft drinks using high performance liquid chromatography (HPLC) Chem. Int. 2018;4:85–90. [Google Scholar]
- 53.Adelagun ROA, et al. Phthalate esters in the environment: Sources and quantification. Am. J. Chem. 2021;11:37–41. [Google Scholar]
- 54.Onipede OJ, et al. Blood transfusion impact on levels of some phthalate esters in blood, urine and breast milk of some nursing mothers in Ibadan South-Western Nigeria. Int. J. Environ. Anal. Chem. 2021;101:702–718. doi: 10.1080/03067319.2019.1671379. [DOI] [Google Scholar]
- 55.Subedi B, Sullivan KD, Dhungana B. Phthalate and non-phthalate plasticizers in indoor dust from childcare facilities, salons, and homes across the USA. Environ. Pollut. 2017;230:701–708. doi: 10.1016/j.envpol.2017.07.028. [DOI] [PubMed] [Google Scholar]
- 56.Srilanchakon K, et al. Higher phthalate concentrations are associated with precocious puberty in normal weight Thai girls. J. Pediatr. Endocrinol. Metab. 2017;30:1293–1298. doi: 10.1515/jpem-2017-0281. [DOI] [PubMed] [Google Scholar]
- 57.US Environmental Protection Agency. Exposure Factors Handbook: 2011 Edition. U.S. Environ. Prot. Agency EPA/600/R-, 1–1466 (2011).
- 58.Promtes K, et al. Human exposure to phthalates from house dust in Bangkok, Thailand. J Environ.Sci. Health Part A Toxic/Hazard. Subst. Environ. Eng. 2019;54:1269–1276. doi: 10.1080/10934529.2019.1637207. [DOI] [PubMed] [Google Scholar]
- 59.Ali N, et al. Exposure to phthalate and organophosphate esters via indoor dust and pm10 is a cause of concern for the exposed Saudi population. Int. J. Environ. Res. Public Health. 2021;18:1–15. doi: 10.3390/ijerph18042125. [DOI] [PMC free article] [PubMed] [Google Scholar]
- 60.Ogundele LT, Oladejo OF, Akinola AC. Concentrations, source identification and human health risk of heavy metals in the road dust collected from busy junctions in Osogbo Southwest, Nigeria. EQA-Int. J. Environ. Qual. 2020;38:24–36. [Google Scholar]
- 61.Li X, Wang A. Occurrence of phthalate acid esters (PAEs) in protected agriculture soils and implications for human health exposure. Bull. Environ. Contam. Toxicol. 2022;109:548–555. doi: 10.1007/s00128-022-03553-z. [DOI] [PubMed] [Google Scholar]
- 62.Kubwabo C, et al. Analysis of selected phthalates in Canadian indoor dust collected using household vacuum and standardized sampling techniques. Indoor Air. 2013;23:506–514. doi: 10.1111/ina.12048. [DOI] [PubMed] [Google Scholar]
- 63.Orecchio S, Indelicato R, Barreca S. The distribution of phthalate esters in indoor dust of Palermo (Italy) Environ. Geochem. Health. 2013;35:613–624. doi: 10.1007/s10653-013-9544-9. [DOI] [PMC free article] [PubMed] [Google Scholar]
- 64.Zhou X, Lian J, Cheng Y, Wang X. The gas/particle partitioning behavior of Phthalate acid esters in indoor environment: Effects of temperature and humidity. Environ. Res. 2021;194:110681. doi: 10.1016/j.envres.2020.110681. [DOI] [PubMed] [Google Scholar]
- 65.Liao, et al. Urine metabolites of phthalates esters in 434 Sganghai Children and their associations with ventilation habits. Procedia Eng. 2017;205:1146–1151. doi: 10.1016/j.proeng.2017.10.183. [DOI] [Google Scholar]
- 66.Besis A, Avgenikou A, Pantelaki L, Serafeim E, Georgiadou E, Voutsa D, Samara C. Hazardous organic pollutants in indoor dust from elementary schools and kindergartens in Greece: Implications for children’s health. Chemosphere. 2023;310:136750. doi: 10.1016/j.chemosphere.2022.136750. [DOI] [PubMed] [Google Scholar]
- 67.Liu C, Shi S, Weschler C, Zhao B, Zhang Y. Analysis of the dynamic interaction between SVOCs and airborne particles. Aeosrol Sci. Technol. 2013;47(2):125–136. doi: 10.1080/02786826.2012.730163. [DOI] [Google Scholar]
- 68.Bu Z, Zhang Y, Mmereki D, Yu W, Li B. Indoor phthalate concentration in residential apartments in Chongqing, China: Implications for preschool children’s exposure and risk assessment. Atmos. Environ. 2016;127:34–45. doi: 10.1016/j.atmosenv.2015.12.010. [DOI] [Google Scholar]
- 69.Kim W, et al. Phthalate levels in nursery schools and related factors. Environ. Sci. Technol. 2013;47:12459–12468. doi: 10.1021/es4025996. [DOI] [PubMed] [Google Scholar]
- 70.Song M, et al. Pollution levels and characteristics of phthalate acid esters in indoor air of offices. J. Environ. Sci. (China) 2015;28:157–162. doi: 10.1016/j.jes.2014.05.051. [DOI] [PubMed] [Google Scholar]
- 71.Rastkari N, Jeddi MZ, Yunesian M, et al. Effect of sunlight exposure on phthalates migration from plastic containers to packaged juices. J. Environ. Health Sci. Eng. 2018;16:27–33. doi: 10.1007/s40201-018-0292-8. [DOI] [PMC free article] [PubMed] [Google Scholar]
- 72.Viljoen S J, et al. Leaching of phthalate acid esters from plastic mulch films and their degradation in response to UV irradiation and contrasting soil conditions. J. Hazard. Mater Part B. 2023;443:130256. doi: 10.1016/j.jhazmat.2022.130256. [DOI] [PubMed] [Google Scholar]
- 73.Kim HH, et al. Health risks assessment in children for phthalate exposure associated with childcare facilities and indoor playgrounds. Environ. Health Toxicol. 2011;26:e2011008. doi: 10.5620/eht.2011.26.e2011008. [DOI] [PMC free article] [PubMed] [Google Scholar]
- 74.Gaspar FW, et al. Phthalate exposure and risk assessment in California child care facilities. Environ. Sci. Technol. 2014;48:7593–7601. doi: 10.1021/es501189t. [DOI] [PubMed] [Google Scholar]
- 75.Larsson K, et al. Phthalates, non-phthalate plasticizers and bisphenols in Swedish preschool dust in relation to children’s exposure. Environ. Int. 2017;102:114–124. doi: 10.1016/j.envint.2017.02.006. [DOI] [PubMed] [Google Scholar]
- 76.Fromme H, Lahrz T, Kraft M, Fembacher L, Dietrich S, Sievering S, Burghardt R, Schuster R, Bolte G, Volkel W. Phthalates in German daycare centers: Occurrence in air and dust and the excretion of their metabolites by children (LUPE 3) Environ. Int. 2013;61:64–72. doi: 10.1016/j.envint.2013.09.006. [DOI] [PubMed] [Google Scholar]
- 77.Liu K, Kang L, Li A, Zheng J, Wang X, Zhou X, Wang F. Field investigation on phthalates in settled dust from five different surfaces in residential apartments. Build. Environ. 2020;177:106856. doi: 10.1016/j.buildenv.2020.106856. [DOI] [Google Scholar]
- 78.Li A, Liu C, Kang L, Liu K, Wang X. Chamber study on the migration of di-n-(DNOP) between source surfaces and settled dust: Influence of temperature and dust loading. Atmos. Environ. 2022;268:118789. doi: 10.1016/j.atmosenv.2021.118789. [DOI] [Google Scholar]
- 79.Wang L, et al. Pollution characteristics and health risk assessment of phthalate acid esters in urban soil in the typical semi-arid city of Xi’an, Northwest China. Chemosphere. 2018;191:467–476. doi: 10.1016/j.chemosphere.2017.10.066. [DOI] [PubMed] [Google Scholar]
- 80.Anake WU, Nnamani EA. Indoor air quality in day-care centres: A global review. Air Qual. Atmos. Health. 2023 doi: 10.1007/s11869-023-01320-5. [DOI] [PMC free article] [PubMed] [Google Scholar]
Associated Data
This section collects any data citations, data availability statements, or supplementary materials included in this article.
Supplementary Materials
Data Availability Statement
The data supporting the findings of this study are available on request from the corresponding author.