

Abstract
Accurate diabetic retinopathy (DR) grading is crucial for making the proper treatment plan to reduce the damage caused by vision loss. This task is challenging due to the fact that the DR related lesions are often small and subtle in visual differences and intra-class variations. Moreover, relationships between the lesions and the DR levels are complicated. Although many deep learning (DL) DR grading systems have been developed with some success, there are still rooms for grading accuracy improvement. A common issue is that not much medical knowledge was used in these DL DR grading systems. As a result, the grading results are not properly interpreted by ophthalmologists, thus hinder the potential for practical applications. This paper proposes a novel fine-grained attention & knowledge-based collaborative network (FA+KC-Net) to address this concern. The fine-grained attention network dynamically divides the extracted feature maps into smaller patches and effectively captures small image features that are meaningful in the sense of its training from large amount of retinopathy fundus images. The knowledge-based collaborative network extracts a-priori medical knowledge features, i.e., lesions such as the microaneurysms (MAs), soft exudates (SEs), hard exudates (EXs), and hemorrhages (HEs). Finally, decision rules are developed to fuse the DR grading results from the fine-grained network and the knowledge-based collaborative network to make the final grading. Extensive experiments are carried out on four widely-used datasets, the DDR, Messidor, APTOS, and EyePACS to evaluate the efficacy of our method and compare with other state-of-the-art (SOTA) DL models. Simulation results show that proposed FA+KC-Net is accurate and stable, achieves the best performances on the DDR, Messidor, and APTOS datasets.
Keywords: Diabetic retinopathy grading, Medical image analysis, Fine-grain, Attention mechanism, Knowledge-based network
1. Introduction
Diabetic retinopathy (DR) is a prevalent long-term complication that often arises in individuals with diabetes. It stands as the predominant factor affecting blindness in the adult working-age population worldwide [1] [2]. Nearly one-third of individuals diagnosed with diabetes develop diabetic retinopathy, indicating that every diabetic patient is susceptible to this condition [3]. The most common abnormalities of DR are the MA, EX, SE, and HE. Fig. 1(a-d) illustrates these diseases. The DR can be categorized into five categories: no DR 0, mild DR 1, moderate DR 2, severe DR 3 and proliferative DR 4. Fig. 2(a-e) shows the DR categories [4]. Timely detection of diabetic retinopathy with accurate grading can effectively slow down or prevent the progression of visual impairment [5] [6]. Often, doctors pay more attention to the cases of moderate DR 2 and severe DR 3, because they are very difficult to be correctly distinguished. The effect is whether the patient needs immediate further examination and treatment.
Figure 1.

Pathological lesions of diabetic retinopathy. Green boxes enclose the abnormality in the diabetic retinopathy fundus images.
Figure 2.

Examples of with different DR severities. The original fundus images are shown in the top panel. The medical annotated lesions are, correspondingly, shown in the bottom panel.
The conventional way of DR detection requires ophthalmologists to evaluate fundus images, which is subjective and time-consuming [5]. Ophthalmologists usually identify and grade DR based on the types and numbers of related lesions. However, with more people developing diabetes [7] [8], demand for real-time analysis of fundus images increases dramatically. This brings heavy burden for the limited ophthalmologists. Therefore, it is crucial to develop a reliable automatic DR grading method to relieve the pressure of ophthalmologists and to get more timely treatment to the patients. The computer-aided method provides objective evaluation for ophthalmologists. The DR grading results may bring the attention to the doctors, who, depending on their levels of knowledge and expertise, may provide varying grades for the same patient due to the subtle intra-class variations [9].
Recently, DL method has achieved remarkable advancements in the domain of medical image, such as image classification [10], detection [11], and tumor segmentation [12]. CNN (convolutional neural network) architectures have found widespread application in the field of medical image processing, catering to diverse tasks and objectives. In the field of DR grading, many auto-grading models have been presented with promising results [13] [14] [15]. Vo et al. [13] presented a structure combining kernels with multiple losses and VGG net with extra kernel to learn the features. Vives-Boix et al. [14] combined CNNs with synaptic metaplasticity to improve the convergence rate and performance. Bodapati et al. [15] proposed a composite neural network architecture that incorporates a gated-attention mechanism for the task.
Despite the remarkable achievements of existing DR grading methods, there are still rooms for improvement on the DR grading performance, especially for the distinction between two adjacent severity levels. A possible way to cope with this challenge is to extract sufficient relevant lesion information that is strongly associated with the severity of DR. Since some lesions only contain a few pixels, these lesions are easily neglected when multiple convolutions are used to extract features. Certain DR grading models employ modules similar to the spatial attention mechanisms or filters of multiple sizes to exploit detailed lesion information [13] [16]. These methods offer limited performance improvement because DR grading is essentially a fine-grained image classification task [17]. It aims to capture the discriminative details, however, the subtle intra-class variation and inter-class similarity make it extremely challenging [18]. Further, it would be more meaningful for practical applications if DR grading methods can provide satisfactory medical interpretation for ophthalmologists. Most methods do not effectively incorporate relevant medical knowledge. And the black-box behavior has become an obstacle to clinical application.
This paper presents a novel FA+KC-Net model for DR grading. The model contains a fine-grained attention network (FA-Net) and a knowledge-based collaborative network (KC-Net). The FA-Net is designed to effectively capture detailed small visual features and to suppress the redundant information. The KC-Net employs a lesion detector and applies specifically designed rules from medical knowledge to capture as many DR related lesions as possible. Final grading results are obtained by fusing the results from the FA-Net and KC-Net. A comprehensive set of experiments is conducted to validate and demonstrate the efficacy of the proposed method on four widely recognized public datasets: DDR, EyePACS, Messidor, and APTOS. Results obtained indicate that the FA+KC-Net outperforms other methods on the DDR, Messidor, and APTOS datasets.
It is also found that the KC-Net offers an interesting benefit. Thorough DR grading evaluation on the DDR dataset reveals that a few cases might be labeled with the incorrect DR grading. Majority of the label errors occur for the cases being labeled as DR 3. Results by the KC-Net indicate that the lesions are not that severe and should be labeled as DR 1 or DR 2. Our findings are confirmed by five ophthalmologists from the West China Hospital, Sichuan University.
Several significant contributions:
-
1.
Design a fine-grained attention network (FA-Net) that dynamically divides the extracted feature maps into smaller patches and efficiently extracts distinctive features.
-
2.
Propose a knowledge-based collaborative network (KC-Net) for DR grading by applying a-priori medical knowledge so as to provide the detected lesions with medical explanation.
-
3.
Develop the decision rules to integrate the grading results from the KC-Net into the FA-Net for optimal DR grading results.
The related works are analyzed in Section 2. The proposed FA+KC-Net and its property are described in Section 3. Simulation results on the performance of FA-Net, KC-Net, FA+KC-Net, some SOTA deep learning models are shown in Section 4. An in-depth analysis is provided regarding the performance on diverse datasets in Section 5, and the conclusion and future work are in Section 6.
2. Related work
2.1. DR grading
Typically, conventional DR grading methods employ a two-step process. Initially, the microvascular features, such as ma, se, he, and ex. The subsequent stage involves categorizing the severity level of DR, employing machine learning, like the C-means clustering [17] [19]. For example, an automatic grading system was proposed to generate a lesion probability map and to perform the DR grading based on random forests [20]. These early methods are insufficient in efficiency and generalization ability, compared with the CNN-based methods [15] [21].
Many researchers have applied the deep learning techniques to DR grading and achieved good results [22],[23],[24], [25], [26], [27], [28], [29]. Grinsven et al. [24] improve and boost the training by selecting misclassified negative samples. Li et al. [25] focused on using CNN for detection of vision-threatening referable DR. Zhang et al. [26] established a well-labeled DR dataset and developed a corresponding grading system. Zhou et al. [27] designed a DR generative adversarial network (DR-GAN) to synthesize fundus images with high-resolution. Francisco et al. [28] introduced a computer-assisted diagnostic tool based on a deep residual CNN for automatic DR grading without image transformations. Yang et al. [29] introduced a structure that facilitates the exchange of detailed lesion and image-level grade to achieve robust DR classification.
Some of the above methods carried out the study from the image-level labels [26] [28], and others combined the patch-level information by labeling the data [29]. Here, we fully utilize the limited patch-level information, i.e., the lesion annotations in the DDR dataset, to conduct research on the other three datasets. Note that majority of the other datasets are with the image-level labels. Decision rules based on medical knowledge are designed to optimally make use of these two lesion labels. This is in contrast to the above previous works, which directly incorporate them into neural network models for grading.
Table 1 shows the international clinical DR severity scale [4] and the grading description used in the KC-Net. It describes the five-class DR grading. In the column of Grade, DR 0 denotes that the case is normal. DR 1 is for the mild DR level, DR 2 the moderate level, DR 3 the severe level, and DR 4 the proliferative level. The “Description in KC-Net” column provides information regarding the transformation of medical knowledge into a form that can be directly utilized by the computer. The results were consented by ophthalmologists from the West China Hospital, Sichuan University. Similar means have been described in [30] [31] [32].
Table 1.
Diabetic retinopathy severity scale in knowledge-based collaborative module.
| Grade | Description of Diabetic Retinopathy [4] | Description in KC-Net |
|---|---|---|
| DR 0 | No abnormalities | No abnormalities |
| DR 1 | Microaneurysms only | Microaneurysms only |
| DR 2 | Beyond mere microaneurysms yet less than severe nonproliferative DR | Microaneurysms, less than 20 hemorrhages and hard exudates |
| DR 3 | > 20 intraretinal hemorrhages in each of 4 quadrants; Venous beading in 2+ quadrants microvascular abnormalities in 1+ quadrant; Absent indications of proliferative retinopathy | Soft exudates, hard exudates, more than 20 hemorrhages |
| DR 4 | Presence of either neovascularization or vitreous/preretinal hemorrhage | Neovascularization, preretinal/vitreous hemorrhage |
2.2. Attention mechanism
The attention mechanisms have become an essential trait in neural networks and have been studied in different applications [33]. They enhance the feature information in many tasks such as classification [34], detection [35], and segmentation [36]. For example, a proposed attention fusion network aims to learn the balance between original images and lesion maps, thereby reducing the impact of extraneous lesion on DR grading [37]. Zhao et al. [38] proposed a DR grading method combining a bilinear model to the attention network to perform fine-grained classification. Zhao et al. [39] proposed SEA-Net that employs alternating spatial and channel attention, mutually enhancing and resulting in better performance. A cross-disease attention network was introduced to assess DR and diabetic macular edema simultaneously, identifying the intrinsic connection between the both [40]. Song et al. [41] introduced a domain adaptation multi-instance learning framework, leveraging weak bag labels and auxiliary domain instance labels, which incorporated attention mechanisms to find meaningful patches containing potential lesions in diabetic retinopathy. He et al. [16] introduced the category attention block as a means to address the issue of feature redundancy in representing different levels of diabetic retinopathy (DR). The CAB utilizes some feature channels for each level and ensures discrimination among the feature channels within the same class. By focusing on specific DR levels and enabling the learning of discriminative features through class-specific feature channels, the CAB effectively mitigates the challenges associated with imbalanced data. These attention mechanisms do help improve the classification performance. Since this is a fine-grained image classification task, the attention module proposed in this paper focuses more on the extraction of the fine-grained features.
3. Methodology
In this section, a data preprocessing process that unifies the image quality is described first. The FA+KC-Net that combines a fine-grained attention network and a-priori medical knowledge network is introduced. The proposed FA-Net, KC-Net, and decision rules are elaborated.
3.1. Pre-processing
The fundus images have various illuminations and resolutions, which may introduce irrelevant information and increase the difficulty of classification. To enhance the image contrast ratio and standardize image quality, an image preprocessing technique is employed [24] [42]. The standardized fundus image is acquired by
| (1) |
where a convolution operator ⁎ is applied the and denotes a Gaussian filter with a scale factor α. Adjusting α helps to account for the local average color. β is utilized to highlight the lesions and γ serves for dealing the pixel bias. Based on our test, the parameters are specifically, set to be , , and as outlined in [24] [42]. Fig. 3(a-d) shows the preprocessed retinopathy fundus images. By observing Fig. 3(a-d), it is evident that the illumination disparities are markedly reduced while the contrast ratios are enhanced after processing.
Figure 3.

Examples of the original and preprocessed retinopathy fundus images. Top panel: original images. Bottom panel: the preprocessed images.
3.2. Overview
The proposed FA+KC-Net is depicted in Fig. 4. Its main components are the FA-Net, KC-Net, and the Refine block. The FA-Net consists of a fine-grained attention (FA) module and a backbone network, which is ResNet50 [43] pre-trained on ImageNet [44]. The FA-Net takes the preprocessed fundus image, while the KC-Net utilizes the original image as input. Each model predicts the DR grades. The FA-Net aims to extract the fine detailed features of the fundus image and the KC-Net offers medical interpretation of the fundus image. Two decision rules in the Refine block are designed to collaborate the FA-Net and KC-Net to obtain the final grading.
Figure 4.

Structure of the FA+KC-Net.
The FA-Net inputs the preprocessed fundus image to the backbone network (i.e., Resnet50 [45] in this study), which extracts different features and output the global feature maps, . F derived from Resnet50's deepest convolutional layer. The FA module effectively captures detailed information so as to allow the network to better focus on these features for final grading. A fully connected layer predicts preliminary classification results. Meanwhile, the KC-Net provides medical interpretable explanation, refines the preliminary results, and detects whether the preliminary classification results are consistent with the actual eye lesions.
3.3. FA module
Structure and operations of the FA module are depicted in Fig. 5. The FA module effectively extracts detailed and small image features that are significant to distinguish different classes and is able to remove the redundant information. The fine-grained features from the preprocessed fundus image can be extracted via a two-stage operation. The first stage produces the feature map from the global feature map by the operation expressed as
| (2) |
Figure 5.

Detailed structure of the FA module.
As illustrated in Fig. 5, F goes through two separate channels. One channel employs the average pooling (AP) operation and another channel the max pooling (MP) operation. The result in each channel is fed into the multi-layer perceptron (MLP). Both channels ( and ) are added together to have the weighted contextual information. After the sigmoid operation that normalizes the values into [0, 1], is obtained by the element-wise multiplication with the input feature map F. The sizes of the feature maps F and are , where C denotes input channels, H and W signify height and width.
The anchor box (AB) is introduced to capture the small detailed features for distinguishing the DR severity. It divides into N parts. N can be 9, 16, or 25. The ith anchor box is denoted as , , and C is the number of channels. The size of the anchor box S can be set to different values to focus on the characteristics of different scales. Every anchor box is fed into an AP operation and an MP operation along the channel direction. Then the outputs of two branches go through the concatenation and convolution to learn the spatial-wise features of each anchor box. The output can be obtained by
| (3) |
Conv is a convolution operation. Finally, a linear layer executes DR grading, taking the MP outcome, as input.
3.4. KC-Net
The proposed KC-Net contains a lesion detector that performs the DR grading by applying the medical knowledge and specified rules. As shown in the lower panel of Fig. 4, the original fundus image is fed into the lesion detector to detect the related lesions. The detector can be SSD [46], Fast R-CNN [47], or YOLO v5. In this paper, YOLO v5 is chosen as the lesion detector due to its ability to quickly capture multiple targets (lesions) and excellent accuracy performance. The types and numbers of lesions detected by the lesion detector are counted and recorded in the Lesion Details.
The Medical Knowledge block in Fig. 4 contains the information as shown in the column of “Description in KC-Net” in Table 1. The fundus images are classified according to the information recorded in the Lesion Details and the severity level description in the KC-Net.
Among the four datasets, only DDR contains the lesion annotations. Hence, the KC-Net is constructed using the information from the DDR dataset. The annotations only contain MAs, SEs, HEs, and EXs (mainly for grading levels from DR 1 to DR 3), not including the DR 4 lesions such as neovascularization. Thus, the KC-Net does not grade the DR 4 case.
3.5. FA+KC-Net
The proposed FA+KC-Net fuses the results from the FA-Net and KC-Net at the Refine box (in Fig. 4) to generate the final lesion grading score. The salient feature is the medical knowledge and lesion details detected by the KC-Net are considered as much as possible to design the decision rules of fusing, which is different from the existing multi-task models that directly merge different task results in the neural network. Thus, the FA+KC-Net considers not only the FA-Net prediction result, but also the pathological information of the fundus image. This framework provides the medical interpretation to some extent.
The decision rules are summarized in Algorithm 1, Algorithm 2. The purpose of Algorithm 1 is to adopt the grading results from the FA-Net, and make changes only when the grading result is different from that of the KC-Net and the KC-Net finds sufficient numbers and classes of lesions. Algorithm 2, on the other hand, considers the confidence level and the statistical accuracy of each DR grading from the FA-Net to determine whether or not a FA-Net grading is reliable. If it is, much stricter lesion conditions are required from the KC-Net to make the change. Note that Algorithm 1 does not permit the change of FA-Net prediction to No DR in order to prevent the miss diagnosis.
Algorithm 1.

Algorithm 2.

It needs to be pointed out that the lack of some lesion annotations in DDR, such as vitreous hemorrhage and neovascularization, hinders the KC-Net in its ability to detect the DR 4 case. Under this circumstance, the decision rules directly adopt the FA-Net prediction result.
4. Experiments and results
This section begins with a brief introduction of the four datasets commonly used in DR related research. Subsequently, implementation details and evaluation metrics are presented. A comparative analysis of the classification performances between our model and other SOTA models is conducted on the four datasets.
4.1. Datasets & implementation details
The evaluation considers four public datasets: DDR [48], Messidor [49], APTOS 2019 [50] and EyePACS [51]. The DR class distributions are shown in Fig. 6(a-d). For example, DDR contains roughly 36% of cases labeled as DR 2, while Messidor has 20%, APTOS has 27%, and EyePACS has 15% as DR 2.
Figure 6.

Data distribution of four DR grading datasets.
The DDR dataset, as described in [48], comprises a total of 13,673 fundus images. Within the dataset, there are 6,835 training images, 2,733 validation, and 4,105 testing images. They are categorized into six classes based on the international classification standard for diabetic retinopathy: DR 0-4, and an ungradable class consisting of poor-quality images (do not exhibit visible lesions). This study focuses on the five-class (DR 0 to DR 4) classification, though the six-class classification is also included to further evaluate the performance of the proposed method. It needs to point out that aside from the image-level annotations, the DDR dataset also provides lesion annotations (such as MA, EX, SE, and HE) on 757 images.
Messidor dataset includes 1,200 fundus images from three ophthalmologic departments [49]. These images are graded into four groups, acknowledging the challenge of discerning DR 0 and DR 1 for both DL models and ophthalmologists [52]. For fair comparison with previous works, DR 0 and DR 1 are classified as referable, DR 2 and DR 3 are classified as non-referable [13] [40] [53].
Kaggle-APTOS 2019 dataset is from the Asian Pacific Tele-Ophtalphmology Society (APTOS) [50]. It contains 3,662 retina images and are graded into five classes. They are divided into two categories: DR 0 (No DR) and DR 1 (Mild + Moderate + Severe + Proliferative DR). Both multi-class and binary classification tasks are conducted to validate the performance of the method and for comparison purpose. For both tasks, the dataset was divided using ten-fold cross-validation, with an 80% training set and 20% testing set (multiple subsets of the data are rotated as the testing set in each fold) following [14] [15].
There are 88,702 fundus images in the EyePACS dataset [51]. These fundus images are provided and graded by EyePACS. The image collection process involved varying lighting conditions and encountered challenges with respect to annotation quality. Some images contain artifacts and underexposed, or overexposed [30].
All the simulations are performed on NVIDIA GTX 2080Ti GPUs with 11 GB of memory in Pytorch. The cross-entropy loss function and Adam optimizer [54] are adopted for training with 80 epochs. The learning rate is set to 0.0006 and is decayed by a factor of 0.8 for every 10 epochs. The batch size is 10. Random horizontal flips, vertical flips, and random rotations are performed on all training datasets for data augmentation to reduce overfitting. All images were resized to 512×512 resolution to optimize computational efficiency. The final model is chosen based on its superior accuracy on the validation set.
Notably, although the KC-Net is developed using the DDR dataset, it is still effective when applied to other datasets.
4.2. Evaluation metrics
Rigorous experiments evaluated the proposed method's performance, ensuring a impartial and in-depth comparison with other SOTA models, different evaluation metrics are used in different tasks of the four datasets. Their formulas are given as follows:
| (4) |
| (5) |
| (6) |
| (7) |
| (8) |
TP and FP are positive samples predicted as positive and negative. FN and TN are negative samples predicted as positive and negative. Indices i and j correspond to the actual and predicted classes. O refers to the true observed values, E indicates anticipated counts, and N signifies the aggregate number. AUC represents the area beneath the receiver operating characteristic curve, and the value is ranged between 0.5 and 1.
4.3. Analysis of network design on DDR dataset
1)Prior to assessing the proposed method: The ablation experiments are conducted to verify the effectiveness of image preprocessing. Table 2 shows the five-class DR grading results using various networks, including ResNet50, ResNet101 and Densenet-121. The additional variations considered in the evaluation include the original (+Ori) and the preprocessed (+Pre) images from the DDR. The results are slightly different from that reproduced by [16], probably due to the application of different hyper-parameters. The results, obtained from the preprocessed images exhibit a promotion on accuracy and QW-Kappa compared to those obtained using the original images.
Table 2.
FIVE-CLASS DR GRADING RESULTS APPLIED WITH ORIGINAL (+Ori) AND PREPROCESSED (+Pre) IMAGES ON THE DDR (UNIT: %).
| Model | Acc. | QW-Kappa | ΔAcc | ΔQW-Kappa |
|---|---|---|---|---|
| ResNet50 [16] | 75.57 | 74.27 | - | - |
| DenseNet-121 [16] | 76.69 | 74.38 | - | - |
| Resnet50+Ori | 75.97 | 73.24 | - | - |
| Resnet50+Pre | 76.90 | 73.69 | ↑0.93 | ↑0.45 |
| Resnet101+Ori | 76.18 | 73.31 | - | - |
| Resnet101+Pre | 76.94 | 74.12 | ↑0.76 | ↑0.81 |
| DenseNet-121+Ori | 76.98 | 74.15 | - | - |
| DenseNet-121+Pre | 78.02 | 75.07 | ↑1.04 | ↑0.92 |
2) Analysis of Fine-grained Attention (FA) module: Performance evaluation of the proposed FA-Net and other SOTA attention modules was conducted. Other attention modules include the category attention block (CAB) [16], the squeeze-and-excitation (SE) [55], the coordinate attention (CA) [56], and the convolutional block attention module (CBAM) [57]. ResNet50 is used the backbone network for all the attention modules. Table 3 shows that Resnet50 combined with attention module improves the Acc and QW-Kappa measures. Among them, the proposed FA-Net exhibits the best DR grading performance. The improvement is quite significant compared with other attention modules, more than 5% by FA to less than 2% by others in Acc, and almost 9% by FA to less than 5% by others in QW-Kappa.
Table 3.
COMPARISON OF FIVE-CLASS DR GRADING RESULTS BY THE PROPOSED FA-NET WITH OTHER ATTENTION MODULES ON THE DDR DATASET. (UNIT: %).
| Model | Acc | QW-Kappa | ΔAcc | ΔQW-Kappa | #Param |
|---|---|---|---|---|---|
| ResNet50 | 76.90 | 73.69 | - | - | 23.52M |
| ResNet50+CAB [16] | 77.73 | 78.57 | ↑0.83 | ↑4.88 | 25.19M |
| ResNet50+SE [55] | 78.07 | 77.61 | ↑1.17 | ↑3.92 | 24.04M |
| ResNet50+CA [56] | 78.45 | 76.21 | ↑1.55 | ↑2.52 | 23.92M |
| ResNet50+CBAM [57] | 78.42 | 77.28 | ↑1.52 | ↑3.59 | 24.04M |
| ResNet50+FA | 82.10 | 82.68 | ↑5.20 | ↑8.99 | 25.16M |
Table 4 displays the impact of anchor box size in FA-Net. It indicates that the best performance occurs at the box size of 2, i.e., S=2. Hence, in the rest experiments, the anchor box size set to 2.
Table 4.
EFFECT OF THE SIZES OF ANCHOR BOX ON DR GRADING PERFORMANCE (UNIT: %).
| Models | Acc | QW-Kappa |
|---|---|---|
| FA-Net S = 1 | 81.32 | 81.77 |
| FA-Net S = 2 | 82.10 | 82.68 |
| FA-Net S = 3 | 81.35 | 81.23 |
| FA-Net S = 4 | 80.34 | 80.93 |
3) Analysis of FA-Net and KC-Net: Table 5 exhibits the efficacy of the FA-Net and KC-Net on each DR grade. Table 5 reveals that KC-Net's overall accuracy is lower than FA-Net's. It probably due to that fact that the current KC-Net lacks the ability to determine DR 4. However, it should be emphasized that the overall accuracy of KC-Net alone is still close to that of the backbone ResNet50 (75.97%) as listed in Table 2. Moreover, both Table 5 and the confusion matrices given in Fig. 7(a-b) show that FA-Net has better performance on DR 0 and DR4, while for the intermediate severity levels, DR 1, DR 2 and DR 3, KC-Net has the advantage. In all, by mainly considering the lack of detection ability of DR 4, KC-Net with a-priori medical knowledge is selected to be integrated into FA-Net to obtain FA+KC-Net.
Table 5.
FIVE-CLASS DR GRADING RESULTS OF THE FA-NET AND KC-NET ON THE DDR DATASET (UNIT: %).
| Grade | FA-Net | KC-Net |
|---|---|---|
| DR 0 | 97.98 | 82.93 |
| DR 1 | 12.17 | 52.38 |
| DR 2 | 72.69 | 85.49 |
| DR 3 | 39.44 | 52.11 |
| DR 4 | 78.55 | 0 |
| Overall Acc | 82.10 | 75.65 |
Figure 7.
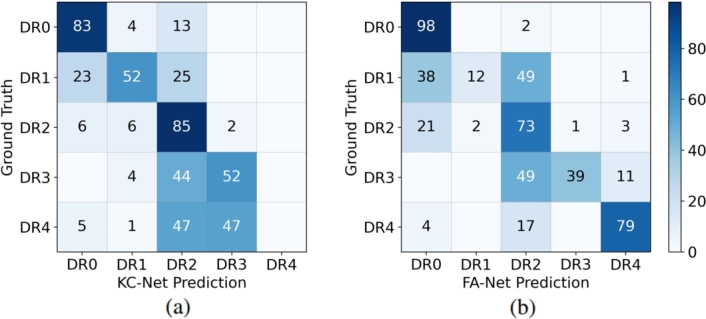
Confusion matrixes (unit: %) of the FA-Net and KC-Net grading performance on the DDR dataset.
4.4. Effect of decision rules on DDR dataset
This section evaluates the effect of the decision rules, Algorithm 1 and Algorithm 2, in the FA+KC-Net. The decision rules are applied when the prediction results from FA-Net and KC-Net are inconsistent. DDR dataset contains 3,759 images. FA-Net and KC-Net provide consistent prediction results in the 3,123 images. For the inconsistent cases, there are two situations. In situation 1, denoted as FA-Net ≠ KC-Net (1), the differences in the inconsistence are not significant. Then the predictions of FA-Net are kept. Situation 2, denoted as FA-Net ≠ KC-Net (2), contains the cases where the predictions of FA-Net deviate significantly from that of the medical knowledge. When this situation happens, the prediction results by the KC-Net are chosen.
Table 6 shows the effect of decision rules in the FA+KC-Net. The metric used in the evaluation is Acc. The column of “Acc (%), after” denotes the results when the decision rule is applied. The “Action” column denotes to keep the FA-Net result or change to the KC-Net result. FA+KC-Net+R1 denotes that Algorithm 1 is used, while FA+KC-Net+R2 denotes that Algorithm 2 is used. Table 6 indicates that the application of decision rules improves the prediction accuracy. And Algorithm 2 exhibits better performance than Algorithm 1.
Table 6.
FIVE-CLASS DR GRADING RESULTS ON DDR BY FA+KC-Net+R1 AND FA+KC-Net+R2.
| Models | Situations | Case Number | Acc (%), before | Acc (%), after | Action |
|---|---|---|---|---|---|
| FA+KC-Net+R1 | FA-Net=KC-Net | 3,123 | 88.0 | 88.0 | Keep |
| FA-Net≠KC-Net(1) | 519 | 62.4 | 62.4 | Keep | |
| FA-Net≠KC-Net(2) | 117 | 12.8 | 72.6 | Change | |
| FA+KC-Net+R2 | FA-Net=KC-Net | 3,123 | 88.0 | 88.0 | Keep |
| FA-Net≠KC-Net(1) | 519 | 62.4 | 66.1 | Change | |
| FA-Net≠KC-Net(2) | 117 | 12.8 | 73.5 | Change | |
Further, five-class DR grading results are shown in Table 7 and the corresponding confusion matrices are in Fig. 8(a-b). It is observed from Table 7 and Fig. 8(a-b) that Algorithm 2 performs slightly better than Algorithm 1 on both the overall accuracy and QW-kappa measures. Both decision rules work well on DR 0, DR 2, and DR 4. Prediction results by Algorithm 2 on DR 1 show great improvement compared to that by Algorithm 1.
Table 7.
FIVE-CLASS DR GRADING RESULTS OF FA+KC-NET+R1 AND FA+KC-NET+R2 ON THE DDR DATASET (UNIT: %).
| Grade | FA+KC-Net+R1 | FA+KC-Net+R2 |
|---|---|---|
| DR 0 | 97.29 | 95.16 |
| DR 1 | 20.63 | 52.38 |
| DR 2 | 77.60 | 77.31 |
| DR 3 | 40.85 | 46.48 |
| DR 4 | 78.55 | 78.55 |
| Overall Acc | 83.96 | 84.49 |
| QW-Kappa | 84.76 | 86.17 |
Figure 8.
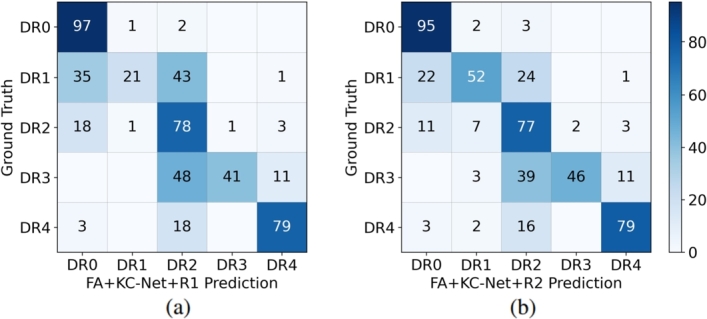
Confusion matrix (unit: %) of FA+KC-Net+R1 and that of FA+KC-Net+R2 on five-class DR grading on the DDR.
4.5. Comparisons with existing models
Performance evaluation using other SOTA models were also conducted to further substantiate the proposed method's efficacy. Evaluations include the following tasks. One is the five-class and six-class DR grading on DDR. Two is the binary DR grading on the Messidor. Three is to perform the binary and five-class DR grading on Kaggle-APTOS dataset. The last task is to conduct the five-class DR grading on the EyePACS.
1) Five-class classification on DDR Dataset: Table 8 shows the five-class grading results by various methods. Performance measures are Acc and QW-Kappa. Table 8 illustrates that the FA-Net performs better than CABNet on both metrics, and achieves better performance on QW-Kappa than other methods. The FA+KC-Net exhibits the best performance on both metrics.
Table 8.
FIVE-CLASS DR GRADING ON THE DDR BY OUR MODELS COMPARED WITH OTHER SOTA MODELS (UNIT: %).
2) Six-class classification on DDR Dataset: Table 9 summaries the accuracy result of each class and the overall accuracy (OA) counting the ungradable class. Results of three deep learning models are from [48] and Resnet50+CBAM from [56]. Table 9 reveals that the FA+KC-Net and FA-Net offer better overall identification performance than the DL models. Close examination shows that all four existing models perform very poorly on the DR 1 class, with accuracy rate below 10%. The FA+KC-Net achieves the best accuracies in all classes, except DR 0 and DR 3. Table 9 also shows that DR 1 and DR 3 cases are most difficult to be detected correctly.
Table 9.
SIX-CLASS DR GRADING ON THE DDR BY OUR MODELS COMPARED WITH OTHER DL MODELS (UNIT: %).
| Model | DR 0 | DR 1 | DR 2 | DR 3 | DR 4 | Ungradable | OA |
|---|---|---|---|---|---|---|---|
| VGG16 [48] | 95.37 | 4.23 | 56.23 | 39.4 | 64.36 | 94.22 | 75.20 |
| ResNet-18 [48] | 95.48 | 5.82 | 62.20 | 36.62 | 58.18 | 91.33 | 76.59 |
| SE-BN-Inception [48] | 94.52 | 4.76 | 64.58 | 12.68 | 58.18 | 90.46 | 76.39 |
| Resnet50+CBAM [56] | 99.10 | 1.59 | 64.21 | 40.85 | 61.46 | 95.36 | 79.34 |
| FA-Net | 96.92 | 22.22 | 70.54 | 30.99 | 67.27 | 97.40 | 81.75 |
| FA+KC-Net+R1 | 96.22 | 28.04 | 74.48 | 35.21 | 67.27 | 97.40 | 83.07 |
| FA+KC-Net+R2 | 94.79 | 52.91 | 74.93 | 39.44 | 67.27 | 97.40 | 83.78 |
3) Binary classification on Messidor Dataset: Binary DR grading test is carried out on the Messidor. 10-fold cross validation was conducted as [13] [40] [53]. Table 10 displays the performance by various methods. In the table, symbol “-” means that no DR results reported in the respective articles. Table 10 shows that, for binary DR grading, most methods perform well. The proposed FA+KC-Net exhibits the best results on all metrics, except the recall (Rec) rate.
Table 10.
BINARY DR GRADING ON THE MESSIDOR BY OUR MODELS COMPARED WITH OTHER DL MODELS (UNIT: %).
| Models | Acc | AUC | Pre | Rec | F1 |
|---|---|---|---|---|---|
| VNXK [13] | 89.3 | 88.7 | - | - | - |
| CKML [13] | 89.7 | 89.1 | - | - | - |
| Dynamic feature [62] | - | 91.6 | - | - | - |
| Zoom-in Net [53] | 91.1 | 95.7 | - | - | - |
| CABNet [16] | 92.1 | 94.6 | 91.0 | 89.2 | 89.9 |
| CANet (JT) [40] | 92.6 | 96.3 | 90.6 | 92.0 | 91.2 |
| CABNet (JT) [16] | 93.1 | 96.9 | 92.9 | 90.2 | 91.5 |
| FA-Net | 92.9 | 96.5 | 94.6 | 88.0 | 91.2 |
| FA+KC-Net+R1 | 93.3 | 97.0 | 94.7 | 89.9 | 92.2 |
| FA+KC-Net+R2 | 94.1 | 97.0 | 95.7 | 90.0 | 92.8 |
4) Results on Kaggle-APTOS Dataset: Both binary DR grading and five-class DR grading tests are conducted on the Kaggle-APTOS dataset. For binary DR grading, the dataset was divided into two groups: DR 0 and DR 1. DR 0 means No DR, and DR 1 includes all other DRs in the five-class grading. The 10-fold cross validation is applied here. Table 11 shows the binary grading results and Table 12 the five-class grading results. It is observed from Table 11 and Table 12 that FA+KC-Net performs the best on both grading, only slightly lower in the precision metric on the binary grading.
Table 11.
BINARY DR GRADING ON THE APTOS BY OUR MODELS COMPARED WITH OTHER DL MODELS (UNIT: %).
| Models | Acc | Pre | Rec | F1 |
|---|---|---|---|---|
| AmVGG16 [15] | 93.45 | 93.07 | 94.00 | 93.53 |
| AmInceptionv3 [15] | 94.46 | 98.90 | 90.00 | 94.24 |
| Composite DNN [16] | 97.82 | 98.00 | 98.00 | 98.00 |
| EfficientNet [63] | 98.70 | |||
| SCL [64] | 98.36 | 98.37 | 98.36 | 98.37 |
| FA-Net | 98.50 | 97.87 | 99.19 | 98.52 |
| FA+KC-Net+R1 | 98.91 | 98.40 | 99.46 | 98.93 |
| FA+KC-Net+R2 | 99.04 | 98.66 | 99.46 | 99.06 |
Table 12.
FIVE-CLASS DR GRADING ON THE APTOS BY OUR MODELS COMPARED WITH OTHER DL MODELS (UNIT: %).
| Models | Acc | Pre | Rec | F1 |
|---|---|---|---|---|
| AmInceptionv3 [14] | 76.67 | 78.75 | 74.76 | 76.68 |
| AmVGG16 [14] | 78.58 | 83.60 | 72.03 | 77.28 |
| Composite DNN [15] | 82.54 | 82.00 | 83.00 | 82.00 |
| Sugeno et al. [63] | 84.60 | - | - | - |
| SCL [64] | 83.46 | 73.81 | 70.51 | 70.49 |
| AABNet [65] | 86.02 | - | - | 71.51 |
| FA-Net | 84.95 | 84.29 | 84.64 | 84.46 |
| FA+KC-Net+R1 | 86.05 | 85.41 | 85.91 | 85.65 |
| FA+KC-Net+R2 | 86.46 | 85.73 | 86.12 | 85.93 |
5) Five-class classification on EyePACS Dataset: For the EyePACS dataset, five-class DR grading results are shown in Table 13. Table 13 demonstrates Acc and QW-Kappa performance of the FA-Net and FA+KC-Net are close to that of existing DL models.
Table 13.
FIVE-CLASS DR GRADING ON THE EYEPACS BY OUR MODELS COMPARED WITH OTHER DL MODELS (UNIT: %).
5. Discussion
1) Performance of FA-Net and KC-Net on DDR dataset: Visual illustrations on the prediction correction by the FA+KC-Net are depicted in Fig. 9 and Fig. 10. Fig. 9 depicts that initially the FA-Net predicts that the fundus image may show a DR 1 lesion. With the KC-Net and medical knowledge, however, the prediction result should indicate as DR 2 because the KC-Net detects the presence of SE, EX and HE on the fundus image. On the other hand, Fig. 10 shows that the FA-Net predicts a DR 2 lesion. Then, with the help of KC-Net, the refine module adjusts the prediction result to be a less severe DR 1 because no EXs, SEs and HEs are found on the fundus image. These results are verified by the ground truth.
Figure 9.

Correction of DR grading by FA-Net to a more severe level by applying the KC-Net.
Figure 10.

Correction of DR grading of FA-Net to a less severe level by applying the KC-Net.
Fig. 11(a-e) exhibits the original images and the five-class DR grading results by the KC-Net, which are consistent with that by the FA-Net. Thus, the FA+KC-Net keeps the results predicted by the FA-Net.
Figure 11.

Examples that the KC-Net agrees with the FA-Net. Columns from left to right are examples of DR0, DR1, DR2, DR3, and DR4. Upper panel: original fundus images. Lower panel: lesions detected by KC-Net. The red, yellow, orange, and pink boxes indicate MA, HE, SE, and EX respectively.
2) Discussion of EyePACS dataset: The FA+KC-Net does not perform well on the EyePACS dataset, compared with other three datasets, and may wrongly predict some images containing the areas that are detected as lesions, but actually are stains on the lens. The reason is that the EyePACS dataset contains quite a few poor-quality images. For example, Fig. 12(a-d) shows the images that have the artifacts, underexposed or overexposed [30] [48]. For these images, it is expected that the DR grading performance by the FA+KC-Net would be lowered. On the other hand, the FA+KC-Net identifies, due to the shapes, the circled areas in the images of Fig. 13(a-c) as possible lesions. But, after checking the left and right eyes from the same patient, it is found that the circled areas may be just stains on the lens.
Figure 12.

Ungradable images in the EyePACS dataset. (a) Artifact. (b) Out of focus. (c) Underexpose. (d) Overexpose.
Figure 13.

Two examples: (a) Left eye. (b) Right eye. (c) FA+KC-Net detection results. Green circle marks the area that may be just a stain. The red and yellow boxes indicate MA and HE.
3) Discussion of DDR dataset: In the simulation on DDR dataset using the KC-Net, it is found that there are eight DR 3 cases in the testing dataset might be labeled incorrectly. Some of them are shown in Fig. 14(a-c), which displays the fundus images classified as DR 1 cases by the KC-Net. Our findings are confirmed by five ophthalmologists from the West China Hospital, Sichuan University. Their judgments were that, if the fundus images were the only resource for making the label, these images should be classified as DR 1.
Figure 14.

Three examples with lesions indicated by the KC-Net do not support the DR 3 labels. Top panel: Original fundus images. Bottom panel: images labeled by the KC-Net as the DR 1 cases. The red boxes indicate MA.
6. Conclusion and future work
This paper introduces a novel FA+KC-Net by integrating the KC-Net and FA-Net through decision rules. The FA-Net focuses on the small detailed image feature to boost the accuracy of DR grading. The KC-Net including medical knowledge helps providing the medical interpretation by the detected types and numbers of lesions. Although the KC-Net is trained on the DDR dataset, it is still effective in the DR grading when applied to the other datasets. Simulation results demonstrate that the FA+KC-Net achieved the best DR grading performance on the DDR, Messidor, and APTOS datasets, comparing with several SOTA deep learning models. Future research will investigate the application of the method to other medical classification tasks, like DME grading, and the collaboration of FA-Net and KC-Net, such as employing reinforcement learning mechanism.
CRediT authorship contribution statement
Miao Tian: Conceived and designed the experiments; Contributed reagents, materials, analysis tools or data; Wrote the paper. Hongqiu Wang: Performed experiments: Analyzed and interpreted the data: Wrote the paper. Yinaxue Sun: Conceived and designed the experiments: Contributed reagents, materials, analysis tools or data. Qingging Tang, Meixia Zhang; Shaozhi Wu: Analyzed and interpreted the data.
Declaration of Competing Interest
There are no conflicts of interest to declare.
Data availability
Data included in article/supp. material/referenced in article.
References
- 1.Wykoff C.C., Khurana R.N., Nguyen Q.D., Kelly S.P., Lum F., Hall R., Abbass I.M., Abolian A.M., Stoilov I., To T.M., et al. Risk of blindness among patients with diabetes and newly diagnosed diabetic retinopathy. Diabetes Care. 2021;44(3):748–756. doi: 10.2337/dc20-0413. [DOI] [PMC free article] [PubMed] [Google Scholar]
- 2.retinopatie K.I.D. Diabetic retinopathy. Diabetes Care. 1978;34:445–451. [Google Scholar]
- 3.Ding J., Wong T.Y. Current epidemiology of diabetic retinopathy and diabetic macular edema. Curr. Diabetes Rep. 2012;12:346–354. doi: 10.1007/s11892-012-0283-6. [DOI] [PubMed] [Google Scholar]
- 4.Wilkinson C.P., Ferris F.L., III, Klein R.E., Lee P.P., Agardh C.D., Davis M., Dills D., Kampik A., Pararajasegaram R., Verdaguer J.T., et al. Proposed international clinical diabetic retinopathy and diabetic macular edema disease severity scales. Ophthalmology. 2003;110(9):1677–1682. doi: 10.1016/S0161-6420(03)00475-5. [DOI] [PubMed] [Google Scholar]
- 5.Bhuiyan A., Govindaiah A., Deobhakta A., Gupta M., Rosen R., Saleem S., Smith R.T. Development and validation of an automated diabetic retinopathy screening tool for primary care setting. Diabetes Care. 2020;43(10):e147–e148. doi: 10.2337/dc19-2133. [DOI] [PMC free article] [PubMed] [Google Scholar]
- 6.Garg S., Davis R.M. Diabetic retinopathy screening update. Clin. Diabetes. 2009;27(4):140–145. [Google Scholar]
- 7.Cho N.H., Shaw J., Karuranga S., Huang Y., da Rocha Fernandes J., Ohlrogge A., Malanda B. IDF diabetes atlas: global estimates of diabetes prevalence for 2017 and projections for 2045. Diabetes Res. Clin. Pract. 2018;138:271–281. doi: 10.1016/j.diabres.2018.02.023. [DOI] [PubMed] [Google Scholar]
- 8.Scully T. Diabetes in some of the implications for national governments. Nature. 2012 [Google Scholar]
- 9.Krause J., Gulshan V., Rahimy E., Karth P., Widner K., Corrado G.S., Peng L., Webster D.R. Grader variability and the importance of reference standards for evaluating machine learning models for diabetic retinopathy. Ophthalmology. 2018;125(8):1264–1272. doi: 10.1016/j.ophtha.2018.01.034. [DOI] [PubMed] [Google Scholar]
- 10.Wang H., Sun Y., Cao Y., Ouyang G., Wang X., Wu S., Tian M. 2022 Asia Conference on Algorithms, Computing and Machine Learning (CACML) IEEE; 2022. Classification for diabetic retinopathy by using staged convolutional neural network; pp. 228–233. [Google Scholar]
- 11.Ozturk T., Talo M., Yildirim E.A., Baloglu U.B., Yildirim O., Acharya U.R. Automated detection of Covid-19 cases using deep neural networks with x-ray images. Comput. Biol. Med. 2020;121 doi: 10.1016/j.compbiomed.2020.103792. [DOI] [PMC free article] [PubMed] [Google Scholar]
- 12.Tian M., Wang H., Liu X., Ye Y., Ouyang G., Shen Y., Li Z., Wang X., Wu S. Delineation of clinical target volume and organs at risk in cervical cancer radiotherapy by deep learning networks. Med. Phys. 2023 doi: 10.1002/mp.16468. [DOI] [PubMed] [Google Scholar]
- 13.Vo H.H., Verma A. 2016 IEEE International Symposium on Multimedia (ISM) IEEE; 2016. New deep neural nets for fine-grained diabetic retinopathy recognition on hybrid color space; pp. 209–215. [Google Scholar]
- 14.Vives-Boix V., Ruiz-Fernandez D. Diabetic retinopathy detection through convolutional neural networks with synaptic metaplasticity. Comput. Methods Programs Biomed. 2021;206 doi: 10.1016/j.cmpb.2021.106094. [DOI] [PubMed] [Google Scholar]
- 15.Bodapati J.D., Shaik N.S., Naralasetti V. Composite deep neural network with gated-attention mechanism for diabetic retinopathy severity classification. J. Ambient Intell. Humaniz. Comput. 2021;12(10):9825–9839. [Google Scholar]
- 16.He A., Li T., Li N., Wang K., Fu H. CABNet: category attention block for imbalanced diabetic retinopathy grading. IEEE Trans. Med. Imaging. 2020;40(1):143–153. doi: 10.1109/TMI.2020.3023463. [DOI] [PubMed] [Google Scholar]
- 17.Roychowdhury S., Koozekanani D.D., Parhi K.K. DREAM: diabetic retinopathy analysis using machine learning. IEEE J. Biomed. Health Inform. 2013;18(5):1717–1728. doi: 10.1109/JBHI.2013.2294635. [DOI] [PubMed] [Google Scholar]
- 18.Qi L., Lu X., Li X. Exploiting spatial relation for fine-grained image classification. Pattern Recognit. 2019;91:47–55. [Google Scholar]
- 19.Sopharak A., Uyyanonvara B., Barman S. Automatic exudate detection from non-dilated diabetic retinopathy retinal images using fuzzy C-means clustering. Sensors. 2009;9(3):2148–2161. doi: 10.3390/s90302148. [DOI] [PMC free article] [PubMed] [Google Scholar]
- 20.Seoud L., Chelbi J., Cheriet F. Ophthalmic Medical Image Analysis International Workshop. vol. 2. University of Iowa; 2015. Automatic grading of diabetic retinopathy on a public database. [Google Scholar]
- 21.Nørgaard M.F., Grauslund J. Automated screening for diabetic retinopathy–a systematic review. Ophthalmic Res. 2018;60(1):9–17. doi: 10.1159/000486284. [DOI] [PubMed] [Google Scholar]
- 22.Li T., Bo W., Hu C., Kang H., Liu H., Wang K., Fu H. Applications of deep learning in fundus images: a review. Med. Image Anal. 2021;69 doi: 10.1016/j.media.2021.101971. [DOI] [PubMed] [Google Scholar]
- 23.Vij R., Arora S. A systematic review on diabetic retinopathy detection using deep learning techniques. Arch. Comput. Methods Eng. 2023;30(3):2211–2256. [Google Scholar]
- 24.Van Grinsven M.J., van Ginneken B., Hoyng C.B., Theelen T., Sánchez C.I. Fast convolutional neural network training using selective data sampling: application to hemorrhage detection in color fundus images. IEEE Trans. Med. Imaging. 2016;35(5):1273–1284. doi: 10.1109/TMI.2016.2526689. [DOI] [PubMed] [Google Scholar]
- 25.Li Z., Keel S., Liu C., He Y., Meng W., Scheetz J., Lee P.Y., Shaw J., Ting D., Wong T.Y., et al. An automated grading system for detection of vision-threatening referable diabetic retinopathy on the basis of color fundus photographs. Diabetes Care. 2018;41(12):2509–2516. doi: 10.2337/dc18-0147. [DOI] [PubMed] [Google Scholar]
- 26.Zhang W., Zhong J., Yang S., Gao Z., Hu J., Chen Y., Yi Z. Automated identification and grading system of diabetic retinopathy using deep neural networks. Knowl.-Based Syst. 2019;175:12–25. [Google Scholar]
- 27.Zhou Y., Wang B., He X., Cui S., Shao L. DR-GAN: conditional generative adversarial network for fine-grained lesion synthesis on diabetic retinopathy images. IEEE J. Biomed. Health Inform. 2020;26(1):56–66. doi: 10.1109/JBHI.2020.3045475. [DOI] [PubMed] [Google Scholar]
- 28.Martinez-Murcia F.J., Ortiz A., Ramírez J., Górriz J.M., Cruz R. Deep residual transfer learning for automatic diagnosis and grading of diabetic retinopathy. Neurocomputing. 2021;452:424–434. [Google Scholar]
- 29.Yang Y., Shang F., Wu B., Yang D., Wang L., Xu Y., Zhang W., Zhang T. Robust collaborative learning of patch-level and image-level annotations for diabetic retinopathy grading from fundus image. IEEE Trans. Cybern. 2021;52(11):11407–11417. doi: 10.1109/TCYB.2021.3062638. [DOI] [PubMed] [Google Scholar]
- 30.Zhou Y., Wang B., Huang L., Cui S., Shao L. A benchmark for studying diabetic retinopathy: segmentation, grading, and transferability. IEEE Trans. Med. Imaging. 2020;40(3):818–828. doi: 10.1109/TMI.2020.3037771. [DOI] [PubMed] [Google Scholar]
- 31.Araújo T., Aresta G., Mendonça L., Penas S., Maia C., Carneiro Â., Mendonça A.M., Campilho A. DR| GRADUATE: uncertainty-aware deep learning-based diabetic retinopathy grading in eye fundus images. Med. Image Anal. 2020;63 doi: 10.1016/j.media.2020.101715. [DOI] [PubMed] [Google Scholar]
- 32.Takahashi H., Tampo H., Arai Y., Inoue Y., Kawashima H. Applying artificial intelligence to disease staging: deep learning for improved staging of diabetic retinopathy. PLoS ONE. 2017;12(6) doi: 10.1371/journal.pone.0179790. [DOI] [PMC free article] [PubMed] [Google Scholar]
- 33.Niu Z., Zhong G., Yu H. A review on the attention mechanism of deep learning. Neurocomputing. 2021;452:48–62. [Google Scholar]
- 34.Wang J., Bao Y., Wen Y., Lu H., Luo H., Xiang Y., Li X., Liu C., Qian D. Prior-attention residual learning for more discriminative Covid-19 screening in CT images. IEEE Trans. Med. Imaging. 2020;39(8):2572–2583. doi: 10.1109/TMI.2020.2994908. [DOI] [PubMed] [Google Scholar]
- 35.Li Y.-L., Wang Har-net S. Joint learning of hybrid attention for single-stage object detection. IEEE Trans. Image Process. 2020;29:3092–3103. doi: 10.1109/TIP.2019.2957850. [DOI] [PubMed] [Google Scholar]
- 36.Zhou F., Hu Y., Shen X. Scale-aware spatial pyramid pooling with both encoder-mask and scale-attention for semantic segmentation. Neurocomputing. 2020;383:174–182. [Google Scholar]
- 37.Lin Z., Guo R., Wang Y., Wu B., Chen T., Wang W., Chen D.Z., Wu J. Medical Image Computing and Computer Assisted Intervention–MICCAI 2018: 21st International Conference, Granada, Spain, September 16-20, 2018, Proceedings, Part II 11. Springer; 2018. A framework for identifying diabetic retinopathy based on anti-noise detection and attention-based fusion; pp. 74–82. [Google Scholar]
- 38.Zhao Z., Zhang K., Hao X., Tian J., Chua M.C.H., Chen L., Xu X. 2019 IEEE International Conference on Image Processing (ICIP) IEEE; 2019. BiRA-Net: bilinear attention net for diabetic retinopathy grading; pp. 1385–1389. [Google Scholar]
- 39.Zhao Z., Chopra K., Zeng Z., Li X. 2020 IEEE International Conference on Image Processing (ICIP) IEEE; 2020. Sea-Net: squeeze-and-excitation attention net for diabetic retinopathy grading; pp. 2496–2500. [Google Scholar]
- 40.Li X., Hu X., Yu L., Zhu L., Fu C.-W., Heng Canet P.-A. Cross-disease attention network for joint diabetic retinopathy and diabetic macular edema grading. IEEE Trans. Med. Imaging. 2020;39(5):1483–1493. doi: 10.1109/TMI.2019.2951844. [DOI] [PubMed] [Google Scholar]
- 41.Song R., Cao P., Yang J., Zhao D., Zaiane O.R. 2020 IEEE International Conference on Bioinformatics and Biomedicine (BIBM) IEEE; 2020. A domain adaptation multi-instance learning for diabetic retinopathy grading on retinal images; pp. 743–750. [Google Scholar]
- 42.Rasta S.H., Partovi M.E., Seyedarabi H., Javadzadeh A. A comparative study on preprocessing techniques in diabetic retinopathy retinal images: illumination correction and contrast enhancement. J. Med. Signals Sens. 2015;5(1):40. [PMC free article] [PubMed] [Google Scholar]
- 43.Saini M., Susan S. Diabetic retinopathy screening using deep learning for multi-class imbalanced datasets. Comput. Biol. Med. 2022;149 doi: 10.1016/j.compbiomed.2022.105989. [DOI] [PubMed] [Google Scholar]
- 44.Deng J., Dong W., Socher R., Li L.-J., Li K., Fei-Fei L. 2009 IEEE Conference on Computer Vision and Pattern Recognition. IEEE; 2009. ImageNet: a large-scale hierarchical image database; pp. 248–255. [Google Scholar]
- 45.He K., Zhang X., Ren S., Sun J. Proceedings of the IEEE Conference on Computer Vision and Pattern Recognition. 2016. Deep residual learning for image recognition; pp. 770–778. [Google Scholar]
- 46.Liu W., Anguelov D., Erhan D., Szegedy C., Reed S., Fu C.-Y., Berg A.C. Computer Vision–ECCV 2016: 14th European Conference, Amsterdam, The Netherlands, October 11–14, 2016, Proceedings, Part I 14. Springer; 2016. SSD: single shot multibox detector; pp. 21–37. [Google Scholar]
- 47.Girshick R. Proceedings of the IEEE International Conference on Computer Vision. 2015. Fast R-CNN; pp. 1440–1448. [Google Scholar]
- 48.Li T., Gao Y., Wang K., Guo S., Liu H., Kang H. Diagnostic assessment of deep learning algorithms for diabetic retinopathy screening. Inf. Sci. 2019;501:511–522. [Google Scholar]
- 49.Decencière E., Zhang X., Cazuguel G., Lay B., Cochener B., Trone C., Gain P., Ordonez R., Massin P., Erginay A., et al. Feedback on a publicly distributed image database: the messidor database. Image Anal. Stereol. 2014;33(3):231–234. [Google Scholar]
- 50.2019. https://www.kaggle.com/c/aptos2019-blindness-detection Aptos 2019 blindness detection challenge.
- 51.2020. https://www.kaggle.com/c/diabetic-retinopathy-detection Kaggle diabetic retinopathy detection competition.
- 52.Sánchez C.I., Niemeijer M., Dumitrescu A.V., Suttorp-Schulten M.S., Abramoff M.D., van Ginneken B. Evaluation of a computer-aided diagnosis system for diabetic retinopathy screening on public data. Investig. Ophthalmol. Vis. Sci. 2011;52(7):4866–4871. doi: 10.1167/iovs.10-6633. [DOI] [PubMed] [Google Scholar]
- 53.Wang Z., Yin Y., Shi J., Fang W., Li H., Wang X. Medical Image Computing and Computer Assisted Intervention- MICCAI 2017: 20th International Conference, Quebec City, QC, Canada, September 11-13, 2017, Proceedings, Part III 20. Springer; 2017. Zoom-in-Net: deep mining lesions for diabetic retinopathy detection; pp. 267–275. [Google Scholar]
- 54.Kingma D.P., Ba Adam J. A method for stochastic optimization. 2014. arXiv:1412.6980 arXiv preprint.
- 55.Hu J., Shen L., Sun G. Proceedings of the IEEE Conference on Computer Vision and Pattern Recognition. 2018. Squeeze-and-excitation networks; pp. 7132–7141. [Google Scholar]
- 56.Hou Q., Zhou D., Feng J. Proceedings of the IEEE/CVF Conference on Computer Vision and Pattern Recognition. 2021. Coordinate attention for efficient mobile network design; pp. 13713–13722. [Google Scholar]
- 57.Woo S., Park J., Lee J.-Y., Kweon I.S. Proceedings of the European Conference on Computer Vision (ECCV) 2018. CBAM: convolutional block attention module; pp. 3–19. [Google Scholar]
- 58.Wang X., Xu M., Zhang J., Jiang L., Li L. Proceedings of the AAAI Conference on Artificial Intelligence. vol. 35. 2021. Deep multi-task learning for diabetic retinopathy grading in fundus images; pp. 2826–2834. [Google Scholar]
- 59.Wang X., Xu M., Zhang J., Jiang L., Li L., He M., Wang N., Liu H., Wang Z. Joint learning of multi-level tasks for diabetic retinopathy grading on low-resolution fundus images. IEEE J. Biomed. Health Inform. 2021;26(5):2216–2227. doi: 10.1109/JBHI.2021.3119519. [DOI] [PubMed] [Google Scholar]
- 60.Gu Z., Li Y., Wang Z., Kan J., Shu J., Wang Q., et al. Classification of diabetic retinopathy severity in fundus images using the vision transformer and residual attention. Comput. Intell. Neurosci. 2023:2023. doi: 10.1155/2023/1305583. [DOI] [PMC free article] [PubMed] [Google Scholar]
- 61.Zhao S., Wu Y., Tong M., Yao Y., Qian W., Qi S. CoT-XNet: contextual transformer with Xception network for diabetic retinopathy grading. Phys. Med. Biol. 2022;67(24) doi: 10.1088/1361-6560/ac9fa0. [DOI] [PubMed] [Google Scholar]
- 62.Seoud L., Hurtut T., Chelbi J., Cheriet F., Langlois J.P. Red lesion detection using dynamic shape features for diabetic retinopathy screening. IEEE Trans. Med. Imaging. 2015;35(4):1116–1126. doi: 10.1109/TMI.2015.2509785. [DOI] [PubMed] [Google Scholar]
- 63.Sugeno A., Ishikawa Y., Ohshima T., Muramatsu R. Simple methods for the lesion detection and severity grading of diabetic retinopathy by image processing and transfer learning. Comput. Biol. Med. 2021;137 doi: 10.1016/j.compbiomed.2021.104795. [DOI] [PubMed] [Google Scholar]
- 64.Islam M.R., Abdulrazak L.F., Nahiduzzaman M., Goni M.O.F., Anower M.S., Ahsan M., Haider J., Kowalski M. Applying supervised contrastive learning for the detection of diabetic retinopathy and its severity levels from fundus images. Comput. Biol. Med. 2022;146 doi: 10.1016/j.compbiomed.2022.105602. [DOI] [PubMed] [Google Scholar]
- 65.Guo X., Li X., Lin Q., Li G., Hu X., Che S. Joint grading of diabetic retinopathy and diabetic macular edema using an adaptive attention block and semisupervised learning. Appl. Intell. 2022:1–16. [Google Scholar]
- 66.Wu Z., Shi G., Chen Y., Shi F., Chen X., Coatrieux G., Yang J., Luo L., Li S. Coarse-to-fine classification for diabetic retinopathy grading using convolutional neural network. Artif. Intell. Med. 2020;108 doi: 10.1016/j.artmed.2020.101936. [DOI] [PubMed] [Google Scholar]
- 67.Li H., Dong X., Shen W., Ge F., Li H. Resampling-based cost loss attention network for explainable imbalanced diabetic retinopathy grading. Comput. Biol. Med. 2022;149 doi: 10.1016/j.compbiomed.2022.105970. [DOI] [PubMed] [Google Scholar]
Associated Data
This section collects any data citations, data availability statements, or supplementary materials included in this article.
Data Availability Statement
Data included in article/supp. material/referenced in article.