

Abstract
Late chronotype, which often leads to higher social jetlag (SJL), is strongly associated with the prevalence of smoking. Any circadian disruption, strain, or misalignment, results in people not being able to live according to their biological time as is described by SJL, which we will therefore use as umbrella term. We hypothesized two scenarios potentially explaining the association between smoking and SJL: (A) If smoking delays the clock, circadian phase should advance upon quitting. (B) If people smoke more to compensate the consequences of SJL, circadian phase should not change upon quitting. To distinguish between these two hypotheses, we accompanied participants of a smoking cessation program (not involving nicotine replacement products) across the cessation intervention (3 weeks prior and 6 weeks after) by monitoring their circadian behavior, sleep quality, and daytime sleepiness via questionnaires and actimetry. Our results show no effects of cessation on SJL, chronotype, sleep quality, or daytime sleepiness, thereby favoring scenario (B). Thus, smoking may be a consequence of rather than a cause for SJL. Daytime sleepiness was a significant predictor for the outcome in our model but did not improve with cessation.
Keywords: cessation, sleep, owls, larks, addiction
Despite further declines in global tobacco use, the World Health Organization (WHO) estimated in their latest 2019 report rising numbers of tobacco-consumption-related diseases and deaths. Considering these prolonged effects and that a projected 17.1% of the world’s population will still smoke in 2025, the importance of investigating effects of smoking and expanding our knowledge on successful cessation cannot be stressed enough (WHO, 2019). Our study contributes to this by further investigating the relationship between smoking and circadian sleep-wake behavior. Previous studies reported a higher prevalence of smoking among late chronotypes, that is, people whose circadian clocks synchronize late in reference to the light-dark cycle (Adan, 1994; Antypa et al., 2016; Fabbian et al., 2016; Kwon and Lee, 2022; Suh et al., 2017; Wittmann et al., 2006). In these studies, chronotype was assessed either via the Munich Chronotype Questionnaire (MCTQ), which evaluates chronotype as the phase-relationship between individual circadian system and signals of the cyclic environment (zeitgebers) (Roenneberg et al., 2003), or the Morningness-Eveningness-Questionnaire, which is a psychological assessment of diurnal preference (Horne and Ostberg, 1976). Lower sleep quality and disrupted sleep architecture have also been reported in smokers (Hu et al., 2007; Jaehne et al., 2012; Phillips and Danner, 1995; Wetter and Young, 1994).
The human clock actively synchronizes to specific zeitgebers, of which light is the predominant one for most organisms, including humans (Duffy and Wright, 2005; Roenneberg et al., 2007; Wright et al., 2013). The phase-relationship between the circadian clock and the zeitgeber is called phase of entrainment (PoE). In humans, this PoE is often called “chronotype,” which is almost normally distributed in populations, varies between people and conditions and ranges from extreme early chronotypes (“larks”) to extreme late chronotypes (“owls”). The timing of most functions is aligned with chronotype, including the timing of sleep (Roenneberg et al., 2007).
Chronotype has been discussed as a psychological trait (i.e. independent of situational effects) (Steyer et al., 1992), assessible by measuring diurnal preferences (Horne and Ostberg, 1976). Human clocks under real-life conditions, however, often face greatly varying entrainment conditions and are able to adapt. We therefore view chronotype as a biological state-trait-interaction. We regard chronotype as a surrogate for PoE. Like PoE, chronotype dynamically adapts to external zeitgeber cycles and reflects the entire organism’s overall temporal organization under entrained conditions. The variation of these conditions contributes to the variance in chronotype, as do genes and age (Roenneberg et al., 2019).
Modern lifestyle deprives people of both natural light during the day (e.g. by mostly living indoors) and darkness during the night (use of artificial light) (Roenneberg et al., 2003). The strength of light as a zeitgeber has therefore drastically decreased, thereby delaying most chronotypes (with the exception of extreme larks) and increasing the gap between larks and owls (Wright et al., 2013). The increasing mismatch between the internal and external clock has become a stressor for the majority of the population (Roenneberg et al., 2015), leads to so-called social jetlag (SJL) and consequently to sleep debt over the course of the workweek, which is often compensated for on weekends (Wittmann et al., 2006). Here, we use the umbrella term SJL for all kinds of circadian disruptions, misalignments, mismatches, or strains.
Suffering from chronic SJL is associated with numerous health risk factors, for example, increased risk of metabolic illness, depressive symptoms, and addiction behavior (Antypa et al., 2016; Broms et al., 2012; Levandovski et al., 2011; Parsons et al., 2015; Roenneberg et al., 2012). The strong positive correlation between SJL and the probability of being a smoker (Wittmann et al., 2006) is of particular interest for our investigation, but we do not know whether smoking delays the circadian clock, thereby increasing SJL, or whether SJL fosters smoking, for example as a coping strategy.
We followed people through the process of quitting smoking without nicotine replacement therapy, while measuring behavioral outputs of the clock before and after cessation to compare potential effects of tobacco abstinence. We hypothesized that if smoking delays the clock, people’s circadian phase should advance when they stop (A). If people remained the same chronotype after quitting, the second alternative (B), smoking to compensate for consequences of SJL, would be more likely.
Methods
Design and Cohort
Study Design
Participants of a smoking cessation program at the Tobacco Outpatient Clinic of the Psychiatric Clinic at the LMU Munich were recruited through newspaper advertisement and the LMU online newsletter between October 2014 and March 2016. The course consisted of six weekly group appointments and was based on the smoke free manual developed by the Institute for Therapy Research in Munich (IFT) (Kröger and Gradl, 2007; Kufeld and Bühringer, 2010). The manual determines that the group will try to quit smoking collectively at the week 4 meeting of participation. After the course, participants were monitored for three more weeks (total investigation period: 9 weeks). During the sixth and seventh week, subjects engaged in two phone interviews carried out by the study team. A final group appointment was scheduled at the end of the ninth week (appointment 9).
Several measurements were taken during the first and last appointment: questionnaires regarding chronotype, sleep habits and quality, tobacco dependency, and smoking habits. Subjects were given actimeters for continuous measurement of their activity (9 weeks). At each appointment, expiratory carbon monoxide (eCO) levels were assessed, and the Nicotine Use Inventory (NUI) Questionnaire was filled in by the subject. The NUI was also administered by the study team during phone interviews (appointment 7 & 8). The time period before the cessation intervention is called T0, while the period of time after the intervention is called T1 (see Figure 1 for more detail).
Figure 1.

Study design. * = Day of quitting, ** = eCO (expiratory CO) levels measured weekly except for week 7 and 8, *** = Nicotine Use Inventory (NUI) administered weekly at group or phone appointment. Forty-nine subjects completed the study, total duration of study = 9 weeks, duration of cessation program = 6 weeks, phone interviews in week 7 and 8. Continuous monitoring of locomotor activity via actimetry: 9 weeks. All questionnaires (except for the NUI) were administered once at the beginning and once at the end of the study. Expiratory CO measured at the end of every appointment; NUI administered at every appointment.
All participants gave their informed, written consent. The study was approved by the Ethics Committee of the LMU (approval #508-14) and conducted in accordance with the Declaration of Helsinki.
Criteria and Sample Size
An a priori power analysis was performed using G*Power3 to determine the required sample size (t-test to test the difference between two dependent means, two-tailed) (Faul et al., 2007, 2009). Alpha was set to .05. With an effect size of d = 0.5, the sample size was 54, while with an effect size of d = 0.6, the required sample size was 39. We therefore aimed to recruit between 39 and 54 participants.
Our exclusion criteria were shift-workers and individuals with other nonstandard weekly schedule (i.e. five workdays and two work-free days), patients diagnosed with a psychiatric or neurological illness (other than tobacco use disorder), individuals who came back from a trans-meridian flight 3 months prior to participation.
Time Changes
The following time changes occurred during our study: 21 participants went into daylight saving time (DST). Twelve participants extended with their last 2 days into DST (questionnaires were administered before the transition weekend and the hanging days were excluded from activity recordings). Nine participants were recorded for 5 weeks in standard time (ST) and 4 weeks in DST; six subjects spent 2 weeks in DST and 7 weeks in ST. In these cases, we excluded 7 days after the time change from activity recordings. Included data are expressed in local time. We conducted the analysis both with corrected (=adjusted to local time) and uncorrected data, which had no effect on the results regarding direction and significance. We therefore conclude that our observations are not due to DST-related corrections. Here, we report results produced with corrected data.
Abstinence
Abstinence was defined as stating not to have smoked during the past 7 days on each NUI and eCO-levels ≤ 5 ppm, indicating a verification of the self-reports (Middleton and Morice, 2000; Javors et al., 2005; Kapusta et al., 2010; West et al., 2005; Patrick et al., 1994). Subjects with eCO-values > 5 ppm and/or self-reported smoking were assigned to the so called “continue” group, while those who met abstinence criteria were assigned to the so called “quit” group.
Interventions and Measurements
Cessation Program
The smoke free manual uses elements of cognitive behavioral therapy and motivational therapy (Kröger and Gradl, 2007). Concepts of behavioral therapy, especially in the group setting, have been shown to be effective in smoking cessation (Stead et al., 2017).
Actimetry
The actimeter is a wrist-worn device, measuring locomotor activity via an integrated accelerometer. The devices (Daqtometers by Daqtix GmbH) were worn continuously for the total study duration. Activity was recorded at 1 Hz; the average activity counts stored every 30 sec, and data were averaged into 10 min bins for further analyses. These data give insight into the daily phase of general locomotor activity using the ChronoSapiens-software (Chronsulting UG) (Roenneberg et al., 2015). The acrophase of the daily activity profiles (maximum of 1-harmonic, 24 h cosine fit; abbreviated here as “Phi”: ψact) representing activity’s daily “center of gravity.” We excluded days from the analysis that contained more than 1 h of missing data. For the analysis of predictability of outcome via ψact, daily ψact values were averaged across 3-week sections in each individual, resulting in ψact-pre for weeks 1 to 3 (prior to cessation), ψact-cess for weeks 4 to 6 and ψact-post for weeks 7 to 9 (both postcessation) per subject. For analysis of associations between number of smoked cigarettes and actimetry data, the daily ψact values were averaged across each week in each individual, resulting in the variable ψact-week. Data are expressed in local time.
Questionnaires
Demographic Data/General Questionnaire
Participants filled in a general questionnaire for demographic data, assessing personal and educational information, smoking method (e.g. pre-manufactured or hand-rolled cigarettes) and stimulant use (caffeine/alcohol consumption, psycho-/neuropharmacological medication; yes- or no-answers) (Table 1).
Table 1.
Sample characteristics.
| All participants, n | % | Quit group, n | % | Continue group, n | % | Dropouts, n | |
|---|---|---|---|---|---|---|---|
| Total | 49 | 22 | 27 | 2 | |||
| Female | 32 | 65.31 | 14 | 63.64 | 18 | 66.67 | 2 |
| Male | 17 | 34.69 | 8 | 36.36 | 9 | 33.33 | 0 |
| Average age ± SD | 46.02 ± 12.16 | 45.91 ± 11.40 | 46.11 ± 12.97 | 56.00 ± 4.24 | |||
| Age range | 23-69 | 23-69 | 25-69 | 53-59 | |||
| Primary-level education a | 9 | 18.37 | 4 | 18.18 | 5 | 18.52 | |
| Secondary-level education a | 40 | 81.63 | 18 | 81.82 | 22 | 81.48 | |
| Single/separated/divorced/widowed | 28 | 57.14 | 12 | 54.55 | 16 | 59.26 | |
| Married/partnership | 21 | 42.86 | 10 | 45.45 | 11 | 40.74 | |
| Smoke-free environment T0 b | 35 | 71.43 | 14 | 63.64 | 21 | 77.78 | |
| Not smoke-free environment T0 | 14 | 28.57 | 8 | 36.36 | 6 | 22.22 | |
| Smoke-free environment T1 b | 38 | 77.55 | 18 | 81.82 | 20 | 74.07 | |
| Not smoke-free environment T1 | 9 | 18.37 | 4 | 18.18 | 5 | 18.52 | |
| Fagerström T0 | |||||||
| 0-2 | 3 | 13.64 | 4 | 14.81 | |||
| 3-5 | 13 | 59.09 | 19 | 70.37 | |||
| 6-7 | 5 | 22.73 | 3 | 11.11 | |||
| 8-10 | 1 | 4.55 | 1 | 3.7 | |||
| Fagerström T1 | |||||||
| 0-2 | 22 | 100.00 | 11 | 40.74 | |||
| 3-5 | — | — | 9 | 33.33 | |||
| 6-7 | — | — | 3 | 11.11 | |||
| 8-10 | — | — | — | — | |||
Primary-level education at German school level included the following categories: attended primary school (Hauptschule) or dropped out. Secondary-level education at German school level included: higher secondary school (Gymnasium), lower secondary school (Realschule). bT0 = before planned cessation, T1 = after planned cessation.
Munich Chronotype Questionnaire
The MCTQ was developed by Roenneberg et al. (2003) and asks simple questions about sleep-wake behavior separately for work- and work-free days. It has been validated in various studies against actimetry and biochemical measurements of the circadian clock (Kantermann et al., 2015; Kitamura et al., 2014; Pilz et al., 2018). The MCTQ has been used since the year 2003, thus generating large amounts of valuable information on individuals’ sleep-wake behavior (the MCTQ database currently comprises close to 300.000 entries and was used in this study to compare sample and population data). It uses sleep timing to approximate the circadian state or chronotype of an individual. Work-free days are considered to be affected less by constraints on sleep timing due to specific schedules or social demands. Therefore, the midpoint between sleep onset and sleep end on a work-free day, further corrected for possible sleep debt accumulated during the workweek, is calculated to represent chronotype (MSFsc). In this study, the MSFsc was only calculated when the subject did not use an alarm clock, since MSFsc calculation relies on having free days, which are not spent according to given (work-) schedules. SJL describes the difference of sleep timing between work and work-free days (MSF − MSW). We used the standard German version. Data are expressed in local time. More information on the MCTQ is available at: http://thewep.org/documentations/mctq.
Pittsburgh Sleep Quality Index
The Pittsburgh Sleep Quality Index (PSQI) has been validated in multiple studies (Buysse et al., 1989; Carpenter and Andrykowski, 1998; Grandner et al., 2006; Mollayeva et al., 2016). Subjects report on and rate their subjective sleep quality over the last 4 weeks, report on daytime sleepiness and specify use of sleep medication. Addition of component scores, generates an overall score ranging from 0 to 21 points with higher scores indicating worse sleep quality. The general cut-off separating good from poor sleep quality is set at >5.
Epworth Sleepiness Scale
The Epworth Sleepiness Scale (ESS) was developed in 1991 and updated in 1997 (the updated version was used here) (M. Johns and Hocking, 1997; M. W. Johns, 1991, 1992). Subjects are asked to rate their usual chances of dozing off or falling asleep while engaged in different activities. The ESS score (sum of all item scores) ranges from 0 to 24. The higher the score, the higher the probability and extend of daytime sleepiness. Global ESS scores above 5 indicate higher daytime sleepiness and scores above 10 indicate excessive daytime sleepiness.
Nicotine Use Inventory
The NUI has previously been used to assess continuous nicotine abstinence (Tonstad et al., 2006; Koegelenberg et al., 2014). Five initial questions assess the consumption of cigarettes and other nicotine containing products during the past 7 days (yes-/no-answers). The last two questions assess the quantity of smoked cigarettes through free text answers. We used the NUI to determine successful smoking cessation in addition to eCO measurements. If participants answered questions 1 through 4 with “no” and question 7 with “0,” it was used as evidence of self-reported nicotine abstinence of the past 7 days. Any other answers on the NUI indicated that the subject had smoked or been exposed to nicotine (see section on abstinence for more detail). The estimated amount of weekly consumption was generated through multiplication (×7) of the average daily number of smoked cigarettes derived from the weekly NUI. The full German NUI and an English translation are provided in the Supplementary Material.
Expiratory Carbon Monoxide Measurements (eCO Measurements)
The expiratory carbon monoxide levels (in parts per million/ppm) were measured at each weekly personal appointment using the Bedfont EC50-MICRO CO monitor smokerlyser (Bedfont Instruments; Kent, United Kingdom). These eCO levels were used, along with NUI results, to determine abstinence since eCO levels have been reported to correlate well with the number of smoked cigarettes (Deveci et al., 2004). Ambient CO-levels were assessed before the measurements and ranged between 0 and 3 ppm.
Assessment Dim Light Melatonin Onset
Dim Light Melatonin Onset (DLMO) is a gold-standard for measuring the timing of synchronization via a biological marker. Therefore, multiple saliva samples to measure melatonin and assess DLMO were gathered from every subject once during T0 (week 2) and once during T1 (week 9). Participants were instructed to self-collect hourly samples at home. Unfortunately, the samples were not analyzable due to two main problems: (1) many participants were not able to collect sufficient amounts of saliva using the salivettes and lower salivary flow rates in smokers compared to nonsmokers have been reported (Rad et al., 2010) and (2) due to a freezer breakdown in our laboratory the majority of samples was lost.
Statistical Analysis
Statistical analyses were performed using R, SPSS Statistics 26 & 27 and Excel 2011 & 2018 for Macintosh. Figures were generated using Prism 8 and R using the package ggplot2 (Wickham et al., 2016).
Statistical Hypotheses Tests
Based on the distribution of variables, which was assessed via Shapiro-Wilk tests and visual inspection of histograms, statistical hypotheses tests were chosen to compare questionnaire data in the respective samples and between time points (Hinkle et al., 2003). The Wilcoxon signed rank test was used to compare related sample variables and the Mann-Whitney U-test for unrelated sample variables. Nonparametric tests were chosen because the distribution of variables was largely nonnormal. The Wilcoxon signed rank test was performed on subjects with complete data. Therefore, when data were lost during follow-up, the case was excluded (MCTQ: five participants of continue group were lost to follow-up, ESS & PSQI: four participants of continue group were lost to follow-up). The alpha-level was set to 0.05 and, due to multiple testing, the Bonferroni correction was applied, leading to new significance levels: for MSFsc, SJL, PSQI and ESS = 0.01 (Abdi, 2007; Noble, 2009).
Generalized Estimating Equations
To account for the longitudinal data (time point and continuous data), we used Generalized Estimating Equation (GEE) models with a logit link function and an unstructured matrix (Liang and Zeger, 1986).
We used GEE to investigate the relationship of cessation status (during T0 & T1) and ψact and results from the administered questionnaires. GEE was also used to test the predictability of cessation status by ψact (during T0 and T1). ψact values, along with age and sex, were tested as predictors of the outcome (successful cessation or continuing to smoke)—called “group.” Results were controlled for age, sex, smoking method, and stimulants, the pre-post study design was also considered in the model. The distribution was specified as binomial regarding outcome analyses. Potential effects of group or time point as well as interaction effects of group and time point in regard to (possible changes in) questionnaire data, while controlling for age, sex, smoking method, and stimulant use were also examined via GEE. Variables were coded as follows: quit group = 0, continue group = 1, male = 0, female = 1, T0 = 0, T1 = 1. Caffeine: yes = 1, no = 0; alcohol: yes = 1, no = 0, medication: yes = 1, no = 0, premanufactured cigarettes = 0, hand-rolled cigarettes = 1. All other included variables are continuous.
Binary Logistic Regression
To investigate the predictability of outcome by noncontinuous data, such as questionnaire variables (MSFsc, SJL, PSQI, and ESS overall scores), number of smoked cigarettes, age, sex, smoking method, and stimulant use, we conducted a binary logistic regression analysis. MSFsc and SJL, as well as overall PSQI and ESS scores (each during T0 and T1) were tested. Variables were coded as follows: male = 0, female = 1, quit group = 0, continue group = 1, T0 = 0, and T1 = 1. Stimulant use (further specified for substance): yes = 1, no = 0, premanufactured cigarettes = 0, hand-rolled cigarettes = 1. All other variables are continuous.
Results
Sample Characteristics
We recruited 51 subjects for this study: 2 participants withdrew after the first appointment and 49 subjects completed the study (in separate groups, 3-12 participants at a time). Their age ranged from 23 to 69 years (median = 47.00), and the cohort consisted of 32 women and 17 men.
On average (mean ± SD), participants scored 4.47 ± 1.84 in the Fagerström Test for Nicotine Dependence (FTND), smoked 16 ± 6 cigarettes/day and had been smoking for 27 ± 11.86 years. Almost 80% of participants smoked premanufactured cigarettes, while the rest hand-rolled them. The majority of participants reported having tried to quit smoking before (47 of 49) but except for one participant, without supervision. Other participants had used self-help literature (38.78%) or nicotine replacement products (24.49%). None of the participants took neuro- or psychopharmacological medication. Caffeine (coffee and caffeinated drinks) and alcohol intake were assessed as occurring regularly over the past 4 weeks (yes-/no-answers: 76.4% drank caffeine regularly, 67.3% drank alcohol regularly). More detailed sample characteristics can be obtained from Table 1.
Participants who successfully quit smoking during the program and remained abstinent to the end of the study (no relapses or grace period) form the “quit” group (45%), while the rest form the “continue” group (55%). Data on sociodemographic characteristics of both groups are shown in Table 1. Age, sex, and educational level were similar across groups.
Sufficient data to calculate the different ψact for all the 3-week periods was available in 38 participants (25 female, age range: 23-69 years, age mean ± SD: 44.79 ± 12.52, successful cessation in 19 participants).
Complete questionnaire data were available in 44 participants (30 female, age range: 23-69 years, age mean ± SD: 45.64 ± 12.63, successful cessation in 22 participants).
Continuous and Discrete Time Point Data Comparisons
For comparison between the two time points as well as between groups, MSFsc and SJL (MCTQ), PSQI and ESS overall scores were investigated using either the Wilcoxon signed rank test or the Mann-Whitney U-test. All results were non-significant (for more detail, see Figures 2-5 for MSFsc, SJL, PSQI, and ESS scores and Supplementary Table S1 for detailed calculations on all variables).
Figure 2.

MSFsc compared between study periods and groups. G1 = quit group, G2 = continue group, T0 = before attempt at cessation, T1 = after attempt at cessation. Each data point represents an individual result. Error bars indicate interquartile range Q1-Q3. Variables in the continue group during T0 follow a normal distribution; all other variables are not normally distributed. Comparisons of MSFsc during T0 and T1 within and across groups: MSFsc quit group during T0 and T1 Wilcoxon signed-rank test: p = 0.158, N = 22. MSFsc continue group during T0 and T1. Wilcoxon signed-rank test: p = 0.884, N = 22. MSFsc of both groups during T0. Mann-Whitney U-test: p = 0.345. MSFsc of both groups during T1. Mann-Whitney U-test: p = 0.606. Abbreviation: MSFsc = mid-sleep on free days corrected for sleep debt.
Figure 3.
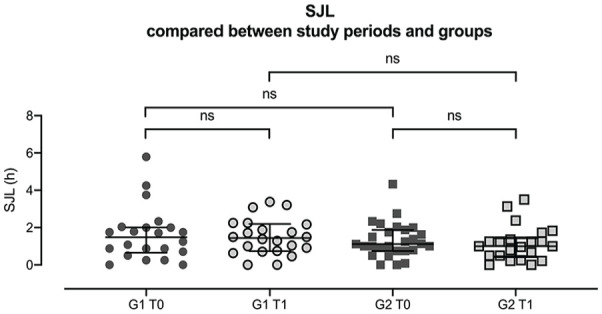
SJL compared between study periods and groups. G1 = quit group, G2 = continue group, T0 = before attempt at cessation, T1 = after attempt at cessation. Each data point represents an individual result. Error bars indicate interquartile range Q1-Q3. Variables in the continue group during T0 follow a normal distribution; all other variables are not normally distributed. Comparisons of SJL during T0 and T1 within and across group: SJL of quit group during T0 and T1. Wilcoxon signed-rank test: p = 0.931, N = 22. SJL of continue group during T0 and T1. Wilcoxon signed-rank test: p = 0.171, N = 22. SJL of both groups during T0. Mann-Whitney U-test: p = 0.673. SJL of both groups during T1. Mann-Whitney U-test: p = 0.159. Abbreviation: SJL = social jetlag.
Figure 4.
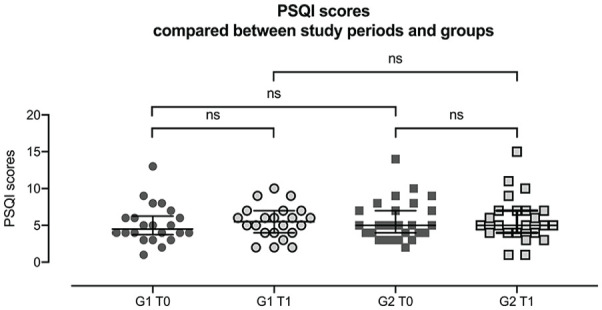
PSQI overall scores compared between study periods and groups. G1 = quit group, G2 = continue group, T0 = before attempt at cessation, T1 = after attempt at cessation. Each data point represents an individual result. Error bars indicate interquartile range Q1-Q3. Variables in continue group during T0 are normally distributed, all other variables are not normally distributed. Comparison of PSQI results during T0 and T1 within and across groups: PSQI scores of quit group during T0 and T1. Wilcoxon signed-rank test: p = 0.468, N = 22. PSQI scores of continue group during T0 and T1. Wilcoxon signed-rank test: p = 0.967; N = 23. PSQI results of both groups during T0. Mann-Whitney U-test: p = 0.563. PSQI results of broth groups during T1. Mann-Whitney U-test: p = 0.936. Abbreviation: PSQI = Pittsburgh Sleep Quality Index.
Figure 5.
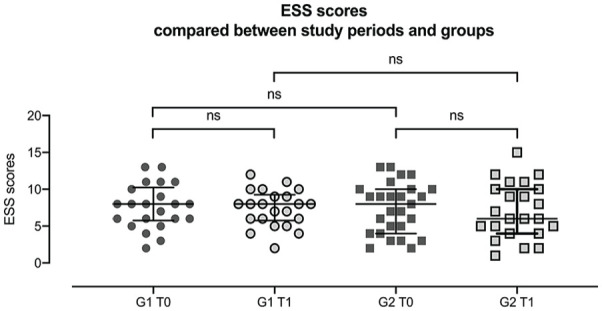
ESS overall scores compared between study periods and groups. G1 = quit group, G2 = continue group, T0 = before attempt at cessation, T1 = after attempt at cessation. Each data point represents an individual result. Error bars indicate interquartile range Q1-Q3. All variables follow a not normal distribution. Comparison of ESS scores at T0 and T1 within and across group: ESS scores of quit group during T0 and T1. Wilcoxon signed-rank test: p = 0.896, N = 22. ESS scores of continue group during T0 and T1. Wilcoxon signed-rank test: p = 0.909, N = 23. ESS results of both groups during T0. Mann-Whitney U-test: p = 0.841. ESS results of both groups during T1. Mann-Whitney U-test: p = 0.665. Abbreviation: ESS = Epworth Sleepiness Scale.
Individual values and their trajectories (and corresponding percentages) of MSFsc and SJL were calculated whenever MCTQ data were available both at T0 and T1. The distribution and direction of changes (advanced or delayed MSFsc; increase or decrease of SJL) was largely even across the groups. Calculated effect sizes, regarding the differences between time points for MSFsc and SJL in the two groups separately, were small. About 56.82% of all participants advanced their MSFsc, while the others delayed. The overall average advance equaled about 6 minutes (Mean ± SD: −0.11 ± 0.76 h; range: −2.16 to 2.08 h). About 52.27% showed a decrease in SJL, which on average was about 9 minutes (Mean ± SD: −0.16 ± 0.72 h; range: −2.58 to 1.00 h). In the quit group, 14 subjects (63.63 %) showed an advance of MSFsc from T0 to T1, while 8 subjects delayed (effect size MSFsc quit group, T1-T0: d = −0.37). Eleven successful (50.00 %) participants decreased in SJL, while 10 showed an increase in SJL values and 1 participant showed no SJL changes (effect size SJL quit group, T1-T0: d = −0.15). In the continue group, 11 subjects (50.00%) showed an advance of MSFsc, which was counterbalanced by 11 subjects who delayed (effect size MSFsc continue group, T1-T0: d = 0.05). In terms of SJL, 12 subjects (54.54 %) showed decreasing SJL values, while seven increased and SJL in three subjects remained unchanged (effect size SJL continue group, T1-T0: d = −0.35). Questionnaire data were insufficient for trajectory calculation in five members of the continue group.
The GEE analysis (controlled for age, sex, caffeine, alcohol, smoking method), revealed no effects of cessation status on actimetry or questionnaire data, which showed no significant differences over the investigation periods (pre-cess-post). Phase of activity (ψact)—measured prior to the intervention—also did not predict cessation success (for detailed results see Table 2). We further used the GEE approach to probe whether there were effects of group or time point as well as interaction effects of group*time point regarding questionnaire results (MSFsc, SJL or PSQI and ESS scores). A significant interaction would suggest different trajectories between groups in the questionnaire outcomes. There was no significant effect of group, time point, or group*time point detectable (detailed results can be found in Supplemental Table S3 and Supplemental Figures S1-S4). Both MSFsc and ψactwere significantly associated to age (p < 0.05). The model revealed associations of both MSFsc and ψact to age (p < 0.05) and associations between chronotype (MSFsc) and SJL (MSFsc = f (SJL): p < 0.001, SJL = f (MSFsc): p < 0.05) across investigation periods.
Table 2.
GEE Analysis: prediction of cessation status and relationships between variables. a
| Test | β | OR | SE | 95% CI of OR | p | QICC |
|---|---|---|---|---|---|---|
| Prediction of cessation status by (. . .) | 61.39 | |||||
| age | −0.02 | 0.978 | 0.030 | [0.92-1.04] | .457 | |
| sex | −0.62 | 0.541 | 0.771 | [0.12-2.45] | .426 | |
| ψact-pre week 1 -3 | −0.05 | 0.953 | 0.314 | [0.52-1.76] | .879 | |
| ψact-cess week 4 -6 | −0.13 | 0.875 | 0.493 | [0.33-2.30] | .786 | |
| Relationship between ψact and (. . .) | 231,82 | |||||
| cessation status | −0.60 | 0.551 | 0.442 | [0.23-1.31] | .177 | |
| age | −0.03 | 0.968 | 0.015 | [0.94-0.99] | .029 * | |
| sex | −0.71 | 0.491 | 0.466 | [0.20-1.22] | .127 | |
| Relationship between MSFsc and (. . .) | 98.61 | |||||
| cessation status | 0.16 | 1.175 | 0.301 | [0.65-2.12] | .592 | |
| age | −0.04 | 0.965 | 0.012 | [0.94-0.99] | .003 ** | |
| sex | −0.19 | 0.824 | 0.295 | [0.46-1.47] | .510 | |
| SJL | 0.51 | 1.662 | 0.128 | [1.29-2.13] | < .001*** | |
| Relationship between SJL and (. . .) | 88.89 | |||||
| cessation status | 0.19 | 1.207 | 0.248 | [0.73-1.99] | .461 | |
| age | −0.002 | 0.998 | 0.012 | [0.97-1.02] | .837 | |
| sex | −0.19 | 1.211 | 0.267 | [0.72-2.04] | .474 | |
| MSFsc | 0.45 | 1.567 | 0.147 | [1.18-2.09] | .002** | |
| Relationship between PSQI and (. . .) | 618.71 | |||||
| cessation status | −0.48 | 0.517 | 0.676 | [0.16-2.32] | .476 | |
| age | 0.05 | 1.055 | 0.036 | [0.98-1.13] | .135 | |
| sex | −0.13 | 0.875 | 0.658 | [0.24-3.18] | .840 | |
| ESS score | 0.04 | 1.042 | 0.080 | [0.89-1.22] | .604 | |
| Relationship between ESS and (. . .) | 884.44 | |||||
| cessation status | 0.36 | 1.440 | 0.814 | [0.29-7.11] | .654 | |
| age | 0.01 | 1.006 | 0.031 | [0.95-1.07] | .832 | |
| sex | −1.13 | 0.324 | 0.883 | [0.06-1.83] | .203 | |
| PSQI score | 0.03 | 1.036 | 0.140 | [0.79-1.36] | .800 |
Unstructured correlation matrix. Abbreviations: OR = odds ratio; SE = standard error; CI = confidence interval; QICC = corrected quasi likelihood under independence model criterion; PSQI = Pittsburgh Sleep Quality Index; ESS = Epworth Sleepiness Scale; MSFsc = mid-sleep on free days corrected for sleep debt; SJL = social jetlag..
The model was additionally adjusted for caffeine-, alcohol-consumption and smoking method (premanufactured or hand-rolled cigarettes). Significant predictions and relationships: Prediction of cessation status by age (p = .029). Relationship between MSFsc and age (p = .003). Relationship between MSFsc and SJL (p = <.001). Relationship between SJL and MSFsc (p = .002).
p ≤ 0.05, **p ≤ 0.01, ***p ≤ 0.001, Bonferroni correction.
Prediction of Outcome
Binary logistic regression analysis was performed, testing whether cessation success could be predicted by variables gathered at study onset: age, sex, caffeine-/alcohol-intake, smoking method, number of smoked cigarettes, MSFsc, SJL, PSQI, and ESS overall scores. Model assumptions such as the absence of multicollinearity, linearity of independent variables and lack of outliers, were tested beforehand (Stoltzfus, 2011). No model assumptions were violated, and some variables were analyzed separately because many were highly correlated (correlations occurred for MSFsc and SJL, MSFsc and age, SJL and age, PSQI and ESS, sex and number of cigarettes, and age and sex). Only ESS overall scores contributed significantly to the model (i.e. prediction of cessation), with lower scores predicting continuing to smoke. Detailed results can be obtained from Table 3.
Table 3.
Binary logistic regression analysis of outcome prediction and model evaluation. a
| Predictor | β | SE β | Wald χ2 | df | p | OR | CI for OR |
|---|---|---|---|---|---|---|---|
| MSFsc T0 b | −.252 | .275 | .845 | 1 | .358 | .777 | .454-1.331 |
| Sex c | −.089 | .739 | .015 | 1 | .904 | .914 | .215-3.895 |
| Constant | 1.427 | 2.324 | .377 | 1 | .539 | 4.167 | |
| SJL T0 | −.142 | .293 | .296 | 1 | .627 | .867 | .489-1.540 |
| Sex | −.142 | .745 | .036 | 1 | .849 | .867 | .201-3.739 |
| Constant | .441 | 1.935 | .052 | 1 | .820 | 1.55 | |
| ESS T0 | −.336 | .145 | 5.370 | 1 | .020* | .715 | .538-.950 |
| Age | −.022 | .034 | .411 | 1 | .521 | .979 | .916-1.045 |
| Sex | −.893 | .875 | 1.043 | 1 | .307 | .409 | .074-2.273 |
| Constant | 2.538 | 2.067 | 1.504 | 1 | .220 | 12.615 | |
| PSQI T0 | .125 | .128 | .943 | 1 | .331 | 1.133 | .881-1.457 |
| Age | −.019 | .030 | .395 | 1 | .530 | .981 | .926-1.041 |
| Sex | .066 | .779 | .007 | 1 | .933 | 1.068 | .232-4.917 |
| Constant | −.292 | 1.635 | .032 | 1 | .858 | .747 | |
| No. of cigarettes T0 | .003 | .057 | .002 | 1 | .962 | 1.003 | .896-1.122 |
| Age | −.011 | .028 | .164 | 1 | .686 | .989 | .937-1.044 |
| Constant | .003 | 1.567 | .000 | 1 | .998 | 1.003 |
Abbreviations: ESS = Epworth Sleepiness Scale; PSQI = Pittsburgh Sleep Quality Index; SE = standard error; df = degrees of freedom; OR = odds ratio; CI = confidence interval; SJL = social jetlag; MSFsc = mid-sleep on free days corrected for sleep debt.
Significant prediction of cessation status by ESS value at T0 (p = .020).
The model was additionally adjusted for caffeine-, alcohol-consumption, and smoking method (premanufactured or hand-rolled cigarettes). Continue group coded as (=1), quit group (=0).
T0 = before planned cessation.
Female coded as (=1), male (=0).
p ≤ 0.05.
Smoking Dosage, Acrophase of Activity, Chronotype, and Social Jetlag
The average cigarette consumption per participant per day was assessed at the beginning of our study. At T0, smoking dosage (cigarettes per day; c/d) was on average across all participants 16 ± 6 c/d (range: 3-37 c/d) without differences between the two groups (quit group: 16 ± 7 c/d; range: 7 37 c/d; continue group: 16 ± 6 c/d; range: 3 28 c/d). After the intervention, even members of the continue group reduced their dosage (10 ± 6 c/d; range: 3-21 c/d). This reduction was significant (Wilcoxon signed-rank test, data not normally distributed: Median (T0) = 14.00, Median (T1) = 9.33, Z = −3.52, N = 21, p = ≤0.001). Dosage had no association with ψact-week, MSFsc or SJL during either T0 or T1 (see Spearman’s rho in Supplementary Table S2).
MCTQ Database
Cross-sectional data from the MCTQ database (Roenneberg et al., 2019) was used to further investigate the relationship between smoking and SJL (see Figure 6). The relative Social Jetlag of 146,375 valid MCTQ database entries, which had information about smoking habits, was binned in 30-min intervals and the percentage of smokers were calculated for each bin. Both negative and positive SJL was associated with a higher prevalence of smokers: about 25% of those who sleep 2 h earlier on weekends are smokers, which is similar to the late types who sleep 2 h later on weekends than on workday nights as compared to about 12% smokers in those with no differences between workdays and free days.
Figure 6.

Relative Social Jetlag of the 146,375 valid MCTQ database entries that had information about smoking habits was binned in 30 min intervals and the percentage of smokers were calculated for each bin. Abbreviation: MCTQ = Munich Chronotype Questionnaire.
Comparisons to Population Samples
As a surrogate for a control population, we compared our sample to two age- and sex-matched populations drawn from the MCTQ database (MCTQdb). In the smaller population sample, smokers were not excluded (n = 4782) while the larger contained only nonsmokers (n = 9107). Although average chronotype (MSFsc) was descriptively slightly later and average SJL was descriptively slightly higher in our sample than in the two matched populations, further nonparametric tests showed no significant differences in chronotype or SJL between the samples. This might well be due to the small study sample size.
Albeit not significant, the results reflect increased SJL in the context of smoking because our study sample, consisting of only smokers, showed descriptively increased SJL and later MSFsc than matched population samples. Results are presented in the supplement.
Discussion
A strong correlation between chronotypes or SJL and the probability of being a smoker has previously been shown (Wittmann et al., 2006). However, whether smoking delays circadian phase/chronotype (explanatory scenario-A) or if later chronotype/SJL increases the probability to smoke, is not clear. One could hypothesize that late types suffering from SJL, may more readily smoke as a coping mechanism (explanatory scenario-B). To elucidate the causal directions of these correlations, we examined the two scenarios by accompanying smokers who partook in a cessation program (without nicotine replacements).
The Two Scenarios
Scenario-A predicts a circadian advance with cessation, but our results show no effects of cessation on SJL, chronotype, sleep quality, or daytime sleepiness. Notably, participants showed no significant differences at the start of our intervention that potentially could explain the absence of cessation effects on circadian behavior. In our cohort, the timing of daily behaviors was not different, notably did not advance, between the baseline weeks, and the time after successfully quitting smoking. Our results therefore render scenario-A rather unlikely and further indicate that the circadian measurements were independent from cessation status or number of smoked cigarettes. Changes on the individual level—which were all of small effect sizes (in paired tests)—also contradicted scenario-A: advances, delays, and changes in SJL were largely the same for the two groups. Results from the MCTQ database further corroborate these results, indicating that smoking is fostered by SJL rather than by being a late chronotype: negative SJL (i.e. sleeping earlier on weekends than on workdays) is typical for very early chronotypes, and the prevalence of smokers in those that sleep 2 h earlier on weekends, is similar to that in late types that sleep 2 h later on weekends than on workday nights. Thus, SJL—and not merely being a late type—increased the likelihood of being a smoker.
Furthermore, Wittmann et al. showed that, in their cohort, correlations between SJL and smoking were stronger than correlations between smoking and chronotype (Wittmann et al., 2006). They also argued that the group of over 64-year-old subjects makes a strong case for SJL being responsible regarding smoking: MSFsc in this group was relatively early and narrowly distributed. Smoking and chronotype did not correlate in these subjects. However, when analyzing the elderly subjects who still worked separately, SJL and smoking did correlate, while chronotype and smoking still did not (Wittmann et al., 2006).
SJL has been widely reported to be associated with various aspects of human health, for example, depressive symptoms (Levandovski et al., 2011), lower academic/work performance (McGowan et al., 2020; Yong et al., 2016) and higher cardiovascular or metabolic risks (Koopman et al., 2017; Parsons et al., 2015; Wong et al., 2015). Wittmann et al. suggest that smoking and/or drinking add to the negative effects of SJL (Wittmann et al., 2010). Increased SJL is also associated with higher cortisol levels, indicating an increased activation of the hypothalamic-pituitary-adrenal axis (HPA or commonly known as stress-axis) (Rutters et al., 2014). SJL has further been linked to increased daytime sleepiness (Choi et al., 2019; Komada et al., 2016). A combination of these mentioned effects might contribute to start/maintain smoking.
Our study therefore suggests that reduction of SJL should be part of smoking (and possibly other stimulant) prevention. This is especially pressing considering adolescence, during which the highest SJL is experienced, compared to other age groups (Roenneberg et al., 2007, 2012) and during which most people smoke for the first time (U.S. Department of Health and Human Services, 2014; Wellman et al., 2016).
Smoking Dosage
It could be argued that we did not detect any effects/differences between the groups because smoking dosage significantly decreased in the continue group. Dosage was not associated with MSFsc, SJL or ψact-week and these parameters did not change in any group over the course of our intervention. Therefore, we see our results as independent of smoking dosage and argue that they are best understood by way of the dichotomy of being a smoker or not, which has also already been shown by Wittman et al. (2006).
Smoking as a Potential Masking Factor
Nicotine might affect sleeping behavior without changing the phase of the circadian clock. While tobacco use has been shown to alter clock gene expression in lung tissue of rodents (Hwang et al.), we do not know of any work investigating masking of entrainment of the human clock specifically in regard to smoking. It is conceivable that experiencing nicotine addiction might result in earlier wake-up times due to craving (e.g. to smoke the first cigarette of the day (Chandra et al., 2007, 2011; Tiffany and Wray, 2012), and that smoking in the evening might delay bed times because nicotine fosters arousal (Ernst et al., 2001; Myers et al., 2008). This masking phenomenon, might not change the mid-phase of sleep because smokers procrastinate in the evening (due to nicotine arousal effects) and wake up earlier (due to craving), resulting in no great change in mid-sleep. In our study, we aimed to further investigate the known correlation between smoking and SJL. We demonstrate that chronotype or SJL is not different depending on cessation status and therefore argue that smoking is used to cope with SJL and its effects. Whether and in what way smoking may act as a masking factor for circadian rhythms, needs further investigation.
The Role of Sleep Quality
In our sample, continuing to smoke was associated with lower daytime sleepiness (ESS), which evokes two possible explanations: (1) smoking reduces daytime sleepiness (e.g. by fostering arousal (Griesar et al., 2002; Thiel and Fink, 2007; Trimmel and Wittberger, 2004)) and (2) smokers experiencing higher daytime sleepiness might be more motivated to quit. Daytime sleepiness is often associated with low sleep quality and smokers can suffer from low sleep quality (Cohrs et al., 2014; Hu et al., 2007; Jaehne et al., 2012; Phillips and Danner, 1995; Wetter and Young, 1994) and a higher prevalence of lighter sleep stages compared to nonsmokers (Zhang et al., 2006, 2008). However, daytime sleepiness in smokers is a complex issue. Although our ESS-results show that continuing to smoke is associated with lower daytime sleepiness, the opposite has also been reported (Braeckman et al., 2011; Kaur and Singh, 2017; Theorell-Haglöw et al., 2015). Interestingly, daytime sleepiness showed no significant difference between the two outcome groups at study onset, despite being a significant predictor for continuing to smoke, which points to a need for further investigation.
The fact that ESS scores slightly decreased in both groups after the intervention (also in the continue group, which collectively significantly reduced their cigarette consumption), further indicates that daytime sleepiness might have a complex interaction with cessation: it is not only a preintervention predictor for continuing to smoke (as described above) but may be also be a postintervention support for success (positive feedback) in successfully quitting individuals. Continuing smokers, on the contrary, might be relieved (even more) from the pressure to quit, since subjective strain is further reduced (if negative effects of smoking on sleep are in fact dose-dependent, which has been shown (Gillin et al., 1994; Jaehne et al., 2012)).
Sleep quality (PSQI and ESS) in our sample was lower than considered healthy by the questionnaire developers (Buysse et al., 1989; M. W. Johns, 1991). If smoking influences sleep quality, an improvement with cessation should be expected, which we did not find in the limited time we analyzed after cessation (improvements in ESS not significant, PSQI slightly worsened). Besides the explanation that the postintervention period was too short to reveal such improvement in sleep quality, this apparent contradiction could indicate that sleep quality and smoking are associated because bad sleep is a reason for and not a consequence of smoking (similar to SJL, see above). Detrimental effects of cessation on sleep quality have also been described (Colrain et al., 2004; Prosise et al., 1994). Thus, the relationship between smoking and sleep quality/daytime sleepiness needs more research and discussion.
Conclusion and Outlook
Our results support previous findings about the association of SJL and smoking. They advance our understanding of the relationship between the circadian clock and smoking and make recommendations for decreasing nicotine addiction by reducing SJL. The results of our intervention protocol show that cessation does not affect chronotype (a surrogate for the PoE of the circadian clock) and therefore suggest that smoking is a response to SJL rather than delaying circadian phase, that is, producing later chronotypes and thereby increasing SJL. Further studies are needed to understand the interaction of sleep quality, daytime sleepiness, and smoking, as well as the long-term effects of cessation on the circadian clock and sleep, which should ideally follow subjects over a longer time.
Limitations
(1) Our sample was relatively small with a female majority. (2) Participants answered the same questions at the beginning and the end of the study, so that an influence of a “known” questionnaire cannot be ruled out. (3) Since the MCTQ refers to the “previous 6 weeks,” its answers at study begin do not correspond to the recorded actimetry as they do at study end although MCTQ variables demonstrated a good correspondence to actimetry data during T0. (4) DST changes during our study, might have influenced measurements and results. However, we corrected for the DST changes. Notably both corrected and uncorrected datasets produced the same result in reference to the relevant parameters discussed here. (5) As to be expected in long-range studies, seasons (different photoperiods) may have influenced our results. (6) Actimetry compliance varied in the cohort, so that variable time series lengths were analyzed. (7) As per the a priori power calculation, our study was underpowered to detect differences of small to moderate effect sizes and may have been underpowered to detect differences not related to the main objective (other outcomes). We therefore cannot rule out that our study may have been unable to detect potentially existing small effect sizes due to our small sample size.
Supplemental Material
Supplemental material, sj-docx-1-jbr-10.1177_07487304231177197 for Chronotype, Social Jetlag, and Nicotine Use by Neda Ghotbi, Andrea Rabenstein, Luísa K. Pilz, Tobias Rüther and Till Roenneberg in Journal of Biological Rhythms
Acknowledgments
The authors would like to thank the participants for their time and cooperation. They also thank Giulia Zerbini for revising an earlier version of the manuscript and her valuable feedback. NG received funding from the FoeFoLe program of the LMU (Registration No. 37/2013). The Psychiatric Clinic at the LMU and its Tobacco Outpatient Clinic supported this study financially. LKP received fellowships from Coordenação de Aperfeiçoamento de Pessoal de Nível Superior—Brasil (CAPES).
Supplementary material is available for this article online.
Footnotes
Author Contributions: TR and NG designed the study. NG and AR collected the data. NG, LKP, and TR analyzed the data. NG, LKP, TR, AR, and TRüther revised the manuscript.
TR is founder and CSO of the company Chronsulting UG. The remaining authors declare that there is no conflict of interest.
Data Availability Statement: The underlying research materials related to this study (data set, models) are available on request from the corresponding author (TR).
ORCID iDs: Neda Ghotbi  https://orcid.org/0000-0003-3405-4608
Luísa K. Pilz https://orcid.org/0000-0001-7328-6204
References
- Abdi H. (2007) Bonferroni and Šidák corrections for multiple comparisons. In: Salkind NJ, editor. Encyclopedia of measurement and statistics. Thousand Oaks (CA): Sage. p. 103-107. [Google Scholar]
- Adan A. (1994) Chronotype and personality factors in the daily consumption of alcohol and psychostimulants. Addiction 89:455-462. [DOI] [PubMed] [Google Scholar]
- Antypa N, Vogelzangs N, Meesters Y, Schoevers R, Penninx BWJH. (2016) Chronotype associations with depression and anxiety disorders in a Large Cohort Study. Depress Anxiety 33:75-83. [DOI] [PubMed] [Google Scholar]
- Braeckman L, Verpraet R, Van Risseghem M, Pevernagie D, De Bacquer D. (2011) Prevalence and correlates of poor sleep quality and daytime sleepiness in Belgian truck drivers. Chronobiol Int 28:126-134. [DOI] [PubMed] [Google Scholar]
- Broms U, Pennanen M, Patja K, Ollila H, Korhonen T, Kankaanpää A, Haukkala A, Tuulio-Henriksson A, Koskenvuo M, Kronholm E, et al. (2012) Diurnal evening type is associated with current smoking, nicotine dependence and nicotine intake in the population based national FINRISK 2007 Study. J Addict Res Ther S2:002. [DOI] [PMC free article] [PubMed] [Google Scholar]
- Buysse DJ, Reynolds XF, 3rd, Monk TH, Berman SR, Kupfer DJ. (1989) The Pittsburgh Sleep Quality Index: a new instrument for psychiatric practice and research. Psychiatry Res 28:193-213. [DOI] [PubMed] [Google Scholar]
- Carpenter JS, Andrykowski MA. (1998) Psychometric evaluation of the Pittsburgh Sleep Quality Index. J Psychosom Res 45:5-13. [DOI] [PubMed] [Google Scholar]
- Chandra S, Shiffman S, Scharf DM, Dang Q, Shadel WG. (2007) Daily smoking patterns, their determinants, and implications for quitting. Exp Clin Psychopharmacol 15:67. [DOI] [PubMed] [Google Scholar]
- Chandra S, Scharf D, Shiffman S. (2011) Within-day temporal patterns of smoking, withdrawal symptoms, and craving. Drug Alcohol Depend 117:118-125. [DOI] [PMC free article] [PubMed] [Google Scholar]
- Choi HJ, Lee YJ, Yoo YJ, Cho YW, Moon H-J. (2019) The effects of chronotype and social jetlag on medical students. Sleep Biol Rhythms 17:269-276. [Google Scholar]
- Cohrs S, Rodenbeck A, Riemann D, Szagun B, Jaehne A, Brinkmeyer J, Gründer G, Wienker T, Diaz-Lacava A, Mobascher A, et al. (2014) Impaired sleep quality and sleep duration in smokers: results from the German Multicenter Study on Nicotine Dependence. Addict Biol 19:486-496. [DOI] [PubMed] [Google Scholar]
- Colrain IM, Trinder J, Swan GE. (2004) The impact of smoking cessation on objective and subjective markers of sleep: review, synthesis, and recommendations. Nicotine Tob Res 6:913-925. [DOI] [PubMed] [Google Scholar]
- Deveci SE, Deveci F, Açik Y, Tevfik Ozan A. (2004) The measurement of exhaled carbon monoxide in healthy smokers and non-smokers. Respir Med 98:551-556. [DOI] [PubMed] [Google Scholar]
- Duffy JF, Wright KP. (2005) Entrainment of the human circadian system by light. J Biol Rhythms 20:326-338. [DOI] [PubMed] [Google Scholar]
- Ernst M, Heishman SJ, Spurgeon L, London ED. (2001) Smoking history and nicotine effects on cognitive performance. Neuropsychopharmacology 25:313-319. [DOI] [PubMed] [Google Scholar]
- Fabbian F, Zucchi B, De Giorgi A, Tiseo R, Boari B, Salmi R, Cappadona R, Gianesini G, Bassi E, Signani F, et al. (2016) Chronotype, gender and general health. Chronobiol Int 33:863-882. [DOI] [PubMed] [Google Scholar]
- Faul F, Erdfelder E, Buchner A, Lang A-G. (2009) Statistical power analyses using G* Power 3.1: tests for correlation and regression analyses. Behav Res Methods 41:1149-1160. [DOI] [PubMed] [Google Scholar]
- Faul F, Erdfelder E, Lang A-G, Buchner A. (2007) G* Power 3: a flexible statistical power analysis program for the social, behavioral, and biomedical sciences. Behav Res Methods 39:175-191. [DOI] [PubMed] [Google Scholar]
- Gillin JC, Lardon M, Ruiz C, Golshan S, Salin-Pascual R. (1994) Dose-dependent effects of transdermal nicotine on early morning awakening and rapid eye movement sleep time in nonsmoking normal volunteers. J Clin Psychopharmacol 14. https://journals.lww.com/psychopharmacology/Fulltext/1994/08000/Dose_Dependent_Effects_of_Transdermal_Nicotine_on.6.aspx. [PubMed] [Google Scholar]
- Grandner MA, Kripke DF, Yoon I-Y, Youngstedt SD. (2006) Criterion validity of the Pittsburgh Sleep Quality Index: investigation in a non-clinical sample. Sleep Biol Rhythms 4:129-136. [DOI] [PMC free article] [PubMed] [Google Scholar]
- Griesar WS, Zajdel DP, Oken BS. (2002) Nicotine effects on alertness and spatial attention in non-smokers. Nicotine Tob Res 4:185-194. [DOI] [PubMed] [Google Scholar]
- Hinkle DE, Wiersma W, Jurs SG. (2003) Applied statistics for the behavioral sciences. Boston: Houghton Mifflin College Division. [Google Scholar]
- Horne JA, Ostberg O. (1976) A Self-Assessment Questionnaire to determine morningness-eveningness in human circadian rhythms. Int J Chronobiol 4:97-110. [PubMed] [Google Scholar]
- Hu L, Sekine M, Gaina A, Kagamimori S. (2007) Association between sleep quality and smoking in Japanese civil servants. Sleep Biol Rhythms 5:196-203. [Google Scholar]
- Jaehne A, Unbehaun T, Feige B, Lutz UC, Batra A, Riemann D. (2012) How smoking affects sleep: a polysomnographical analysis. Sleep Med 13:1286-1292. [DOI] [PubMed] [Google Scholar]
- Javors MA, Hatch JP, Lamb RJ. (2005) Cut-off levels for breath carbon monoxide as a marker for cigarette smoking. Addiction 100:159-167. [DOI] [PubMed] [Google Scholar]
- Johns M, Hocking B. (1997) Daytime sleepiness and sleep habits of Australian workers. Sleep 20:844-847. [DOI] [PubMed] [Google Scholar]
- Johns MW. (1991) A new method for measuring daytime sleepiness: the Epworth Sleepiness Scale. Sleep 14:540-545. [DOI] [PubMed] [Google Scholar]
- Johns MW. (1992) Reliability and factor analysis of the Epworth Sleepiness Scale. Sleep 15:376-381. [DOI] [PubMed] [Google Scholar]
- Kantermann T, Sung H, Burgess HJ. (2015) Comparing the Morningness-Eveningness Questionnaire and Munich ChronoType Questionnaire to the Dim Light Melatonin Onset. J Biol Rhythms 30:449-453. [DOI] [PMC free article] [PubMed] [Google Scholar]
- Kapusta ND, Pietschnig J, Plener PL, Blüml V, Lesch OM, Walter H. (2010) Does breath carbon monoxide measure nicotine dependence? J Addict Dis 29:493-499. [DOI] [PubMed] [Google Scholar]
- Kaur G, Singh A. (2017) Excessive daytime sleepiness and its pattern among Indian college students. Sleep Med 29:23-28. [DOI] [PubMed] [Google Scholar]
- Kitamura S, Hida A, Aritake S, Higuchi S, Enomoto M, Kato M, Vetter C, Roenneberg T, Mishima K. (2014) Validity of the Japanese Version of the Munich ChronoType Questionnaire. Chronobiol Int 31:845-850. [DOI] [PubMed] [Google Scholar]
- Koegelenberg CFN, Noor F, Bateman ED, van Zyl-Smit RN, Bruning A, O’Brien JA, Smith C, Abdool-Gaffar MS, Emanuel S, Esterhuizen TM, et al. (2014) Efficacy of varenicline combined with nicotine replacement therapy vs varenicline alone for smoking cessation: a randomized clinical trial. JAMA 312:155-161. [DOI] [PubMed] [Google Scholar]
- Komada Y, Breugelmans R, Drake CL, Nakajima S, Tamura N, Tanaka H, Inoue S, Inoue Y. (2016) Social jetlag affects subjective daytime sleepiness in school-aged children and adolescents: a study using the Japanese Version of the Pediatric Daytime Sleepiness Scale (PDSS-J). Chronobiol Int 33:1311-1319. [DOI] [PubMed] [Google Scholar]
- Koopman ADM, Rauh SP, van ‘t Riet E, Groeneveld L, van der Heijden AA, Elders PJ, Dekker JM, Nijpels G, Beulens JW, Rutters F. (2017) The association between social jetlag, the Metabolic Syndrome, and Type 2 diabetes mellitus in the general population: the New Hoorn Study. J Biol Rhythms 32:359-368. [DOI] [PMC free article] [PubMed] [Google Scholar]
- Kröger C, Gradl S. (2007) Das Rauchfrei Programm: Ein Manual Zur Tabakentwöhnung. München: IFT Gesundheitsförderung GmbH. [Google Scholar]
- Kufeld C, Bühringer G. (2010) Behandlung Der Tabakabhängigkeit. Berlin (Germany): De Gruyter. [Google Scholar]
- Kwon B, Lee G. (2022) Association between chronotype, tobacco use or alcohol use, and high-risk drinking by age group: the Seventh Korea National Health and Nutrition Examination Survey (VII: 2016-2017). Sleep Health 8:491-497. [DOI] [PubMed] [Google Scholar]
- Levandovski R, Dantas G, Fernandes LC, Caumo W, Torres I, Roenneberg T, Loayza Hidalgo MP, Allebrandt KV. (2011) Depression scores associate with chronotype and social jetlag in a rural population. Chronobiol Int 28:771-778. [DOI] [PubMed] [Google Scholar]
- Liang K-Y, Zeger SL. (1986) Longitudinal data analysis using generalized linear models. Biometrika 73:13-22. [Google Scholar]
- McGowan NM, Uzoni A, Faltraco F, Thome J, Coogan AN. (2020) The impact of social jetlag and chronotype on attention, inhibition and decision making in healthy adults. J Sleep Res 29:e12974. [DOI] [PubMed] [Google Scholar]
- Middleton ET, Morice AH. (2000) Breath carbon monoxide as an indication of smoking habit. Chest 117:758-763. [DOI] [PubMed] [Google Scholar]
- Mollayeva T, Thurairajah P, Burton K, Mollayeva S, Shapiro CM, Colantonio A. (2016) The Pittsburgh Sleep Quality Index as a screening tool for sleep dysfunction in clinical and non-clinical samples: a systematic review and meta-analysis. Sleep Med Rev 25:52-73. [DOI] [PubMed] [Google Scholar]
- Myers CS, Taylor RC, Moolchan ET, Heishman SJ. (2008) Dose-related enhancement of mood and cognition in smokers administered nicotine nasal spray. Neuropsychopharmacology 33:588-598. [DOI] [PubMed] [Google Scholar]
- Noble WS. (2009) How does multiple testing correction work? Nature Biotechnol 27:1135. [DOI] [PMC free article] [PubMed] [Google Scholar]
- Parsons MJ, Moffitt TE, Gregory AM, Goldman-Mellor S, Nolan PM, Poulton R, Caspi A. (2015) Social jetlag, obesity and metabolic disorder: investigation in a cohort study. Int J Obes 39:842. [DOI] [PMC free article] [PubMed] [Google Scholar]
- Patrick DL, Cheadle A, Thompson DC, Diehr P, Koepsell T, Kinne S. (1994) The validity of self-reported smoking: a review and meta-analysis. Am J Public Health 84:1086-1093. [DOI] [PMC free article] [PubMed] [Google Scholar]
- Phillips BA, Danner FJ. (1995) Cigarette smoking and sleep disturbance. Arch Intern Med 155:734-737. [PubMed] [Google Scholar]
- Pilz LK, Keller LK, Lenssen D, Roenneberg T. (2018) Time to rethink sleep quality: PSQI scores reflect sleep quality on workdays. Sleep 41:zsy029. [DOI] [PubMed] [Google Scholar]
- Prosise GL, Bonnet MH, Berry RB, Dickel MJ. (1994) Effects of abstinence from smoking on sleep and daytime sleepiness. Chest 105:1136-1141. [DOI] [PubMed] [Google Scholar]
- Rad M, Kakoie S, Brojeni FN, Pourdamghan N. (2010) Effect of long-term smoking on whole-mouth salivary flow rate and oral health. J Dent Res Dent Clin Dent Prospects 4:110. [DOI] [PMC free article] [PubMed] [Google Scholar]
- Roenneberg T, Allebrandt KV, Merrow M, Vetter C. (2012) Social jetlag and obesity. Curr Biol 22:939-943. [DOI] [PubMed] [Google Scholar]
- Roenneberg T, Kuehnle T, Juda M, Kantermann T, Allebrandt K, Gordijn M, Merrow M. (2007) Epidemiology of the human circadian clock. Sleep Med Rev 11:429-438. [DOI] [PubMed] [Google Scholar]
- Roenneberg T, Keller LK, Fischer D, Matera JL, Vetter C, Winnebeck EC. (2015) Human activity and rest in situ. Methods Enzymol 552:257-283. [DOI] [PubMed] [Google Scholar]
- Roenneberg T, Jairaj Kumar C, Merrow M. (2007) The human circadian clock entrains to sun time. Curr Biol 17:R44-R45. [DOI] [PubMed] [Google Scholar]
- Roenneberg T, Pilz LK, Zerbini G, Winnebeck EC. (2019) Chronotype and social jetlag: a (self-) critical review. Biology 8:54. [DOI] [PMC free article] [PubMed] [Google Scholar]
- Roenneberg T, Wirz-Justice A, Merrow M. (2003) Life between clocks: daily temporal patterns of human chronotypes. J Biol Rhythms 18:80-90. [DOI] [PubMed] [Google Scholar]
- Rutters F, Lemmens SG, Adam TC, Bremmer MA, Elders PJ, Nijpels G, Dekker JM. (2014) Is social jetlag associated with an adverse endocrine, behavioral, and cardiovascular risk profile? J Biol Rhythms 29:377-383. [DOI] [PubMed] [Google Scholar]
- Stead LF, Carroll AJ, Lancaster T. (2017) Group behaviour therapy programmes for smoking cessation. Cochrane Database Syst Rev 3:CD001007. [DOI] [PMC free article] [PubMed] [Google Scholar]
- Steyer R, Ferring D, Schmitt MJ. (1992) States and traits in psychological assessment. Eur J Psychol Assess 8:79-98. [Google Scholar]
- Stoltzfus JC. (2011) Logistic regression: a brief primer. Acad Emerg Med 18:1099-1104. [DOI] [PubMed] [Google Scholar]
- Suh S, Yang H-C, Kim N, Yu JH, Choi S, Yun C-H, Shin C. (2017) Chronotype differences in health behaviors and health-related quality of life: a population-based study among aged and older adults. Behav Sleep Med 15:361-376. [DOI] [PubMed] [Google Scholar]
- Theorell-Haglöw J, Åkerstedt T, Schwarz J, Lindberg E. (2015) Predictors for development of excessive daytime sleepiness in women: a population-based 10-year follow-up. Sleep 38:1995-2003. [DOI] [PMC free article] [PubMed] [Google Scholar]
- Thiel CM, Fink GR. (2007) Visual and auditory alertness: modality-specific and supramodal neural mechanisms and their modulation by nicotine. J Neurophysiol 97:2758-2768. [DOI] [PubMed] [Google Scholar]
- Tiffany ST, Wray JM. (2012) The clinical significance of drug craving. Ann N Y Acad Sci 1248:1-17. [DOI] [PMC free article] [PubMed] [Google Scholar]
- Tonstad S, Tønnesen P, Hajek P, Williams KE, Billing CB, Reeves KR, and Varenicline Phase 3 Study Group (2006) Effect of maintenance therapy with varenicline on smoking cessation: a randomized controlled trial. JAMA 296:64-71. [DOI] [PubMed] [Google Scholar]
- Trimmel M, Wittberger S. (2004) Effects of transdermally administered nicotine on aspects of attention, task load, and mood in women and men. Pharmacol Biochem Behav 78:639-645. [DOI] [PubMed] [Google Scholar]
- US Department of Health and Human Services (2014) The health consequences of smoking—50 years of progress: a report of the Surgeon General. Atlanta (GA): US Department of Health and Human Services, Centers for Disease Control and Prevention, National Center for Chronic Disease Prevention and Health Promotion, Office on Smoking and Health. [Google Scholar]
- Wellman RJ, Dugas EN, Dutczak H, O’Loughlin EK, Datta GD, Lauzon B, O’Loughlin J. (2016) Predictors of the onset of cigarette smoking: a systematic review of longitudinal population-based studies in youth. American Journal of Preventive Medicine 51:767-778. [DOI] [PubMed] [Google Scholar]
- West R, Hajek P, Stead L, Stapleton J. (2005) Outcome criteria in smoking cessation trials: proposal for a common standard. Addiction 100:299-303. [DOI] [PubMed] [Google Scholar]
- Wetter DW, Young TB. (1994) The relation between cigarette smoking and sleep disturbance. Prev Med 23:328-334. [DOI] [PubMed] [Google Scholar]
- Wickham H, Chang W, Wickham MH. (2016) Package “Ggplot2.” Create elegant data visualisations using the grammar of graphics. Version 2. R Foundation for Statistical Computing: Vienna, Austria. [Google Scholar]
- Wittmann M, Dinich J, Merrow M, Roenneberg T. (2006) Social jetlag: misalignment of biological and social time. Chronobiol Int 23:497-509. [DOI] [PubMed] [Google Scholar]
- Wittmann M, Paulus M, Roenneberg T. (2010) Decreased psychological well-being in late “chronotypes” is mediated by smoking and alcohol consumption. Subst Use Misuse 45:15-30. [DOI] [PubMed] [Google Scholar]
- Wong PM, Hasler BP, Kamarck TW, Muldoon MF, Manuck SB. (2015) Social jetlag, chronotype, and cardiometabolic risk. J Clin Endocrinol Metab 100:4612-4620. [DOI] [PMC free article] [PubMed] [Google Scholar]
- World Health Organization (2019) WHO global report on trends in prevalence of tobacco use 2000-2025. Geneva (Switzerland): World Health Organization. [Google Scholar]
- Wright KP, McHill AW, Birks BR, Griffin BR, Rusterholz T, Chinoy ED. (2013) Entrainment of the human circadian clock to the natural light-dark cycle. Curr Biol 23:1554-1558. [DOI] [PMC free article] [PubMed] [Google Scholar]
- Yong M, Fischer D, Germann C, Lang S, Vetter C, Oberlinner C. (2016) Are chronotype, social jetlag and sleep duration associated with health measured by work ability index? Chronobiol Int 33:721-729. [DOI] [PubMed] [Google Scholar]
- Zhang L, Samet J, Caffo B, Bankman I, Punjabi NM. (2008) Power spectral analysis of EEG activity during sleep in cigarette smokers. Chest 133:427-432. [DOI] [PubMed] [Google Scholar]
- Zhang L, Samet J, Caffo B, Punjabi NM. (2006) Cigarette smoking and nocturnal sleep architecture. Am J Epidemiol 164:529-537. [DOI] [PubMed] [Google Scholar]
Associated Data
This section collects any data citations, data availability statements, or supplementary materials included in this article.
Supplementary Materials
Supplemental material, sj-docx-1-jbr-10.1177_07487304231177197 for Chronotype, Social Jetlag, and Nicotine Use by Neda Ghotbi, Andrea Rabenstein, Luísa K. Pilz, Tobias Rüther and Till Roenneberg in Journal of Biological Rhythms