

Abstract
The noninflamed microenvironment in prostate cancer represents a barrier to immunotherapy. Genetic alterations underlying cancer cell-intrinsic oncogenic signaling are increasingly appreciated for their role in shaping the immune landscape. Recently, we identified Pygopus 2 (PYGO2) as the driver oncogene for the amplicon at 1q21.3 in prostate cancer. Here, using transgenic mouse models of metastatic prostate adenocarcinoma, we found that Pygo2 deletion decelerated tumor progression, diminished metastases, and extended survival. Pygo2 loss augmented the activation and infiltration of cytotoxic T lymphocytes (CTLs) and sensitized tumor cells to T cell killing. Mechanistically, Pygo2 orchestrated a p53/Sp1/Kit/Ido1 signaling network to foster a microenvironment hostile to CTLs. Genetic or pharmacological inhibition of Pygo2 enhanced the anti-tumor efficacy of immunotherapies using immune checkpoint blockade (ICB), adoptive cell transfer, or agents inhibiting myeloid-derived suppressor cells. In human prostate cancer samples, Pygo2 expression was inversely correlated with the infiltration of CD8+ T cells. Analysis of the ICB clinical data showed association between high PYGO2 level and worse outcome. Taken together, our results highlight a potential path to improve immunotherapy using Pygo2-targeted therapy for advanced prostate cancer.
One Sentence Summary:
Pygo2 constrains antitumor T cell immunity and mediates immunotherapy resistance in prostate cancer through the p53/Sp1/Kit/Ido1 axis.
INTRODUCTION
Tumor resistance to immunotherapy remains a significant challenge (1). Among cancer types refractory to immune checkpoint blockade (ICB), advanced prostate cancer (PCa) exhibits overwhelming de novo resistance to anti-CTLA4 or anti-PD1 therapies (2–5). To combat resistance to immunotherapy, therapeutic efforts using targeted agents to convert cold to hot tumor microenvironments (TME) are promising. PCa is considered immunologically cold, where T lymphocytes are primarily located in the adjacent normal structures (6), or the tumor stroma, but rarely the invasive epithelium (7). A cold TME can be elicited by genetic alterations and oncogenic pathways intrinsic to cancer cells (8, 9). Advanced PCa is characterized by rampant chromosomal instability and copy number alterations, including deletions and amplifications (10). Using genetically engineered mouse (GEM) models, studies have revealed the differential effects of the loss of distinct tumor suppressor genes (Pten, Zbtb7a, Trp53, Pml, and Smad4) on the infiltration and activity of various myeloid populations (11, 12). For example, in the PB-Cre4+ PtenL/L Smad4L/L model, Smad4 loss caused Yap1-mediated upregulation of Cxcl5 in tumor cells, which in turn recruited Cxcr2+ polymorphonuclear myeloid-derived suppressor cells (PMN-MDSCs) that antagonized anti-tumor T-cell immunity (11). The contribution of oncogenes amplified in the PCa genome to the immunosuppressive TME is poorly understood, but remains an important question because of the potential therapeutic opportunities associated with targeting amplified oncogenes.
Pygopus family PHD finger 2 (PYGO2) was recently identified through an in vivo functional screen as the driver oncogene for the amplicon at 1q21.3 in human PCa (13). Copy number gain or amplification of PYGO2 was detected in over 50% of primary and metastatic castration-resistant PCa (mCRPC) cases and was associated with a higher Gleason score, shorter disease-free survival, and shorter biochemical recurrence (13). At the protein level, while Pygo2 expression was not detectable in the normal prostate, high Pygo2 expression was correlated with a higher Gleason score, biochemical recurrence, and metastasis to lymph nodes and bone (13, 14). Overexpression of Pygo2 has been documented in ovarian (15), breast (16), cervical (17), hepatic (18), lung (19), intestinal (20), and brain cancers (21). Therefore, understanding and targeting Pygo2 may have translational significance in various cancer types. As a chromatin effector, Pygo2 anchors to chromatin through interactions between its plant homeodomain (PHD) and H3K4me2/3, histone modifications that mark active transcription (22). Pygo2 recruits histone acetyltransferases or histone methyltransferases to augment transcriptional activation (23). As an emerging epigenetic switch, Pygo2 regulates stem cell self-renewal, somatic cell division, and hormone-induced gene expression through Wnt-dependent or independent pathways (24–27). To date, studies on Pygo2 have focused on its cell-autonomous functions. In the current study, we used GEM and syngeneic models of PCa to identify a non-autonomous role of Pygo2 in shaping the immunosuppressive TME of PCa, particularly through constraining the activity and density of tumor-infiltrating effector T cells. Importantly, genetic ablation or pharmacological inhibition of Pygo2 sensitized PCa to ICB, adoptive T-cell therapy (ACT), and PMN-MDSC inhibition, suggesting that Pygo2-targeted therapy could be combined with immunotherapy to improve treatment of PCa.
RESULTS
Pygo2 promotes PCa progression and metastasis in GEM and syngeneic models.
The function of Pygo2 during spontaneous PCa development has not been defined. We crossed mice bearing a Pygo2 loxP allele (28) with the metastatic PCa model, PB-Cre4+ PtenL/L Smad4L/L (pDKO) (11, 29) to generate PB-Cre4+ PtenL/L Smad4L/L Pygo2L/L (pTKO) mice (Fig. 1A). Prostate-specific Pygo2 loss was evident in pTKO mice (Fig. 1B). pTKO mice exhibited decelerated tumor growth by approximately two months postnatally, as detected by magnetic resonance imaging (MRI) (Fig. 1C). The median survival of pTKO mice was extended by ten weeks compared with pDKO mice (Fig. 1D). To compare histological features at equivalent tumor sizes, we harvested tumors from 12-week pDKO mice and 18-week pTKO mice. Immunohistochemistry (IHC) showed lower proliferation and stronger apoptosis in pTKO tumors than pDKO tumors (Fig. 1E). Unlike the expression pattern in human where Pygo2 is not expressed in normal prostate but upregulated in PCa with genomic amplification as a main mechanism (13, 14), Pygo2 is expressed in normal mouse prostate tissue (Fig. S1A–B). Moreover, in the pDKO model, Pygo2 was expressed by a fraction of stromal cells, albeit the level was lower than that in cancer cells (Fig. S1C).
Fig. 1. Pygo2 promotes PCa progression and metastasis in GEM and syngeneic models.
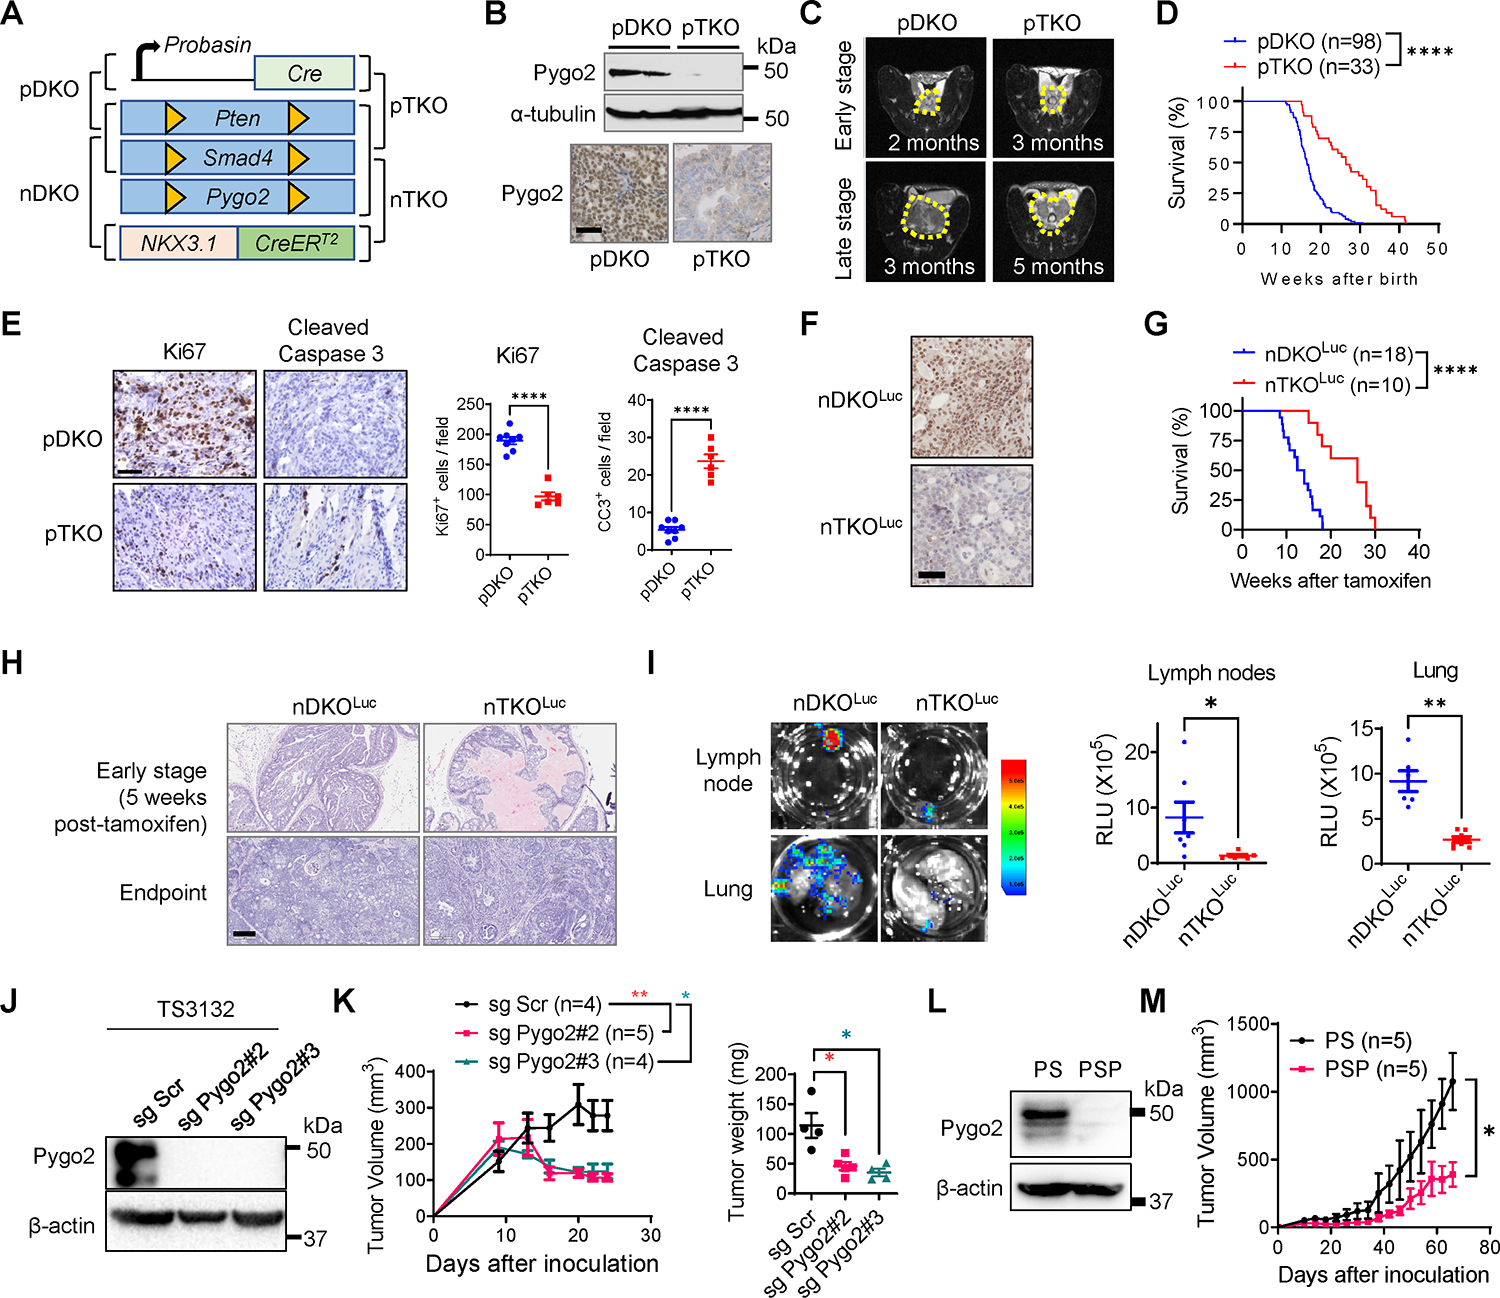
(A) The diagram for pDKO, pTKO, nDKO and nTKO. (B) Pygo2 expression in pDKO and pTKO tumors evaluated by western blot and IHC. Scale bar, 50μm. (C) MRI images of pDKO and pTKO tumors (yellow contour) at early and late stages. (D) Kaplan–Meier curves of pDKO (n=98) and pTKO (n=33) mice. (E) Ki67 and cleaved caspase-3 IHC staining and quantification for pDKO(n=8) and pTKO tumors(n=6). Scale bar, 50μm. (F) Pygo2 IHC for nDKOLuc and nTKOLuc tumors. Scale bar, 50μm. (G) Kaplan–Meier curves of nDKOLuc (n=18) and nTKOLuc (n=10) mice after tamoxifen induction. (H) H&E staining for nDKOLuc and nTKOLuc at early stage and endpoint. Scale bar, 200μm. (I) Bioluminescence images and quantification of metastases at draining lymph nodes and lungs from nDKOLuc (n=6) and nTKOLuc (n=7) mice at the endpoint. (J) Pygo2 knockout in TS3132 with two different sgRNA, validated by western blot. (K) Subcutaneous tumor volume and endpoint weight for TS3132 sublines in nude mice (Scr n=4, sg Pygo2#2 n=5, sg Pygo2#3 n=4). (L) Western blot validating Pygo2 expression in PS and PSP cell lines. (M) Syngeneic tumor growth for PS (n=5) and PSP (n=5) in C57BL/6 mice. In (D)(G), ****P<0.0001, log-rank test. In (E)(I)(K)(M), error bars represent SEM; *P<0.05, **P<0.01, ***P<0.001, ****P<0.0001, unpaired t-test.
The tamoxifen-inducible Nkx3.1CreERT2 allele enables temporal genetic control in prostatic epithelial cells (30). We generated Nkx3.1CreERT2/+ PtenL/L Smad4L/L Rosa26-LSL-LucL/L (nDKOLuc) and Nkx3.1CreERT2/+ PtenL/L Smad4L/L Pygo2L/L Rosa26-LSL-LucL/L (nTKOLuc) mice (Fig. 1A) and confirmed tamoxifen-induced Pygo2 expression loss (Fig. 1F). nDKOLuc and nTKOLuc were induced with tamoxifen at 1–4 months of age. Consistent with the PB-Cre4-based models, nTKOLuc mice survived 12.8 weeks (median survival) longer than nDKOLuc mice (Fig. 1G), and nTKOLuc tumors showed slower progression (Fig. 1H). Metastases to draining lymph nodes and lungs were also attenuated in nTKOLuc compared to nDKOLuc mice (Fig. 1I).
To facilitate mechanistic studies, we used CRISPR/cas9 to knockout Pygo2 in the previously reported murine PCa cell line TS3132 (Fig. 1J), which was derived from the pDKO model and formed tumors when implanted in immune-deficient mice (29). Pygo2 knockout reduced colony formation (Fig. S1D–E) and attenuated subcutaneous tumor growth (Fig. 1K). TS3132 sublines were labeled with a tk-GFP-luciferase reporter (31) and injected intracardially into nude mice. Pygo2 knockout reduced the ability to form metastases in bone, lungs, liver, and brain (Fig. S1F–H). TS3132 was derived from mice with a mixed genetic background; therefore, it cannot grow in immune-competent mice. To facilitate the study of Pygo2 function in tumor immune regulation, we established Pten/Smad4 (PS) and Pten/Smad4/Pygo2 (PSP) cell lines from pDKO and pTKO tumors (Fig. 1L). When injected subcutaneously into C57BL/6 males, PS tumors grew significantly faster than PSP tumors (Fig. 1M). These newly established GEM and syngeneic models reinforced the PCa-promoting function of Pygo2 and prompted us to investigate the previously uncharacterized mechanisms underlying this function.
Pygo2 restricts CTL infiltration and attenuates CTL killing of PCa cells.
We first used mass cytometry (CyTOF) to quantify the primary immune cell populations in pDKO and pTKO tumors. CD8+ T cells were significantly increased in pTKO tumors (Fig. 2A, Fig. S2A). The higher infiltration of total T cells and CD8+ T cell subsets in pTKO compared to pDKO tumors was validated by IHC from 12-week pDKO mice and 18-week pTKO mice (Fig. 2B). When nDKOLuc and nTKOLuc tumors were compared using flow cytometry, Pygo2-deficient tumors had increased CD8+ T cells, increased CD4+ T cells, and decreased Treg frequency among CD4+ T cells (Fig. 2C). Similar differences were observed in pDKO and pTKO tumors (Fig. S2B). Similar levels of PMN-MDSCs (CD45+CD11b+Gr-1hi) and macrophages (CD45+CD11b+F4/80+) between pDKO and pTKO tumors and between nDKOLuc and nTKOLuc tumors were detected by flow cytometry (Fig. S2C), suggesting that the infiltration difference of T cell subsets by Pygo2 loss was unlikely to be explained by changes in PMN-MDSCs or macrophages. These differences in T cells were also unlikely to be explained by altered vasculature because nDKOLuc and nTKOLuc tumors had similar microvessel densities (Fig. S2D). Consistent with spontaneous tumors, syngeneic PSP tumors harbored more CD8+ and CD4+ T cells and a higher CD8+/Treg ratio, a pattern that was reversed by restoring Pygo2 expression in PSP cells (Fig. 2D).
Fig. 2. Pygo2 restricts CTL infiltration and attenuates CTL killing of PCa cells.

(A) Major immune population fractions in pDKO and pTKO tumors (n=3/genotype) quantified by CyTOF (left) with CD8+ T cells showing significant difference (right). The populations were manually gated, including CD8+ T cells gated as CD45+CD3+CD8+. (B) IHC staining and quantification for CD3 and CD8 in pDKO and pTKO tumors (n=12). (C) Flow cytometry quantification of CD8+ T, CD4+ T and Treg (CD4+Foxp3+) for nDKOLuc (n=11,8 and 12 respectively) and nTKOLuc tumors (n =12,7 and 10 respectively). (D) Flow cytometry quantification of CD8+ T, CD4+ T, and CD8+ effector/Treg ratio for syngeneic tumors formed by PS(n=5), PSP(n=4,4,5 respectively), or PSP-Pygo2-HA cells (n=3). (E) T cell cytotoxicity assay to compare the killing of PS-OVA and PSP-OVA cells by antigen-stimulated OT-I T cells at different cell ratios. Viable cancer cells were detected by resazurin (n=3). Scale bar 100μm. (F-G) Tumor growth curves of RM9 sgScr and sgPygo2 sublines in nude (F) or C57BL/6 mice (G) (n=6). (H-I) Flow cytometry quantification of intratumoral CD8+ T cells for syngeneic tumors formed by PS or PSP and treated with isotype IgG(n=7, 6 respectively) or anti-CD8(n=9,6 respectively) and the indicated tumor’s growth curves. (J) Endpoint tumor weight (n=6) and representative tumor photographs. In all panels, error bars represent SEM; ns, not significant, *P<0.05, **P<0.01, ***P<0.001, ****P<0.0001, Mann-Whitney test for (G), two-way ANOVA with Tukey’s multiple comparison test for (H)(I)(J), and unpaired t-test for the other panels.
Because Pygo2-deleted tumors exhibited higher effector T cell density and retarded tumor growth, we postulated that Pygo2 in PCa cells might drive resistance to CTL killing. We stably expressed chicken ovalbumin (OVA) in PS and PSP cell lines and co-cultured these sublines with OVA-specific TCR-transgenic CD8+ T cells from OT-I mice. PSP-OVA cells were more sensitive to OT-I T-cell killing than PS-OVA cells (Fig. 2E). These differences could not be explained by differences in MHC-I expression or cell proliferation between PS and PSP cells (Fig. S2E–G). To rule out that the function of Pygo2 in regulating tumor-T cell interactions is specific to the Pten/Smad4 model, we abolished Pygo2 expression with CRISPR/cas9 in the murine PCa cell line RM9 (transformed by ras and myc (32)) (Fig. S2H). Applying the OVA/OT-I system to RM9 sublines corroborated that Pygo2 loss sensitized PCa cells to T-cell killing (Fig. S2I). While Pygo2 knockout in RM9 affected tumor growth modestly in nude mice (Fig. 2F), it augmented T cell infiltration and dramatically decreased tumor formation in C67BL/6 mice (Fig. 2G, Fig. S2J). We depleted CD8+ T cells in C57BL/6 mice bearing PS and PSP tumors (when tumors reached 50–100 mm3) using an anti-CD8 neutralizing antibody (Fig. 2H, Fig. S2K). CTL ablation had little impact on PS tumor growth but partially restored PSP tumor growth (Fig. 2I–J). PSP tumors with CD8+ T cell depletion did not fully recover to the level of PS tumors, a result consistent with the slightly reduced tumor burden of TS3132-sgPygo2 cells implanted in nude mice (Fig. 1J–K) and indicative of the contribution of the cell-autonomous function of Pygo2. Nonetheless, data from different models indicate that Pygo2 expression in PCa cells can elicit cell non-autonomous activity to restrict effector T cell infiltration and cytotoxicity.
Pygo2 promotes PCa progression through Kit upregulation
Despite functional and clinical validation of Pygo2 in driving PCa progression (13, 14), the mechanism underlying Pygo2 function in PCa remains poorly understood. To identify Pygo2-regulated genes, we dissociated pDKO and pTKO tumors using a protocol employing B. Licheniformis-derived protease at 4°C designed to minimize artificial changes in gene expression patterns (33), followed by epithelial cell purification and microarray profiling (Fig. 3A, Fig. S3A). We identified 379 differentially expressed (DE) probes (p<0.05) between pDKO and pTKO tumor cells and validated several by qRT-PCR (Fig. S3B, Data file S1). Gene set enrichment analysis (GSEA) with MSigDB Hallmark gene sets showed that the p53 pathway and epithelial-mesenchymal transition (EMT) pathway were enriched in pDKO tumor cells, whereas immune-related pathways, such as interferon α response, interferon γ response, complement, and IL6-JAK-STAT3 signaling, were enriched in pTKO tumor cells (Fig. 3B, Data file S2–S3). We reasoned that Pygo2 might exert its immunomodulatory activity through specific mediator(s). To find candidate mediator, we performed an upstream analysis based on DE genes with Ingenuity Pathway Analysis (IPA). A list of putative upstream regulators was identified, including the receptor tyrosine kinase Kit, which was itself downregulated in pTKO tumor cells (Data file S4). Among the genes downregulated in pTKO PCa cells, multiple were mapped as Kit downstream genes by IPA (Fig. 3C). We validated Pygo2-loss-induced Kit downregulation using sorted pDKO and pTKO PCa cells (Fig. 3D). At the protein level, Kit and some of the Kit-downstream signaling proteins were also attenuated in pTKO compared to pDKO tumors (Fig. 3E). Among them, Ido1 has been reported to drive Kit-induced T-cell suppression in gastrointestinal stromal tumors (GIST) (34). Kit downregulation by Pygo2 knockout was also evident in PCa cell lines (Fig. 3F). IHC confirmed higher Kit and Ido1 expression in pDKO than pTKO tumors (Fig. 3G).
Fig. 3. Pygo2 promotes PCa progression through Kit upregulation.

(A) The schematic of tumor cell purification with EpCAM mcirobeads from pDKO (n=3) and pTKO (n=2) tumors followed by transcriptomic profiling. (B) Top enriched MSigDB Hallmark gene sets in pDKO or pTKO tumor cells. (C) KIT downstream targets drawn based on IPA knowledgebase. Targets highlighted in purple include a number of DE genes (Ido1, Akt1, Mapk8) based on the transcriptomic profiling. (D) qRT-PCR of Kit differential expression using purified tumor cells from pDKO (n=3) and pTKO tumors (n=3). (E) Western blot of Kit and other proteins in pDKO and pTKO tumors. (F) qRT-PCR measurement of Kit expression in mouse PCa cell lines (n=3). (G) IHC for Kit and Ido1 in pDKO and pTKO tumors. Scale bar, 50μm. (H) Spheroid assay of PS and PSP cell lines treated with vehicle or imatinib (n=6). (I) Syngeneic tumor growth curves for PS shScr(n=6), PSP shScr(n=8), PS shKit(n=10), and PSP shKit(n=8) in C57BL/6 mice. (J) Endpoint weight and photographs of tumors formed by PS and PSP sublines (n=6). (K) Spheroid assay for PS, PSP and PSP-Kit (n=4). (L) Endpoint tumor weight for syngeneic tumors formed by PS (n=5), PSP (n=5) or PSP-Kit (n=9). ns, not significant, *P<0.05, **P<0.01, ***P<0.001, ****P<0.0001; error bars represent SEM; unpaired t-test for (D)(F); two-way ANOVA with Tukey’s multiple comparison test for (H)(I)(J); one-way ANOVA with Tukey’s multiple comparison test for (K)(L).
Kit has oncogenic functions in GIST and acute myeloid leukemia. To determine whether Kit is essential for the pro-tumor function of Pygo2, we first confirmed that the Kit inhibitor imatinib (a small molecule inhibitor targeting multiple tyrosine kinases including c-KIT, ABL and PDGFR) decreased PS spheroid formation and migration but had marginal effect on PSP (Fig. 3H, Fig. S3D). Next, Kit shRNA knockdown decelerated the growth of PS tumors but had marginal effect on PSP tumors in C57BL/6 mice (Fig. 3I–J, Fig. S3E), supporting that Kit is downstream of Pygo2. Rescuing Kit expression in PSP recovered spheroid formation (Fig. 3K) and in vivo tumorigenicity to the level of PS (Fig. 3L). These results support a causal relationship of the Pygo2-Kit axis in driving PCa.
Pygo2 can regulate gene expression through the canonical Wnt/β-catenin signaling (24, 25). To determine whether the Pygo2-Kit axis requires Wnt/β-catenin signaling, we first stained β-catenin in PS cells and pDKO tumors and found almost exclusive localization to the cell membrane (but not nucleus) (Fig. S3F). This result is consistent with the lack of enrichment of the Wnt signaling pathway in a previous study that compared pDKO and PB-Cre4+ PtenL/L tumors (29), suggesting that Wnt signaling is not activated in pDKO. To test Wnt signaling more directly, we used several methods to modify the pathway and examine its effect on Kit expression. First, overexpression of constitutively active β-catenin (EβC) in PS or RM9 cells (Fig. S3G) enhanced the expression of classical Wnt/β-catenin targets but failed to change Kit expression (Fig. S3H). Next, PS cells were treated with LiCl or medium containing Wnt3a to activate the Wnt signaling in PS cells; the treatment induced canonical Wnt targets (Ccnd1, Axin2) but not Kit (Fig. S3I). Lastly, we compared Kit levels between prostate tumors from pTKO, pDKO, and PB-Cre4+ PtenL/L Smad4L/L ApcL/L (pPSA) mice. We recently developed pPSA mice and found that they formed aggressive PCa and penile cancer (35). We confirmed that despite the Apc-loss-induced nuclear localization of β-catenin in pPSA, no further increase in Kit staining was observed in pPSA compared with pDKO tumors (Fig. S3J). Our results indicate that Pygo2-driven Kit expression is unlikely to rely on Wnt/β-catenin activation and, instead, Pygo2 may regulate Kit expression through a previously uncharacterized fashion.
Pygo2 cooperates with p53 to upregulate the Sp1/Kit axis
Pygo2 depends on co-factors to regulate gene transcription (22, 23). We first performed a connection analysis from Pygo2 to Kit using IPA (Fig. 4A). Only four factors were predicted to be potential mediators from Pygo2 to Kit, including CTNNB1 (β-catenin), UBC (ubiquitin C), PDGFRA (platelet-derived growth factor receptor A), and PDGFRB. We ruled out these factors because, first, β-catenin was not involved in Pygo2-Kit regulation (see above). Second, the expression of PDGFRA and PDGFRB showed no difference between pDKO and pTKO PCa cells (Fig. S4A). Third, the connection between UBC to Pygo2 and Kit is based on protein-protein interactions that affect protein stability; thus, it is unlikely to account for Kit mRNA changes. We instead asked whether Pygo2 could regulate Kit by controlling the expression or activity of a particular transcription factor (TF). We used IPA to identify possible TFs upstream of Kit (Fig. 4A). We focused on TP53 (i.e., p53) based on three findings: first, the p53 pathway was among the top enriched pathways in pDKO tumor cells (Fig. 3B). Second, a TF enrichment analysis of the DE genes between pDKO and pTKO PCa cells with either IPA or Enrichr identified TP53 among the most significantly enriched TFs in pDKO (Fig. 4B, Fig. S4B, Data file S5–S6). Third, Pygo2 was reported to induce the accumulation and acetylation of p53 in hair follicle early progenitor cells (25).
Fig. 4. Pygo2 cooperates with p53 to upregulate the Sp1/Kit axis.
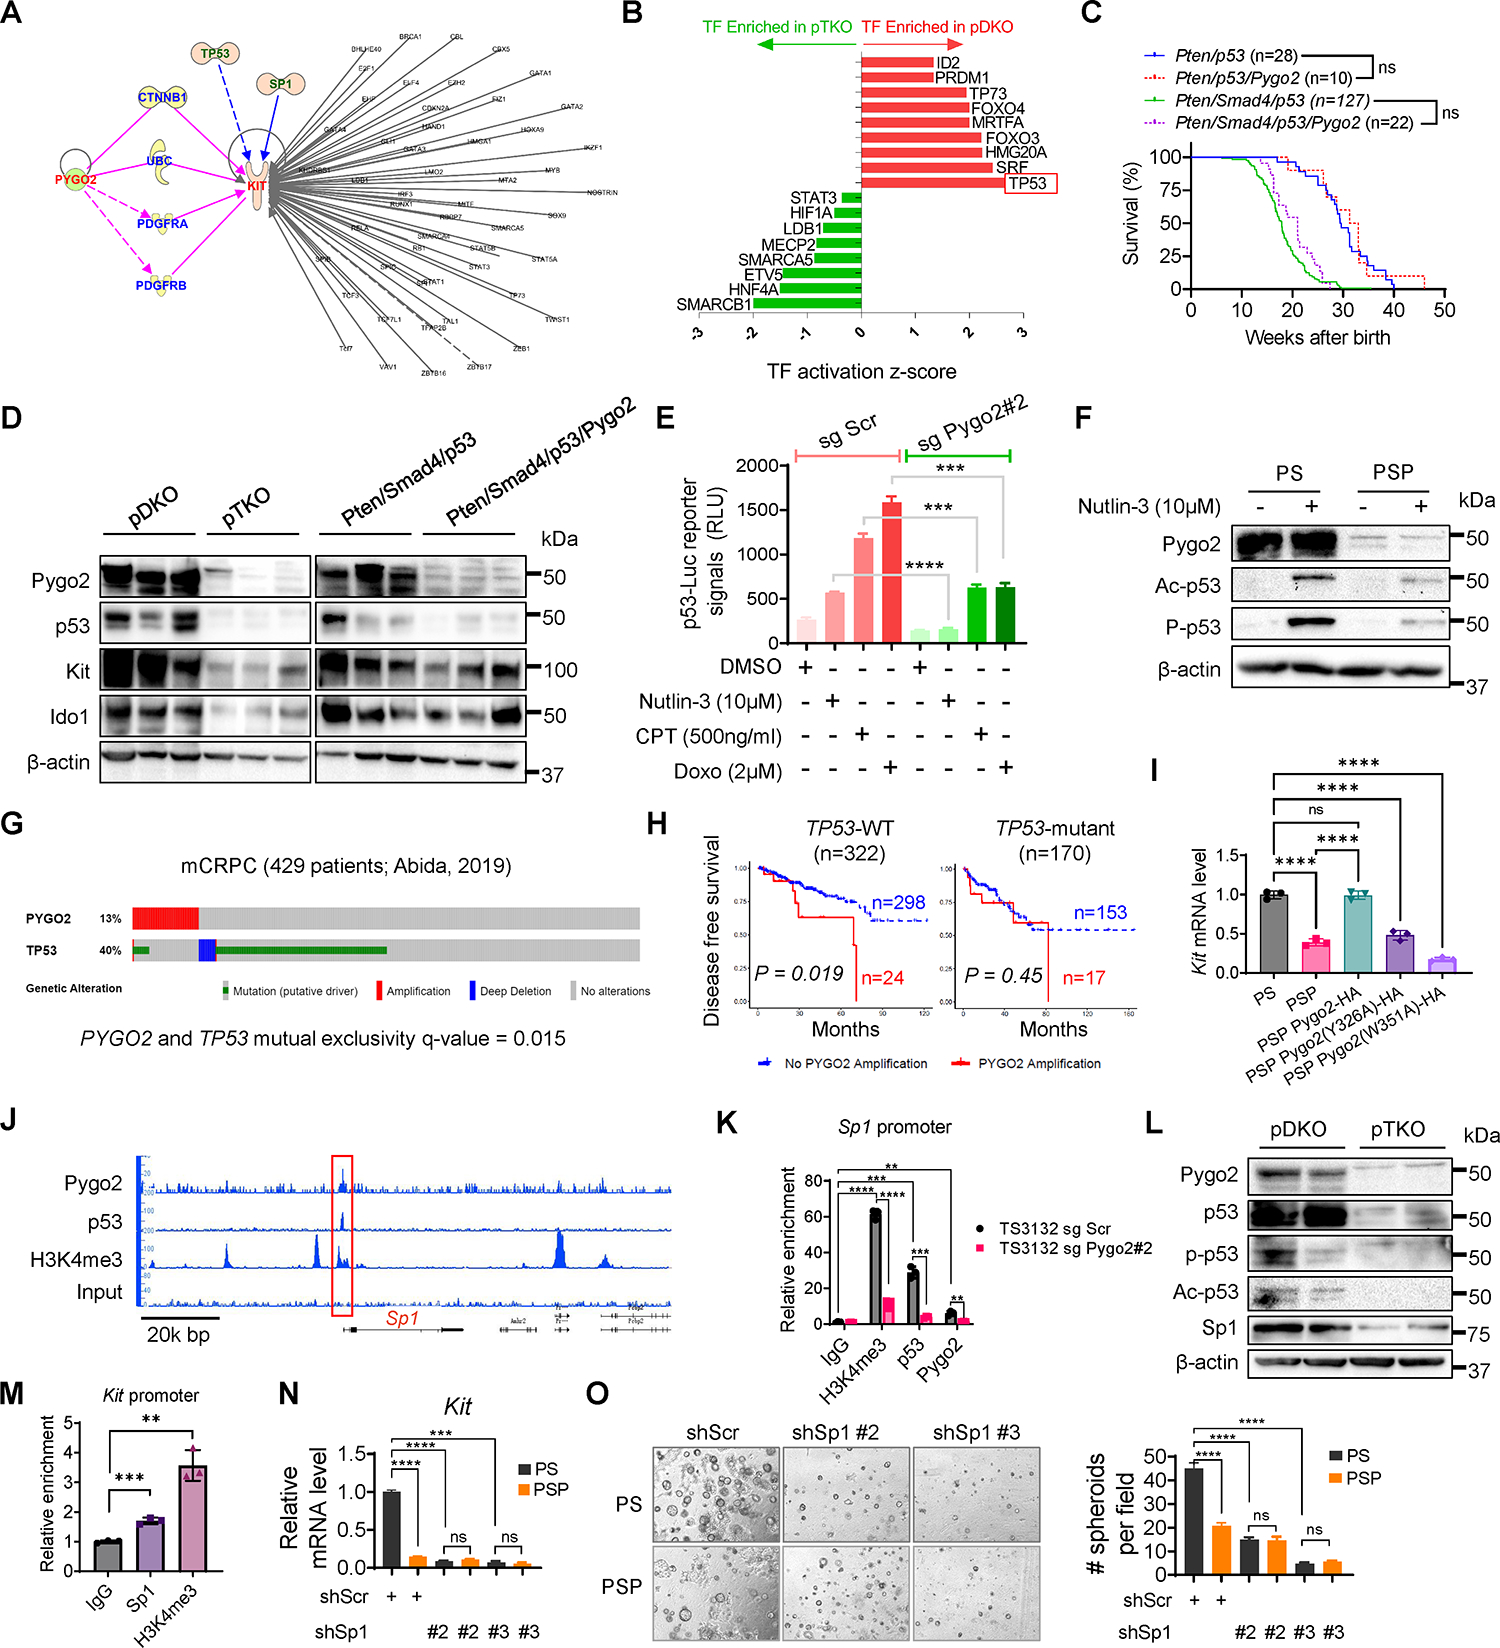
(A) IPA finding putative mediators between Pygo2 and Kit, and finding TFs regulating Kit. (B) TFs enriched in pDKO or pTKO tumor cells based on the DE genes between the two genotypes (P<0.05, ranked by activation z-scores), performed with QIAGEN Ingenuity Pathway Analysis. (C) Kaplan-Meier curves of Pten/p53 (n=28), Pten/p53/Pygo2 (n=10), Pten/Smad4/p53 (n=127), and Pten/Smad4/p53/Pygo2 (n=22) mice. ns, not significant, log-rank test. (D) Western blot of Pygo2, p53, Kit and Ido1 in pDKO, pTKO, Pten/Smad4/p53 and Pten/Smad4/p53/Pygo2 (n=3) tumor lysates. (E) p53 reporter assay of TS3132 sgScr and sgPygo2 cells treated with DMSO, nutlin-3, CPT or doxorubicin (n=3). (F) Western blot of Pygo2, acetyl-p53 (Lys379), phospho-p53 (Ser15) in PS and PSP treated with vehicle or nutlin-3 for 24h. (G) Genomic alterations of PYGO2 and TP53 in the mCRPC database, visualized by cBioPortal. (H) Disease free survival for patients stratified based on TP53 mutation status followed by PYGO2 amplification status. Dataset from Pca TCGA (Firehose Legacy). P values based on log-rank test. (I) qRT-PCR quantification of Kit expression in PS, PSP, and PSP sublines expressing HA-tagged WT or mutant murine Pygo2 (n=3). (J) IGB genomic views of the chromatin association of Pygo2, p53, and H3K4me3 at the genomic locus around Sp1, based on CUT&RUN-seq of PS. (K) CUT&RUN-qPCR to quantify the association of Pygo2, p53, and H3K4me3 to the Sp1 promoter in TS3132 sublines (n=3). (L) Western blot of Pygo2, p53, acetyl-p53 (Lys379), phospho-p53 (Ser15), and Sp1 in pDKO and pTKO tumors. (M) CUT&RUN-qPCR to quantify the association of Sp1 and H3K4me3 to the Kit promoter in TS3132 (n=3). (N) qRT-PCR of Kit expression in PS and PSP with Sp1 knockdown or shScr control (n=3). (O) Spheroid formation ability by PS(n=10,7,7 respectively) and PSP(n=7) with shScr control or Sp1 shRNA. error bars represent SEM; ns, not significant, **P<0.01, ***P<0.001, ****P<0.0001; unpaired t-test for (E)(K)(M)(N)(O); one-way ANOVA with Tukey’s multiple comparison test for (I).
We thus asked whether p53 can mediate Pygo2 regulation of Kit and contribute to Pygo2 function in PCa. To test this functionally, we deleted Trp53 with the PB-Cre4 driver and compared the survival of two pairs of mouse cohorts: PB-Cre4+ PtenL/L Trp53L/L (Pten/p53) compared with PB-Cre4+ PtenL/L Trp53L/L Pygo2L/L (Pten/p53/Pygo2), PB-Cre4+ PtenL/L Smad4L/L Trp53L/L (Pten/Smad4/p53) compared with PB-Cre4+ PtenL/L Smad4L/L Pygo2L/L Trp53L/L (Pten/Smad4/p53/Pygo2). Strikingly, while Pygo2 knockout extended survival substantially in the Pten/Smad4 genetic background (Fig. 1D), Pygo2 loss did not affect survival in the Pten/p53 or Pten/Smad4/p53 backgrounds (Fig. 4C). p53 protein level was higher in pDKO than pTKO tumors (Fig. 4D). Kit and its downstream protein, Ido1, were also higher in pDKO tumors than pTKO tumors, yet these two proteins remained unaltered between Pten/Smad4/p53 and Pten/Smad4/p53/Pygo2 tumors (Fig. 4D). The Kit mRNA level was comparable between Pten/Smad4/p53 and Pten/Smad4/p53/Pygo2 cell lines (Fig. S4C). To investigate how Pygo2 and p53 regulate Kit, we ruled out direct transcriptional regulation of p53 by Pygo2 (Fig. S4D). Instead, Pygo2 may cooperate with p53 to regulate downstream genes, based on nuclear co-localization (detected by proximity ligation assay) and physical interaction (detected by co-immunoprecipitation) of Pygo2 and p53 (Fig. S4E–F).
Pygo2 recruits histone acetyltransferases (e.g., CBP/p300 and the STAGA complex) to modulate the activity of transcriptional co-factors (23, 36). Additionally, acetylation of p53 by CBP/p300 directly affects its transcriptional activity (37). Using co-immunoprecipitation, we confirmed the interaction between Pygo2, CBP/p300 and p53 (Fig. S4F). A p53 reporter assay using TS3132 and Pygo2-knockout subline indicated that Pygo2 deletion dampened p53 activity stimulated by nutlin-3, camptothecin (CPT), or doxorubicin (Fig. 4E). Consistently, p53 acetylation and phosphorylation, indicative of p53 activity, were more pronounced in PS than PSP upon nutlin-3 (Fig. 4F) or CPT treatments (Fig. S4G). Hyperactivated p53 induces cell cycle arrest and apoptosis (38); however, Pygo2 did not seem to participate in this aspect of p53 function, as PS and PSP cells showed similar cell cycle profiles upon stress from nutlin-3, CPT, or doxorubicin (Fig. S4H). To test whether β-catenin is required for the regulation of p53 by Pygo2, we silenced Ctnnb1 expression with shRNA in both PS and PSP cells and observed higher levels of stress-induced p-p53 and Ac-p53 in PS-shCtnnb1 than PSP-shCtnnb1 cells (Fig. S4I). Furthermore, we showed that β-catenin knockdown in PS cells did not affect Kit level (Fig. S4J). Evidently, β-catenin is dispensable for the Pygo2-mediated regulation of p53 and Kit in PCa models.
To examine the Pygo2/p53 interaction in clinical samples, we surveyed the genetic status of PYGO2 and TP53 in the SU2C/PCF human mCRPC dataset (39). PYGO2 amplifications (13%) were mutually exclusive with TP53 alterations (40%, mainly mutations and deep deletions) (Fig. 4G). Furthermore, in the PCa TCGA cohort (40), if patients were stratified into TP53-wild type (WT) and TP53-mutant groups, PYGO2 amplification correlated with worse disease-free survival only in the TP53-WT group (Fig. 4H). Therefore, mouse and human genetic evidence support a critical role of p53 in Pygo2 function in PCa.
Next, we investigated how the Pygo2/p53 interaction regulates Kit expression. Pygo2 binding to histone H3K4me2/3 was crucial for Kit regulation, because Kit expression in PSP cells was rescued by ectopic expression of WT Pygo2, but not Pygo2 mutants (Y326A, W351A) deficient in H3K4me2/3 binding (26, 41) (Fig. 4I, Fig. S4K). The global association of Pygo2, p53, and H3K4me3 with chromatin was assessed using the CUT&RUN assay in PS cells. Neither Pygo2 nor p53 directly bound to Kit promoter region (Fig. S4L–M), suggesting the existence of an intermediate regulator. A co-localized binding peak of Pygo2, p53, and H3K4me3 was found near the promoter region of Sp1 (Fig. 4J), which was validated by CUT&RUN-qPCR using TS3132 sublines (Fig. 4K). Sp1 is often associated with a poor prognosis and regulates transcription in a context-dependent manner (42). Moreover, Sp1 binds to Kit promoter region to mediate transcription in hematopoietic cells (43, 44). Therefore, we tested whether Sp1 was an intermediate between Pygo2/p53 and Kit. Sp1 was expressed at a lower level in PSP than PS, but showed no difference between cell lines derived from Pten/Smad4/p53 and Pten/Smad4/p53/Pygo2 tumors (Fig. S4N), consistent with the hypothesis that Pygo2 sustains Sp1 expression in a p53-dependent manner. At the protein level, Sp1 was expressed at a higher level in pDKO tumors than in pTKO tumors, in concordance with the higher p53 modification and levels in pDKO tumors (Fig. 4L). The binding of Sp1 to the Kit promoter region was confirmed by the CUT&RUN-qPCR assay (Fig. 4M). shRNA-silencing of Sp1 downregulated Kit expression and spheroid formation only in PS but not PSP cells (Fig. 4N–O, Fig. S4O). Together, these results establish a previously uncharacterized pathway in PCa cells, where Pygo2 engages p53 to bind to the Sp1 promoter to sustain Sp1 expression, and Sp1 subsequently promotes Kit transcription and expression.
Pygo2 downregulates T cell infiltration through the Kit-Ido1 pathway
To determine whether Kit is responsible for Pygo2 function in CTL impairment, we dissociated syngeneic tumors formed by PS and PSP sublines with Kit knockdown or restoration and compared T cell abundances. Kit knockdown in PS increased CD8+ T cell infiltration in PS tumors to the same level as in PSP tumors, and stable expression of the same Kit shRNA in PSP did not alter CD8+ T cell infiltration (Fig. 5A–B). Ectopic Kit expression in PSP tumors brought the level of CD8+ T cells down to that of PS tumors. The CD8+ T/Treg ratio increased after Kit knockdown in PS and decreased when Kit expression was restored in PSP (Fig. 5A–B). Kit expression on the tumor cell surface was confirmed using flow cytometry of freshly isolated tumors (Fig. 5C). By comparing PS-OVA and PSP-OVA with their respective Kit-knockdown sublines for OT-I T cell killing, we found that Kit silencing sensitized PS-OVA, but not PSP-OVA, to killing (Fig. 5D). Consistent with the indispensable role of p53 in Pygo2-Kit regulation, when Pten/Smad4/p53 and Pten/Smad4/p53/Pygo2 tumors were compared, the T cell subsets showed no differences (Fig. S5A). These results indicate that Kit is the critical downstream mediator for Pygo2 to evade the anti-tumor effect from CTLs.
Fig. 5. Pygo2 downregulates T cell infiltration through the Kit-Ido1 pathway.

(A) Representative flow cytometry plots for CTL percentages in all CD45+ immune cells in syngeneic tumors formed by PS, PSP and sublines. (B) Quantification of tumor-infiltrating CD8+ T cells and the CD8+ T/Treg ratio for syngeneic tumors (n=4–9). (C) Kit protein level measured by flow cytometry on cancer cells freshly isolated from tumors formed by PS, PSP and sublines (n=3–8). MFI, median fluorescence intensity. (D) T cell cytotoxicity assay to compare the killing of PS-OVA and PSP-OVA cells with and without Kit knockdown by antigen-stimulated OT-I T cells at different ratios (n=3). Scale bar 100μm. (E) The normalized Trp and Kyn levels and their ratios in pDKO (n=4) and pTKO (n=5) tumor lysates, measured by mass spectrometry. (F) Kyn/Trp ratios measured by mass spectrometry for cell lysates and conditioned medium of PS-OVA (n=3) and PSP-OVA (n=3) co-cultured with OT-I T cells at ratio 1:1. (G) OT-I T cell cytotoxicity assay to compare the killing of PS-OVA and PSP-OVA cells in the absence and presence of Trp metabolites (l-kynurenine, 3-hydroxyanthranilic acid and 3-hydroxykynurenine) at 80μM (n=3). (H-I) Growth curves and endpoint weight of syngeneic tumors formed by PS (n=7,6 and 4 respectively) or PSP (n=6) in C57BL/6 mice and treated with vehicle, imatinib (50mg/kg, twice/daily), or 1-MT (400mg/kg, twice/daily). Error bars represent SEM; ns, not significant, *P<0.05, **P<0.01, ***P<0.001, ****P<0.0001, unpaired t-test for (D)(E)(F)(H)(I); one-way ANOVA with Tukey’s multiple comparison test for (B); two-way ANOVA with Tukey’s multiple comparison test for (G).
The Kit-Ido1 axis plays an important role in cancer cell-induced CTL dysregulation in GIST through producing immunosuppressive metabolites of tryptophan (Trp) (34). In PCa models, Kit and Ido1 shared the same expression pattern (Fig. 3E, 3G, 4D). We used mass spectrometry to quantify the relative abundances of Trp and the metabolite kynurenine (Kyn) in pDKO and pTKO tumor lysates. Although Trp levels showed no difference, Kyn and Kyn/Trp ratios were significantly lower in pTKO tumors (Fig. 5E). The Kyn/Trp ratio was also much higher in the lysate and medium of PS-OVA than PSP-OVA cells (Fig. 5F). The Ido1 inhibitor 1-methyltryptophan (1-MT) enhanced OT-I T cell killing of PS cells (Fig. S5B), while Trp metabolites (Ido1 products) reversed the gained sensitivity to OT-I T cell killing in PSP-OVA cells (Fig. 5G).
To target the Kit-Ido1 axis in vivo, we treated mice bearing PS or PSP syngeneic tumors with imatinib or 1-MT and observed that both inhibitors impeded growth of PS tumors but not PSP tumors (Fig. 5H–I). Within the TME, imatinib and 1-MT treatments of PS tumors increased CD8+ and CD4+ T cells and decreased the Treg fraction of CD4+ T cells (Fig. S5C). However, the infiltration of CD8+ and CD4+ T cells was unaltered by the treatments in PSP tumors (Fig. S5D–E). In conclusion, Kit-Ido1 cascade is the underlying mechanism for Pygo2-mediated CTL exclusion in PCa.
Pygo2 predominantly modulates tumor-infiltrating T cells revealed through scRNA-seq and functional assays.
To further characterize the role of Pygo2 in regulating the TME, especially CTLs, we performed single cell RNA-sequencing (scRNA-seq) of nDKOLuc tumor (10 weeks post-tamoxifen) and nTKOLuc tumor (17 weeks post-tamoxifen) of comparable sizes. After quality control, we obtained single-cell transcriptomes from 1,453 nDKOLuc cells and 2,055 nTKOLuc cells, which were clustered to 14 cell clusters including 11 immune cell types (Fig. 6A–B, Fig. S6A). CD8+ and CD4+ T cells were more abundant in the nTKOLuc tumor, whereas Treg and epithelial cancer cells were more abundant in the nDKOLuc tumor (Fig. 6C). We used Gene Set Variation Analysis (GSVA) to find differentially represented pathways in CD8+ T cells between nDKOLuc and nTKOLuc. CD8+ T cells from nTKOLuc enriched for various pathways related to T cell activities, such as costimulation by the CD28 family, CTL pathway, TCR pathway, Tcytotoxic pathway, and Interleukin 2 family signaling (Fig. 6D).
Fig. 6. Pygo2 predominantly modulates tumor-infiltrating T cells revealed through scRNA-seq and functional assays.

(A) tSNE plot of 3,508 single cells combined from nDKOLuc tumors (n=2) and nTKOLuc tumors (n=2), colored by annotated cell types. (B) Expression pattern of selected markers Cd3e, Cd8e, Cd4, Foxp3, Itgam, and Epcam. (C) Cell type fractions for nDKOLuc and nTKOLuc tumors. (D) Differences in pathway activities scored per cell by GSVA of MSigDB M2 gene sets on CD8+ T cells of the nDKOLuc and nTKOLuc tumors (adjusted P value < 0.05). (E) qRT-PCR of T cell marker genes in CD8+ T cells purified from nDKOLuc and nTKOLuc tumors (n=3/genotype). (F) Flow cytometry to quantify IFNγ and TNFα level in CD8+ T cells of nDKOLuc(n=4) and nTKOLuc(n=3) tumors. (G) Flow cytometry to quantify IFNγ, TNFα and IL2 in pre-stimulated OT-I CD8+ T cells cultured alone or co-cultured with PS or PSP cells at ratio of 2.5:1 for 2 days (n=3). (H) Flow cytometry to quantify CD8+ T cells and the OVA-MHC-tetramer+ fraction of RM9-sgScr-OVA(n=7) and RM9-sgPygo2-OVA(n=5) tumors. In (E)(F)(G)(H), error bars represent SEM; ns, not significant, **P<0.01, ***P<0.001, ****P<0.0001, unpaired t-test.
To validate that CD8+ T cells from nTKOLuc have higher activity, first, we purified RNA from microbead-isolated CD8+ T cells from nDKOLuc and nTKOLuc tumors of comparable sizes for detection of T cell markers by qRT-PCR. Two sets of markers, “cytokine and effector molecules” and “exhaustion markers”, based on Zheng et al (45) were assessed. CD8+ T cells from nTKOLuc expressed all the examined cytokine (IFNγ) and effector (e.g., perforin, granzymes) molecules at significantly higher levels than CD8+ T cells from nDKOLuc (Fig. 6E). For exhaustion markers, CD8+ T cells from nTKOLuc expressed a subset of the markers (including PDCD1 and CTLA4) at higher levels than CD8+ T cells from nDKOLuc, but co-inhibitory receptors LAG3 and TIM3 (HAVCR2) were comparable between the two CTLs, and CXCL13 showed the reversed pattern (Fig. 6E). This result suggests that CD8+ T cells in Pygo2-deleted tumors may be in a ‘poised/bivalent’ state with both activation and exhaustion markers expressed. Intracellular cytokine staining of IFNγ and TNFα by flow cytometry showed significantly higher fractions of IFNγ+ and TNFα+ subsets of CD8+ T cells in nTKOLuc tumors compared to nDKOLuc tumors (Fig. 6F).
The Pygo2-Sp1-Kit-Ido1 axis identified in our study suggests that tumor cells with high Pygo2 expression are able to directly suppress T cell activation in a manner independent of antigen recognition or tumor cell lysis, because the locoregional Trp depletion and Kyn production by Ido1 can impede the activation of effector T cells (46). Supporting this hypothesis, PS cells (no OVA) attenuated cytokine production (TNFα, IFNγ, IL2) and proliferation of co-cultured OVA-stimulated OT-I T cells more potently than PSP cells (no OVA) (Fig. 6G, Fig. S6B). In this assay, even at high OT-I T: tumor cell ratios (5:1, 10:1), antigen-independent cell killing was negligible (Fig. S6C). Next, from C57BL/6 mice carrying RM9-sgScr-OVA and RM9-sgPygo2-OVA tumors, we quantified OVA-antigen-specific CD8+ T cells by staining with H2-Kb-OVA(SIINFEKL)-tetramer in the tumors, draining lymph nodes and blood. RM9-sgPygo2-OVA tumors possessed a higher frequency of CD8+ T cells and a higher frequency of tetramer+ CD8+ T cells compared with RM9-sgScr-OVA tumors (Fig. 6H). However, draining lymph nodes and blood showed no difference in the frequencies of CD8+ T cells or tetramer+ subsets between the two tumor-bearing cohorts (Fig. S6D). Lastly, tumor-infiltrating DCs, the CD103+ subset and activation markers (CD80, CD40) on DCs were comparable between RM9-sgScr-OVA and RM9-sgPygo2-OVA tumors (Fig. S6E). Consistently, these DC markers also showed no differences at the protein level (Fig. S6F) or the single cell RNA level (Fig. S6G) between nDKOLuc and nTKOLuc tumors. These data support that tumor-cell-expressed Pygo2 predominantly restricts CTLs in the TME but has little impact on DCs or extratumoral CD8+ T cell priming.
Deletion and pharmacological inhibition of Pygo2 enhances immunotherapy.
Since Pygo2 extinction in PCa cells stimulated CTL infiltration in vivo and enhanced OT-I T-cell killing in vitro, Pygo2 ablation may enhance the efficacy of immunotherapies. To investigate the effect of Pygo2 knockout on ICB therapy, tumor-bearing C57BL/6 mice injected with RM9 control or Pygo2-knockout sublines were treated with isotype IgG or ICB antibodies (anti-PD1 plus anti-CTLA4). ICB decelerated but failed to eradicate any tumors, while Pygo2 knockout led to 25–50% remission. Strikingly, the combination of ICB and Pygo2 knockout eliminated all RM9 tumors (Fig. 7A–B). In an ACT immunotherapy setting, stimulated OT-I CD8+ cells were infused into nude mice bearing tumors formed by OVA-expressed RM9 control or Pygo2 knockout sublines. A single dose of ACT slowed down Pygo2-knockout-OVA tumors more dramatically than control-OVA tumors (Fig. 7C). Since the ACT experiment was conducted in nude mice that lack T cells, tumor-infiltrating CD8+ T cells only represent infused OT-I CTLs. We observed a 4-fold higher CD8+ T cell infiltration in Pygo2-knockout-OVA tumors than in control-OVA tumors (Fig. 7D). We excluded that the higher OT-I CTL infiltration in Pygo2-knockout-OVA tumors was simply the result of higher recruitment upon ACT, because shortly (18 hours) after the ACT, RM9-sgScr-OVA and RM9-sgPygo2-OVA tumors contained a similar frequency of OT-I T cells (Fig. S7A). Overall, targeting Pygo2 has the potential to enhance both ICB and ACT immunotherapies in PCa.
Fig. 7. Deletion and pharmacological inhibition of Pygo2 enhance immunotherapy.

(A-B) Tumor growth curves and survival analysis for C57BL/6 mice inoculated with RM9 sgScr or sgPygo2 sublines and treated with IgG or ICB (anti-PD1 plus anti-CTLA4). n=8 for each group, CR, complete regression. (C) Tumor growth curves for ACT experiment, where nude mice inoculated with OVA-expressing RM9 sgScr(n=4, 6 respectively) or sgPygo2 sublines(n=6) were infused with OVA-stimulated OT-I CD8+ T cells (1 × 10⁷) through tail vein at the arrow-indicated timepoint. (D) Flow cytometry quantification of tumor-infiltrating CD8+ T cells one week post-ACT. (E) Representative MRI images and tumor volume quantification of nDKOLuc (n=6, 4 respectively) and nTKOLuc mice(n=3,5 respectively) induced with tamoxifen and fed with standard chow or SX-682-admixed diet for 12 weeks. (F) Kaplan-Meier curves for standard or SX-682 diet treated nDKOLuc(n=11)and nTKOLuc mice (n=5, 6 respectively). (G) Flow cytometry quantification of tumor-infiltrating PMN-MDSCs(n=5,7.6 and 4 respectively), CD8+ T(n=8,6,7 and 3 respectively), and Treg(n=4,6,7 and 3 respectively) for standard or SX-682 diet treated nDKOLuc and nTKOLuc mice. (H) JBC117 and JBC117ana structures. (I-J) Growth curves for PS (n=8,8 and 7 respectively) and PSP (n=6,6 and 7 respectively) tumors treated with vehicle, JBC117 or JBC117ana. (K) Western blot to detect Pygo2, Kit and Ido1 in tumor lysates from the treatment groups. (L) Growth curves and endpoint weight for syngeneic tumors formed by RM9 and treated with control (vehicle plus IgG), ICB (anti-PD1 plus anti-CTLA4), JBC117, or ICB + JBC117 (n=6 per group). (M) Flow cytometry quantification of CD8+(n=4,4 and 3 respectively), CD4+(n=4), and Treg cells(n=4) from RM9 tumors treated with control, ICB, JBC117, or ICB+JBC117. (N) Growth curves for PS tumors treated with control, ICB, JBC117, or ICB+JBC117 (n=8 per group). (O) Growth curves for MyC-CaP tumors that progressed to CRPC after castration and treated with control(n=7), ICB(n=6), JBC117(n=6), or ICB+JBC117 (n=7). Error bars represent SEM; ns, not significant, *P<0.05, **P<0.01, ***P<0.001, ****P<0.0001, log-rank test for (B)(F); one-way ANOVA with Tukey’s multiple comparison test for (D)(L,right)(M); two-way ANOVA with Tukey’s multiple comparison test for (A)(C)(E)(G)(I)(J)(L,left)(N)(O).
PMN-MDSCs constitute a barrier to immunotherapy. Blocking CXCR2 attenuated PMN-MDSC infiltration and decelerated pDKO tumor progression (11). We found that Pygo2 loss in PCa cells did not affect PMN-MDSC abundance (Fig. S2A) or immunosuppressive ability (Fig. S7B). Therefore, Pygo2 and PMN-MDSCs suppress CTLs through separate mechanisms, suggesting that targeted both pathways could enhance PCa anti-tumor responses. Correspondingly, the CXCR1/2 antagonist SX-682 reduces PMN-MDSC infiltration in PCa (47), and the combination of SX-682 and anti-PD1 therapy are under evaluation in clinical trials (NCT03161431, NCT04599140). We fed tumor-bearing nDKOLuc and nTKOLuc mice with SX-682-supplemented chow (Fig. S7C). Although SX-682 was not as strong as Pygo2 loss in attenuating nTKOLuc tumor progression, combined Pygo2 loss and SX-682 therapy led to the smallest tumors (Fig. 7E) and the most extended survival (Fig. 7F). SX-682 reduced PMN-MDSCs, increased CD8+ T cells and downregulated the Treg fraction of CD4+ T cells in nDKOLuc and nTKOLuc tumors (Fig. 7G). Together, co-targeting Pygo2 and PMN-MDSCs elicited combinatorial anti-tumor immunity.
Work from Ali et al. identified a Pygo2 small molecule inhibitor, JBC117, based on virtual screening for agents targeting the PHD domain of Pygo2, and demonstrated an anti-tumor effect of JBC117 on colon and lung cancer xenografts (48). However, it was unclear whether the anti-tumor activity of JBC117 was dependent on Pygo2 expression. We synthesized JBC117 and its analog JBC117ana, which lacks one hydroxyl group (Fig. 7H, Fig. S7D–E). JBC117 and JBC117ana blocked Pygo2-H3K4me2 binding based on a custom enzyme-linked immunosorbent assay (ELISA) (Fig. S7F–H). JBC117 or JBC117ana reduced tumor growth and expression of Kit and Ido1 in PS tumors but not in PSP tumors (Fig. 7I–K), supporting the on-target activity of the inhibitors.
We next tested whether JBC117 sensitized PCa to immunotherapy. In the RM9 model, ICB and JBC117 exhibited single-agent anti-tumor activity, but the combination showed more potent efficacy (Fig. 7L). Infiltration of CD8+, but not CD4+ T cells, was increased by ICB or JBC117, and JBC117 enhanced the ability of ICB to reduce tumor Treg (Fig. 7M). The combinatorial efficacy of ICB and JBC117 was also observed in the PS model (Fig. 7N). Furthermore, using the MyC-CaP model of CRPC (49), we demonstrated that while the MyC-CaP CRPC tumors were resistant to ICB alone and partly sensitive to JBC117, the ICB and JBC117 combination induced the highest level of tumor control (Fig. 7O). Together, these results indicate that Pygo2 inhibition is a promising approach to sensitize advanced PCa (including CRPC) to ICB therapy.
Human Pygo2 overexpression is associated with lower CTL infiltration and worse outcome in ICB clinical cohorts.
To explore the correlation between Pygo2 and CTL infiltration in human PCa, we performed GSEA of the CTL gene signature (Table S1) on several transcriptomics datasets of primary or metastatic human PCa (39, 40, 50). The CTL signature was enriched in patient samples with low PYGO2 expression (Fig. 8A). Experimentally, immunofluorescence staining for Pygo2 and CD8 in 36 archived samples of human primary PCa was performed (Fig. 8B). Pygo2 expression appeared heterogeneous in the epithelial areas of some tumor samples, consistent with the histological heterogeneity of human PCa. Therefore, we classified the samples into group A, composed of more homogeneous Pygo2 staining, and group B, composed of more heterogeneous Pygo2 expression. In Group A, samples with higher Pygo2 expression contained significantly fewer CD8+ T cells, whereas in Group B, tumor areas with higher Pygo2 expression also showed much lower CD8+ T cell infiltration (Fig. 8C). Therefore, clinical evidence supports the role of Pygo2 in restricting intratumoral density of CTLs.
Fig. 8. Human Pygo2 overexpression is associated with lower CTL infiltration and worse outcome in ICB clinical cohorts.
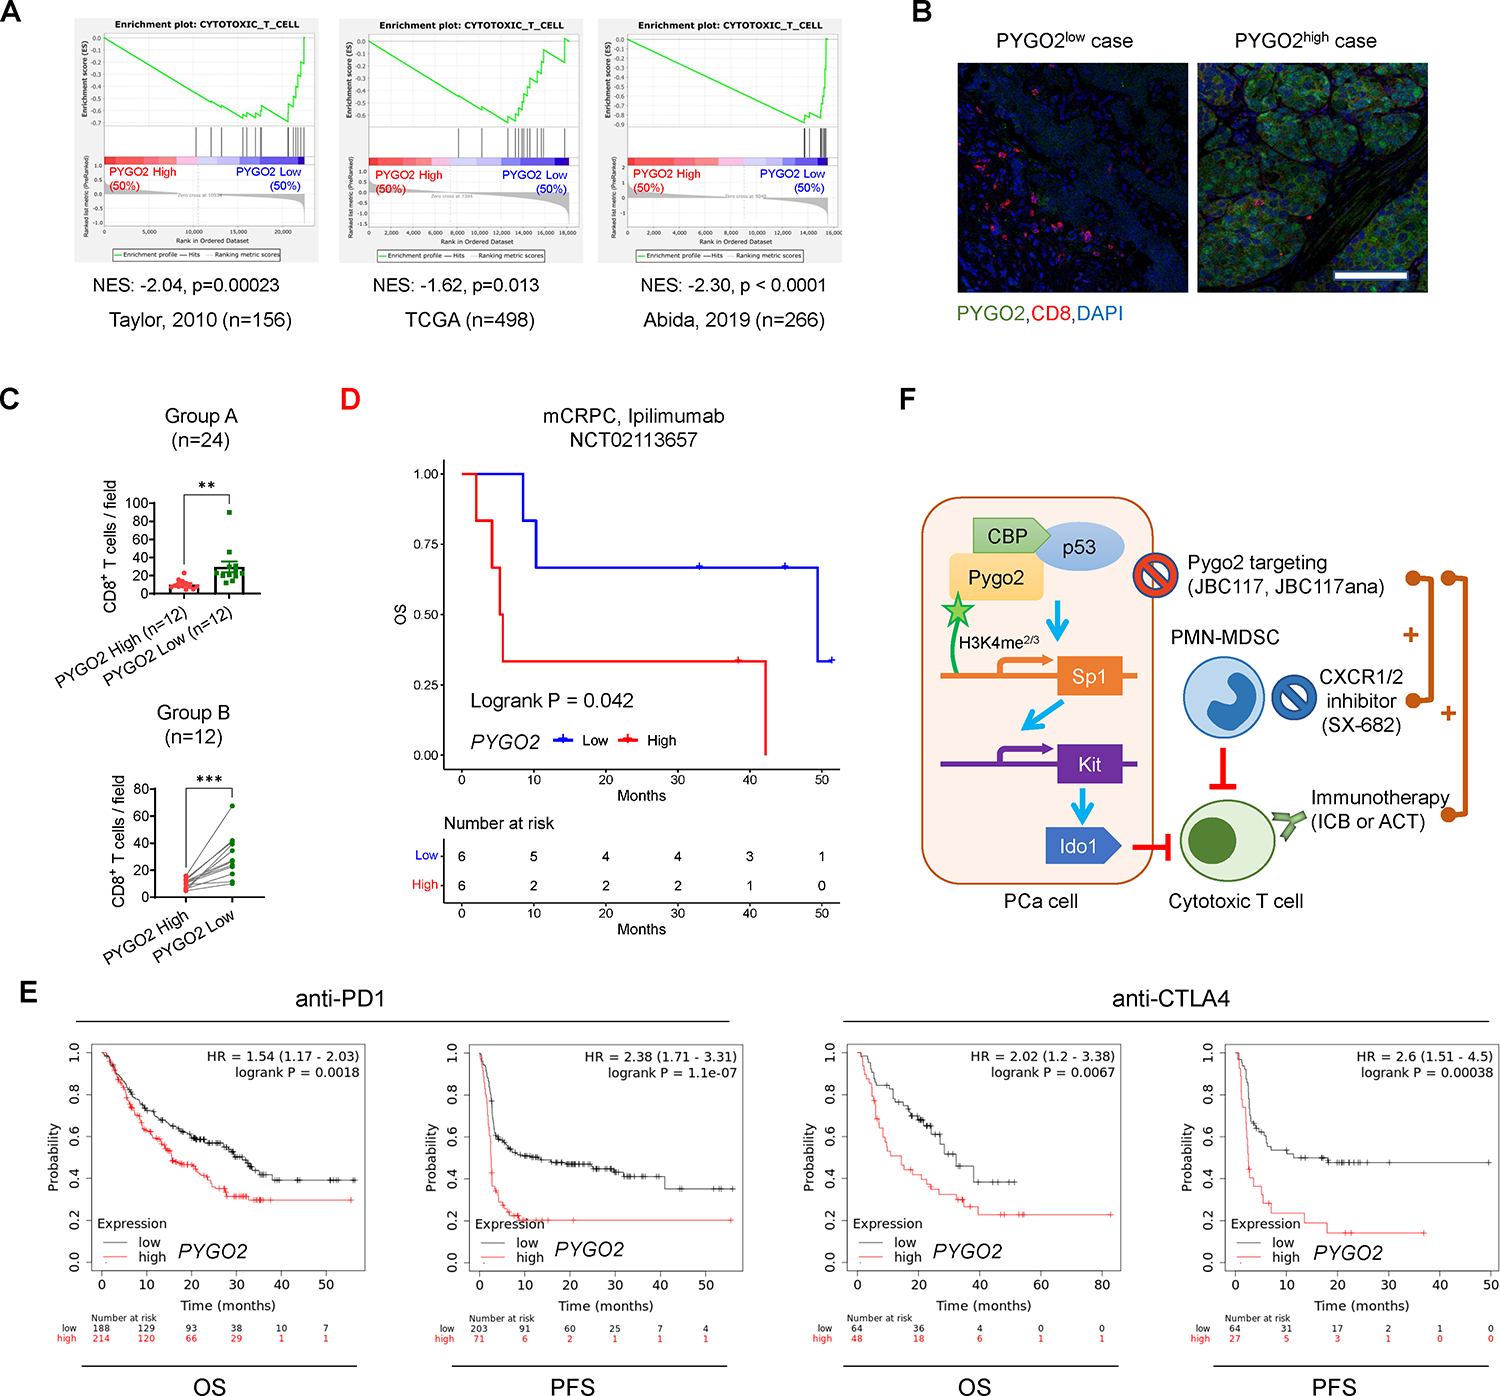
(A) GSEA of a CTL gene signature on PCa cases with high and low PYGO2 levels in three datasets. (B) Representative co-immunofluorescence staining images of Pygo2 and CD8 in primary PCa. Scale bar, 100μm. (C) Quantification of CD8 staining in primary PCa samples with relatively homogeneous Pygo2 staining pattern (Group A) or relatively heterogeneous Pygo2 staining pattern (Group B). In Group A (n=24), cases were stratified as Pygo2 high and low subgroups. In Group B (n=12), on the tissue sections, areas with high and low Pygo2 staining were demarcated for quantifying CD8+ T cells. Error bars represent SEM. **P<0.01, ***P<0.001, unpaired t-test (unpaired for group A, paired for group B). (D) Association of PYGO2 expression with OS in mCRPC ipilimumab clinical trial NCT02113657. (E) Association of PYGO2 expression levels with OS and PFS for anti-PD1 or anti-CTLA4 treatment with data from multiple clinical studies, drawn with KMplot. Cancer types include melanoma (n=570), urothelial (n=348), head and neck (n=110), esophageal (n=103), bladder (n=90), glioblastoma (n=28), hepatocellular (n=22), small cell lung cancer (n=22), and non-small cell lung cancer (n=21). (F) Schematic illustration of Pygo2 immuno-modulatory function and therapeutic opportunity in PCa. Pygo2 binds to H3K4me2/3 and engages CBP/p300 and p53 to activate Sp1 expression. Sp1 in turn upregulates Kit which induces Ido1 to impair CTLs and augment Treg (not drawn). Therapeutically, Pygo2 inhibition decelerates prostate tumor growth and synergizes with different classes of immunotherapeutics to eradicate PCa (including CRPC).
Further clinical support for the immuno-modulatory function of Pygo2 came from in silico analysis of survival and transcriptome data for patients treated with ICB therapies. First, from a phase 2 clinical trial (NCT02113657) of ipilimumab (anti-CTLA4) in mCRPC patients (51), we ranked the samples by normalized PYGO2 expression levels and defined the top one third as PYGO2high group and the bottom one third as PYGO2low group. The results showed that PYGO2high group showed worse overall survival (OS) than the PYGO2low group (Fig. 8D). Next, we extended this analysis beyond PCa and used the Kaplan-Meier plotter portal (52) to compare with OS and progression free survival (PFS) for the combined cases of ICB clinical trials on several cancer types (PCa unavailable). Patients with PYGO2high tumors showed significantly shorter OS and PFS (Fig. 8E).
DISCUSSION
A combinatorial approach that fosters a TME conducive to immunotherapy is likely required to treat advanced PCa effectively. Recent studies have highlighted the potential of sensitizing PCa to ICB therapy by inhibiting immunosuppressive myeloid cells, especially PMN-MDSCs, using CXCR1/2 antagonists, IL-23 blockade, and kinase inhibitors such as cabozantinib (53). Another powerful approach is to target cancer-cell-intrinsic mechanisms that simultaneously control cancer cell malignant functions and the formation of an immunosuppressive TME (8, 9), although investigations using this approach have remained limited in PCa. Here, we show that Pygo2, a PCa oncoprotein encoded by the 1q21.3 amplicon, initiates a signaling cascade that involves p53, Sp1, Kit, and Ido1 to reduce the activation and density of intratumoral CTLs in the TME of PCa (Fig. 8F). Genetic or pharmacological inhibition of Pygo2 not only generated single-agent anti-tumor activity and prolonged the survival of PCa-bearing mice but also enhanced the efficacy of ICB and ACT therapies. This newly identified function of Pygo2, in addition to its cell-autonomous functions in promoting PCa cell proliferation and potentially stemness (13, 26), strongly supports the clinical development of Pygo2 inhibitors as a new avenue for the treatment of PCa and possibly other malignancies with high Pygo2 expression (15–17, 19–21).
Previous studies focused on the cell-autonomous function of Pygo2 in cancer cell proliferation and stemness. Our study elucidates a Pygo2-controlled signaling axis that fosters a metabolically immunosuppressive TME in which CTL infiltration and activity are constrained. This finding echoes the therapeutically relevant theme that various oncogenic pathways play master regulatory roles in shaping the tumor immune landscape and dictating tumor resistance to immunotherapy (8, 9). Consequently, pharmacological inhibition of Pygo2 can have two effects: thwarting tumor cell proliferation and enhancing CTL infiltration and activity. Because the histone code reader function of Pygo2 through binding between its PHD domain and H3K4me2/3 is required for Pygo2 to promote Kit expression, pharmacological targeting the PHD domain is a valid approach to suppress the downstream signaling we identified here.
Both mouse and human PCa genetic data suggest p53-dependence of Pygo2 function. This result adds to the known complexity of p53 function in cancer progression (54, 55). Pten/p53 mice developed PCa more rapidly than PB-Cre4+ PtenL/L mice due to removing the p53-dependent cellular senescence (56). However, this tumor suppressor function of p53 was not manifested in the Pten/Smad4 background because the median survival for pDKO (Pten/Smad4) and Pten/Smad4/p53 mice was 16.4 and 17.9 weeks, respectively. This may be explained by the convergent function of p53 and TGFβ/Smad signaling to restrict early tumorigenesis (57). The p53 activity regulated by Pygo2 is insufficient to cause cell cycle arrest or apoptosis, and Pygo2 does not participate in p53-dependent cell cycle regulation. Our results showed the co-occupancy of Pygo2 and p53 to the Sp1 promoter. Previous studies using ChIP-seq identified Sp1 as a direct target and signaling intermediate effector of p53 (58, 59). Our finding of Sp1 binding to the Kit promoter region is consistent with reports showing the recruitment of Sp1 to the G-quadruplex-forming sites in the KIT promoter (60). More work is needed to identify the components of the TF complexes that control Sp1 and Kit expression in a Pygo2-dependent manner.
Several limitations of our study remain. First, Pygo2 may modulate immunosuppression through mechanisms in addition to the Kit/Ido1 pathway because PCa cells in pTKO mice were also enriched for innate immune pathways, such as interferon-α response, interferon-γ response, and JAK/STAT signaling. Since Pygo2’s function in immunosuppression may go beyond the Kit/Ido1 pathway, it is reasonable to expect that targeting Pygo2 is more effective than inhibiting Kit or Ido1 in treating human PCa. Our follow-up studies investigating other Pygo2 immune-modulatory mechanisms will help provide a more complete picture. Second, although the cell-autonomous function of Pygo2 was not the focus of the current study, this aspect of Pygo2 function clearly also contributes to PCa development. In fact, having both cell-autonomous and non-autonomous (immune-mediated) contributions to tumor progression is likely a common feature for many of the oncogenic pathways that were found to shape the immunosuppressive microenvironment (8, 9). For example, β-catenin activation, PTEN loss and MYC overexpression were all identified as important cancer-cell-intrinsic mechanisms to mediate tumor immune evasion. Apparently, the respective genetic/epigenetic alterations of these genes all have direct activities in tumor cell survival, proliferation and differentiation. However, this does not downplay their important roles in programing an immunosuppressive landscape. From a translational persepctive, genes or pathways having these dual activities are attractive therapeutic targets, because the inhibition of such mechanisms may compromise tumor cell survival and sensitize tumor cells to immunotherapy simultaneously. Third, while our evidence unequivocally shows that Pygo2 orchestrates the p53/Sp1/Kit/Ido1 signaling independently of Wnt/β-catenin signaling, our results do not exclude the possibility that other Pygo2-mediated mechanisms in PCa growth and immuno-modulation may involve Wnt/β-catenin signaling. Lastly, it is important to note that the PCa ICB clinical trial study supporting the association of PYGO2 overexpression and adverse outcome had low patient numbers; therefore, future validation studies with larger sample sizes from PCa ICB clinical studies are warranted when they become available.
A significant contribution of this study is the translational implications of targeting Pygo2. Through genetic ablation of Pygo2, we demonstrated that all three immunotherapy approaches (ICB, ACT, and CXCR2 inhibitor) were enhanced in PCa mouse models when Pygo2 was co-targeted. Additionally, we synthesized JBC117 and JBC117ana as prototype Pygo2 inhibitors and showed that they largely phenocopied Pygo2 genetic deletion to generate both single-agent and combinatorial efficacy with ICB, including treating CRPC. Nevertheless, the potency of JBC117 and JBC117ana to inhibit Pygo2-H3K3me2 interaction was moderate, prompting ongoing studies in our laboratory to perform virtual screening followed by ELISA-based validation to identify Pygo2 inhibitors with better drug-like properties.
MATERIALS AND METHODS
Study Design
The objective of this study was to investigate the immune-modulatory function and mechanism of Pygo2 and determine the effect of Pygo2 extinction on the immunotherapy efficacy of PCa. We used GEM and syngeneic tumor models to investigate the role of Pygo2 in modulating the immune control of PCa progression and metastasis. Unbiased transcriptomic profiling of sorted PCa cells from the models was used to identify genes potentially regulated by Pygo2, which was assisted with pathway and network analyses. Pygo2 regulation of the p53/Sp1/Kit/Ido1 pathway was delineated through gain and loss of function studies, CUT&RUN assay, and GEM modeling. To gain a comprehensive view of how Pygo2 regulates the TME, scRNA-seq was used to compare DKO and TKO tumors. To test Pygo2 targeting, expression ablation or pharmacological inhibition of Pygo2 was examined as a single treatment or in combination with ICB, ACT and CXCR2 inhibitor therapies in various syngeneic models. Lastly, the clinical relevance of Pygo2 was examined through GSEA analysis, correlation with patient outcome in ICB clinical trials, and clinical specimen staining.
Mice
PB-Cre4, PtenL/L, Smad4L/L, p53L/L, and Rosa26-LSL-LucL/L alleles have been previously described (47). Pygo2L/L allele has been previously reported (28). Nkx3.1CreERT2 allele was obtained from the NCI mouse repository (strain number 01XBQ). All GEM mouse models were backcrossed to a C57BL/6 background for at least four generations. C57BL/6J (RRID: IMSR_JAX:000664), OT-I (C57BL/6-Tg (TcraTcrb)1100Mjb/J, RRID: IMSR_JAX:003831), FVB/NJ (RRID: IMSR_JAX:001800) and NSG mice (IMSR_JAX:005557) were purchased from Jackson Laboratory. Nude mice (RRID: IMSR_TAC:ncrnu) were purchased from Taconics. All animal work performed in this study was approved by the Institutional Animal Care and Use Committee (IACUC) at University of Notre Dame (protocol number 20-03-5930). All animals were maintained under pathogen-free conditions and cared for in accordance with the International Association for Assessment and Accreditation of Laboratory Animal Care policies and certification.
Animal Experiments
For tamoxifen-inducible PCa models, nDKOLuc and nTKOLuc mice between 1–4 months were intraperitoneally (i. p.) injected with tamoxifen (Sigma-Aldrich, T5648) at 1mg in 100μl corn oil for 5 consecutive days to induce Cre activity and tumorigenesis. For SX-682 treatment experiments, nDKOLuc mice 4–6 weeks post-tamoxifen and nTKOLuc mice 8–10 weeks post-tamoxifen had similar tumor volumes; thus, they were fed with SX-682 medicated chow (Syntrix Pharmaceuticals) prepared at 1428.5 mg/kg (equivalent to 200 mg/kg mouse body weight/day) until the survival endpoint.
For syngeneic or allogenic primary tumor experiments, 1×10⁶ tumor cells were injected subcutaneously into C57BL/6 or nude male mice. For experimental metastasis experiments, 2×10⁵ tumor cells were injected intracardially into nude male mice. Metastatic tumors were monitored by bioluminescence imaging at the indicated time points. Mice were sacrificed eight weeks post-injection for necropsy.
For CD8+ T cell depletion experiments, mice with tumors reaching 50–100 mm3 were randomized to receive i.p. injection of an initial 400μg followed by 200μg anti-CD8 (BioXCell, BE0061) twice weekly or an equivalent dose of isotype IgG control. For targeted therapeutic experiments, mice with tumors reaching 50–100 mm3 were randomized to receive the following therapies at the reported doses: imatinib (MedChem Express. HY-50946) at 50 mg/kg, i.p., twice/day (34), 1-MT (Sigma-Aldrich, 452483) at 400 mg/kg, oral, twice/day (34), JBC117, and JBC117ana (synthesized in-house, see below) at 20 mg/kg, subcutaneously, daily (48). For ICB therapy, 2×10⁶ RM9 sublines or 1×10⁶ PS were inoculated into both flanks of C57BL/6 male mice, 1×10⁶ MyC-CaP cells were inoculated into both flanks of FVB/N male mice. RM9 tumor were treated three days after inoculation, PS tumor were treated when tumor reach around 50 mm3. MyC-CaP tumor were surgically castrated at day 23 after tumor inoculation and treated with agents 12 days post castration. Mice were treated with anti-PD1 (BioLegend, 114116) and anti-CTLA4 (BioLegend, 106207) at 10mg/kg each, i.p., twice a week, or an equivalent dose of isotype IgG control together with or without 20 mg/kg subcutaneously JBC117 daily injection. All treatments were continued until the specified experimental endpoints were reached.
For animal experiments, sample size was chosen based on the variability observed in preliminary experiments, which was part of the approval process for the IACUC protocol. Rules for stopping data collection were also defined as part of the IACUC protocol approval process. If a mouse died due to other conditions instead of tumor burden, it was excluded from the analysis. Animals were randomly assigned into a treatment group after detection of tumor formation. The starting tumor burden in the treatment and control groups was similar before treatment. Blinding was not always possible for animal experiments, due to the fact that the main investigator was aware of the mouse identifications. However, when technicians performed the drug treatment experiments in animal studies, blinding was practiced. Since the study was focused on PCa, only male mice were used in the study.
Adoptive OT-I T Cell Transfer
Splenocytes were isolated from the spleen of 6–10-week-old OT-I male mice and pulsed with 2ug/ml of OVA peptide SIINFEKL (VWR, H-4866.0001BA) for 4 h in T cell culture media composed of RPMI1640 (GE Healthcare, SH30027.01) supplemented with 10% FBS, 100U/ml penicillin-streptomycin, and 50μM 2-mercaptoethanol (VWR, 97064–880). Splenocytes were washed three times with PBS and seeded 1×10⁷ cells/well in 6-well plates. Cells were propagated every 1–2 days and T cells proliferated to form clusters. After 5 days, T cells were washed three times with PBS, and 1×10⁷ OT-I T cells in 100ul PBS were intravenously injected into nude mice or NSG mice inoculated with RM9 sublines. For T cell recruitment assay, tumors were harvested and dissociated for immune cell profiling 18h after the OT-I T cell infusion. For T cell killing assay in vivo, tumor-bearing mice were monitored until the specified endpoint.
Immunohistochemistry (IHC) and Immunofluorescence (IF)
Animal tissues were fixed overnight in 10% formalin and embedded in paraffin. IHC and IF staining were performed as previously described (47). Antigen retrieval was performed by heating in a pressure cooker at 95oC for 30 min, followed by 115oC for 1 min in citrate-unmasking buffer (pH 6.0). The IHC slides were scanned using an Aperio ScanScope (Leica). For IF staining of human FFPE specimens, the tumor areas were demarcated based on pathological inspection of H&E staining. IF slides were imaged with an A1R confocal laser microscope (Nikon), and CD8+ T cells were counted manually. Primary antibodies used included Pygo2 (clone S3I4, previously reported (26)), Ki67 (Fisher Scientific, RM-9106-S1), cleaved caspase 3 (Cell Signaling Technology, 9661), Kit (Cell Signaling Technology, 3074), Ido1 (Santa Cruz Biotechnology, sc137012), CD3 (DAKO, A0452), mouse CD8a (Cell Signaling Technology, 98941), human CD8a (Biolegend, 372902), β-catenin (Cell Signaling Technology, 8480), and CD31 (Cell Signaling Technology, 77699).
For clinical sample experiments, formalin-fixed paraffin-embedded (FFPE) slides of primary prostate tumors harvested by transurethral resection of the prostate or radical prostatectomy were obtained from the tissue bank at the Indiana University School of Medicine. All specimens were de-identified. The experiments were approved by the IRB protocols of Indiana University School of Medicine (IRB#1808872882) and University of Notre Dame (20-3-5926). The clinical characteristics of the samples are summarized in Table S2.
CUT&RUN Assay Followed by Sequencing or qPCR
CUT&RUN experiments were conducted using 200,000 PS or PSP cells using the CUT&RUN assay kit (Cell Signaling Technology, 86652). Briefly, the cells were washed and bound to concanavalin A-coated magnetic beads. Next, permeabilized cells were incubated with IgG (Cell Signaling Technology, 66362), antibodies against H3K4me3 (Cell Signaling Technology, 9751), Sp1 (Santa Cruz Biotechnology, sc-420), p53 (Cell Signaling Technology, 2524), or Pygo2 (clone S3I4) for 2h at 4°C with rotation. The cell-bead slurry was washed and incubated with protein A-MNase for 1h at 4°C with rotation. CaCl2 was added to the cell-bead slurry to initiate protein A-MNase digestion, and the reaction was incubated at 4°C for 30 min. The reaction was stopped with stop buffer containing 50pg of spike-in DNA. Digested DNA was extracted and purified using DNA purification spin columns (Cell Signaling Technology, 14209). The input samples were sonicated for 12 min with a Covaris S220 Ultrasonicator System to obtain a fragment size between 150–300bp. For sequencing, we prepared a library using the SimpleChIP ChIP-seq DNA Library Prep Kit for Illumina (Cell Signaling Technology, 56795). The library was sequenced using MiSeq (Illumina) in the Genomic & Bioinformatics Core Facility at the University of Notre Dame. Data were analyzed using Galaxy (https://usegalaxy.org/). The reads were aligned to the mm10 reference genome. Peak calling was performed using MACS2 software. To validate individual binding, qPCR was performed using SYBR Green qPCR master mix (Bimake, B21202). The enrichment of the Kit and Sp1 promoter regions was calculated relative to the IgG control. For Sp1 promoter region, forward primer 5’-TAATTGGCTGTTCGTTCACGTC-3’; reverse primer 5’-GGAGCAAGCTTCCTAAACCA-3’. For Kit promoter region, forward primer 5’-AGCGTCCTCTCTCCGA-3’; reverse primer 5’- CCGCAAGAAAAGGCTCT-3’.
Single-cell RNA-seq Library Preparation and Analysis
Two nDKOLuc tumor and two nTKOLuc tumors were harvested at 10 or 17 weeks post tamoxifen inducing respectively. Next, tumor was minced and dissociated with mouse dissociation kit (Miltenyi Biote,130-096-730) at 37°C for 1h. Dissociated tumor single cell suspension were passed through 40μm strainer followed by red blood cell lysis. Then the dead cell was removed using EasySep Dead Cell Removal (Annexin V) Kit (STEMCELL Technologies, 17899) followed by hashtag staining and labelling – TotalSeq™-A0303 (BioLegend, 155805) and TotalSeq™-A0304 (BioLegend, 155807) for nDKOLuc staining; TotalSeq™-A0305 (BioLegend, 155809) and TotalSeq™-A0306 (BioLegend, 155811) for nTKOLuc staining. At this step, the samples were transferred to Genomics and Bioinformatics Core Facility at University of Notre Dame, where cells were counted, evenly combined and loaded onto the Chromium Controller (10X Genomics). The samples were then processed following the protocol of Chromium Single Cell 3’ Reagent Kits. Next, the samples were sequenced with Illumina NovaSeq 6000 platform at the Medical Genomics Center at Indiana University.
Data analysis was performed by the Collaborative Core for Cancer Bioinformatics at Indiana University. CellRanger 7.0.0 (10x Genomics) was utilized to process the raw sequence data. In general, the sequencing reads were aligned to the mouse reference genome mm10 with the RNAseq aligner STAR (61). The aligned reads were traced back to individual cells given corresponding cell barcodes. After removing duplicated reads due to the PCR bias based on the information of unique molecular identifiers (UMIs), we estimated abundances of transcripts detected in each cell. Cells with unique gene counts over 8000 were abolished. The filtered gene-cell count matrices generated by the CellRanger were used for further analysis. The expression levels of genes in one cell were normalized by total read counts in the cell and multiplied by a scaling factor 10,000 with log2 transformation. The first 30 principal components achieved from the principal component analysis (PCA) were used to cluster the cells by shared nearest neighbor (SNN) modularity optimization-based clustering algorithm. Clusters were annotated to cell types using the SingleR package (62) and fine-tuned by well-known marker genes. Differential gene expression analysis was conducted using Wilcoxon Rank Sum test implemented in the Seurat package (62). All types of cells and selected genes were visualized by the Seurat as well. Gene sets from the MSigDB M2 collection were scored using Gene Set Variation Analysis (GSVA) R package with the default parameters and visualized using GraphPad Prism v9.3.
Statistical Analysis
In vitro and in vivo experiments were performed two to three times and conclusions were drawn only when the results were reproducible. One representative result among the replicates was shown in the figures. Statistical analyses were performed using GraphPad Prism v9.3 (RRID: SCR_002798). Unless otherwise mentioned, all data are presented as mean ± SEM (standard error of the mean). We followed this workflow for statistical testing: Shapiro-Wilk test was performed to assess for normality of data distribution: (i) in case of normality, when only two conditions were to test, we performed unpaired t-test; when more than two conditions were to compare, we performed a parametric one-way or two-way ANOVA followed by post hoc test with Tukey’s correction for multiple comparisons to assess the significance among pairs of conditions. (ii) in case of non-normality, when only two conditions were to test, we performed a Mann-Whitney U test; when more than two conditions were to compare, we performed a non-parametric one-way ANOVA followed by Dunn test to assess the significance among pairs of conditions. For survival data, log-rank test was used. Sample sizes, error bars, P values, and statistical methods are noted in the figures or figure legends. Statistical significance was defined as P < 0.05.
Supplementary Material
Acknowledgments:
We would like to thank the Lu lab members, Siyuan Zhang, Mary Ann McDowell, Jun Li, Crislyn D’Souza-Schorey, Zach Schafer, Sharon Stack, and Kasturi Haldar, for helpful comments and suggestions during this work. We are grateful for the support from various core facilities, including the Freimann Life Science Center (Teri Highbaugh), Genomics and Bioinformatics Core Facility (Michael Pfrender, Melissa Stephens, Jacqueline Lopez, Brent Harker), Integrated Imaging Facility (Sara Cole, Sarah Chapman), and Metabolomics Core Facility (Xiaoyang Su, Yujue Wang).
Funding:
National Institutes of Health grant R01CA248033 (X.L.), Department of Defense CDMRP PCRP grant W81XWH2010312 (X.L.), Department of Defense CDMRP PCRP grant W81XWH2010332 (X.L.), Elsa U. Pardee Foundation grant (X.L.), Indiana CTSI pilot grant (X.L.) through NIH NCATS CTSA grant UL1TR002529 (A. Shekhar, PI), National Institutes of Health grant P30CA082709 (J.W.), and Boler Family Foundation endowment at University of Notre Dame (X.L.).
Footnotes
Competing interests: Authors declare that they have no competing interests.
Data and materials availability:
Microarray data are available in the Gene Expression Omnibus (GEO) (RRID: SCR_005012) with accession number GSE195948. CUT&RUN-seq data are available at GEO with accession number GSE196486. scRNA-seq data are available at GEO with accession number GSE221755. Other data needed to support the conclusions of the paper are present in the paper or the Supplementary Materials.
REFERENCES
- 1.Hegde PS, Chen DS, Top 10 Challenges in Cancer Immunotherapy. Immunity 52, 17–35 (2020). [DOI] [PubMed] [Google Scholar]
- 2.Kwon ED et al. , Ipilimumab versus placebo after radiotherapy in patients with metastatic castration-resistant prostate cancer that had progressed after docetaxel chemotherapy (CA184–043): a multicentre, randomised, double-blind, phase 3 trial. The Lancet Oncology 15, 700–712 (2014). [DOI] [PMC free article] [PubMed] [Google Scholar]
- 3.Beer TM et al. , Randomized, Double-Blind, Phase III Trial of Ipilimumab Versus Placebo in Asymptomatic or Minimally Symptomatic Patients With Metastatic Chemotherapy-Naive Castration-Resistant Prostate Cancer. Journal of Clinical Oncology 35, 40–47 (2017). [DOI] [PubMed] [Google Scholar]
- 4.Topalian SL et al. , Safety, activity, and immune correlates of anti-PD-1 antibody in cancer. New England Journal of Medicine 366, 2443–2454 (2012). [DOI] [PMC free article] [PubMed] [Google Scholar]
- 5.Antonarakis ES et al. , Pembrolizumab for Treatment-Refractory Metastatic Castration-Resistant Prostate Cancer: Multicohort, Open-Label Phase II KEYNOTE-199 Study. J Clin Oncol 38, 395–405 (2020). [DOI] [PMC free article] [PubMed] [Google Scholar]
- 6.Yuan H et al. , Destructive impact of T-lymphocytes, NK and Mast cells on basal cell layers: implications for tumor invasion. BMC Cancer 13, 258 (2013). [DOI] [PMC free article] [PubMed] [Google Scholar]
- 7.Flammiger A et al. , Intratumoral T but not B lymphocytes are related to clinical outcome in prostate cancer. APMIS 120, 901–908 (2012). [DOI] [PubMed] [Google Scholar]
- 8.Spranger S, Gajewski TF, Impact of oncogenic pathways on evasion of antitumour immune responses. Nat Rev Cancer 18, 139–147 (2018). [DOI] [PMC free article] [PubMed] [Google Scholar]
- 9.Wellenstein MD, de Visser KE, Cancer-Cell-Intrinsic Mechanisms Shaping the Tumor Immune Landscape. Immunity 48, 399–416 (2018). [DOI] [PubMed] [Google Scholar]
- 10.Spratt DE, Zumsteg ZS, Feng FY, Tomlins SA, Translational and clinical implications of the genetic landscape of prostate cancer. Nat Rev Clin Oncol 13, 597–610 (2016). [DOI] [PMC free article] [PubMed] [Google Scholar]
- 11.Wang G et al. , Targeting YAP-Dependent MDSC Infiltration Impairs Tumor Progression. Cancer Discov 6, 80–95 (2016). [DOI] [PMC free article] [PubMed] [Google Scholar]
- 12.Bezzi M et al. , Diverse genetic-driven immune landscapes dictate tumor progression through distinct mechanisms. Nat Med 24, 165–175 (2018). [DOI] [PubMed] [Google Scholar]
- 13.Lu X et al. , An In Vivo Screen Identifies PYGO2 as a Driver for Metastatic Prostate Cancer. Cancer Res 78, 3823–3833 (2018). [DOI] [PMC free article] [PubMed] [Google Scholar]
- 14.Kao KR et al. , PYGOPUS2 expression in prostatic adenocarcinoma is a potential risk stratification marker for PSA progression following radical prostatectomy. J Clin Pathol, (2017). [DOI] [PubMed] [Google Scholar]
- 15.Popadiuk C et al. , Antisense suppression of pygopus2 results in growth arrest of epithelial ovarian cancer. Clin Cancer Res 12, 2216 – 2223 (2006). [DOI] [PubMed] [Google Scholar]
- 16.Andrews P, Lake B, Popadiuk C, Kao K, Requirement of Pygopus 2 in breast cancer. Int J Oncol 30, 357 – 363 (2007). [PubMed] [Google Scholar]
- 17.Tzenov YR et al. , Human papilloma virus (HPV) E7-mediated attenuation of retinoblastoma (Rb) induces hPygopus2 expression via Elf-1 in cervical cancer. Mol Cancer Res 11, 19–30 (2013). [DOI] [PubMed] [Google Scholar]
- 18.Zhang S et al. , Pygopus-2 promotes invasion and metastasis of hepatic carcinoma cell by decreasing E-cadherin expression. Oncotarget 6, 11074–11086 (2015). [DOI] [PMC free article] [PubMed] [Google Scholar]
- 19.Liu Y et al. , Abnormal expression of Pygopus 2 correlates with a malignant phenotype in human lung cancer. BMC Cancer 13, (2013). [DOI] [PMC free article] [PubMed] [Google Scholar]
- 20.Talla SB, Brembeck FH, The role of Pygo2 for Wnt/ß-catenin signaling activity during intestinal tumor initiation and progression. Oncotarget 7, 80612–80632 (2016). [DOI] [PMC free article] [PubMed] [Google Scholar]
- 21.Zhou C et al. , Pygo2 functions as a prognostic factor for glioma due to its up-regulation of H3K4me3 and promotion of MLL1/MLL2 complex recruitment. Sci Rep 6, 22066 (2016). [DOI] [PMC free article] [PubMed] [Google Scholar]
- 22.Fiedler M et al. , Decoding of methylated histone H3 tail by the Pygo-BCL9 Wnt signaling complex. Mol Cell 30, 507–518 (2008). [DOI] [PMC free article] [PubMed] [Google Scholar]
- 23.Chen J et al. , Pygo2 associates with MLL2 histone methyltransferase and GCN5 histone acetyltransferase complexes to augment Wnt target gene expression and breast cancer stem-like cell expansion. Molecular and cellular biology 30, 5621–5635 (2010). [DOI] [PMC free article] [PubMed] [Google Scholar]
- 24.Gu B, Watanabe K, Sun P, Fallahi M, Dai X, Chromatin Effector Pygo2 Mediates Wnt-Notch Crosstalk to Suppress Luminal/Alveolar Potential of Mammary Stem and Basal Cells. Cell Stem Cell 13, 48–61 (2013). [DOI] [PMC free article] [PubMed] [Google Scholar]
- 25.Sun P et al. , Pygo2 regulates beta-catenin-induced activation of hair follicle stem/progenitor cells and skin hyperplasia. Proc Natl Acad Sci U S A 111, 10215–10220 (2014). [DOI] [PMC free article] [PubMed] [Google Scholar]
- 26.Andrews PGP, Popadiuk C, Belbin TJ, Kao KR, Augmentation of Myc-Dependent Mitotic Gene Expression by the Pygopus2 Chromatin Effector. Cell Rep 23, 1516–1529 (2018). [DOI] [PubMed] [Google Scholar]
- 27.Yang L et al. , lncRNA-dependent mechanisms of androgen-receptor-regulated gene activation programs. Nature 500, 598–602 (2013). [DOI] [PMC free article] [PubMed] [Google Scholar]
- 28.Li B et al. , Developmental phenotypes and reduced Wnt signaling in mice deficient for pygopus 2. Genesis 45, 318–325 (2007). [DOI] [PubMed] [Google Scholar]
- 29.Ding Z et al. , SMAD4-dependent barrier constrains prostate cancer growth and metastatic progression. Nature 470, 269–273 (2011). [DOI] [PMC free article] [PubMed] [Google Scholar]
- 30.Zou M et al. , Transdifferentiation as a Mechanism of Treatment Resistance in a Mouse Model of Castration-Resistant Prostate Cancer. Cancer Discov 7, 736–749 (2017). [DOI] [PMC free article] [PubMed] [Google Scholar]
- 31.Lu X et al. , VCAM-1 Promotes Osteolytic Expansion of Indolent Bone Micrometastasis of Breast Cancer by Engaging α4β1-Positive Osteoclast Progenitors. Cancer Cell 20, 701–714 (2011). [DOI] [PMC free article] [PubMed] [Google Scholar]
- 32.Thompson TC, Southgate J, Kitchener G, Land H, Multistage carcinogenesis induced by ras and myc oncogenes in a reconstituted organ. Cell 56, 917–930 (1989). [DOI] [PubMed] [Google Scholar]
- 33.Adam M, Potter AS, Potter SS, Psychrophilic proteases dramatically reduce single-cell RNA-seq artifacts: a molecular atlas of kidney development. Development 144, 3625–3632 (2017). [DOI] [PMC free article] [PubMed] [Google Scholar]
- 34.Balachandran VP et al. , Imatinib potentiates antitumor T cell responses in gastrointestinal stromal tumor through the inhibition of Ido. Nat Med 17, 1094–1100 (2011). [DOI] [PMC free article] [PubMed] [Google Scholar]
- 35.Huang T et al. , Effective combinatorial immunotherapy for penile squamous cell carcinoma. Nat Commun 11, 2124 (2020). [DOI] [PMC free article] [PubMed] [Google Scholar]
- 36.Andrews PG, Kao KR, Wnt/β-catenin-dependent acetylation of Pygo2 by CBP/p300 histone acetyltransferase family members. Biochem J 473, 4193–4203 (2016). [DOI] [PubMed] [Google Scholar]
- 37.Reed SM, Quelle DE, p53 Acetylation: Regulation and Consequences. Cancers (Basel) 7, 30–69 (2014). [DOI] [PMC free article] [PubMed] [Google Scholar]
- 38.Chen J, The Cell-Cycle Arrest and Apoptotic Functions of p53 in Tumor Initiation and Progression. Cold Spring Harb Perspect Med 6, a026104 (2016). [DOI] [PMC free article] [PubMed] [Google Scholar]
- 39.Abida W et al. , Genomic correlates of clinical outcome in advanced prostate cancer. Proc Natl Acad Sci U S A 116, 11428–11436 (2019). [DOI] [PMC free article] [PubMed] [Google Scholar]
- 40.Abeshouse A et al. , The Molecular Taxonomy of Primary Prostate Cancer. Cell 163, 1011–1025 (2015). [DOI] [PMC free article] [PubMed] [Google Scholar]
- 41.Gu B et al. , Pygo2 expands mammary progenitor cells by facilitating histone H3 K4 methylation. J Cell Biol 185, 811–826 (2009). [DOI] [PMC free article] [PubMed] [Google Scholar]
- 42.Beishline K, Azizkhan-Clifford J, Sp1 and the ‘hallmarks of cancer’. The FEBS journal 282, 224–258 (2015). [DOI] [PubMed] [Google Scholar]
- 43.Maeda K, Nishiyama C, Ogawa H, Okumura K, GATA2 and Sp1 positively regulate the c-kit promoter in mast cells. J Immunol 185, 4252–4260 (2010). [DOI] [PubMed] [Google Scholar]
- 44.Lécuyer E et al. , The SCL complex regulates c-kit expression in hematopoietic cells through functional interaction with Sp1. Blood 100, 2430–2440 (2002). [DOI] [PubMed] [Google Scholar]
- 45.Zheng L et al. , Pan-cancer single-cell landscape of tumor-infiltrating T cells. Science 374, abe6474 (2021). [DOI] [PubMed] [Google Scholar]
- 46.Prendergast GC, Mondal A, Dey S, Laury-Kleintop LD, Muller AJ, Inflammatory Reprogramming with IDO1 Inhibitors: Turning Immunologically Unresponsive ‘Cold’ Tumors ‘Hot’. Trends Cancer 4, 38–58 (2018). [DOI] [PMC free article] [PubMed] [Google Scholar]
- 47.Lu X et al. , Effective combinatorial immunotherapy for castration-resistant prostate cancer. Nature 543, 728–732 (2017). [DOI] [PMC free article] [PubMed] [Google Scholar]
- 48.Ali F, Yamaguchi K, Fukuoka M, Elhelaly AE, Kuwata K, Logical design of an anti-cancer agent targeting the plant homeodomain in Pygopus2. Cancer Sci 107, 1321–1328 (2016). [DOI] [PMC free article] [PubMed] [Google Scholar]
- 49.Watson PA et al. , Context-dependent hormone-refractory progression revealed through characterization of a novel murine prostate cancer cell line. Cancer Res 65, 11565–11571 (2005). [DOI] [PubMed] [Google Scholar]
- 50.Taylor BS et al. , Integrative Genomic Profiling of Human Prostate Cancer. Cancer Cell 18, 11–22 (2010). [DOI] [PMC free article] [PubMed] [Google Scholar]
- 51.Subudhi SK et al. , Neoantigen responses, immune correlates, and favorable outcomes after ipilimumab treatment of patients with prostate cancer. Sci Transl Med 12, (2020). [DOI] [PubMed] [Google Scholar]
- 52.Lánczky A, Győrffy B, Web-Based Survival Analysis Tool Tailored for Medical Research (KMplot): Development and Implementation. Journal of medical Internet research 23, e27633 (2021). [DOI] [PMC free article] [PubMed] [Google Scholar]
- 53.Lu X, Lu X, Enhancing immune checkpoint blockade therapy of genitourinary malignancies by co-targeting PMN-MDSCs. Biochim Biophys Acta Rev Cancer 1877, 188702 (2022). [DOI] [PMC free article] [PubMed] [Google Scholar]
- 54.Ghosh M et al. , Mutant p53 suppresses innate immune signaling to promote tumorigenesis. Cancer Cell 39, 494–508 e495 (2021). [DOI] [PMC free article] [PubMed] [Google Scholar]
- 55.Blagih J et al. , Cancer-Specific Loss of p53 Leads to a Modulation of Myeloid and T Cell Responses. Cell Rep 30, 481–496 e486 (2020). [DOI] [PMC free article] [PubMed] [Google Scholar]
- 56.Chen Z et al. , Crucial role of p53-dependent cellular senescence in suppression of Pten-deficient tumorigenesis. Nature 436, 725–730 (2005). [DOI] [PMC free article] [PubMed] [Google Scholar]
- 57.Dupont S et al. , Convergence of p53 and TGF-beta signaling networks. Cancer Lett 213, 129–138 (2004). [DOI] [PubMed] [Google Scholar]
- 58.Li H et al. , Integrated high-throughput analysis identifies Sp1 as a crucial determinant of p53-mediated apoptosis. Cell Death Differ 21, 1493–1502 (2014). [DOI] [PMC free article] [PubMed] [Google Scholar]
- 59.Nikulenkov F et al. , Insights into p53 transcriptional function via genome-wide chromatin occupancy and gene expression analysis. Cell Death Differ 19, 1992–2002 (2012). [DOI] [PMC free article] [PubMed] [Google Scholar]
- 60.Da Ros S et al. , G-Quadruplex Modulation of SP1 Functional Binding Sites at the KIT Proximal Promoter. Int J Mol Sci 22, (2020). [DOI] [PMC free article] [PubMed] [Google Scholar]
- 61.Dobin A et al. , STAR: ultrafast universal RNA-seq aligner. Bioinformatics (Oxford, England) 29, 15–21 (2013). [DOI] [PMC free article] [PubMed] [Google Scholar]
- 62.Aran D et al. , Reference-based analysis of lung single-cell sequencing reveals a transitional profibrotic macrophage. Nature immunology 20, 163–172 (2019). [DOI] [PMC free article] [PubMed] [Google Scholar]
- 63.Ritchie ME et al. , limma powers differential expression analyses for RNA-sequencing and microarray studies. Nucleic acids research 43, e47 (2015). [DOI] [PMC free article] [PubMed] [Google Scholar]
- 64.Szabo PA et al. , Single-cell transcriptomics of human T cells reveals tissue and activation signatures in health and disease. Nat Commun 10, 4706 (2019). [DOI] [PMC free article] [PubMed] [Google Scholar]
Associated Data
This section collects any data citations, data availability statements, or supplementary materials included in this article.
Supplementary Materials
Data Availability Statement
Microarray data are available in the Gene Expression Omnibus (GEO) (RRID: SCR_005012) with accession number GSE195948. CUT&RUN-seq data are available at GEO with accession number GSE196486. scRNA-seq data are available at GEO with accession number GSE221755. Other data needed to support the conclusions of the paper are present in the paper or the Supplementary Materials.