

Abstract
Protein tyrosine phosphatase 1B (PTP1B) is a negative regulator of the insulin and leptin signaling pathways, making it a highly attractive target for the treatment of type II diabetes. For PTP1B to perform its enzymatic function, a loop referred to as the “WPD loop” must transition between open (catalytically incompetent) and closed (catalytically competent) conformations, which have both been resolved by X-ray crystallography. Although prior studies have established this transition as the rate-limiting step for catalysis, the transition mechanism for PTP1B and other PTPs has been unclear. Here we present an atomically detailed model of WPD loop transitions in PTP1B based on unbiased, long-timescale molecular dynamics simulations and weighted ensemble simulations. We found that a specific WPD loop region—the PDFG motif—acted as the key conformational switch, with structural changes to the motif being necessary and sufficient for transitions between long-lived open and closed states of the loop. Simulations starting from the closed state repeatedly visited open states of the loop that quickly closed again unless the infrequent conformational switching of the motif stabilized the open state. The functional importance of the PDFG motif is supported by the fact that it is well conserved across PTPs. Bioinformatic analysis shows that the PDFG motif is also conserved, and adopts two distinct conformations, in deiminases, and the related DFG motif is known to function as a conformational switch in many kinases, suggesting that PDFG-like motifs may control transitions between structurally distinct, long-lived conformational states in multiple protein families.
Introduction
Protein tyrosine phosphatase 1B (PTP1B) plays an essential regulatory role in multiple cellular processes, particularly in leptin, insulin, and epidermal growth factor (EGF) signaling pathways—rendering it a highly attractive therapeutic target for diabetes and various forms of cancer.1 The catalytic region of PTP1B is highly conserved among all members of the human PTP family2 and comprises the PTP loop (containing the nucleophilic C215), the WPD loop (containing the D181 general acid), and the substrate-binding loop (SBL). As with all PTPs, PTP1B catalyzes the hydrolysis of a phosphotyrosine substrate through a phospho-cysteinyl intermediate.3 Substrate binding initiates WPD loop “closure,” leaving D181 poised to activate a water molecule that cleaves the phospho-cysteinyl intermediate4 to complete the catalytic cycle.
PTP1B catalysis, like that of other enzymes, requires both fast and slow motions to perform its catalytic function.5 The slow transition between the “open” (catalytically incompetent) and “closed” (catalytically competent) conformations of the WPD loop is the rate-limiting step in the catalytic function of both PTP1B and a homologous bacterial protein, YopH (kcat = 15–60 s–1 and kcat = 700–1000 s–1, respectively).6,7 Since this discovery, many groups have reported residues, interactions, and secondary structure motifs that are associated with the regulation of PTP1B catalytic activity.8−14 Despite such extensive examination of PTP1B, there exists no mechanistic model that describes the structural changes that control the timescale of opening and closing of the WPD loop, which modulates PTP1B’s catalytic activity.
Here we present a computational model of the transition of the WPD loop at an atomic level of resolution; the model reproduces the kinetics of PTP1B and indicates that a short PDFG motif on the WPD loop is responsible for the slow transition. To develop this model, we first used long-timescale molecular dynamics (MD) simulations to sample the slow motion of the PTP1B WPD loop, observing several transitions from the closed to the open state. We did not, however, observe transitions from the open to the closed state, and did not observe sufficient loop-opening events to estimate a rate. To enhance the sampling of rare transitions, both to and from the open state, we used accelerated weighted ensemble15 (AWE) simulations. This path-sampling approach employs many short MD simulations conducted in parallel, initiated from different regions of a partitioned reaction coordinate, to improve the sampling of rare events and obtain unbiased estimates of kinetic rates and thermodynamic quantities.16,17 Our AWE simulations recapitulated the open and closed WPD states and the millisecond-timescale kinetics of the transitions between them. These simulations also produced a set of putative transition-state structures, which we further validated and characterized using committor analysis.18,19 Finally, using machine learning and feature analysis,20 we developed an atomically detailed model of the mechanism of WPD transitions. We found that the PDFG motif acted as a conformational switch, with structural changes in the motif being both necessary and sufficient21,22 to distinguish between long-lived open and closed states of the WPD loop, and thus between the states of the PTP1B catalytic cycle.
We then performed a bioinformatic analyses to assess how widely this role of the PDFG motif might be shared. The PDFG motif (or the similar PDHG motif) is known to be conserved in most PTPs2,23 (the histidine residue is similarly bulky and aromatic to the Phe182 in PTP1B): This strongly suggests that the function of the PDFG motif is conserved in tyrosine phosphatases. Furthermore, we found that the PDFG sequence is also conserved in peptidyl arginine deiminases (PADIs), and can assume two distinct conformations.24 Moreover, in certain kinase families, the DFG motif is known to be part of a loop whose conformational states in many cases determine kinase activation. Taken together, these observations lead us to speculate that PDFG-like motifs may act as structural switches for multiple protein families.
Results
Long-Timescale MD Showed Transient WPD Loop States and Candidate Reaction Coordinates for the WPD Loop Transition
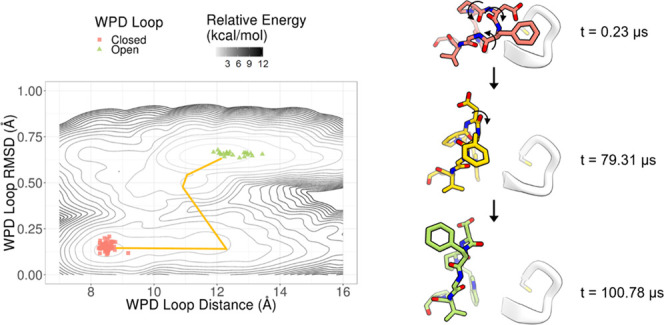
We performed multiple MD simulations starting from both the WPD-closed crystal structure 1SUG and the WPD-open crystal structure 2CM2. We observed the WPD loop stably transition from the closed state to the open state four times in a total of 2.6 ms of simulation time; we did not observe any transitions from the open state to the closed state. The fact that we observed the WPD loop transition in only one direction is consistent with the timescales derived from Whittier et al.’s NMR kinetic experiments, which suggested a timescale of ∼45 ms for the transition from the open to the closed state.6 An example trajectory of the WPD loop transition is shown in Figure 1 and Movie S1; the WPD loop transitions from the closed state to the open state at 78.31 μs. We note that our simulations oftentimes sampled a “transient open” state, wherein the canonical distance metric between the C215 and D181-Cα atoms3 increased for hundreds of nanoseconds but then reverted back to the closed state (yellow, Figure 1a). Similarly, even shorter-lived “transient closed” states were sampled (blue, Figure 1a), wherein the canonical distance metric between the C215 and D181-Cα atoms decreased below the 9.87 Å cutoff, indicating a closed state, but quickly reverted to the open state (Figure 1a). This suggested that the distance metric alone was not a sufficient reaction coordinate to capture the full transition of the WPD loop from one true, long-lived state to another.
Figure 1.

Long-timescale MD simulation uncovered transient WPD loop states and candidate reaction coordinates. (a) The canonical D181-Cα to C215-Cα distance was observed as a reaction coordinate of the WPD loop transition from closed (red) to open (green). Sub-microsecond transient open states (yellow), and even shorter-lived transient closed states (blue), were revealed. (b) The D181-Ψ dihedral angle of the catalytic acid in the WPD loop was observed as a reaction coordinate of the WPD loop transition from closed (red) to open (green). (c) The F182-Φ dihedral angle of the phenylalanine in the WPD loop was captured as a reaction coordinate of the WPD loop transition from closed (red) to open (green).
Upon further interrogation of our trajectories, we identified additional structural features correlated with the WPD loop transitioning from closed to open conformations (Figure S1). These included the Ψ dihedral in the backbone of the catalytic aspartate, D181, and the Φ dihedral in the backbone of the adjacent phenylalanine F182.25 We observed, as exemplified in Figure 1b,c, that these two quantitative measurements clearly demarcate the two long-lived WPD loop states.
AWE Simulations Sampled the Millisecond-Timescale WPD Loop Transition
The above observations gave us the candidate degrees of freedom with which we could further investigate the atomic-level mechanism of the WPD loop catalytic transition. We collapsed our observations from unbiased, long-timescale MD simulations into two reaction coordinates, one of which measures the distance between the top of the loop and the active site, whereas the other measures a deformation within the loop. We refer to the former as “WPD Loop Distance (Å)” (distance between D181-Cα and C215-Cα atoms) and the latter as “WPD Loop RMSD (Å)” (RMSD of the backbone atoms of D181 and F182 to the reference 1SUG crystal structure). We verified that all wild-type PTP1B structures available in the Protein Data Bank (PDB) labeled either closed or open were well separated as two “states” in this two-dimensional space (Figure 2a). We also observed that the energy landscape, estimated from an aggregate 2.6 ms of MD simulations, also showed two energy wells that corresponded with clusters of PDB crystal structures along these two reaction coordinates. This separation of the WPD loop states suggested that this could be a useful energy landscape to partition into discrete bins for AWE simulations (Figure S2; see the Methods section for details).
Figure 2.

Kinetics and thermodynamics of the WPD loop transitions were accurately recapitulated in AWE simulations using two reaction coordinates obtained from the inspection of long-timescale MD simulations and available crystal structures in the PDB. (a) The D181-Ψ and F181-Φ angles were condensed into the reaction coordinate WPD Loop RMSD (Å). The two reaction coordinates, WPD Loop Distance (Å) and WPD Loop RMSD (Å), separate the two states of the WPD Loop found in crystal structures of PTP1B in the PDB. Coarse energy estimates, using a total of 2.6 ms of simulation data, show two energy minima that correspond with the closed and open crystal structures from the PDB (each contour = 1 kcal mol–1). (b) Accelerated weighted ensemble (AWE) simulations yielded robust sampling of the millisecond WPD loop transition, with MFPTclosed-to-open = 2.3 ± 0.3 ms, and MFPTopen-to-closed = 170 ± 22 ms. Analysis of the AWE data using transition path theory52,53 results in the main flux line connecting five of the bins used during the AWE sampling (yellow line). Despite the coarseness of the flux line based on the Markov state model, this line suggests a two-step mechanism of the WPD loop-opening transition, similar to what we observed in unbiased MD simulation: D181-Cα–C215-Cα distance increases first, then the WPD loop dihedrals switch. The free energy difference between the open and closed states is −2.6 ± 0.1 kcal mol–1.
By sampling along these two reaction coordinates, WPD Loop Distance (Å) and WPD Loop RMSD (Å), our AWE simulation replicates converged and reproducibly recapitulated the millisecond-timescale WPD loop transitions from both closed to open and open to closed WPD loop states (Figure 2b). As shown in Figure 2a,b, the locations and shapes of the basins in the unbiased MD and AWE simulations are consistent. The converged sampling in the AWE simulations gave us a wealth of kinetic and thermodynamic information. We computed the kinetics of the transitions: the mean first passage times (MFPT)closed-to-open = 2.3 ± 0.3 ms and MFPTopen-to-closed = 170 ± 22 ms, which correspond to rates of kopen = 430 s–1 and kclosed = 5.9 s–1. These rates are consistent with the experimentally determined kinetics of the WPD loop transition from CPMG dispersion of kopen = 890 ± 190 s–1 and kclosed = 22 ± 5 s–1.6 The free energy estimate from these AWE simulations was ΔGclosed-to-open = −2.6 ± 0.1 kcal mol–1 (Figure 2b), consistent with the value of −2.1 kcal mol–1 derived from NMR relaxation experiments.6 The dominant flux of the WPD loop opening in the AWE simulations coarsely follows a mechanism by which the WPD loop distance increases first, before motion largely in the WPD loop RMSD coordinate leads over an energy barrier to the closed state (Figure 2b).
Parsimonious Random Forest Model Built on Six Backbone Dihedrals of Residues P180, D181, F182, and G183 Captured the Transition-State Ensemble of the WPD Loop Transition
In addition to recapitulating the kinetics and thermodynamics of the WPD loop transition, the replicate AWE simulations yielded 1980 putative transition-state structures (Figure 3a). We tested these putative transition-state structures by computing their committor probabilities (Pclosed; see Methods). We observed that the structures with estimated Pclosed = 0.5 ± 0.1 did not occupy a distinct region in our estimated free energy landscape (Figure 3a), suggesting that the reaction coordinates used are not entirely satisfactory for describing the WPD loop transition and defining the transition states along it. This result implies that the committor probabilities from thermalized replicates are better estimators of Pclosed than the transition matrix derived from the AWE simulations. We thus investigated whether we could obtain improved reaction coordinates using machine learning methods.
Figure 3.

Feature pruning in random forest model selection yielded a parsimonious predictor of PClosed built on only six backbone dihedrals of residues P180, D181, F182, and G183 (PDFG model). (a) Putative transition-state structures obtained from AWE simulations were tested on Anton for quantitative committor probability (PClosed). (b) Curated features reported in the literature (highlighted in orange, and heavy atoms explicitly shown in licorice) were used to build an initial random forest model to predict committor probability on putative TS structures. (c) Feature pruning shows that a model built on the top 6 features composed of P180, D181, F182, and G183 backbone dihedrals yields the lowest OOB RMSE (indicated by a red star). (d) The scatterplot of predicted committor probability (P̂Closed) vs. calculated committor probability (PClosed) shows the high predictive power of the PDFG model; the cross-validated model prediction error of the model was 0.0717 (3 s.f.). The maximal uncertainty for the calculated committor PClosed is 0.1 for a value of PClosed = 0.5.
We used feature pruning and model selection with a supervised machine learning method—random forest—to interrogate the contribution of a set of structural features to the dynamic mechanism of the WPD loop transition in PTP1B catalysis. The features included all backbone and sidechain dihedrals (highlighted in Figure 3b), and we characterized the importance of each feature using 10-fold cross-validation (Figure S3). By evaluating the performance of stepwise pruned models built on limited features, we determined that a model built on six dihedrals—P180-ψ, D181-ϕ, D181-ψ, F182-ϕ, F182-ψ, and G183-ψ (starred, Figure 3c)—had the lowest out-of-bag (OOB; see the Methods section) RMSE when predicting Pclosed. We observed that in the space spanned by four of these dihedrals (P180-ψ, D181-ψ, F182-ϕ, and G183-ψ), structures with committor Pclosed = 0.5 ± 0.1 tended to cluster separately from other putative transition-state structures (Figure S4), suggesting that these backbone dihedrals provide a better reaction coordinate for describing the transition than the WPD loop distance and RMSD used for the AWE simulations. The prediction accuracy of the final model, which we named the PDFG model, had an OOB RMSE = 0.0717 (Figure 3d). (The OOB error is a bootstrap error estimate using the error of each training data point from the trees in the random forest that did not see that point during training.) These results suggest that the feature space captured by these six PDFG backbone dihedrals is sufficient not only to correctly predict long-lived states of WPD loop structures (Pclosed = 0, open and Pclosed = 1, closed) but also to accurately predict transition-state structures (Pclosed = 0.5 ± 0.1) in out-of-sample test sets. Interestingly, visualization of a subset of the transition-state structures (Pclosed = 0.5 ± 0.05) indicates that the backbone of the WPD loop adopts three distinct clusters of conformations (Figure S5). This structural heterogeneity suggests that several transition paths may be possible.
We further validated the PDFG model by showing that it can correctly predict the WPD loop states of sample structures drawn from the trajectory in Figure 1 (which was not included in the training of the model). The model predicted that all 30 frames drawn from the first 10 μs were closed (P̂Closed = 1.00), and all 30 frames drawn from 95 to 105 μs were open (P̂Closed = 0.00). We also generated predictions for 1,416,667 frames between 78.48 and 79.33 μs, where we believe the true transition from the closed to open states occurred in simulation (Figure 4). We note that the PDFG ensemble predictions did not shift to a mean above 0.5 as the WPD loop distance started to increase, but only after the switch in WPD loop RMSD (Figure S6). The model predicted that the four structures between 79,310,646 and 79,310,649 ps (emphasized in Figures 4b, S6, and S7) had committor probability P̂Closed = 0.5 ± 0.07. Of these four frames, all yielded committor probabilities (Pclosed) between 0.6 and 0.9 in a follow-up committor analysis. The sequence of structural changes in the WPD loop is shown in Figure 4c using representative frames from the MD simulation.
Figure 4.

PDFG model predictions on an unbiased, long-timescale MD trajectory show that the backbone dihedrals of the PDFG motif are sufficient to describe the WPD loop transition. (a) Representative structures of predicted closed (P̂Closed = 1.00, t = 0.23 μs, red), transition state (P̂Closed = 0.52, t = 79.31 μs, yellow), and open (P̂Closed = 0.00, t = 100.78 μs, green) frames from the simulation. (b) The PDFG model correctly identifies the structures near the transition observed in the simulation as having intermediate committor probability (each dot in the plot represents a structure of the WPD loop obtained—at 6 ps intervals—from the simulation, and the four structures obtained during the transition are shown as four larger dots). The black line qualitatively indicates the direction of the conformational transition observed in the MD simulation. (c) The representative closed (red), transition state (yellow), and open (green) structures are shown using stick representations for the WPD loop (residues 179–185). The loop containing C215 (residues 215–221) is shown in a white cartoon representation. Changes in PDFG backbone dihedrals that occur between states are shown with curved arrows.
PDFG and Related Sequences Are Conserved in Different Families of Enzymes
In order to evaluate how widely applicable in the human genome these findings about the function of the PDFG motif might be, we performed an intrafamily multiple sequence alignment (MSA) of all members of the PTP family, followed by an inspection of the available corresponding crystal structures in the PDB. Consistent with previous work, we found that the PD[F/H]G sequence is conserved in most PTPs (Figure 5a).2 Structural alignment of available PTP crystal structures26 showed that there exist open and closed crystal structures of many of these phosphatases (Figure 5a), supporting the notion that the PD[F/H]G motif may also be an important structural switch for catalysis in other PTPs. It is worth noting that several nonreceptor PTPs, such as STEP, LYP, and PEST, adopt an “atypical” WPD loop conformation (characterized as being more open than the common open state)27 and that these three PTPs have different residues at the C-terminus of the motif. A BLAST search on the PD[F/H]G motif also recovered matches to certain families of kinases, with the related “DFG” motif being fully conserved in these families.28 It is well known that the DFG motif adopts two conformational states in many kinase families—as, for example, in the ABL kinases (Figure 5c)—separating functionally active and inactive states, analogously to the role played by the PDFG motif in our model. Our PD[F/G]H BLAST search also revealed that the PDFG sequence is conserved in all but one protein arginine deiminase (PADI). Subsequent alignment and analysis of publicly available crystal structures of protein arginine deiminases also show two distinct conformational states of the loop at a Ca2+ binding site (Figure 5b). We note that although the PD[F/H]G BLAST search did return matches in other protein families, there was insufficient structural information corresponding to those matches to draw further conclusions on the conformational significance of PD[F/H]G motifs in those families.
Figure 5.

Multiple sequence alignment (MSA) and structural bioinformatic analysis suggests that PDFG-like motifs may be widely used as structural switches. (a) Sequence logo for PD[F/H]G motif in the PTP family of proteins and representative structures of crystallized PTP states: open (green, PDB: 2CM2) and closed (red, PDB: 1SUG). PDFG residues are shown explicitly in licorice. (b) Sequence logo for the PDFG motif in PADIs and representative structures of crystallized PADI states: open (green, PDB: 4N20) and closed (red, PDB: 4N25). PDFG residues are shown explicitly in licorice. (c) Sequence logo for the well-known DFG motif in the Src family of kinases and representative structures of crystallized ABL kinase states: DFG-in (green, PDB: 2F4J) and DFG-out (red, PDB: 1OPJ) DFG residues are shown explicitly in licorice.
Discussion
Although the atomic-level mechanism of the rate-limiting step of the transition has been unclear, numerous studies have made progress in identifying protein features associated with the conformational change of the WPD loop of PTP1B. Past studies have used approaches such as NMR, X-ray crystallography, MD simulations, and biochemistry, and made important observations of specific residues, interactions, and secondary structures associated with PTP1B’s catalytic function29 on distinct timescales.10 Others have used multi-temperature crystallography and chemical fragment probes11 to elucidate additional structural features that contribute to the functional regulation of PTP1B. Studies using protein NMR and crystallography have highlighted the similarities and differences in activity, structure, and dynamics between the respective WPD loops of PTP1B and its bacterial analogue, YopH, yielding additional features that could be involved in the mechanism of PTP1B’s catalytic control.6,12
In our study, we used simulations to discover and validate robust reaction coordinates of PTP1B’s catalytic cycle in several steps. First, unbiased, long-timescale simulations sampled several WPD loop transition events. Our sampling of these rare events allowed us to perform structural bioinformatic analyses to propose potential structural features as reaction coordinates, including D181Ψ and F182Φ. Subsequent AWE simulations then gave us statistically robust sampling of the WPD loop transition in both directions, and the analysis of this data helped yield a putative transition-state ensemble that we later refined. We found that the PDFG backbone dihedrals are key to describing the rare but rapid transition between the long-lived states of the loop, and we conclude that this motif thus acts as the structural arbiter of the WPD loop transition in PTP1B’s catalytic cycle.
Although many structural features of PTP1B have been shown to influence the WPD loop motions,8−14 we identified local backbone dihedrals in the WPD loop as providing the most robust classification of the transition-state ensemble. This is likely because features that are strongly correlated with the WPD loop motions do not provide additional information about the loop state, and as such do not improve the identification of transition-state structures. Interestingly, we found that the sidechain rotamer of Q266 in the Q-loop (a region that is important for hydrolysis of the phospho-cysteinyl intermediate27) has a high-scaled importance among the considered features (Figure S3), which may be explained by its hydrogen bond with the backbone carbonyl of G183 in the closed state. Interactions with sidechains, solvent, and more distant regions of PTP1B likely shape the free energy landscape of the PDFG backbone residues (Figure S4), and these backbone dihedrals were found to provide an effective coordinate system for distinguishing transition-state structures. The transition-state structures populate multiple regions of this free energy landscape (Figure S4), and through visual inspection of these structures, we found that there are three distinct conformations (Figure S5). Although this suggests that there are multiple transition paths available for the WPD loop, simulations using a more refined reaction coordinate will be necessary to quantify the flux through the different pathways because the WPD loop RMSD and distance coordinates used in the AWE simulations do not distinguish the three structurally distinct transition states (Figure 3a). Additionally, substrate binding has been demonstrated to impact the kopen rate of the WPD loop,6 and follow-up studies could be conducted to determine whether this effect is well captured by reaction coordinates that describe the backbone dihedrals of the PDFG residues.
Using our structural bioinformatic analysis, we found that the PDFG-like sequence is conserved for PTPs, multiple kinase families, and PADIs, and confers a loop-like structure that exists in two distinct conformational states, analogously to the distinct open and closed states in PTP1B. Interestingly, each of these pairs of states involves structurally distinct backbone conformations, despite their similar sequence motifs, so presumably different transition pathways are involved. This idea is consistent with our observation that several distinct transition paths are observed for this sequence motif even in PTP1B itself (Figure S5). Likewise, the small sequence diversity observed in PTPs for the C-terminal residues of this motif may account for distinct conformational features (such as “atypical” WPD loop states) and modulate the rate of transition between states.6,13 Overall, in these three protein families (and potentially others for which structural information is not yet available), the PDFG-like sequences likely act as structural switches for controlling catalysis by establishing a kinetic barrier between loop conformations.
Knowledge of the function of this structural switch could have implications in the rational design of small-molecule drugs and in the design of enzymes: If the PDFG-like sequence indeed acts as a structural switch that controls enzymatic activity, one might in principle design small molecules that slow the activity of these enzymes by acting on the switch, in contrast to the typical approach of blocking the orthosteric binding site. Past drug discovery programs have had success in modulating the enzyme when engaging the PDFG motif directly (in PADI230−32) or indirectly (in PTP1B8), suggesting the potential promise of this approach. It has been shown that just ∼600 small tertiary structural motifs, similar in size to the PDFG motif, are sufficient to describe 50% of protein structures in the PDB at sub-Ångstrom resolution.21,35 Databases of such structural motifs have proved valuable in enzyme design,36 and we speculate that the functional role of the conserved PDFG-like motifs in separating long-lived protein states could potentially be exploited for the rational design of enzymes.
Methods
Long-Timescale Molecular Dynamics
All PTP1B long-timescale simulations were performed on Anton,37 a special-purpose supercomputer for molecular dynamics simulations. These simulations were based on crystal structures 1SUG38 (closed state) and 2CM239 (open state) from the PDB. Both constructs were truncated to include only residues 2–284. Histidines in the system were epsilon protonated. We solvated these structures in water with neutralizing NaCl counter ions at 150 mM in an 80 × 80 × 80 Å3 simulation box at 310 K. We used the Amber99SB*-ILDN40 protein force field (which builds on other modifications41,42 to Amber9943) with backbone dihedral and hydrogen bond restraints to stabilize the SBL, as described previously.9 For ions, the parameters of Aqvist44 (which are the default choice for Amber99SB*-ILDN) were used. The waters were parameterized with the TIP3P45 model. From the open state, we simulated 3 independently thermalized replicates for 200 μs each. From the closed state, we simulated 6 independently thermalized replicates for 200 μs each, and an additional 40 independently thermalized replicates for 20 μs each. The aggregate total simulation time was 2.6 ms.
Accelerated Weighted Ensemble Simulations
We performed all AWE simulations on Anton, using an in-house implementation of the AWE algorithm. Iterations of AWE consisted of two steps: First, unbiased MD was run for all currently active simulations (also called “walkers”) for a short time. In this work, all walkers were run for 100.8 ps, and their velocities were randomly initialized at every iteration. A stochastic thermostat was used, based on a Langevin dynamics integrator. The second step involved a two-color resampling: Walkers that started from an open state had an open color property, and walkers that started from a closed state had a closed color property. When walkers of a given color reached the opposite state, they switched colors. Resampling was performed separately on each walker-color population using an algorithm similar to those described in Costaouec et al.15 and Abdul-Wahid et al.46 Walkers were split when they carried too much probability weight compared to a target weight, and they were merged when they carried too little weight.
Initially, an AWE simulation was started from the open state. We picked two reaction coordinates that were discretized as follows: the WPD Loop Distance (Å) (distance between D181-Cα and C215-Cα atoms) used four bins, and the WPD Loop RMSD (Å) (RMSD of the Cα, C, and N atoms of D181 and F182) used 14 bins (Figure S2). Each occupied bin was assigned 20 walkers, and each walker ran for 100 ps. The first simulation ran for 78 iterations—40 μs aggregate simulation time—until transitions in both directions were collected: 751 open to closed, and 3394 closed to open. The fluxes in both directions achieved steady state (roughly equal). A Markov state model (MSM) was formed based on the observed transition probabilities during the first simulation, and it yielded equilibrium populations of 0.97 for the open state and 0.02 for the closed state, corresponding to a free energy difference of −kBT*log(Popen/Pclosed), or −2.3 kcal mol–1. To obtain more detailed kinetics and snapshots of the mechanism, further simulations were run from this endpoint, starting with the MSM-reweighted bins. The rates were computed as
Here, the flux is time-averaged, and computed using only walkers with the closed color to avoid overcounting; similarly, the probability includes only walkers with the closed color. Likewise,
Error bars for the free energy were obtained by running 3 replicates of 30 iterations each—ca. 6 μs per replicate—for an aggregate simulation time of 18 μs. We then extended one of these trajectories to 500 iterations and estimated the free energy difference using this single long trajectory (ΔGclosed-to-open = −2.66 kcal mol–1); this value is essentially the same as the estimate of −2.6 ± 0.1 kcal mol–1 we obtained using the three shorter trajectories. We obtained a two-point uncertainty estimate of the MFPT by splitting the longer trajectory into two halves and using a non-Markovian rate estimator47,48 to independently obtain kinetic estimates from the first and second halves of the trajectory.
Committor Probability Analysis (Pclosed)
We identified the structures with a possible nontrivial committor value from an analysis of the history tree of the AWE simulations. We selected the structures for which at least one spawned trajectory visited the closed state without visiting the open state, and at least one spawned trajectory visited the open state without visiting the closed state; if several such structures shared a common history, we only picked the sample from the latest iteration of AWE as a putative transition-state structure. We computed committor probability (Pclosed) estimates for these putative transition-state structures extracted from the AWE simulations. Starting from each structure, we performed 20 randomly thermalized simulations until each simulation either reached the closed state (WPD Loop Distance < 8.689 Å, WPD Loop RMSD < 0.269 Å) or open state (WPD Loop Distance > 10.075 Å, WPD Loop RMSD > 0.590 Å). We calculated Pclosed for each putative transition-state structure as the ratio between the number of trajectories that committed to the closed state and the total number of thermalized replicates. We computed the errors of the sample means using bootstrapping or a U-shaped prior of β(0.5,0.5), which both give a maximal absolute error of 0.1 for Pclosed = 0.5.
Random Forest and Model Selection
A set of 361 structural features associated with the PTP1B catalytic mechanism was curated from the PTP1B literature. We then computed these features for each putative transition state from the AWE simulations. A 10-fold cross-validated, bootstrap-aggregated (bagged) random forest model was then trained on these features to predict Pclosed as the response variable (P̂Closed). Feature importance scores were averaged across the 10-fold cross-validation (Figure S3) and assigned a rank k in increasing order, where k = 1 denotes the most important feature and k = 361 denotes the least important feature. A descendent strategy,49 with incrementally smaller numbers of the top features, was used to build new models (Figure 3c). We converged on a parsimonious, yet performant, model by evaluating each pruned model using the OOB error estimate.
BLAST and Multiple Sequence Alignment
We submitted the query “PD[F/H]G” in Standard Protein BLAST (blastp) with the BLOSUM62 substitution matrix and default parameters for short sequences. In the resulting list, each protein hit was mapped to UniProt. Entries with shared PFAM annotations were grouped together. The full amino acid sequences for each protein family group with more than one protein were then submitted to T-Coffee Multiple Sequence Alignment50 for full sequence alignments and quantitative probabilities on specific amino acid conservation. The resulting alignment and scores were then used to generate sequence logos with the “ggseqlogo”51 R package.
Acknowledgments
The authors thank Yibing Shan for drawing their attention to the DFG motif of PTP1B; Fabrizio Giordanetto, Sahar Shahamatdar, Hunter Nisonoff, and Ellen Zhong for helpful discussions; Michael Eastwood for feedback on the manuscript; and Berkman Frank and Eric Martens for editorial assistance.
Data Availability Statement
The molecular dynamics (MD) trajectories described in this work (the long MD simulations, the committor simulations, and the 500-iteration AWE simulation) are available for noncommercial use through contacting trajectories@deshawresearch.com. The simulations were performed using the Anton 2 supercomputer; the simulation code we used is specialized to Anton 2, but codes for performing MD simulation are widely available.
Supporting Information Available
The Supporting Information is available free of charge at https://pubs.acs.org/doi/10.1021/acs.jcim.3c00286.
The authors declare the following competing financial interest(s): This study was conducted and funded internally by D. E. Shaw Research, of which D.E.S. is the sole beneficial owner and Chief Scientist, and with which all authors are affiliated.
Supplementary Material
References
- Feldhammer M.; Uetani N.; Miranda-Saavedra D.; Tremblay M. L. PTP1B: A simple enzyme for a complex world. Crit. Rev. Biochem. Mol. Biol. 2013, 48, 430–445. 10.3109/10409238.2013.819830. [DOI] [PubMed] [Google Scholar]
- Tonks N. K. Protein tyrosine phosphatases: from genes, to function, to disease. Nat. Rev. Mol. Cell Biol. 2006, 7, 833–846. 10.1038/nrm2039. [DOI] [PubMed] [Google Scholar]
- Pannifer A. D. B.; Flint A. J.; Tonks N. K.; Barford D. Visualization of the Cysteinyl-phosphate Intermediate of a Protein-tyrosine Phosphatase by X-ray Crystallography. J. Biol. Chem. 1998, 273, 10454–10462. 10.1074/jbc.273.17.10454. [DOI] [PubMed] [Google Scholar]
- Jia Z.; Barford D.; Flint A.; Tonks N. Structural basis for phosphotyrosine peptide recognition by protein tyrosine phosphatase 1B. Science 1995, 268, 1754–1758. 10.1126/science.7540771. [DOI] [PubMed] [Google Scholar]
- Henzler-Wildman K. A.; Lei M.; Thai V.; Kerns S. J.; Karplus M.; Kern D. A hierarchy of timescales in protein dynamics is linked to enzyme catalysis. Nature 2007, 450, 913–916. 10.1038/nature06407. [DOI] [PubMed] [Google Scholar]
- Whittier S. K.; Hengge A. C.; Loria J. P. Conformational motions regulate phosphoryl transfer in related protein tyrosine phosphatases. Science 2013, 341, 899–903. 10.1126/science.1241735. [DOI] [PMC free article] [PubMed] [Google Scholar]
- Lisi G. P.; Loria J. P. Using NMR spectroscopy to elucidate the role of molecular motions in enzyme function. Prog. Nucl. Magn. Reson. Spectrosc. 2016, 92–93, 1–17. 10.1016/j.pnmrs.2015.11.001. [DOI] [PMC free article] [PubMed] [Google Scholar]
- Wiesmann C.; Barr K. J.; Kung J.; Zhu J.; Erlanson D. A.; Shen W.; Fahr B. J.; Zhong M.; Taylor L.; Randal M.; McDowell R. S.; Hansen S. K. Allosteric inhibition of protein tyrosine phosphatase 1B. Nat. Struct. Mol. Biol. 2004, 11, 730–737. 10.1038/nsmb803. [DOI] [PubMed] [Google Scholar]
- Greisman J. B.; Willmore L.; Yeh C. Y.; Giodranetto F.; Shahamadtar S.; Nisonoff H.; Maragakis P.; Shaw D. E. Discovery and validation of the binding poses of allosteric fragment hits to PTP1B: From molecular dynamics simulations to X-ray crystallography. J. Chem. Inf. Model. 2023, 63, 2644–2650. 10.1021/acs.jcim.3c00236. [DOI] [PMC free article] [PubMed] [Google Scholar]
- Choy M. S.; Li Y.; Machado L. E. S. F.; Kunze M. B. A.; Connors C. R.; Wei X.; Lindorff-Larsen K.; Page R.; Peti W. Conformational rigidity and protein dynamics at distinct timescales regulate PTP1B activity and allostery. Mol. Cell 2017, 65, 644–658.e5. 10.1016/j.molcel.2017.01.014. [DOI] [PMC free article] [PubMed] [Google Scholar]
- Keedy D. A.; Hill Z. B.; Biel J. T.; Kang E.; Rettenmaier T. J.; Brandão-Neto J.; Pearce N. M.; von Delft F.; Wells J. A.; Fraser J. S. An expanded allosteric network in PTP1B by multitemperature crystallography, fragment screening, and covalent tethering. eLife 2018, 7, e36307 10.7554/eLife.36307. [DOI] [PMC free article] [PubMed] [Google Scholar]
- Moise G.; Morales Y.; Beaumont V.; Caradonna T.; Loria J. P.; Johnson S. J.; Hengge A. C. A YopH PTP1B chimera shows the importance of the WPD-loop sequence to the activity, structure, and dynamics of protein tyrosine phosphatases. Biochemistry 2018, 57, 5315–5326. 10.1021/acs.biochem.8b00663. [DOI] [PubMed] [Google Scholar]
- Shen R.; Crean R. M.; Olsen K. J.; Corbella M.; Calixto A. R.; Richan T.; Brandão T. A. S.; Berry R. D.; Tolman A.; Loria J. P.; Johnson S. J.; Kamerlin S. C. L.; Hengge A. C. Insights into the importance of WPD-loop sequence for activity and structure in protein tyrosine phosphatases. Chem. Sci. 2022, 13, 13524–13540. 10.1039/D2SC04135A. [DOI] [PMC free article] [PubMed] [Google Scholar]
- Crean R. M.; Biler M.; van der Kamp M. W.; Hengge A. C.; Kamerlin S. C. L. Loop Dynamics and Enzyme Catalysis in Protein Tyrosine Phosphatases. J. Am. Chem. Soc. 2021, 143, 3830–3845. 10.1021/jacs.0c11806. [DOI] [PMC free article] [PubMed] [Google Scholar]
- Costaouec R.; Feng H.; Izaguirre J.; Darve E.. Analysis of the Accelerated Weighted Ensemble Methodology. In Conference Publications; AIMS Press, 2013; pp 171–181. [Google Scholar]
- Bhatt D.; Zhang B. W.; Zuckerman D. M. Steady-state simulations using weighted ensemble path sampling. J. Chem. Phys. 2010, 133, 014110 10.1063/1.3456985. [DOI] [PMC free article] [PubMed] [Google Scholar]
- Zuckerman D. M.; Chong L. T. Weighted Ensemble Simulation: Review of Methodology, Applications, and Software. Annu. Rev. Biophys. 2017, 46, 43–57. 10.1146/annurev-biophys-070816-033834. [DOI] [PMC free article] [PubMed] [Google Scholar]
- Onsager L. Initial Recombination of Ions. Phys. Rev. 1938, 54, 554–557. 10.1103/PhysRev.54.554. [DOI] [Google Scholar]
- Shaw D. E.; Maragakis P.; Lindorff-Larsen K.; Piana S.; Dror R. O.; Eastwood M. P.; Bank J. A.; Jumper J. M.; Salmon J. K.; Shan Y.; Wriggers W. Atomic-level characterization of the structural dynamics of proteins. Science 2010, 330, 341–346. 10.1126/science.1187409. [DOI] [PubMed] [Google Scholar]
- Genuer R.; Poggi J.-M.; Tuleau-Malot C. Variable selection using random forests. Pattern Recognit. Lett. 2010, 31, 2225–2236. 10.1016/j.patrec.2010.03.014. [DOI] [Google Scholar]
- Mackenzie C. O.; Zhou J.; Grigoryan G. Tertiary alphabet for the observable protein structural universe. Proc. Natl. Acad. Sci. U.S.A. 2016, 113, E7438–E7447. 10.1073/pnas.1607178113. [DOI] [PMC free article] [PubMed] [Google Scholar]
- Zheng F.; Grigoryan G. Sequence statistics of tertiary structural motifs reflect protein stability. PLoS One 2017, 12, e0178272 10.1371/journal.pone.0178272. [DOI] [PMC free article] [PubMed] [Google Scholar]
- Andersen J. N.; Mortensen O. H.; Peters G. H.; Drake P. G.; Iversen L. F.; Olsen O. H.; Jansen P. G.; Andersen H. S.; Tonks N. K.; Møller N. P. H. Structural and evolutionary relationships among protein tyrosine phosphatase domains. Mol. Cell. Biol. 2001, 21, 7117–7136. 10.1128/MCB.21.21.7117-7136.2001. [DOI] [PMC free article] [PubMed] [Google Scholar]
- Bicker K. L.; Thompson P. R. The protein arginine deiminases: Structure, function, inhibition, and disease. Biopolymers 2013, 99, 155–163. 10.1002/bip.22127. [DOI] [PMC free article] [PubMed] [Google Scholar]
- Kamerlin S. C. L.; Rucker R.; Boresch S. A molecular dynamics study of WPD-loop flexibility in PTP1B. Biochem. Biophys. Res. Commun. 2007, 356, 1011–1016. 10.1016/j.bbrc.2007.03.093. [DOI] [PubMed] [Google Scholar]
- Yang J.; Niu T.; Zhang A.; Mishra A. K.; Zhao Z. J.; Zhou G. W. Relation between the flexibility of the WPD loop and the activity of the catalytic domain of protein tyrosine phosphatase SHP-1. J. Cell. Biochem. 2002, 84, 47–55. 10.1002/jcb.1265. [DOI] [PubMed] [Google Scholar]
- Barr A. J.; Ugochukwu E.; Lee W. H.; King O. N.; Filippakopoulos P.; Alfano I.; Savitsky P.; Burgess-Brown N. A.; Müller S.; Knapp S. Large-scale structural analysis of the classical human protein tyrosine phosphatome. Cell 2009, 136, 352–363. 10.1016/j.cell.2008.11.038. [DOI] [PMC free article] [PubMed] [Google Scholar]
- Treiber D. K.; Shah N. P. Ins and outs of kinase DFG motifs. Chem. Biol. 2013, 20, 745–746. 10.1016/j.chembiol.2013.06.001. [DOI] [PubMed] [Google Scholar]
- Cui D. S.; Lipchock J. M.; Brookner D.; Loria J. P. Uncovering the molecular interactions in the catalytic loop that modulate the conformational dynamics in protein tyrosine phosphatase 1B. J. Am. Chem. Soc. 2019, 141, 12634–12647. 10.1021/jacs.9b04470. [DOI] [PMC free article] [PubMed] [Google Scholar]
- Slade D. J.; Fang P.; Dreyton C. J.; Zhang Y.; Fuhrmann J.; Rempel D.; Bax B. D.; Coonrod S. A.; Lewis H. D.; Guo M.; Gross M. L.; Thompson P. R. Protein arginine deiminase 2 binds calcium in an ordered fashion: Implications for inhibitor design. ACS Chem. Biol. 2015, 10, 1043–1053. 10.1021/cb500933j. [DOI] [PMC free article] [PubMed] [Google Scholar]
- Arita K.; Hashimoto H.; Shimizu T.; Nakashima K.; Yamada M.; Sato M. Structural basis for Ca2+-induced activation of human PAD4. Nat. Struct. Mol. Biol. 2004, 11, 777–783. 10.1038/nsmb799. [DOI] [PubMed] [Google Scholar]
- Jones J. E.; Slack J. L.; Fang P.; Zhang X.; Subramanian V.; Causey C. P.; Coonrod S. A.; Guo M.; Thompson P. R. Synthesis and screening of a haloacetamidine containing library to identify PAD4 selective inhibitors. ACS Chem. Biol. 2012, 7, 160–165. 10.1021/cb200258q. [DOI] [PMC free article] [PubMed] [Google Scholar]
- Mackenzie C. O.; Grigoryan G. Protein structural motifs in prediction and design. Curr. Opin. Struct. Biol. 2017, 44, 161–167. 10.1016/j.sbi.2017.03.012. [DOI] [PMC free article] [PubMed] [Google Scholar]
- Vanhee P.; Verschueren E.; Baeten L.; Stricher F.; Serrano L.; Rousseau F.; Schymkowitz J. BriX: a database of protein building blocks for structural analysis, modeling and design. Nucleic Acids Res. 2011, 39, D435–D442. 10.1093/nar/gkq972. [DOI] [PMC free article] [PubMed] [Google Scholar]
- Shaw D. E.; Grossman J.P.; Bank J. A.; Batson B.; Butts J. A.; Chao J. C.; Deneroff M. M.; Dror R. O.; Even A.; Fenton C. H.; Forte A.; Gagliardo J.; Gill G.; Greskamp B.; Ho C. R.; Ierardi D. J.; Iserovich L.; Kuskin J. S.; Larson R. H.; Layman T.; Lee L.-S.; Lerer A. K.; Li C.; Killebrew D.; Mackenzie K. M.; Mok S. Y.-H.; Moraes M. A.; Mueller R.; Nociolo L. J.; Peticolas J. L.; Quan T.; Ramot D.; Salmon J. K.; Scarpazza D. P.; Schafer U. B.; Siddique N.; Snyder C. W.; Spengler J.; Tang P. T. P.; Theobald M.; Toma H.; Towles B.; Vitale B.; Wang S. C.; Young C. In Anton 2: Raising the Bar for Performance and Programmability in a Special-Purpose Molecular Dynamics Supercomputer, Proceedings of the International Conference for High Performance Computing, Networking, Storage and Analysis (SC14); IEEE: Piscataway, NJ, 2014; pp 41–53.
- Pedersen A. K.; Peters G. H.; Møller K. B.; Iversen L. F.; Kastrup J. S. Water-molecule network and active-site flexibility of apo protein tyrosine phosphatase 1B. Acta Crystallogr., Sect. D: Biol. Crystallogr. 2004, 60, 1527–1534. 10.1107/S0907444904015094. [DOI] [PubMed] [Google Scholar]
- Ala P. J.; Gonneville L.; Hillman M. C.; Becker-Pasha M.; Wei M.; Reid B. G.; Klabe R.; Yue E. W.; Wayland B.; Douty B.; Polam P.; Wasserman Z.; Bower M.; Combs A. P.; Burn T. C.; Hollis G. F.; Wynn R. Structural basis for inhibition of protein-tyrosine phosphatase 1B by isothiazolidinone heterocyclic phosphonate mimetics. J. Biol. Chem. 2006, 281, 32784–32795. 10.1074/jbc.M606873200. [DOI] [PubMed] [Google Scholar]
- Lindorff-Larsen K.; Piana S.; Palmo K.; Maragakis P.; Klepeis J. L.; Dror R. O.; Shaw D. E. Improved side-chain torsion potentials for the Amber ff99SB protein force field. Proteins 2010, 78, 1950–1958. 10.1002/prot.22711. [DOI] [PMC free article] [PubMed] [Google Scholar]
- Hornak V.; Abel R.; Okur A.; Strockbine B.; Roitberg A.; Simmerling C. Comparison of multiple Amber force fields and development of improved protein backbone parameters. Proteins 2006, 65, 712–725. 10.1002/prot.21123. [DOI] [PMC free article] [PubMed] [Google Scholar]
- Best R. B.; Hummer G. Optimized molecular dynamics force fields applied to the helix-coil transition of polypeptides. J. Phys. Chem. B 2009, 113, 9004–9015. 10.1021/jp901540t. [DOI] [PMC free article] [PubMed] [Google Scholar]
- Wang J.; Cieplak P.; Kollman P. A. How well does a restrained electrostatic potential (RESP) model perform in calculating conformational energies of organic and biological molecules?. J. Comput. Chem. 2000, 21, 1049–1074. . [DOI] [Google Scholar]
- Åqvist J. Ion–water interaction potentials derived from free energy perturbation simulations. J. Phys. Chem. A 1990, 94, 8021–8024. 10.1021/j100384a009. [DOI] [Google Scholar]
- Jorgensen W. L.; Chandrasekhar J.; Madura J. D.; Impey R. W.; Klein M. L. Comparison of simple potential functions for simulating liquid water. J. Chem. Phys. 1983, 79, 926–935. 10.1063/1.445869. [DOI] [Google Scholar]
- Abdul-Wahid B.; Feng H.; Rajan D.; Costaouec R.; Darve E.; Thain D.; Izaguirre J. A. AWE-WQ: fast-forwarding molecular dynamics using the accelerated weighted ensemble. J. Chem. Inf. 2014, 54, 3033–3043. 10.1021/ci500321g. [DOI] [PMC free article] [PubMed] [Google Scholar]
- Suárez E.; Adelman J. L.; Zuckerman D. M. Accurate Estimation of Protein Folding and Unfolding Times: Beyond Markov State Models. J. Chem. Theory Comput. 2016, 12, 3473–3481. 10.1021/acs.jctc.6b00339. [DOI] [PMC free article] [PubMed] [Google Scholar]
- Suárez E.; Pratt A. J.; Chong L. T.; Zuckerman D. M. Estimating first-passage time distributions from weighted ensemble simulations and non-Markovian analyses. Protein Sci. 2016, 25, 67–78. 10.1002/pro.2738. [DOI] [PMC free article] [PubMed] [Google Scholar]
- Genuer R.; Poggi J.-M.; Tuleau-Malot C. Variable selection using random forests. Pattern Recognit. Lett. 2010, 31, 2225–2236. 10.1016/j.patrec.2010.03.014. [DOI] [Google Scholar]
- Sievers F.; Wilm A.; Dineen D.; Gibson T. J.; Karplus K.; Li W.; Lopez R.; McWilliam H.; Remmert M.; Söding J.; Thompson J. D.; Higgins D. G. Fast, scalable generation of high-quality protein multiple sequence alignments using Clustal Omega. Mol. Syst. Biol. 2011, 7, 539. 10.1038/msb.2011.75. [DOI] [PMC free article] [PubMed] [Google Scholar]
- Wagih O. ggseqlogo: a versatile R package for drawing sequence logos. Bioinformatics 2017, 33, 3645–3647. 10.1093/bioinformatics/btx469. [DOI] [PubMed] [Google Scholar]
- Scherer M. K.; Trendelkamp-Schroer B.; Paul F.; Pérez-Hernández G.; Hoffmann M.; Plattner N.; Wehmeyer C.; Prinz J. H.; Noé F. PyEMMA 2: A software package for estimation, validation, and analysis of Markov models. J. Chem. Theory Comput. 2015, 11, 5525–5542. 10.1021/acs.jctc.5b00743. [DOI] [PubMed] [Google Scholar]
- Vanden-Eijnden W.; Vanden-Eijnden E. Transition-path theory and path-finding algorithms for the study of rare events. Annu. Rev. Phys. Chem. 2010, 61, 391–420. 10.1146/annurev.physchem.040808.090412. [DOI] [PubMed] [Google Scholar]
Associated Data
This section collects any data citations, data availability statements, or supplementary materials included in this article.
Supplementary Materials
Data Availability Statement
The molecular dynamics (MD) trajectories described in this work (the long MD simulations, the committor simulations, and the 500-iteration AWE simulation) are available for noncommercial use through contacting trajectories@deshawresearch.com. The simulations were performed using the Anton 2 supercomputer; the simulation code we used is specialized to Anton 2, but codes for performing MD simulation are widely available.