Abstract
Despite the significance of N6-methyladenosine (m6A) in gene regulation, the requirement for large amounts of RNA has hindered m6A profiling in mammalian early embryos. Here we apply low-input methyl RNA immunoprecipitation and sequencing to map m6A in mouse oocytes and preimplantation embryos. We define the landscape of m6A during the maternal-to-zygotic transition, including stage-specifically expressed transcription factors essential for cell fate determination. Both the maternally inherited transcripts to be degraded post fertilization and the zygotically activated genes during zygotic genome activation are widely marked by m6A. In contrast to m6A-marked zygotic ally-activated genes, m6A-marked maternally inherited transcripts have a higher tendency to be targeted by microRNAs. Moreover, RNAs derived from retrotransposons, such as MTA that is maternally expressed and MERVL that is transcriptionally activated at the two-cell stage, are largely marked by m6A. Our results provide a foundation for future studies exploring the regulatory roles of m6A in mammalian early embryonic development.
N6-methyladenosine (m6A), the most prevalent internal modification in eukaryotic messenger RNA (mRNA), plays key regulatory roles in many biological processes (for example, RNA stability, splicing, transport and translation) and is involved in a variety of physiological processes (for example, cell differentiation and reprogramming, embryonic development and stress responses)1–3. Since the first transcriptome-wide m6A maps in mammalian cells were reported in 2012 (refs. 4,5), a number of m6A mapping approaches have been developed to characterize the m6A methylome in various cell types and tissues2. Early mammalian embryos undergo global epigenetic reprogramming, such as removal and addition of DNA methylation and histone modifications, to allow precise maternal-to-zygotic transition and cell fate determination before implantation6,7. However, the transcriptome-wide m6A profiles in mammalian preimplantation embryos remain uncharacterized so far, impeded by the limited cell numbers that can be obtained. We recently developed an m6A mapping assay for low RNA input, low-input methyl RNA immunoprecipitation and sequencing (picoMeRIP-seq), which enables mapping of the m6A methylome using a low number of cells (submitted, see ‘picoMeRIP-seq experiment’ subsection in Methods). In this article, we applied picoMeRIP-seq to multiple developmental stages of mouse oocytes and early embryos to profile their m6A landscapes.
Results
Global view of m6A in mouse oocytes and early embryos
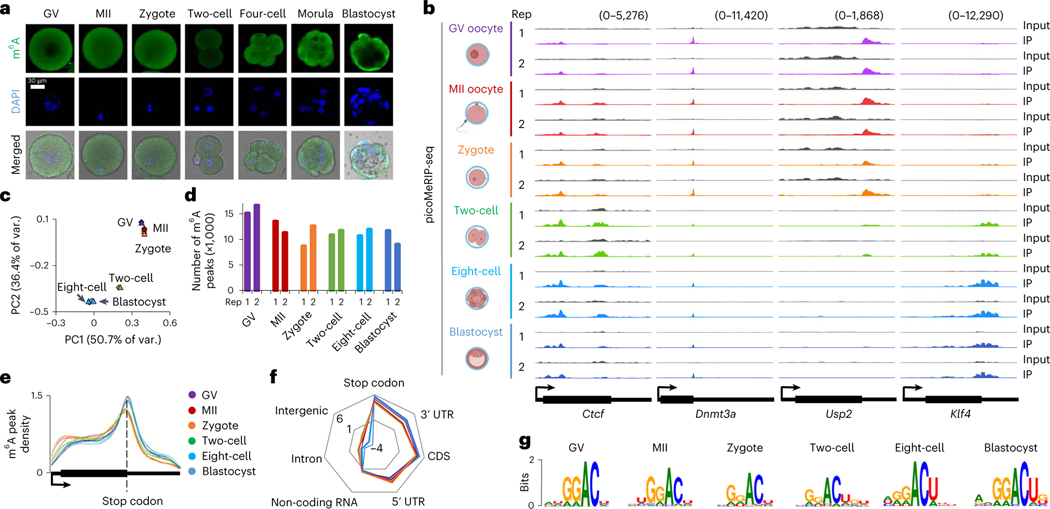
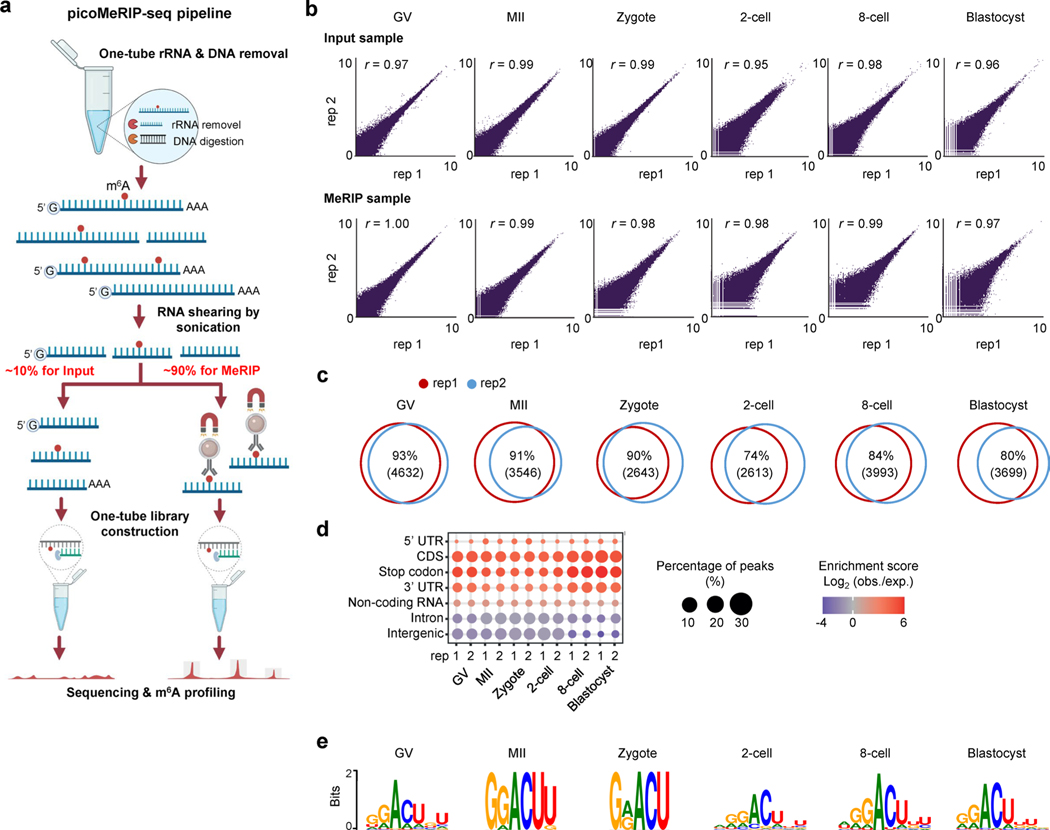
To assess the global m6A modification level, we conducted immunofluorescence staining of m6A in oocytes at germinal vesicle (GV) and metaphase II (MII) stages, and early embryos at zygote, two-cell, four-cell, morula and blastocyst stages. We detected m6A in all stages (Fig. 1a), consistent with previous work8. Using picoMeRIP-seq, we generated transcriptome-wide m6A maps for six stages (GV, MII, zygote, two-cell, eight-cell and blastocyst), with two biological replicates per stage and 49–110 oocytes/embryos per replicate (Fig. 1b, Extended Data Fig. 1a and Extended Data Table 1). On average, 3.6 million uniquely aligned and deduplicated sequencing read pairs per MeRIP sample, and 5.9 million per Input control sample, were obtained after removing ribosomal RNA (rRNA)-derived reads (Extended Data Table 1). The two biological replicates were highly consistent across all six stages, as examined by transcriptome-wide correlation analyses (Pearson’s r ≥ 0.95) (Extended Data Fig. 1b) and exemplified by genome browser snapshots of representative genes, including Ctcf (transcriptional repressor), Dnmt3a (DNA methyltransferase), Usp2 (deubiquitinase) and Klf4 (transcription factor important for early embryonic development) (Fig. 1b). Principal component analysis (PCA) revealed a distinct clustering based on the m6A profiles of the different developmental stages (Fig. 1c).
Fig. 1 |. RNA m6A landscapes of mouse oocytes and embryos.
a, m6A immunofluorescence staining. Experiments were repeated three times. b, Genome browser snapshot of picoMeRIP-seq read density in exonic regions of representative gene transcripts for the indicated oocyte and embryo stages. The oocyte and embryo cartoons were created with BioRender.com. c, PCA on 12 picoMeRIP-seq experiments from indicated oocyte and embryo stages. d, Number of m6A peaks. e, Metagene profiles of m6A peak distribution. f, Relative enrichment of m6A peaks for indicated genomic features. For each feature, the enrichment score was calculated as the log2 ratio of the observed over expected peak numbers. The colors of samples are the same as those in e. g, Consensus motifs on m6A peaks identified in biological replicate 1.
We identified an average of 11,965 m6A peaks per stage (Fig. 1d), and 5,776 (GV), 5,076 (MII), 4,579 (zygote), 4,851 (two-cell), 5,905 (eight-cell) and 6,234 (blastocyst) genes that carried the m6A modification. The m6A profiles between biological replicates were highly comparable (Extended Data Fig. 1c). In agreement with existing knowledge1, these m6A peaks were remarkably enriched in the vicinity of the stop codon (Fig. 1e,f and Extended Data Fig. 1d), and showed a clear RRACH (R = G/A, H = A/C/U) consensus motif (Fig. 1g and Extended Data Fig. 1e) across all stages.
m6A dynamics during the maternal-to-zygotic transition
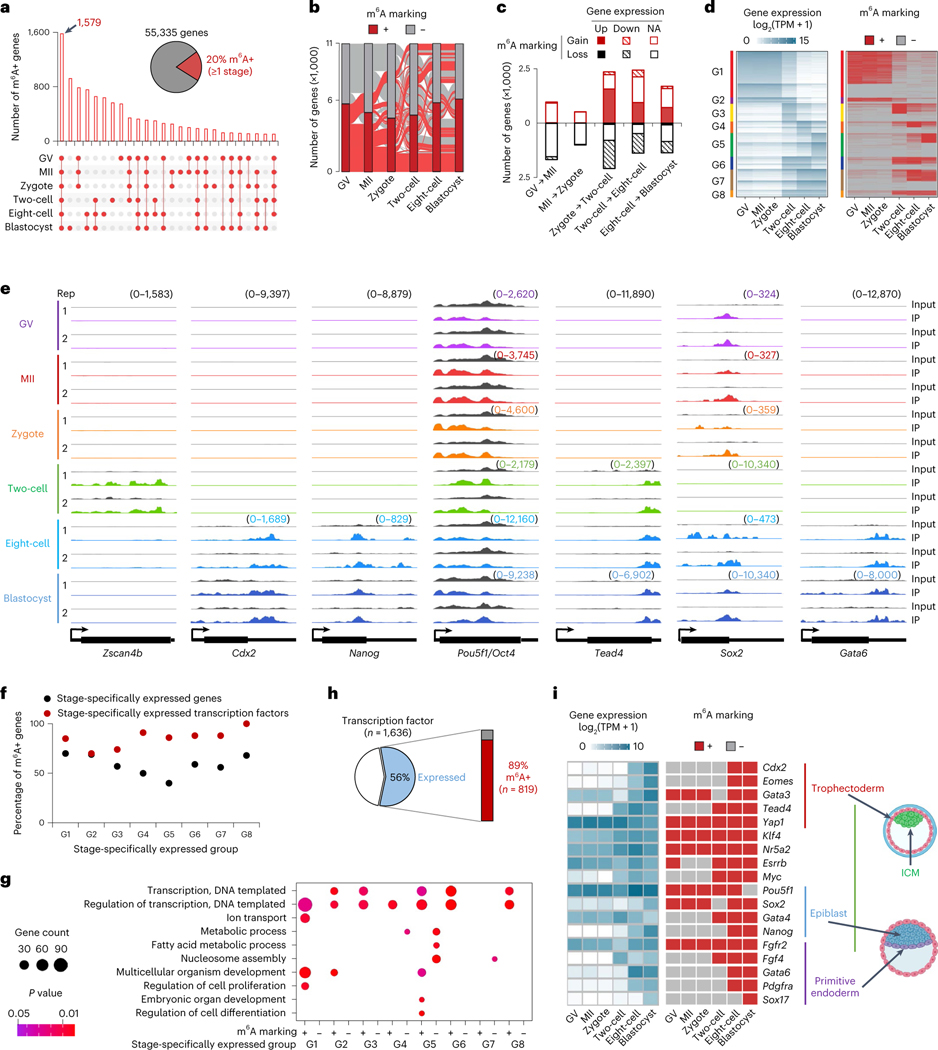
We designated a gene as m6A+ if any of its transcripts overlapped with m6A peaks in ≥1 biological replicate of the given stage, or m6A−otherwise. About 20% (10,947 of 55,335 annotated by GENCODE gene annotation library) of genes were m6A+ in at least one developmental stage, and 1,579 genes were m6A+ at all six stages (Fig. 2a and Supplementary Table 1). Among the genes highly expressed (transcripts per million (TPM) ≥10) at each stage, about 50% were marked with m6A (50% of 9,453 in GV, 48% of 9,067 in MII, 44% of 9,030 in zygote, 43% of 9,438 in two-cell, 57% of 8,455 in eight-cell and 56% of 8,725 in blastocyst). Notably, a dramatic switch in m6A status was observed between the zygote and two-cell stage (Fig. 2b,c). The two-cell embryo had 2,356 genes that gained m6A and 2,084 genes that lost m6A compared with the zygote (Fig. 2c). Of these, 66% of m6A-gain and 62% of m6A-loss genes could be explained by gene expression reprogramming (that is, upregulation and downregulation, respectively) in this period where both maternal RNA degradation and zygotic genome activation (ZGA) occur (Fig. 2c).
Fig. 2 |. Characterization of m6A methylome dynamics during development.
a, Overview of shared and unique m6A marked (m6A+) genes for the indicated oocyte and embryo stages. b, Alluvial plot showing the dynamics in m6A marked genes between indicated oocyte and embryo stages. c, Genes gaining and losing m6A marking versus change in gene expression between consecutive oocyte and embryo stages. Each gene is denoted as Up, if the log2 of expression fold change of one stage versus the next is >1; Down, if <−1; NA, otherwise. d, Left: heat map of stage-specifically expressed genes categorized into eight major groups. Right: representation of genes marked by m6A or not in comparison with stage-specific expression. e, Genome browser snapshots of picoMeRIP-seq read density in exonic regions of the two-cell specifically expressed gene Zscan4b, and selected genes important to various stages of embryo development. The sample-specific scale ranges are indicated in brackets with the corresponding colors. f, Fractions of m6A marked genes within expressed genes (black dots), and within expressed transcription factors (red dots), respectively, at each stage-specifically expressed group (G1–G8 defined in d). Chi-squared test was performed to calculate the statistical significance (P values 2.9 × 10⁻⁴, 0.99, 1.2 × 10⁻², 7.4 × 10⁻⁷, 2.1 × 10⁻¹¹, 1.1 × 10⁻⁴, 2.0 × 10⁻⁵ and 1.7 × 10⁻⁴ for G1–G8, respectively) of m6A enrichment in expressed transcription factors versus the other expressed genes. g, GO analyses of genes marked (m6A+) or not marked (m6A−) by m6A. Stage-specifically expressed groups defined in d. Fisher’s exact test was used to calculate the one-sided P values. h, Fraction of all transcription factors that are expressed in oocytes or embryos and marked by m6A at ≥1 stage. i, Expression and m6A marking status of genes essential for the first and second lineage specification events in mouse early embryos. The embryo cartoons were created with BioRender.com.
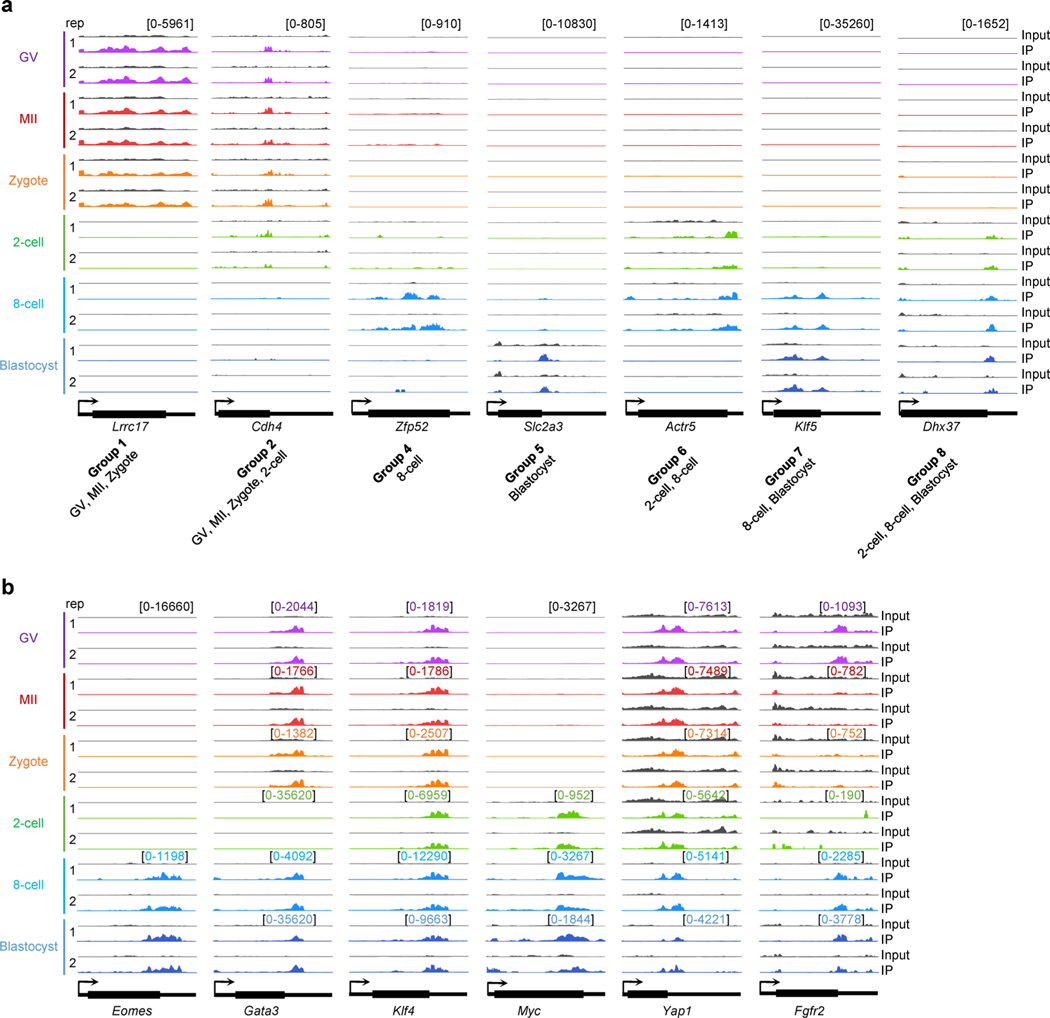
Next, we assessed the m6A profiles of the stage-specifically expressed genes. To rule out the effect of RNA abundance on m6A detection, we considered only those highly expressed genes in given stages (Methods). Using a Shannon entropy-based method, we identified 5,996 stage-specifically expressed genes on the basis of their expression pattern, and focused on eight major groups (≥100 genes per group) (Fig. 2d and Supplementary Table 2). For example, the two-cell specifically expressed gene Zscan4b (ref. 9) was marked by m6A at the two-cell stage (Fig. 2e and Extended Data Fig. 2a). The fractions of m6A+ genes in the eight groups varied from 40% as the lowest (group 5: specifically expressed in blastocyst) to 70% as the highest (group 1: specifically expressed in GV, MII and zygote) (Fig. 2f). Gene Ontology (GO) analyses revealed that m6A+ and m6A− genes were functionally distinct (Fig. 2g). For example, in group 5 (that is, specifically expressed in blastocyst), m6A− genes were significantly enriched in metabolic processes, whereas m6A+ genes were involved in the regulation of cell differentiation and embryonic development. Of note, except for group 7 (that is, specifically expressed in eight-cell and blastocyst), m6A+ genes were strongly associated with regulation of transcription. On average for all groups, around 85% of stage-specifically expressed transcription factor mRNAs were marked by m6A. Except for group 2 (that is, specifically expressed in GV, MII, zygote and two-cell), transcription factors within each of the other seven groups all showed a statistically significant m6A enrichment relative to other expressed genes (Fig. 2f; P values <0.05, chi-squared test), and 89% (819 of 919) of transcription factors expressed in mouse oocytes and early embryos were m6A marked at ≥1 developmental stage (Fig. 2h), which was significantly higher than other expressed genes (P value <2.2 × 10⁻¹⁶, chi-squared test).
Focusing on the master transcription regulators essential for pluripotency maintenance and functional differentiation in early embryos, we observed extensive m6A occupancy (Fig. 2e,i and Extended Data Fig. 2b). The key genes for the first lineage specification event of mouse embryos10 were m6A marked, such as Cdx2 and Eomes, required for trophectoderm, Nanog and Oct4/Pou5f1, required for inner cell mass (ICM), and Tead4 and Yap1, required for both trophectoderm and ICM. The m6A-mediated roles of Nanog in controlling the fate transition of mouse embryonic stem cells (mESCs) have been well studied11–14. Interestingly, Oct4/Pou5f1, which has been reported to lack the m6A modification in mESCs11–14, showed m6A enrichment across all six assessed stages, even though the m6A peaks were not called as significant in blastocysts (Fig. 2e,i). The genes regulating the second lineage specification (that is, segregation of epiblast and primitive endoderm from ICM)15 were also m6A marked, such as Sox2, required for epiblast, and Gata6, required for primitive endoderm differentiation. Taken together, these analyses provide a foundation for future studies to explore the potential roles of m6A in preimplantation embryo development.
m6A marking and miRNA targeting on Decay and ZGA genes
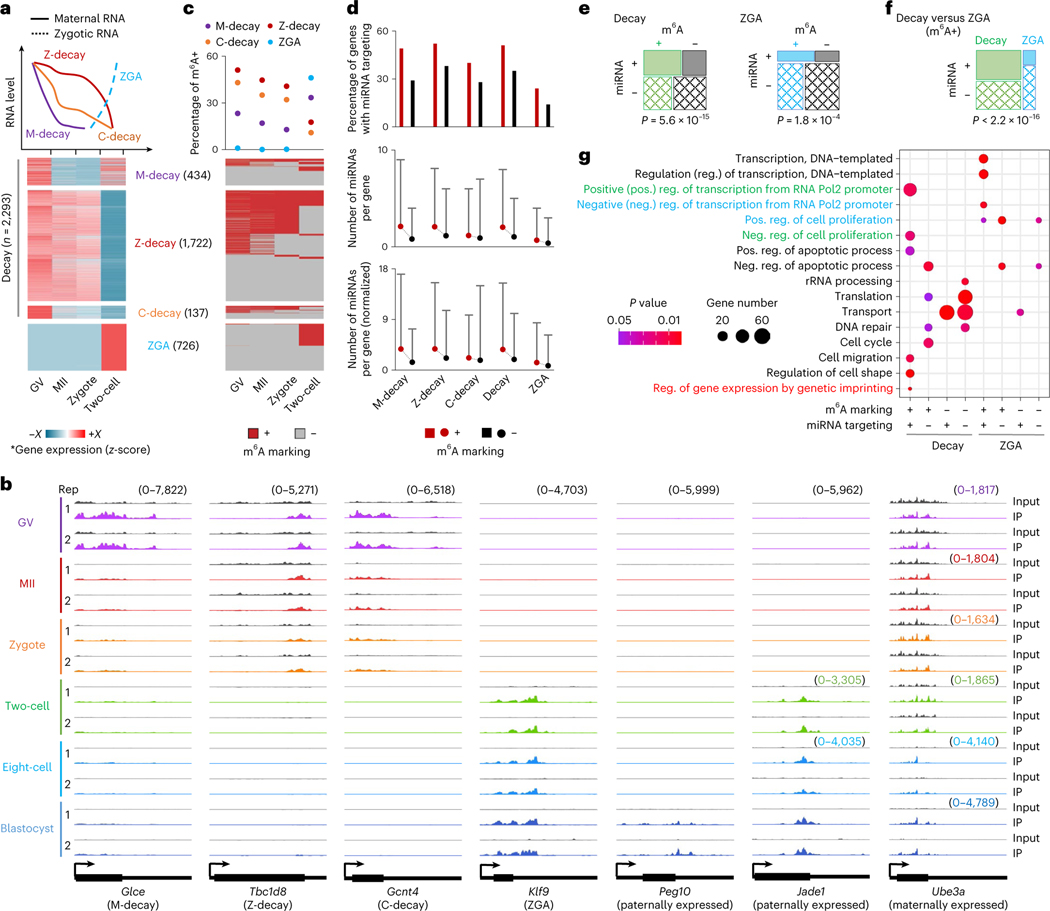
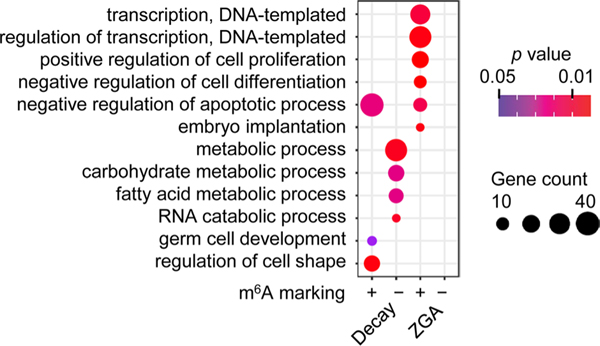
We and others have illustrated the potential role of the m6A reader Ythdf2 in mouse development by regulating RNA dosage, including oocyte maturation and early zygotic development16, neural development17 and gametogenesis18. Combining our m6A profiles in wild-type GV oocytes with the RNA sequencing (RNA-seq) data from Ythdf2 knockout GV oocytes and wild type18, we showed that upregulated genes (Ythdf2 knockout versus wild type) were preferentially marked by m6A (151 of 310 upregulated genes versus 54 of 282 downregulated genes, P = 4.4 × 10⁻¹⁴, chi-squared test), providing further evidence of the role of Ythdf2 in regulating m6A-marked RNA stability. We next assessed the possible roles of m6A in two key developmental events: degradation of maternal RNAs and activation of zygotic genes. In accordance with what has been described previously19, we identified degraded maternally derived (Decay) genes and categorized them into three subsets on the basis of their differential degradation patterns in pre- and postfertilization stages: (1) M-decay, greatly degraded during oocyte maturation; (2) Z-decay, greatly degraded after fertilization; and (3) C-decay, continuously degraded from GV oocyte to two-cell stages (Fig. 3a and Supplementary Table 3). We also defined ZGA genes that were highly activated in two-cell embryos and repressed in oocytes. In total, 2,293 Decay (434 M-decay, 1,722 Z-decay and 137 C-decay) and 726 ZGA genes were identified, such as Glce (M-decay), Tbc1d8 (Z-decay), Gcnt4 (C-decay) and Klf9 (ZGA) (Fig. 3a,b). In contrast to the relatively low fraction, <30%, of m6A+ genes among the M-decay genes, the fraction of m6A+ genes in oocytes (either GV or MII stages) were >50% for Z-decay and C-decay genes; and for the two-cell stage ZGA genes the fraction was 46% (Fig. 3c). GO analyses showed that m6A− Decay genes were involved in multiple metabolic processes. The m6A+ Decay genes were largely associated with apoptosis and cell shape regulation, in addition to germ cell development, which is in accordance with a recent study20 (Extended Data Fig. 3). Furthermore, m6A+ ZGA genes were significantly enriched in a selection of processes required for embryogenesis, including transcriptional regulation, cell proliferation and embryo implantation (Extended Data Fig. 3), and their enrichments in each process were all statistically significant relative to m6A− ZGA genes (P values <0.05, chi-squared test).
Fig. 3 |. m6A marking and miRNA targeting profiles on Decay and ZGA genes.
a, Definition of Decay and ZGA genes. Top: schematic plot over different expression patterns. Bottom: heat maps of relative gene expression across the four stages. b, Genome browser snapshots of picoMeRIP-seq read density in exonic regions of representative genes. The sample-specific scale ranges are indicated in brackets with the corresponding colors. c, m6A marking status of genes ordered according to a. d, Differential miRNA targeting between m6A+ and m6A− genes. Top: percentage of genes targeted by ≥1 miRNA. Middle: number of miRNAs per gene. Bottom: normalized number of miRNAs per gene, normalized to miRNA expression level. For more details, see Methods. For middle and bottom panels, the dot represents the mean value and the bar is the 95th quantile. e,f, Fisher’s exact test showing the significant miRNA targeting (vertical, ‘+’ for genes that are targeted by miRNA, ‘−’ for genes that are not targeted by miRNA) on m6A+ genes (horizontal, ‘+’ for genes that are marked with m6A, ‘−’ for genes that are not marked with m6A) in Decay and ZGA, respectively (e) and Decay versus ZGA (f). The area of the box represents gene count. For the definition of miRNA targeted genes, see the ‘miRNA analyses’ subsection of Methods. g, GO analyses of genes with different m6A marking and miRNA targeting states in Decay and ZGA genes. Fisher’s exact test was used to calculate the one-sided P values. *The gene expression is log2(TPM + 1), and then normalized by z-score across four stages. The color range (−X to +X): M-decay, −1.72 to 1.73; Z-decay, −1.73 to 1.63; C-decay, −1.44 to 1.73; ZGA, −0.71 to 1.73.
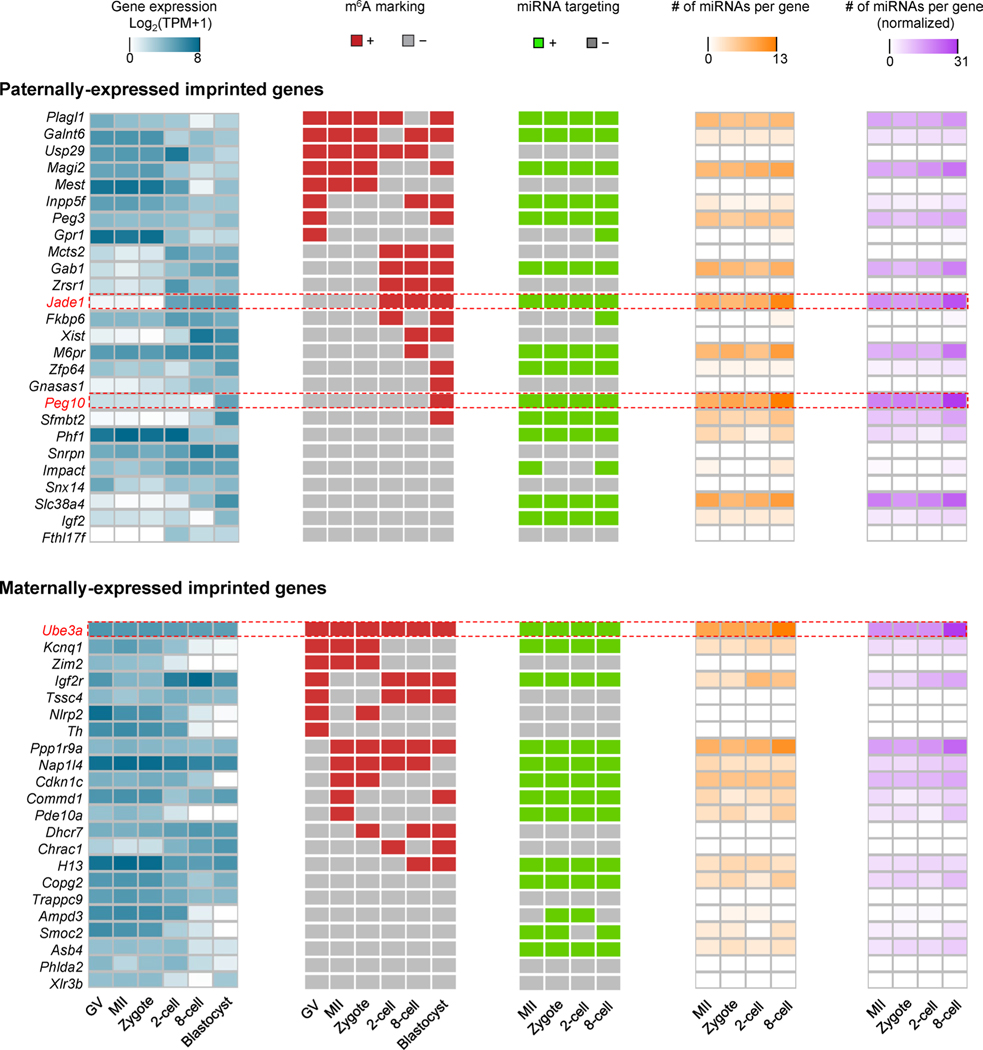
As previously reported21, m6A-marked regions tend to be targeted by microRNAs (miRNAs) in mESCs. We wondered whether miRNAs could frequently target the m6A+ Decay and ZGA genes. By comparing with miRNA expression data22 (Supplementary Table 4), we revealed that miRNAs had a significant tendency to target m6A+ genes as compared with m6A− genes for both Decay (51% versus 35%, P = 5.6 × 10⁻¹⁵, Fisher’s exact test) and ZGA genes (24% versus 14%, P = 1.8 × 10⁻⁴, Fisher’s exact test) (Fig. 3d,e). Moreover, the miRNA-targeted fraction of m6A+ genes in the Decay group was significantly higher than that of the ZGA group (51% versus 24%, P < 2.2 × 10⁻¹⁶, Fisher’s exact test) (Fig. 3f). Intriguingly, the miRNA-targeted m6A+ genes in the Decay group seemed to mediate opposite functions to those in the ZGA group, such as positive (Decay) versus negative (ZGA) regulation of transcription, and negative (Decay) versus positive (ZGA) regulation of cell proliferation (Fig. 3g). Furthermore, the observation that enrichment of miRNA-targeted m6A+ Decay genes was associated with genetic imprinting (Fig. 3g), prompted us to analyze m6A modification and miRNA targeting at known imprinted genes. More than two-thirds of paternally (19 of 26) and maternally (15 of 22) expressed imprinted genes were m6A marked, and ~65% of those were also targeted by miRNAs (Extended Data Fig. 4). Examples include Peg10 (paternally and specifically expressed in blastocysts) and Ube3a (maternally and constantly expressed across all stages) (Fig. 3b).
Deposition of m6A on retrotransposon-derived RNAs
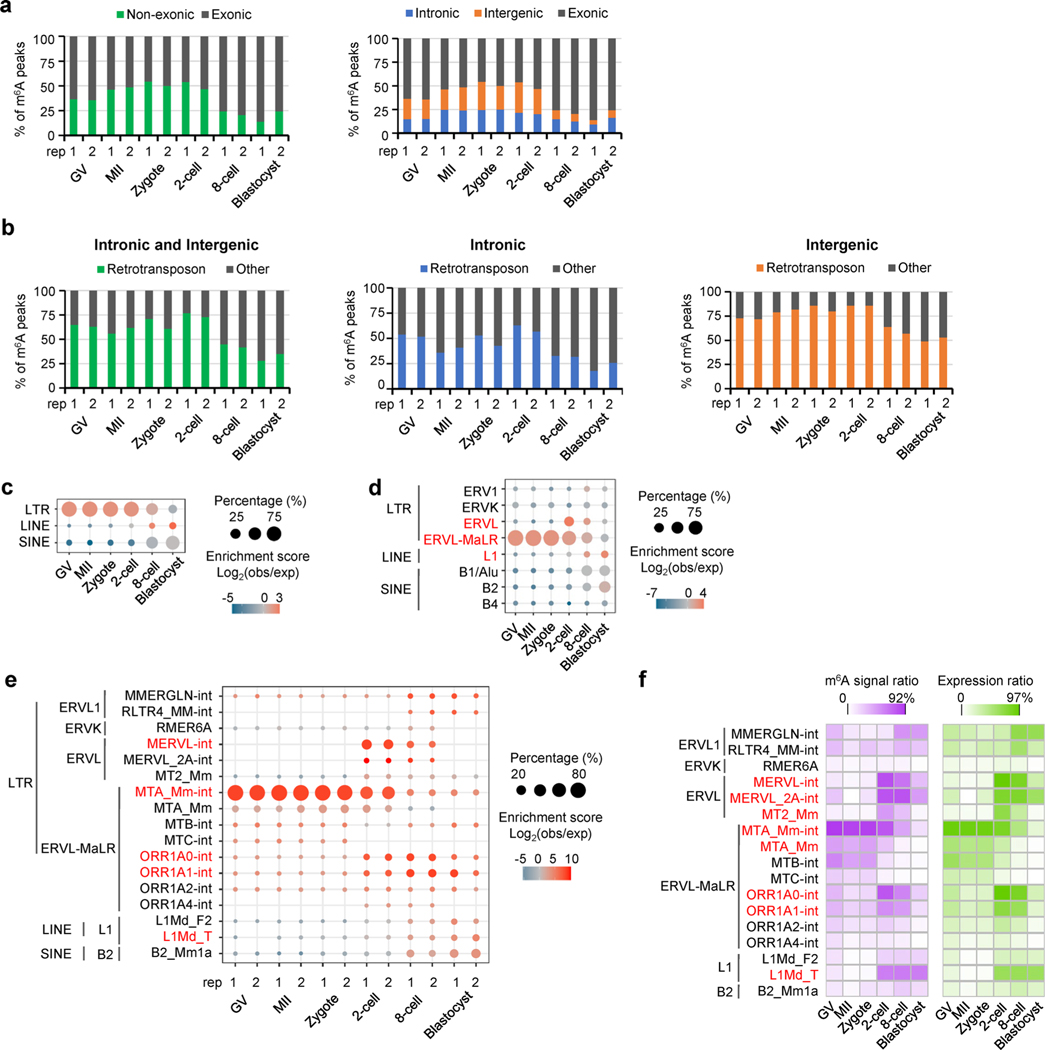
Nearly half of the mouse genome is composed of transposable elements, the majority of which are long-terminal repeat (LTR), long interspersed nuclear element (LINE) and short interspersed nuclear element (SINE) retrotransposons23. Some evolutionarily young retrotransposons have been shown to be expressed in early embryos, as well as in germ cells, neurons and tumor cells23. Especially in mouse oocytes and early embryos, a group of LTR retrotransposons are highly expressed, including murine endogenous retroviral elements termed MERVL (also known as MuERV-L) and mammalian apparent LTR retrotransposons (ERVL-MaLRs)24. Recent evidence showed the critical roles of m6A in guarding the identity of mESCs via modulating retrotransposon derived transcripts25–28. In our data, we indeed found that ~50% of m6A peaks identified in the MII, zygote and two-cell stages located to intronic and intergenic regions (Extended Data Fig. 5a), and >50% of those peaks overlapped with retrotransposon loci (Extended Data Fig. 5b).
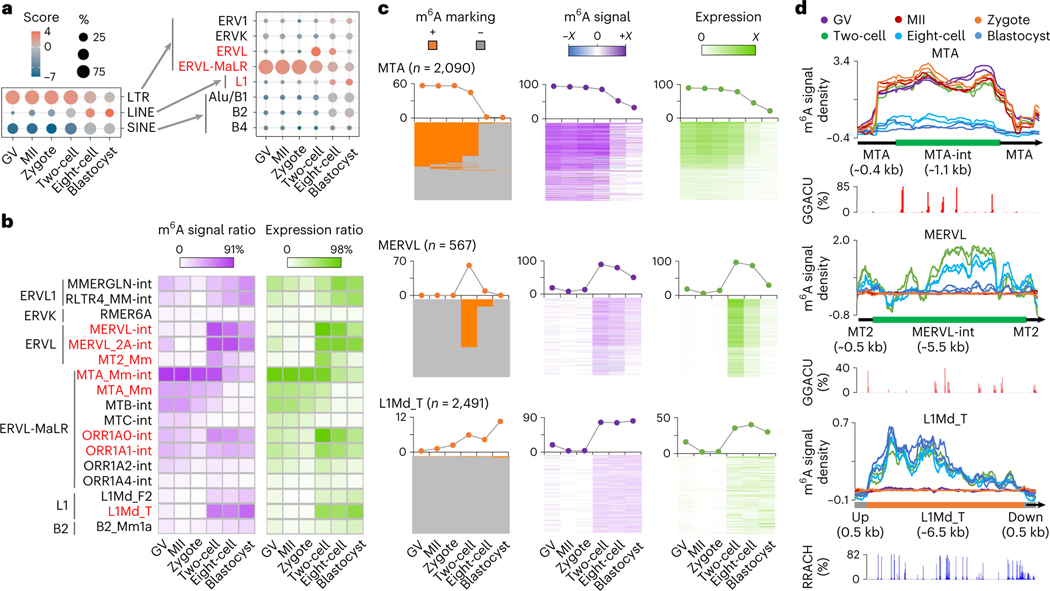
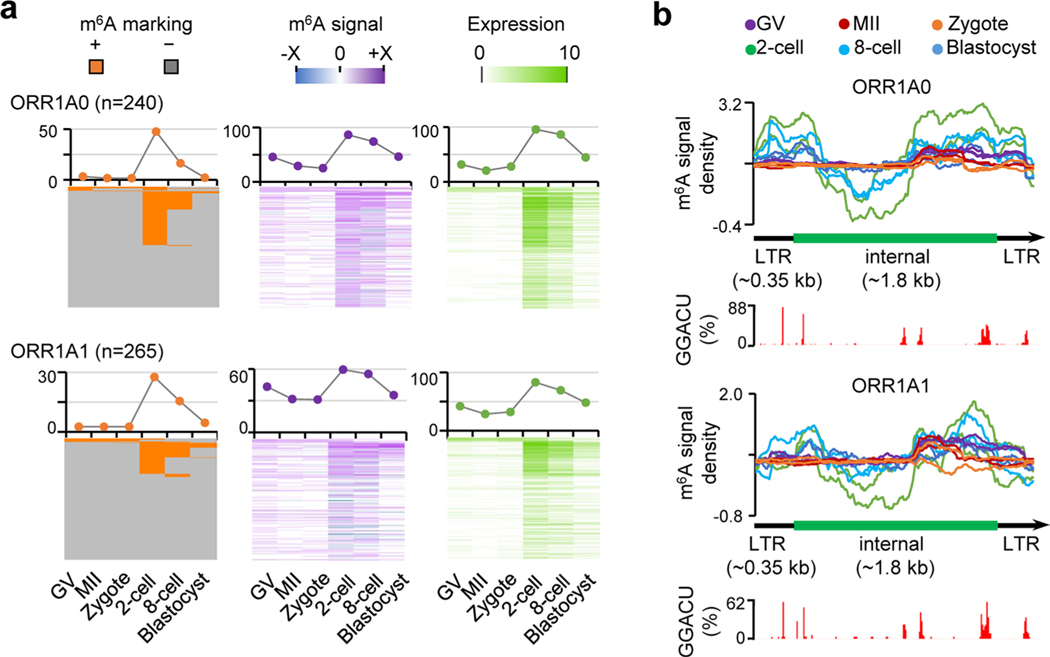
By examining the dynamics of m6A in retrotransposons over the course of development from oocyte to early embryo, we identified that LTR had a higher tendency of m6A marking before eight-cell stage (Fig. 4a and Extended Data Fig. 5c). Most m6A-marked retrotransposons were from five subfamilies of three retrotransposon families: MTA, ORR1A0 and ORR1A1 of ERVL-MaLR; MERVL of ERVL; L1Md_T of L1/LINE-1 (Fig. 4a and Extended Data Fig. 5d,e). To obtain more quantitative assessment, we further computed m6A signal score (that is, the log2 ratio of MeRIP versus Input; the bigger the value, the stronger the m6A modification) for each full-length genomic locus/copy of all retrotransposon subfamilies. The expression profile, m6A marking status and m6A signal score for all retrotransposon loci are summarized in Supplementary Table 5. At the subfamily level, MTA showed the strongest m6A enrichment in oocytes and zygotes (Fig. 4b and Extended Data Fig. 5f). Of the MTA loci, >50% overlapped with m6A peaks, and ~91% had positive m6A signal scores in oocytes, zygotes and two-cell embryos (Fig. 4c). MERVL, which is associated with ZGA24, was highly expressed and showed the most abundant m6A enrichment in two-cell embryos, with 61% of loci overlapping with m6A peaks and 89% of loci showing positive m6A signal scores. Similar to a recent observation in mESCs29, m6A was detectable on L1Md_T-derived RNAs in two-cell, eight-cell and blastocyst embryos. In addition, ORR1A0 and ORR1A1, transcriptionally enhanced at the two-cell stage, were also occupied by m6A (Fig. 4b and Extended Data Figs. 5e and 6a).
Fig. 4 |. m6A deposition on retrotransposon-derived RNAs.
a, Relative enrichment of m6A peaks (identified in biological replicate 1) in eight major families from three types of retrotransposon. The enrichment score was calculated as the log2 ratio of the observed over expected peak numbers. b, Heat map plots showing the ratios of genomic copies/loci with >0 m6A signal score (MeRIP versus Input) and >0 expression value (RPKM), respectively (calculated using biological replicate 1), for representative retrotransposon subfamilies. c, m6A marking status, m6A signal and expression profiles across the loci of MTA, MERVL and L1Md_T. For MTA and MERVL, only the internal sequences were considered. The line plots above the heat maps show the percentages of loci with m6A+ (that is, overlap with m6A peaks, left), >0 m6A signal value (middle), >0 expression value (right), respectively. Color range of m6A signal: MTA, −4.9 to 7.2; MERVL, −0.7 to 3.9; L1Md_T, −1.1 to 1.8. Color range of expression (that is, averaged log2(RPKM)): MTA, 0 to 12; MERVL, 0 to 8; L1Md_T, 0 to 2. d, m6A signal density pileups along the full-length MTA, MERVL and L1Md_T loci. The lower bar plots show the frequency (bin size 10 bp) of GGACU or RRACH motifs across all loci along the full-length structure.
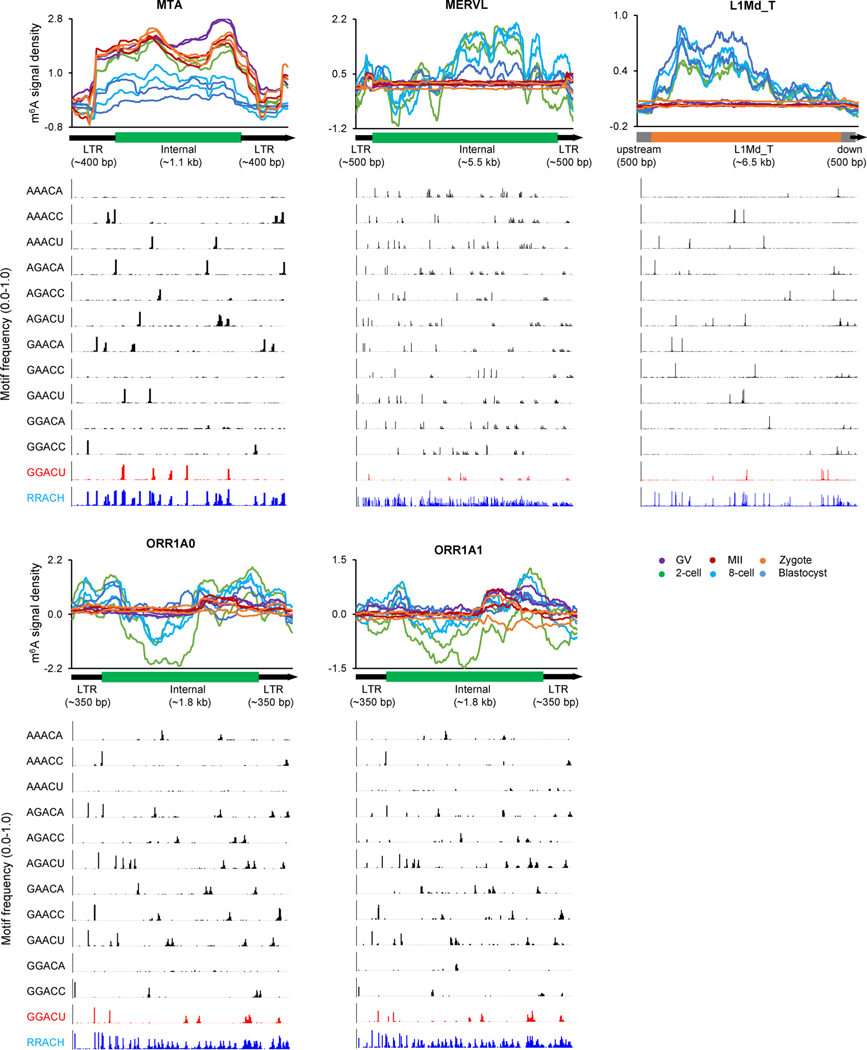
Furthermore, we discovered a relatively uniform distribution of m6A along the entire transcribed MTA sequences, in contrast to a remarkable position preference of m6A occupancy on MERVL, L1Md_T, ORR1A0 and ORR1A1 (Fig. 4d and Extended Data Fig. 6b). Considering the existing computational challenge of extensive multiple alignment in highly repetitive genomic regions30, we applied a random assessment strategy for multiply aligned reads as described previously26–28, and obtained the same m6A distribution patterns (Extended Data Fig. 7) as the one using only uniquely aligned reads (Fig. 4d and Extended Data Fig. 6b). Therefore, we could confirm the identified m6A distribution even when considering the noise of multiply aligned reads. In addition, the GGACU motif frequently appeared in the m6A-enriched regions for MTA, MERVL, ORR1A0 and ORR1A1; and the RRACU motifs were abundant along the entire sequences of all five retrotransposon subfamilies (Fig. 4d and Extended Data Figs. 6b and 7).
Discussion
In conclusion, we have demonstrated that m6A is widespread in the transcriptomes of mouse oocytes and early embryos. Specifically, the pronounced m6A deposition on gene transcripts involved in the transcriptional regulation suggests a potential regulatory layer of m6A at a transcriptional level. Although the importance of miRNAs for RNA degradation in mammalian early embryonic development is still controversial22,31,32, the co-occupancy of m6A and miRNAs on both maternally loaded transcripts and zygotically activated transcripts observed in our data may provide a clue for future investigations on their interplay in mouse early embryonic development via regulation of some key processes, such as RNA stability, localization and translation. The effect of m6A on the turnover of retrotransposon-derived transcripts abundant in oocytes and early embryos needs to be further addressed in future studies. The transcriptome-wide m6A landscapes of mammalian oocytes and early embryos in this study have filled a pronounced gap in the field. We hope that this will benefit future functional studies of the m6A modification in mammalian embryonic development.
Online content
Any methods, additional references, Nature Portfolio reporting summaries, source data, extended data, supplementary information, acknowledgements, peer review information; details of author contributions and competing interests; and statements of data and code availability are available at https://doi.org/10.1038/s41594–023-00969-x.
Methods
Data reporting
No statistical methods were used to predetermine the sample size. The experiments were not randomized, and the investigators were not blinded to allocation during experiments and outcome assessment.
Ethics statement
Mouse experiments were approved by the Animal Research Committee of the Norwegian Food Safety Authority (NFSA; the NFSA IDs for approved applications were FOTS IDs #10898 and #24911). Animal experimental procedures conformed to the ARRIVE guidelines and ethical guidelines in Directive 2010/63/EU of the European Parliament on the protection of animals used for scientific purposes.
Mouse oocyte and embryo collection
Mice were housed with a 12 h light/dark cycle (light: 7:00 to 19:00), with 55% relative humidity at 22 °C, and with free access to food and water. The presence of pathogens was monitored quarterly according to the Federation of European Laboratory Animal Science Associations (FELASA) guidelines. Animals were regarded as specific pathogen free according to FELASA recommendations (SPF status).
For GV oocytes, 8-week-old C57BL6/N females were injected with 5 international unit (IU) of pregnant mare serum gonadotropin (PMSG), and oocytes were isolated by puncturing the follicles of dissected ovaries at 48 h after PMSG injection. The isolation was performed at 37 °C in M2 medium with 0.2 mM cyclic nucleotide phosphodiesterase inhibitor 3-isobutyl-1-methylxanthine (Sigma) added to prevent the oocytes from undergoing GV breakdown. Cumulus cells were removed by gentle pipetting. Next, from the collection of GV oocytes, surrounded nucleolus (SN) stage oocytes were microscopically selected by looking for the presence of a perivitelline space (a gap between the oolemma and the zona pellucida) within 1 h of in vitro culture with 3-isobutyl-1-methylxanthine. The SN stage oocytes were then exposed to acidic Tyrode’s solution (pH 2.5, Sigma) for a few seconds to remove the zona pellucida. Three washes in M2 medium followed, before the SN oocytes were manually transferred into the same tube with 12 μl 1× Lysis buffer (Takara).
For MII oocytes, 8-week-old C57BL6/N females were injected with 5 IU of PMSG followed by injecting 5 IU of human chorionic gonadotropin (hCG) 45 h later. MII oocytes with cumulus mass were released from the oviduct ampullae 14 h after hCG injection. Cumulus cells were dispersed by 0.3 mg ml−1 hyaluronidase in M2 medium. Oocytes were exposed to acidic Tyrode’s solution for a few seconds to remove the zona pellucida followed by three washes in M2 medium. The oocytes were then manually picked and transferred into 12 μl 1× Lysis buffer.
For embryos, 8-week-old female mice were superovulated (5 IU PMSG followed by 5 IU hCG 45 h later), and mated with 8-week-old male mice. Embryos at a particular stage were flushed from the reproductive tract at defined time periods after hCG administration: 27–28 h (zygote), 39–43 h (two-cell), 68–70 h (eight-cell) and 92–94 h (blastocyst) in HEPES-buffered CZB medium. Embryos were transferred to acidic Tyrode’s solution for a few seconds to remove the zona pellucida followed by three washes in M2 medium. The embryos were then manually picked and sorted into 12 μl 1× Lysis buffer. All the collected samples were snap-frozen by dipping the bottom of the sample tubes in liquid nitrogen and then stored at −80 °C until further use.
The numbers of oocytes and embryos used for picoMeRIP-seq experiments are summarized in Extended Data Table 1.
m6A immunofluorescence
Oocytes and embryos were exposed to acidic Tyrode solution for a few seconds to remove the zona pellucida, followed by three washes in M2 medium. Samples were then fixed in 4% paraformaldehyde in phosphate-buffered saline for 30 min, and permeabilized in 0.5% Triton X-100 for 2 h at room temperature. Samples were blocked with 1% bovine serum albumin for 1 h, and incubated with m6A antibody (Abcam, ab208577, 1:200) overnight at 4 °C. Samples were labeled with secondary antibody (Alexa Fluor 488 AffiniPure Donkey Anti-Mouse, Jackson 715–545-151, 1:500) for 1 h. DNA was stained with DAPI (Roche, 5 μg ml−1) for 10 min. After staining and washing, samples were mounted on glass slides using Vectashield mounting medium (Vector Labs) and examined with a confocal laser-scanning microscope (Nikon). Images were analyzed with NIS-Element AR 3.0 software.
picoMeRIP-seq experiment
One-tube rRNA and DNA depletion.
picoMeRIP-seq was carried out as described (manuscript in preparation) with some modifications. To deplete rRNA, we used the NEBNext rRNA Depletion Kit (NEB) according to the user manual with minor modifications: add 3 μl RNA/probe master mix to a 12 μl sample; place samples in a thermocycler at 95 °C for 2 min and then gradually ramp the temperature (−0.1 °C s−1) to 22 °C, hold samples at 22 °C for 5 min; add 5 μl RNase H reaction mix to the samples immediately, incubate at 37 °C for 30 min and then place on ice. Then, to remove DNA, 30 μl DNase I digestion mix was added to the samples and incubated at 37 °C for 30 min. Samples were purified with 2.2× volume of RNAClean XP beads. Freshly prepared ethanol (80%) was used to wash the samples twice. After rRNA and DNA depletion, the RNA was eluted from the beads with 78 μl nuclease-free water (Thermo Fisher Scientific). Then, 2 μl RiboLock RNase inhibitor (40 U/ μl) was added to the samples.
RNA shearing by sonication.
The samples were sonicated for 2.5 × 30 sec using a UP100H Ultrasonic Processor (Hielscher) fitted with a 2-mm probe using pulse settings with 0.5 sec cycles and 27% power. Each sonication cycle was 30 seconds sonication plus 30 seconds on ice. After sonication, 7 μl was taken for regular RNA-seq sequencing as Input control, and the remaining 73 μl was subjected to immunoprecipitation. After that, 7 μl nuclease-free water and 20 μl 5× IP buffer (50 mM Tris–HCl pH 7.5, 750 mM NaCl, 0.5% (vol/vol) NP-40 and 5 U μl−1 RiboLock RNase inhibitor) were added to the 73 μl samples. The final volume was 100 μl.
IP and washes.
Dynabeads (30 μl, Invitrogen) were washed with 1× IP buffer (200 μl 5× IP buffer with 800 μl nuclease-free water) twice. Premixed antibody mix (4 μl m6A antibody (Millipore, ABE572), 16 μl 5× IP buffer and 60 μl nuclease-free water) was added to the washed beads, and the samples were incubated with rotation on a HulaMixer at 4 °C overnight.
Preincubated antibody–bead complexes were washed in 200 μl 1× IP buffer by vortexing. A second wash was performed by adding 200 μl 1× IP buffer, vortexing briefly, aliquoting 10 μl into PCR tubes for each sample, pulse spinning and placing tubes back to a magnet until the solution was clear. Supernatants were discarded, and sonicated RNA mix (100 μl) was added to the antibody–bead complex. The samples were incubated with rotation on a HulaMixer at 4 °C for 2 h. After incubation, the supernatants were removed. The beads were washed four times in order with the following buffers: first-round wash with cold medium RIPA buffer (10 mM Tris–HCl, pH 8.0, 300 mM NaCl, 1 mM EDTA, 0.5 mM EGTA, 1% (vol/vol) Triton X-100, 0.2% (vol/vol) SDS and 0.1% (vol/vol) Na-deoxycholate); second- and third-round washes with cold stringent RIPA buffer (10 mM Tris–HCl, pH 8.0, 350 mM NaCl, 1 mM EDTA, 0.5 mM EGTA, 1% (vol/vol) Triton X-100, 0.23% (vol/vol) SDS and 0.1% (vol/vol) Na-deoxycholate); last-round wash with cold medium RIPA buffer. After four washes, the beads were resuspended in 100 μl 1× IP buffer to recover for 5 min. The samples were placed on a magnet, and the supernatants were removed. The pellet was resuspended in 147.9 μl Elution buffer (5 mM Tris–HCl, pH 7.5, 1 mM EDTA, 0.05% (vol/vol) SDS and 1 U μl−1 RiboLock RNase inhibitor). After adding 2.1 μl Proteinase K (NEB), the samples were immediately put in a Thermomixer at 1,200 r.p.m., 55 °C for 1.5 h. After incubation, the enzyme was inactivated through briefly spinning the tubes and incubating in a Thermomixer at 80 °C for 20 min. After inactivation, the samples were placed on a magnet for 2–3 min. The supernatant (~150 μl) containing the immunoprecipitated RNA was transferred into a new 1.5 ml low-binding tube. We further resuspended the beads in 147.9 μl Elution buffer; added 2.1 μl of Proteinase K and placed immediately in a Thermomixer at 1,200 r.p.m., 55 °C for 5 min and then at 80 °C for 20 min; placed back on a magnet for 2–3 min; and transferred the supernatant (~150 μl) to the previous 1.5 ml low-binding tube to pool both volumes together, yielding approximately 300 μl.
Ethanol precipitation.
An appropriate volume of nuclease-free water (~100 μl) was added to the immunoprecipitated RNA to a final volume of 400 μl, followed by adding 40 μl 3 M sodium acetate pH 5.2 (Thermo Fisher Scientific), 10 μl linear acrylamide 5 mg μl−1 (Thermo Fisher Scientific) and 1,000 μl ice-cold 100% ethanol in order. Samples were heavily vortexed and incubated immediately at −80 °C for at least 2 h until completely frozen. After centrifugation at 20,000g at 4 °C for 15 min, the supernatant was carefully removed without disrupting the pellet. The pellet was washed twice with 1 ml ice-cold 75% ethanol and resuspended in 7 μl nuclease-free water.
Library preparation and sequencing.
For both Input and immune-precipitated (MeRIP) samples, the SMART-Seq Stranded Kit (Takara) was used to prepare a library according to the manufacturer’s protocol with some modifications. The Option 2 protocol was followed without fragmentation for highly fragmented RNA. After PCR1 amplification and AMPure bead purification, 46.5 μl nuclease-free water was added to the beads, the ribosomal complementary DNA depletion protocol was skipped in Section D, and the tubes were removed from the magnetic rack and mixed thoroughly by vortexing to resuspend the beads. The sample was incubated at room temperature for 5 min to rehydrate and recover 46 μl of sample. Then, we followed the protocol until sequencing. Libraries were quantified with KAPA Library Quantification Kits (Roche), and the size distribution was checked using TapeStation D1000 ScreenTape (Agilent Technologies). The equally pooled libraries were sequenced using a NovaSeq system (Illumina) in 100 bp paired-end mode.
picoMeRIP-seq data processing and m6A peak calling Quality control, alignment and reads processing.
Quality assessment of raw sequencing reads (both Input and MeRIP samples) was performed using FastQC (v0.11.8) (https://www.bioinformatics.babraham.ac.uk/projects/fastqc/), and sequencing adapters and low-quality bases were trimmed using Cutadapt (v1.8.1) (ref. 33) with the parameter ‘-q 20,20 -m 20–max-n 0.01 –trim-n’. Trimmed reads were aligned to the mouse reference genome (mm10) using HISAT2 (v2.1.0) (ref. 34) with the parameter ‘−5 8 –no-mixed –no-discordant’. Only the uniquely aligned reads (that is, only one genomic position per read pair was reported by HISAT2) were retained, PCR duplicates were removed using SAMtools (v1.9) (ref. 35) fixmate & markdup, and the reads mapped to rRNAs (annotated by GENCODE vM23) were removed using BEDTools (v2.28.0) (ref. 36) intersect.
Quantification of genes and gene transcripts/isoforms by Input samples.
StringTie (v1.3.5) (ref. 37) with the parameter ‘-e -A’ was used to quantify the expression level (TPM) of genes and gene transcripts/ isoforms on the basis of the Input samples and GENCODE (vM23) gene annotation library. The R package NormExpression (v0.1.0) (ref. 38) was used to calculate the normalization factor (method = ’DESeq’), and then the expression values across 12 Input samples (2 biological replicates of each of 6 developmental stages) were normalized using the DESeq (that is, geometric)39 normalization factor.
Definition of m6A signal.
After removing multiply aligned read pairs and PCR duplicated read pairs, the genome coverage bigWig files (bin size = 10 bp, normalized by reads per kilobase per million reads (RPKM)) were generated by deepTools (v3.2.0) (ref. 40) bamCoverage with the parameter ‘-bs 10 –normalizeUsing RPKM’. The visualization of read density along exonic regions of genes was based on these bigWig files. For each gene, the exonic regions of the transcript/isoform with highest expression value was used to visualize the read density (Figs. 1b, 2e and 3b and Extended Data Fig. 2), and detailed information is summarized in Extended Data Table 2.
For each bin (size = 10 bp), the m6A signal was calculated as the log2 ratio of (MeRIP’s RPKM value +1) over (Input’s RPKM value +1).
Pearson’s correlation and PCA analyses.
Pearson’s correlation (Extended Data Fig. 1b) and PCA (Fig. 1c) analyses were performed using deepTools multiBigwigSummary (‘bins’ mode and window size = 1 kb) & plotCorrelation & plotPCA.
Peak calling.
m6A peaks were called using MACS2 (v2.1.2) (ref. 41) callpeak with the parameter ‘-g 242010196 –keep-dup all -B –nomodel –call-summits’. Only the peaks with q value <0.05 were used for the following analyses.
Peak annotation, metagene profiling and motif search
Peak annotation (Fig. 1f and Extended Data Fig. 1d) was performed using BEDTools based on the GENCODE (vM23) annotation library. Considering that a peak (using only the genomic coordinate of peak summit, length = 1 bp) might be assigned to >1 genic feature, a peak was only allowed to have one genic feature with the order of priority as follows: stop codon (ranging from the upstream 200 bp to downstream 200 bp surrounding the annotated stop codon), 3′ untranslated region (UTR), 5′ UTR, coding sequence, exon, intron and intergenic.
Metagene profiles of m6A peak summits were generated using MetaPlotR42, and only the concatenated exonic regions of the transcript/isoform with the highest expression value per gene were used for plotting (Fig. 1e).
Consensus motifs of m6A peaks (the region ranging from 200 bp upstream to 200 bp downstream of the peak summits located at the stop codon and 3′ UTR) were analyzed using Homer (v4.11.1) (ref. 43) findMotifsGenome.pl with the parameter ‘-rna -len 5,6,7,8’ (Fig. 1g and Extended Data Fig. 1e). Only the peaks with q value <10−10 were used for motif search.
Definition of m6A gene
The gene was defined as an m6A+ gene if any of its gene transcripts/ isoforms overlapped with ≥1 m6A peaks; otherwise, the gene was considered as m6A− gene. Considering that we had two biological replicates per developmental stage, for m6A+ gene definition in each developmental stage, we defined it as m6A+ if the gene was m6A+ in any of two biological replicates (Figs. 2–4 and Extended Data Figs. 1c, 3 and 4).
Identification of developmental stage-specifically expressed genes
As described in previous studies44,45, a Shannon entropy-based method was used to identify stage-specifically expressed genes. On the basis of gene expression, the entropy specificity was calculated using the R package BioQC (v1.10.0) (ref. 46), and only the genes with ≥0.5 entropy specificity scores were used to define stage-specifically expressed genes.
A gene was defined as a single-stage specifically expressed gene if (1) its TPM value was ≥10 and (2) the expression fold changes (this stage versus any of the other five stages) were ≥2. A gene was defined as a multiple-stage specifically expressed gene if (1) its TPM values were ≥10 in any of these stages; (2) the expression fold changes (any of these stages versus any of other stages) were ≥2; and (3) the expression fold changes (between any two of these stages) were <2.
For a stage-specifically expressed gene, it was considered m6A+ if its m6A status was m6A+ in ≥1 stage where the gene was specifically expressed (Fig. 2f,g).
Transcription factor annotation
The annotation of mouse transcription factors was obtained from the database AnimalTFDB347. Only the transcription factors with the TPM ≥10 at ≥1 developmental stage were used to analyze their m6A marking status (Fig. 2f,h).
Definition of M-decay, Z-decay, C-decay and ZGA genes
As described in a previous study19, we defined M-decay, Z-decay and C-decay genes (Fig. 3 and Extended Data Fig. 3).
M-decay gene: (1) the TPM was >10 in GV oocyte; (2) the expression fold change of GV oocyte versus zygote was >2; and (3) the expression fold change of zygote versus two-cell was <2.
Z-decay gene: (1) the TPM was >10 in GV oocyte; (2) the expression fold change of GV oocyte versus zygote was >1; (3) the expression fold change of GV oocyte versus zygote was <2; and (4) the expression fold change of zygote versus two-cell was >2.
C-decay gene: (1) the TPM was >10 in GV oocyte; (2) the expression fold change of GV oocyte versus zygote was >2; and (3) the expression fold change of zygote versus two-cell was >2.
Decay genes were the combination of M-decay, Z-decay and C-decay.
ZGA gene was defined as follows: (1) TPM >10 in two-cell; (2) TPM <1 in both GV oocyte and MII oocyte.
Decay genes were considered m6A+ if they were m6A marked at either GV oocyte or MII oocyte stages. ZGA genes were considered m6A+ if they were m6A marked at the two-cell stage.
Differential gene expression analyses in Ythdf2 knockout versus wild type GV oocytes
The processed data, where differential gene expression analyses have been identified, from the study18 were downloaded from Gene Expression Omnibus (GEO; dataset accession number GSE147849; for detailed data processing protocol, see accession number GSM4447069). The differentially expressed genes between knockout versus wild type were identified with an adjusted P value <0.05 and fold change of expression >2.
GO enrichment analyses
GO enrichment analyses were performed using DAVID (v6.8) (ref. 48).
miRNA analyses
The miRNA expression profiles were obtained from Supplementary Dataset 1 (https://www.science.org/doi/suppl/10.1126/sciadv.1501482/suppl_file/supplementary_dataset_1.xlsx) of a previous study22. The expression values (RPM, reads per million) of miRNAs in MII oocyte and one-cell (zygote), two-cell and eight-cell embryos were extracted. As suggested in the study22, to minimize the false-positive prediction of miRNA targets, only the miRNAs that belong to conserved miRNA families and are highly expressed (RPM ≥10) were used for target gene prediction. Only the conserved gene targets of the conserved miRNAs were considered on the basis of the miRNA and target gene annotations from TargetScan (v7.1) (ref. 49). A given gene can be targeted/ regulated by multiple different miRNAs. For a gene in a given condition (for example, Decay and ZGA), we considered it a miRNA-targeted gene if it was predicted as the target of ≥1 miRNA, and we then counted the number of regulated miRNAs and the weighted number (that is, the sum of log10(RPM) of all targeted miRNAs) of regulated miRNAs. To determine whether the gene was miRNA targeted, we used miRNA expression at the MII oocyte stage for Decay (including M-decay, Z-decay and C-decay), and the two-cell stage for ZGA (Fig. 2d–g and Extended Data Fig. 3).
Retrotransposon analyses
Retrotransposon annotation library.
We extracted the retrotransposon annotation using UCSC Table Browser with the setting ‘clade = Mammal, genome = Mouse, assembly = GRCm38/mm10, group = Variation and Repeats, track = RepeatMasker, table = rmsk’ on 5 March 2021. In mouse, retrotransposons are grouped into 3 major types/classes (LTR, LINE and SINE), 19 families (6 for LTR, 6 for LINE and 7 for SINE) and 861 subfamilies (667 for LTR, 157 for LINE and 37 for SINE). To minimize the effect of highly fragmented/truncated retrotransposon copies/loci that lack transcription and transposition activities50, we considered only the relatively complete retrotransposon genomic loci/copies with ≥90% completeness that was defined as the length ratio of annotated retrotransposon sequences in the mouse genome over the full-length reference sequence. To avoid the effect of the expression of regular genes on retrotransposon analyses, we considered only the retrotransposon genomic loci/copies having <50% overlap ratio with exonic regions of regular genes (annotated by GENCODE vM23).
m6A enrichment at the locus/copy, subfamily, family and class/type levels.
For a given retrotransposon locus/copy: (1) its expression value was calculated as the mean RPKM value (Input sample) across all bins (size = 10 bp) overlapping with this locus; (2) its m6A marking status was defined as m6A+ if it overlapped with m6A peak summits called by MACS2; and (3) its m6A signal value was calculated as the mean m6A signal value across all bins (size = 10 bp) overlapping with this locus (see ‘Definition of m6A signal’ under the section ‘picoMeRIP-seq data processing and m6A peak calling’). For each stage, the relatively greater value (expression or m6A signal) across two biological replicates was assigned to this locus; the locus in this stage was considered as m6A+ if it overlapped with m6A peak summits identified by any of two biological replicates.
The ratio of m6A+ loci for each class/type (Fig. 4a and Extended Data Fig. 5c), family (Fig. 4a and Extended Data Fig. 5d) and subfamily (Extended Data Fig. 5e) was calculated. The enrichment score was calculated as the log2 ratio of the observed over expected peak numbers. For each subfamily, the ratio of expressed loci/copies (>0 expression value) and the ratio of the loci/copies with >0 m6A signal value were calculated (Fig. 4b and Extended Data Fig. 5f).
Analyses of MTA, MERVL, ORR1A0, ORR1A1 and L1Md_T.
For the analyses of the m6A locus, m6A signal and expression (Fig. 4c and Extended Data Fig. 6a), we considered only the internal sequences for MTA (MTA_Mm-int), MERVL (MERVL-int), ORR1A0 (ORR1A0-int) and ORR1A1 (ORR1A0-int).
For m6A signal density pileup plots (Fig. 4d and Extended Data Figs. 6b and 7), we used the full-length structure (including both the internal sequence and two flanking LTR sequences for each locus/copy) for MTA (MTA_Mm-int and MTA_Mm), MERVL (MERVL-int and MT2_Mm), ORR1A0 (ORR1A0-int and ORR1A0) and ORR1A1 (ORR1A0-int and ORR1A0). Considering that there is no intron-like structure in these full-length retrotransposon loci and the sequencing data are paired-end in this study, for better visualization, the bigWig files used for plotting metagene profiles were generated by deepTools bamCoverage with the parameter ‘-bs 10–normalizeUsing RPKM -e 200’ where the read mates were extended to match the fragment size.
To generate m6A signal density pileup plots using randomly assigned reads (Extended Data Fig. 7), as described in previous studies26–28, we first randomly assigned a genomic locus for the multiply aligned read pairs (as reported by HISAT2), and then followed the same data processing procedures as the strategy (that is, using only uniquely aligned reads).
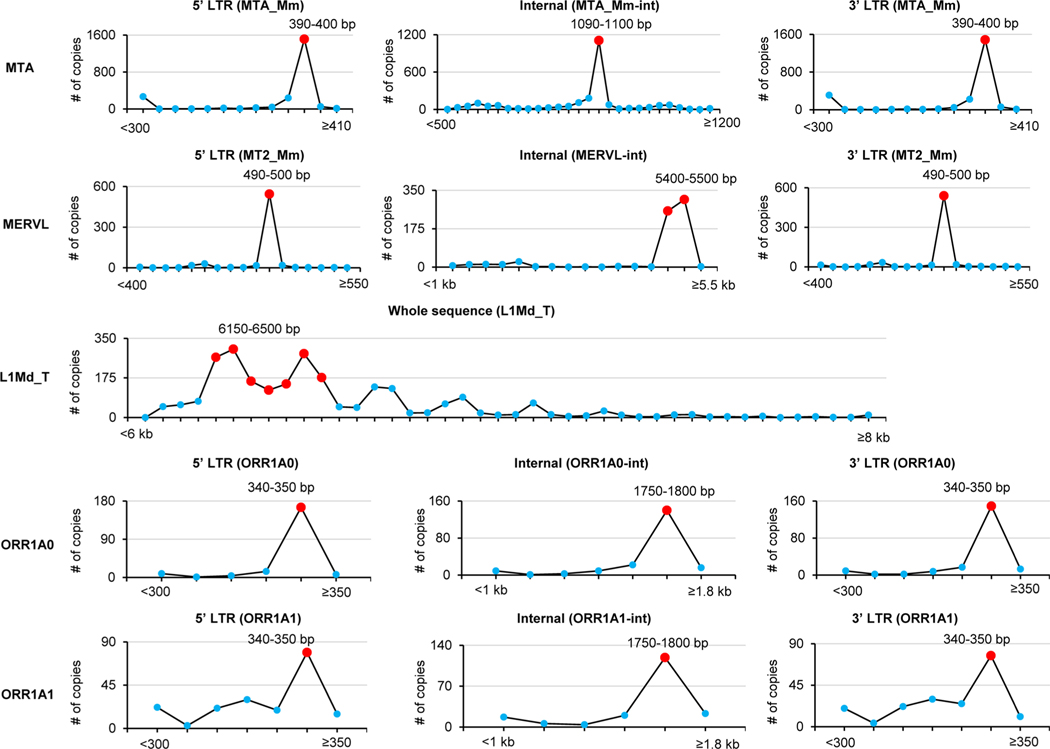
For the statistics of the RRACH motifs (Fig. 4d and Extended Data Figs. 6b and 7), considering that the lengths of different loci/copies of each subfamily were variable, we used only the loci/copies where the lengths of both internal sequences and flanking LTR sequences were relatively frequent among all loci/copies (see Extended Data Fig. 8, bar plots showing the length frequency across the full-length retrotransposon). In detail, we required:
For MTA, the length of internal MTA_Mm-int was ≥1,090 bp and ≤1,100 bp, and the lengths of flanking MTA_Mm were ≥380 bp and ≤400 bp;
For MERVL, the length of internal MERVL-int was ≥5,400 bp and ≤5,500 bp, and the lengths of flanking MT2_Mm were ≥490 bp and ≤500 bp;
For ORR1A0, the length of internal ORR1A0-int was ≥1,750 bp and ≤1,800 bp, and the length of flanking ORR1A0 was ≥340 bp and ≤350 bp;
For ORR1A1, the length of internal ORR1A1-int was ≥1,750 bp and ≤1,800 bp, and the length of flanking ORR1A1 was ≥340 bp and ≤350 bp;
For L1Md_T, the length was ≥6,150 bp and ≤6,500 bp.
Reporting summary
Further information on research design is available in the Nature Portfolio Reporting Summary linked to this article.
Data availability
All picoMeRIP-seq data generated in this study are available in GEO with accession number GSE192440. The differentially expressed genes (Ythdf2 knockout versus wild-type GV oocytes) were obtained from GEO (GSE147849). The expression values of miRNAs in mouse MII oocyte, and one-cell (zygote), two-cell and eight-cell embryos were obtained from the Supplementary Dataset 1 of a previous study22.
Code availability
The scripts of major analysis modules in this study (including quality control, alignment, reads filtering, gene expression quantification, peak calling and motif search) are packaged into a bioinformatics pipeline called MeRipBox. MeRipBox is publicly available at GitHub, at the following address: https://github.com/Augroup/MeRipBox.
Extended Data
Extended Data Fig. 1 |. picoMeRIP-seq pipeline and m6A profiles in mouse oocytes and preimplantation embryos.
(a) Workflow of picoMeRIP-seq, created with BioRender.com. (b) Pearson correlation analyses between two biological replicates of 6 stages. (c) Overlap analysis of m6A marked genes between two biological replicates. (d) Bubble plot showing the relative enrichment in different genomic features. For each feature, the enrichment score was calculated as the log2 ratio of the observed over expected peak numbers. (e) Consensus motifs identified using the peaks called in the biological replicate 2.
Extended Data Fig. 2 |. m6A profiles of repetitive stage-specifically expressed genes and key regulators for development of mouse preimplantation embryos.
(a) picoMeRIP-seq read density in exonic regions of stage-specifically expressed genes identified in Fig. 2d. (b) picoMeRIP-seq read density in exonic regions of key genes essential for mouse early embryonic development (listed in Fig. 2i). The sample-specific scale ranges are indicated in brackets with the corresponding colors.
Extended Data Fig. 3 |. GO analyses of m6A + and m6A − genes in Decay and ZGA genes identified in Fig. 3a, b.
Fisher’s exact test was used to calculate the one-sided P values. Only the GO terms with P value <0.05 are shown.
Extended Data Fig. 4 |. m6A marking and miRNA targeting profiles on imprinted genes.
Gene expression, m6A marking, miRNA targeting, number of miRNAs per gene, normalized number of miRNAs per gene in paternally- (upper panel) and maternally- (lower panel) expressed imprinted genes. For a given gene, the normalized number of miRNAs (last column, purple colored heat maps) is the sum of expression values of all miRNAs targeting this gene, where the expression value is log10 (RPM + 1). RPM, reads per million.
Extended Data Fig. 5 |. Abundant enrichment of m6A on retrotransposon-derived RNAs in mouse oocytes and early embryos.
(a) Percentage of m6A peaks overlapping with the non-exonic regions of annotated genes in GENCODE vM23 (left panel), including both intronic and intergenic regions (right panel). (b) Percentage of non-exonic m6A peaks overlapping with retrotransposons, considering both intronic and intergenic m6A peaks (left panel), intronic only (middle panel) and intergenic only (right panel). (c) Bubble plot showing the significant enrichment of m6A peaks in LTR (for GV, MII, zygote and 2-cell) and LINE (for 8-cell and blastocyst). For each of three types of retrotransposons, the enrichment score is calculated as the log2 ratio of the observed over expected peak numbers. Only the biological replicate 2 for each stage was plotted. (d) The same as in panel c, but for 8 major retrotransposon families. Only the biological replicate 2 for each stage was plotted. (e) The same as in panel c, but for representative retrotransposon subfamilies. (f) Heatmap plots showing the ratios of genomic copies/loci with >0 m6A signal score (MeRIP vs Input) and >0 expression value (RPKM), respectively (calculated using biological replicate 2), for representative retrotransposon subfamilies.
Extended Data Fig. 6 |. m6A profiles on ORR1A0 and ORR1A1 derived RNAs.
(a) m6A marking status, and m6A signal and expression profiles across the copies of ORR1A0 and ORR1A1. Only the internal sequences were considered here. The upper line plots show the percentage of copies/loci with m6A marking, >0 m6A signal value, >0 expression value. Color range of m6A signal: ORR1A0, −1.6 to 4.9, ORR1A1, −3.9 to 4.6. (b) m6A signal density pileups along the full-length ORR1A0 and ORR1A1 sequences. The lower bar plots show the frequency (bin size = 10 bp) of GGACU motif across all copies/loci along the full-length structure. See ‘Methods’ for more details.
Extended Data Fig. 7 |. m6A signal density and motif distributions along the full-length retrotransposon subfamilies.
For each of 5 subfamilies, the upper panels show m6A signal density pileups generated using the uniquelyaligned reads together with the randomly-assigned multiply-aligned reads. See ‘Methods’ for more details about the random assignment of multiply-aligned reads. The lower bar plots show the frequency (bin size = 10 bp) of RRACH motifs across all copies/loci along the full-length structure.
Extended Data Fig. 8 |. Length distribution of genomic copies of 5 subfamilies.
Statistics of lengths of all genomic copies for each subfamily. The length distributions were used as the cutoff to define the full-length MTA, MERVL and L1Md_T (Fig. 4d; Extended Data Fig. 7), as well as ORR1A0 and ORR1A1 (Extended Data Figs. 6b and 7) for plotting the m6A signal density pileups. In brief, for a given locus/copy, we defined it as full-length if the lengths of each part (5′ LTR, internal and 3′ LTR) were in the ranges indicated by the red colored balls which represent the most frequent lengths. See ‘Methods’ for more details.
Extended Data Table 1 |.
Summary of picoMeRIP-seq data
| Developmental Stage | Biological Replicate | # of oocytes or embryos | IP/Inpt | picoMeRIP-seq read pairs | |||
|---|---|---|---|---|---|---|---|
| Clean* | Aligned | Uniquely aligned | Used** | ||||
| GV oocyte | 1 | 49 | Input | 13,940,666 | 12,410,243 | 11,534,472 | 8,081,463 |
| IP | 64,772,174 | 55,156,245 | 47,354,440 | 6,599,699 | |||
| 2 | 49 | Input | 14,495,984 | 12,834,133 | 11,933,879 | 8,688,556 | |
| IP | 54,588,178 | 44,866,161 | 38,536,527 | 8,393,016 | |||
| MII oocyte | 1 | 100 | Input | 12,006,076 | 10,713,624 | 9,838,618 | 7,587,810 |
| IP | 44,916,482 | 36,251,485 | 30,205,801 | 5,947,926 | |||
| 2 | 110 | Input | 13,886,140 | 11,826,450 | 10,682,706 | 7,700,702 | |
| IP | 57,664,412 | 46,392,988 | 38,217,234 | 4,339,674 | |||
| Zygote | 1 | 100 | Input | 14,717,358 | 12,929,450 | 11,796,400 | 8,187,579 |
| IP | 50,367,925 | 40,283,164 | 33,652,477 | 2,068,664 | |||
| 2 | 100 | Input | 10,004,278 | 8,838,762 | 8,101,986 | 6,209,041 | |
| IP | 54,374,881 | 43,285,231 | 36,251,025 | 4,272,507 | |||
| 2-cell | 1 | 100 | Input | 12,947,189 | 10,565,632 | 9,350,999 | 4,752,917 |
| IP | 76,183,532 | 46,971,391 | 40,175,160 | 1,563,343 | |||
| 2 | 100 | Input | 12,221,379 | 9,544,819 | 8,486,166 | 4,616,710 | |
| IP | 48,265,377 | 37,154,826 | 31,639,346 | 2,049,945 | |||
| 8-cell | 1 | 100 | Input | 17,389,588 | 13,425,044 | 12,409,834 | 5,827,766 |
| IP | 45,397,104 | 37,069,105 | 34,088,762 | 1,616,221 | |||
| 2 | 51 | Input | 13,082,644 | 10,849,512 | 9,939,893 | 3,918,751 | |
| IP | 52,437,784 | 43,405,840 | 39,906,864 | 2,604,341 | |||
| Blastocyst | 1 | 100 | Input | 16,915,541 | 10,350,601 | 9,446,996 | 4,100,958 |
| IP | 50,412,477 | 41,518,869 | 38,740,886 | 2,316,236 | |||
| 2 | 100 | Input | 15,336,531 | 8,857,713 | 8,053,118 | 1,678,558 | |
| IP | 59,223,012 | 43,995,716 | 40,822,515 | 927,571 | |||
Read pairs after control (by FastQC) and adapter removal (by cutadapt)
Uniquely-aligned read pairs after removing PCR duplicates and ribosomal RNA-derived reads; and these reads were used for m6A peak calling by MACS2
Extended Data Table 2 |.
Summary of transcripts used for visualizing read density
| Figure | Gene name | GENCODE (vM23) | Genome coordinate (mm10) | Height on track* | Length (bp) | ||||||
|---|---|---|---|---|---|---|---|---|---|---|---|
| Gene ID | Transcript ID | Chr | Start | End | Exon | 5’UTR | CDS | 3’UTR | |||
| Fig. 1b | Ctcf | ENSMUSG00000005698.15 | ENSMUST00000005841.15 | chr8 | 105636578 | 105682922 | 5276 | 3781 | 267 | 2208 | 1306 |
| Dnmt3a | ENSMUSG00000020661.15 | ENSMUST00000020991.14 | chr12 | 3807029 | 3914443 | 11420 | 9684 | 261 | 2724 | 6699 | |
| Usp2 | ENSMUSG00000032010.15 | ENSMUST00000065461.8 | chr14 | 44084938 | 44094477 | 2056 | 249 | 1188 | 619 | 2056 | |
| Klf4 | ENSMUSG00000003032.8 | ENSMUST00000107619.2 | chr4 | 55527142 | 55532466 | 12290 | 3028 | 594 | 1449 | 985 | |
| Fig. 2e | Zscan4b | ENSMUSG00000095339.2 | ENSMUST00000168158.2 | chr7 | 10900739 | 10905050 | 1583 | 1753 | 178 | 1515 | 60 |
| Cdx2 | ENSMUSG00000029646.3 | ENSMUST00000031650.3 | chr5 | 147300804 | 147307270 | 9397 | 2260 | 287 | 933 | 1040 | |
| Nanog | ENSMUSG00000012396.12 | ENSMUST00000012540.4 | chr6 | 122707567 | 122714633 | 8879 | 2210 | 214 | 915 | 1081 | |
| Pou5f1 | ENSMUSG00000024406.16 | ENSMUST00000025271.16 | chr17 | 35506017 | 35510772 | 12160 | 1361 | 81 | 1056 | 224 | |
| Tead4 | ENSMUSG00000030353.15 | ENSMUST00000112157.3 | chr6 | 128228180 | 128300813 | 11890 | 1908 | 568 | 1152 | 188 | |
| Sox2 | ENSMUSG00000074637.7 | ENSMUST00000099151.5 | chr3 | 34650404 | 34652461 | 10340 | 2056 | 10 | 957 | 1089 | |
| Gata6 | ENSMUSG00000005836.10 | ENSMUST00000047762.9 | chr18 | 11052469 | 11085635 | 12870 | 3233 | 310 | 1767 | 1156 | |
| Fig. 3b | Glce | ENSMUSG00000032252.14 | ENSMUST00000034785.7 | chr9 | 62057247 | 62070606 | 7822 | 4625 | 5 | 1854 | 2766 |
| Tbc1d8 | ENSMUSG00000003134.10 | ENSMUST00000054462.10 | chr1 | 39371491 | 39478755 | 5271 | 4450 | 188 | 3402 | 860 | |
| Gcnt4 | ENSMUSG00000091387.2 | ENSMUST00000171324.2 | chr13 | 96924688 | 96950906 | 6518 | 5086 | 377 | 1365 | 3344 | |
| Klf9 | ENSMUSG00000033863.2 | ENSMUST00000036884.2 | chr19 | 23141225 | 23168134 | 4703 | 4485 | 528 | 732 | 3225 | |
| Peg10 | ENSMUSG00000092035.8 | ENSMUST00000176551.2 | chr6 | 4747405 | 4760517 | 5999 | 6566 | 1474 | 1812 | 3280 | |
| Jadel | ENSMUSG00000025764.14 | ENSMUST00000026865.14 | chr3 | 41555730 | 41616864 | 5962 | 5480 | 114 | 2502 | 2864 | |
| Ube3a | ENSMUSG00000025326.12 | ENSMUST00000200758.3 | chr7 | 59228801 | 59311536 | 4789 | 9855 | 636 | 2610 | 6609 | |
| Extended Data Fig. 2 | Lrrcl 7 | ENSMUSG00000039883.5 | ENSMUST00000035651.5 | chr5 | 21543562 | 21575904 | 5961 | 2153 | 278 | 1329 | 546 |
| Cdh4 | ENSMUSG00000000305.12 | ENSMUST00000000314.12 | chr2 | 179442430 | 179899373 | 805 | 6387 | 190 | 2739 | 3458 | |
| Zfp52 | ENSMUSG00000051341.6 | ENSMUST00000233281.1 | chr17 | 21535538 | 21562601 | 910 | 3163 | 453 | 2172 | 538 | |
| Slc2a3 | ENSMUSG00000003153.10 | ENSMUST00000032476.10 | chr6 | 122727808 | 122742745 | 10830 | 3958 | 354 | 1479 | 2125 | |
| Actr5 | ENSMUSG00000037761.16 | ENSMUST00000045644.8 | chr2 | 158624887 | 158639211 | 1413 | 2401 | 253 | 1824 | 324 | |
| Klf5 | ENSMUSG00000005148.8 | ENSMUST00000005279.7 | chr14 | 99298690 | 99315036 | 35260 | 3351 | 303 | 1338 | 1710 | |
| Dhx37 | ENSMUSG00000029480.13 | ENSMUST00000169485.5 | chr5 | 125413857 | 125434121 | 1652 | 4759 | 83 | 3450 | 1226 | |
| Eomes | ENSMUSG00000032446.14 | ENSMUST00000035020.14 | chr9 | 118478343 | 118486132 | 16660 | 3559 | 315 | 2121 | 1123 | |
| Gata3 | ENSMUSG00000015619.10 | ENSMUST00000102976.3 | chr2 | 9857077 | 9878600 | 35620 | 3214 | 590 | 1329 | 1295 | |
| Klf4 | ENSMUSG00000003032.8 | ENSMUST00000107619.2 | chr4 | 55527142 | 55532466 | 12290 | 3028 | 594 | 1449 | 985 | |
| Myc | ENSMUSG00000022346.15 | ENSMUST00000160009.1 | chr15 | 61987421 | 61990253 | 3267 | 1764 | 99 | 1317 | 348 | |
| Yap1 | ENSMUSG00000053110.13 | ENSMUST00000086580.11 | chr9 | 7931998 | 8004588 | 7613 | 4114 | 197 | 1416 | 2501 | |
| Fgfr2 | ENSMUSG00000030849.18 | ENSMUST00000117872.7 | chr7 | 130162511 | 130266245 | 3778 | 4222 | 603 | 2169 | 1450 | |
The maximal value of read density plotted in the figures. The unit is RPKM.
Supplementary Material
Acknowledgements
We thank the members of K.F.A., J.A.D. and A.K. laboratories for their support and comments on this work. We are grateful to B. Li’s (K.F.A. laboratory) for comments on the paper. We thank the Norwegian Transgenic Center for animal housing and oocyte collection. We also thank the Norwegian Sequencing Centre (Oslo University Hospital and University of Oslo) and the Genomics Core Facility (Norwegian University of Science and Technology) for high-throughput sequencing. This work was supported by National Institutes of Health grants R01HG008759, R01HG011469 and R01GM136886 (to K.F.A., Y.W. and A.L.); Institutional fund from the Department of Biomedical Informatics, The Ohio State University (to K.F.A., Y.W. and A. L.); Institutional fund from the Department of Computational Medicine and Bioinformatics, University of Michigan (to K.F.A., Y.W. and A.L.); South-Eastern Norway Regional Health Authority Early Career Grants 2016058 and 2018063 (to J.A.D.); Research Council of Norway, FRIPRO Grant 289467 (to J.A.D); South-Eastern Norway Regional Health Authority, Grant 2018086 (to A.K.); Research Council of Norway, FRIPRO Researcher Project 275286 (to A.K.); UiO:Life Science convergence environment grant (to Y.L., T.S., A.K., G.D.G. and J.A.D.).
Footnotes
Additional information
Extended data is available for this paper at https://doi.org/10.1038/s41594-023-00969-x.
Supplementary information The online version contains supplementary material available at https://doi.org/10.1038/s41594023–00969-x.
Peer review information Nature Structural & Molecular Biology thanks the anonymous reviewers for their contribution to the peer review of this work. Primary Handling Editors: Beth Moorefield, Carolina Perdigoto and Dimitris Typas in collaboration with Nature Structural & Molecular Biology team.
Competing interests
The authors declare no competing interests.
References
- 1.Zhao BS, Roundtree IA & He C. Post-transcriptional gene regulation by mRNA modifications. Nat. Rev. Mol. Cell Biol 18, 31–42 (2017). [DOI] [PMC free article] [PubMed] [Google Scholar]
- 2.Zaccara S, Ries RJ & Jaffrey SR Reading, writing and erasing mRNA methylation. Nat. Rev. Mol. Cell Biol 20, 608–624 (2019). [DOI] [PubMed] [Google Scholar]
- 3.Klungland A, Dahl JA, Greggains G, Fedorcsak P. & Filipczyk A. Reversible RNA modifications in meiosis and pluripotency. Nat. Methods 14, 18–22 (2016). [DOI] [PubMed] [Google Scholar]
- 4.Dominissini D. et al. Topology of the human and mouse m6A RNA methylomes revealed by m6A-seq. Nature 485, 201–206 (2012). [DOI] [PubMed] [Google Scholar]
- 5.Meyer KD et al. Comprehensive analysis of mRNA methylation reveals enrichment in 3′ UTRs and near stop codons. Cell 149, 1635–1646 (2012). [DOI] [PMC free article] [PubMed] [Google Scholar]
- 6.Atlasi Y. & Stunnenberg HG The interplay of epigenetic marks during stem cell differentiation and development. Nat. Rev. Genet 18, 643–658 (2017). [DOI] [PubMed] [Google Scholar]
- 7.Dahl JA et al. Broad histone H3K4me3 domains in mouse oocytes modulate maternal-to-zygotic transition. Nature 537, 548–552 (2016). [DOI] [PMC free article] [PubMed] [Google Scholar]
- 8.Sui X. et al. METTL3-mediated m6A is required for murine oocyte maturation and maternal-to-zygotic transition. Cell Cycle 19, 391–404 (2020). [DOI] [PMC free article] [PubMed] [Google Scholar]
- 9.Falco G. et al. Zscan4: a novel gene expressed exclusively in late 2-cell embryos and embryonic stem cells. Dev. Biol 307, 539–550 (2007). [DOI] [PMC free article] [PubMed] [Google Scholar]
- 10.Marikawa Y. & Alarcon VB Establishment of trophectoderm and inner cell mass lineages in the mouse embryo. Mol. Reprod. Dev 76, 1019–1032 (2009). [DOI] [PMC free article] [PubMed] [Google Scholar]
- 11.Batista PJ et al. m6A RNA modification controls cell fate transition in mammalian embryonic stem cells. Cell Stem Cell 15, 707–719 (2014). [DOI] [PMC free article] [PubMed] [Google Scholar]
- 12.Wang Y. et al. N6-methyladenosine modification destabilizes developmental regulators in embryonic stem cells. Nat. Cell Biol 16, 191–198 (2014). [DOI] [PMC free article] [PubMed] [Google Scholar]
- 13.Geula S. et al. m6A mRNA methylation facilitates resolution of naive pluripotency toward differentiation. Science 347, 1002–1006 (2015). [DOI] [PubMed] [Google Scholar]
- 14.Jin KX et al. N6-methyladenosine (m6A) depletion regulates pluripotency exit by activating signaling pathways in embryonic stem cells. Proc. Natl Acad. Sci. USA 10.1073/pnas.2105192118 (2021). [DOI] [PMC free article] [PubMed] [Google Scholar]
- 15.Oron E. & Ivanova N. Cell fate regulation in early mammalian development. Phys. Biol 9, 045002 (2012). [DOI] [PubMed] [Google Scholar]
- 16.Ivanova I. et al. The RNA m6A reader YTHDF2 is essential for the post-transcriptional regulation of the maternal transcriptome and oocyte competence. Mol. Cell 67, 1059–1067 e1054 (2017). [DOI] [PMC free article] [PubMed] [Google Scholar]
- 17.Li M. et al. Ythdf2-mediated m6A mRNA clearance modulates neural development in mice. Genome Biol. 19, 69 (2018). [DOI] [PMC free article] [PubMed] [Google Scholar]
- 18.Lasman L. et al. Context-dependent functional compensation between Ythdf m6A reader proteins. Genes Dev. 34, 1373–1391 (2020). [DOI] [PMC free article] [PubMed] [Google Scholar]
- 19.Sha QQ et al. Characterization of zygotic genome activation-dependent maternal mRNA clearance in mouse. Nucleic Acids Res. 48, 879–894 (2020). [DOI] [PMC free article] [PubMed] [Google Scholar]
- 20.Mu H. et al. METTL3-mediated mRNA N6-methyladenosine is required for oocyte and follicle development in mice. Cell Death Dis. 12, 989 (2021). [DOI] [PMC free article] [PubMed] [Google Scholar]
- 21.Chen T. et al. m6A RNA methylation is regulated by microRNAs and promotes reprogramming to pluripotency. Cell Stem Cell 16, 289–301 (2015). [DOI] [PubMed] [Google Scholar]
- 22.Yang Q. et al. Highly sensitive sequencing reveals dynamic modifications and activities of small RNAs in mouse oocytes and early embryos. Sci. Adv 2, e1501482 (2016). [DOI] [PMC free article] [PubMed] [Google Scholar]
- 23.Deniz O, Frost JM & Branco MR Regulation of transposable elements by DNA modifications. Nat. Rev. Genet 20, 417–431 (2019). [DOI] [PubMed] [Google Scholar]
- 24.Franke V. et al. Long terminal repeats power evolution of genes and gene expression programs in mammalian oocytes and zygotes. Genome Res. 27, 1384–1394 (2017). [DOI] [PMC free article] [PubMed] [Google Scholar]
- 25.Chen C. et al. Nuclear m6A reader YTHDC1 regulates the scaffold function of LINE1 RNA in mouse ESCs and early embryos. Protein Cell 12, 455–474 (2021). [DOI] [PMC free article] [PubMed] [Google Scholar]
- 26.Liu J. et al. The RNA m6A reader YTHDC1 silences retrotransposons and guards ES cell identity. Nature 591, 322–326 (2021). [DOI] [PubMed] [Google Scholar]
- 27.Chelmicki T. et al. m6A RNA methylation regulates the fate of endogenous retroviruses. Nature 591, 312–316 (2021). [DOI] [PubMed] [Google Scholar]
- 28.Xu W. et al. METTL3 regulates heterochromatin in mouse embryonic stem cells. Nature 591, 317–321 (2021). [DOI] [PubMed] [Google Scholar]
- 29.Xiong F. et al. RNA m6A modification orchestrates a LINE-1–host interaction that facilitates retrotransposition and contributes to long gene vulnerability. Cell Res. 31, 861–885 (2021). [DOI] [PMC free article] [PubMed] [Google Scholar]
- 30.Lanciano S. & Cristofari G. Measuring and interpreting transposable element expression. Nat. Rev. Genet 21, 721–736 (2020). [DOI] [PubMed] [Google Scholar]
- 31.Svoboda P. Why mouse oocytes and early embryos ignore miRNAs? RNA Biol. 7, 559–563 (2010). [DOI] [PMC free article] [PubMed] [Google Scholar]
- 32.DeVeale B, Swindlehurst-Chan J. & Blelloch R. The roles of microRNAs in mouse development. Nat. Rev. Genet 22, 307–323 (2021). [DOI] [PubMed] [Google Scholar]
- 33.Marcel M. Cutadapt removes adapter sequences from high-throughput sequencing reads. EMBnet.journal 10.14806/ej.17.1.200 (2011). [DOI] [Google Scholar]
- 34.Kim D, Langmead B. & Salzberg SL HISAT: a fast spliced aligner with low memory requirements. Nat. Methods 12, 357–360 (2015). [DOI] [PMC free article] [PubMed] [Google Scholar]
- 35.Li H. et al. The Sequence Alignment/Map format and SAMtools. Bioinformatics 25, 2078–2079 (2009). [DOI] [PMC free article] [PubMed] [Google Scholar]
- 36.Quinlan AR & Hall IM BEDTools: a flexible suite of utilities for comparing genomic features. Bioinformatics 26, 841–842 (2010). [DOI] [PMC free article] [PubMed] [Google Scholar]
- 37.Pertea M. et al. StringTie enables improved reconstruction of a transcriptome from RNA-seq reads. Nat. Biotechnol 33, 290–295 (2015). [DOI] [PMC free article] [PubMed] [Google Scholar]
- 38.Wu Z. et al. NormExpression: an R package to normalize gene expression data using evaluated methods. Front. Genet 10, 400 (2019). [DOI] [PMC free article] [PubMed] [Google Scholar]
- 39.Anders S. & Huber W. Differential expression analysis for sequence count data. Genome Biol. 11, R106 (2010). [DOI] [PMC free article] [PubMed] [Google Scholar]
- 40.Ramirez F, Dundar F, Diehl S, Gruning BA & Manke T. deepTools: a flexible platform for exploring deep-sequencing data. Nucleic Acids Res. 42, W187–W191 (2014). [DOI] [PMC free article] [PubMed] [Google Scholar]
- 41.Zhang Y. et al. Model-based analysis of ChIP-seq (MACS). Genome Biol. 9, R137 (2008). [DOI] [PMC free article] [PubMed] [Google Scholar]
- 42.Olarerin-George AO & Jaffrey SR MetaPlotR: a Perl/R pipeline for plotting metagenes of nucleotide modifications and other transcriptomic sites. Bioinformatics 33, 1563–1564 (2017). [DOI] [PMC free article] [PubMed] [Google Scholar]
- 43.Heinz S. et al. Simple combinations of lineage-determining transcription factors prime cis-regulatory elements required for macrophage and B cell identities. Mol. Cell 38, 576–589 (2010). [DOI] [PMC free article] [PubMed] [Google Scholar]
- 44.Wu J. et al. The landscape of accessible chromatin in mammalian preimplantation embryos. Nature 534, 652–657 (2016). [DOI] [PubMed] [Google Scholar]
- 45.Wu J. et al. Chromatin analysis in human early development reveals epigenetic transition during ZGA. Nature 557, 256–260 (2018). [DOI] [PubMed] [Google Scholar]
- 46.Zhang JD et al. Detect tissue heterogeneity in gene expression data with BioQC. BMC Genomics 18, 277 (2017). [DOI] [PMC free article] [PubMed] [Google Scholar]
- 47.Hu H. et al. AnimalTFDB 3.0: a comprehensive resource for annotation and prediction of animal transcription factors. Nucleic Acids Res. 47, D33–D38 (2019). [DOI] [PMC free article] [PubMed] [Google Scholar]
- 48.Huang da W, Sherman BT & Lempicki RA Systematic and integrative analysis of large gene lists using DAVID bioinformatics resources. Nat. Protoc 4, 44–57 (2009). [DOI] [PubMed] [Google Scholar]
- 49.Agarwal V, Bell GW, Nam JW & Bartel DP Predicting effective microRNA target sites in mammalian mRNAs. eLife 10.7554/eLife.05005 (2015). [DOI] [PMC free article] [PubMed] [Google Scholar]
- 50.Cordaux R. & Batzer MA The impact of retrotransposons on human genome evolution. Nat. Rev. Genet 10, 691–703 (2009). [DOI] [PMC free article] [PubMed] [Google Scholar]
Associated Data
This section collects any data citations, data availability statements, or supplementary materials included in this article.
Supplementary Materials
Data Availability Statement
All picoMeRIP-seq data generated in this study are available in GEO with accession number GSE192440. The differentially expressed genes (Ythdf2 knockout versus wild-type GV oocytes) were obtained from GEO (GSE147849). The expression values of miRNAs in mouse MII oocyte, and one-cell (zygote), two-cell and eight-cell embryos were obtained from the Supplementary Dataset 1 of a previous study22.


