Abstract
Upon stimulation by extrinsic stimuli, stem cells initiate a program that enables differentiation or self-renewal. Disruption of the stem-state exit has catastrophic consequences for embryogenesis and can lead to cancer. While some elements of this stem-state switch are known, major regulatory mechanisms remain unclear. Here, we show this switch involves a global increase in splicing efficiency coordinated by DNMT3A, an enzyme typically involved in DNA methylation. Proper activation of murine and human embryonic and hematopoietic stem cells depends on mRNA processing influenced by DNMT3A in response to stimuli. DNMT3A coordinates splicing through recruitment of the core spliceosome protein SF3B1 to RNA polymerase and mRNA. Importantly, the DNA methylation function of DNMT3A is not required and loss of DNMT3A leads to impaired splicing during stem cell turnover. Finally, we identify the spliceosome as a potential therapeutic target in DNMT3A-mutated leukemias. Together, our results reveal a modality through which DNMT3A and the spliceosome govern exit from the stem-state towards differentiation.
Stem cells maintain a regulated balance between the stem state and differentiation that is mediated by several intracellular and extracellular stimuli. Hematopoietic Stem cells (HSCs) are responsible for the production of blood throughout life. They maintain this ability partly through long-term quiescence, a cellular state wherein there is minimal proliferation and low metabolic activity. Upon exposure to activation stimuli, HSCs exit quiescence and undergo expansion and produce differentiated hematopoietic cells (1-6). Although many factors play a role in regulating the quiescent and active cell states, the processes through which stem cells respond to stimuli and switch towards exiting the stem state remains unresolved. Understanding these processes are of paramount importance to determining the mechanisms driving age-associated clonal disorders such as Clonal Hematopoiesis (CH) and Acute Myeloid Leukemia (AML), which increase the likelihood of all-cause mortality.
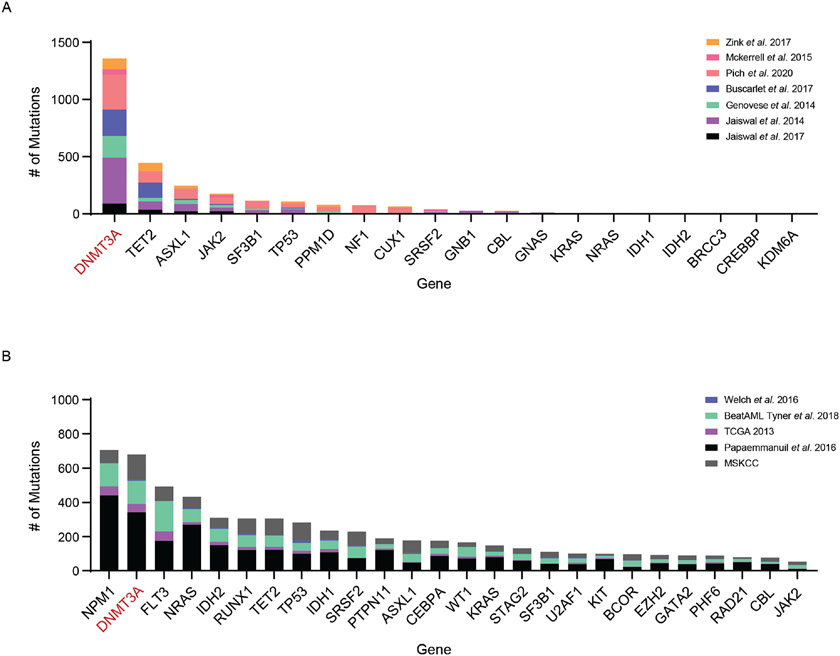
Disruptions in the balance between the stem state and differentiation are a hallmark of age-associated clonal disorders. Genes encoding epigenetic regulators such as DNMT3A and TET2, and RNA Splicing factors such as SF3B1 and SRSF2 are frequently mutated in individuals with CH and AML. Among them, mutations in DNMT3A are vastly overrepresented in individuals with CH (Extended Data Figure 1) (7-16).
DNMT3A is a de novo DNA methylation enzyme that is crucial for postnatal development and hematopoietic stem cell (HSC) function. While germline ablation of Dnmt3a leads to postnatal lethality, conditional deletion of Dnmt3a in HSCs impairs differentiation and leads to an expansion of stem cells (17-22). Furthermore, DNMT3A is important in other somatic progenitor cells such as neurons (23), controls the balance of naïve T and B cells, regulates genomic instability in leukemia cells (24), and more recently was found to influence efficacy of CAR-T cell therapy (25-28). Our understanding of how DNMT3A loss alters stem cell function remains incomplete as changes in DNA methylation do not fully explain this phenomenon. While changes in DNA methylation occur over many cell divisions, acute cellular responses to activation modulated by DNMT3A have not been explored. The synergistic effect of impaired acute cellular responses and long-term changes in DNA methylation may promote the development of clonal disorders. Therefore, we hypothesized that DNMT3A may regulate additional processes important for stem cell function.
Results
DNMT3A is required for Stem Cell Activation and mRNA Splicing
In the hematopoietic system, DNMT3A is predominantly expressed in Long-term Hematopoietic stem cells (LT-HSCs) (18). LT-HSCs are quiescent under homeostatic conditions but can be activated through a variety of stimuli. Activation brings about a rapid switch from dormancy into cell cycling, leading to both stem cell differentiation and self-renewal. HSC activation occurs naturally in response to infection or bleeding via exposure to cytokines such as interferons and thrombopoietin (1,2,29) and artificially through treatment with agents such as polyinosinic:polycytidylic acid (pIpC) (30) (which mimics the interferon response) or the chemotherapeutic agent 5-Fluorouracil (5-FU) (31). Exit from the stem state is represented by a shift from CD34 negative to predominantly CD34 positive HSCs (CD150+CD48−) (30).
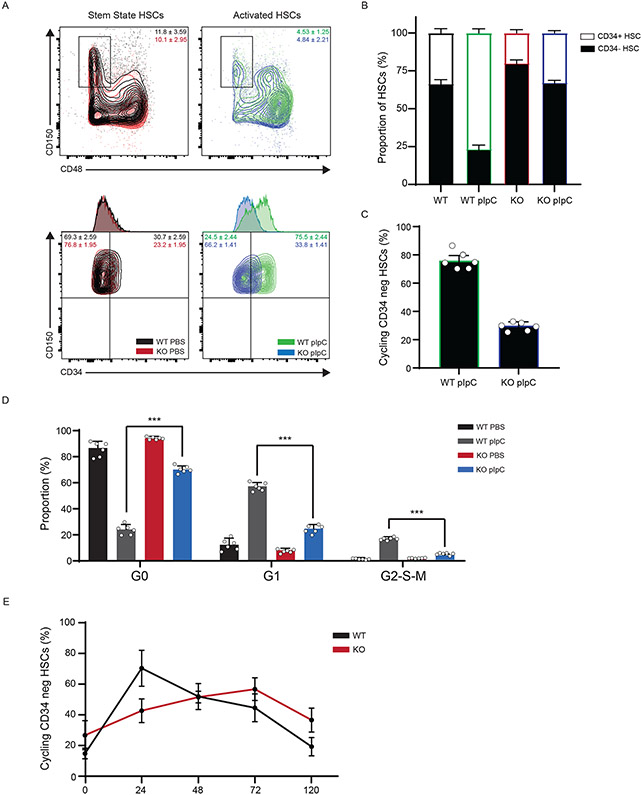
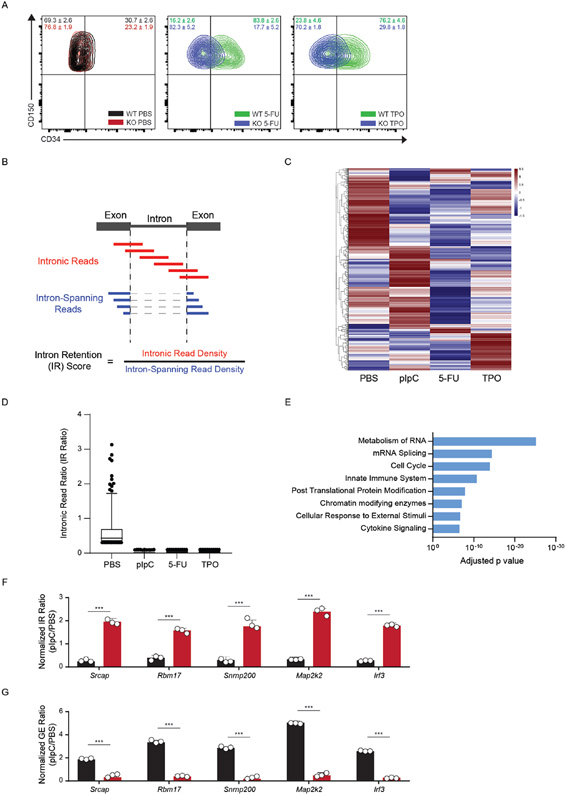
To test if DNMT3A plays a role in the stem state switch, we induced activation of HSCs in WT and KO mice using pIpC. While activated WT HSCs responded by displaying vastly greater proportions of progenitors than stem state WT HSCs, KO cells were less responsive (Fig. 1A, B). Consistent with fewer CD34+ HSCs in KO mice after activation, there were fewer HSCs that displayed the proliferation marker Ki-67 (Fig. 1C), and a greater proportion remained in G0 compared to WT cells (Fig. 1D). Because these proportional changes could be ascribed to differences in kinetics of activation, we examined the dynamics over a 5-day period. We discovered that KO LT-HSCs displayed a delayed response to activation relative to WT cells (Fig. 1E). A similar muted response was observed in KO HSCs after activation by 5-FU and TPO (Extended Data Figure 2A). Together, these data show that DNMT3A is important for the acute response to activation and the stem state switch.
Figure 1: DNMT3A is important for a Stem State Switch upon Hematopoietic activation in vivo.
(A) Flow cytometry plot of WT and KO Long-Term HSCs (LT-HSCs, identified as CD150+ CD48− CD34− cells) before and after 24h polyinosinic:polycytidylic acid (pIpC) treatment. (B) Bar graph depicting the ratio of ST:LT-HSCs over time (n = 6 animals, mean values +/− SD). (C) % of cycling cells as measured by Ki-67 and Hoescht staining from LT-HSC after pIpC treatment (n = 6 animals, mean values +/− SD). (D) Cell cycle analysis by Ki-67 and Hoescht staining from LT-HSC after pIpC treatment (n = 6 animals, mean values +/− SD). (E) Time course of LT-HSCs in active cycle (G1/S/G2/M) by Ki-67 and Hoescht staining after pIpC treatment (n = 5 animals, mean values +/− SD). Panels B-E - unpaired t-test with Welch’s correction.
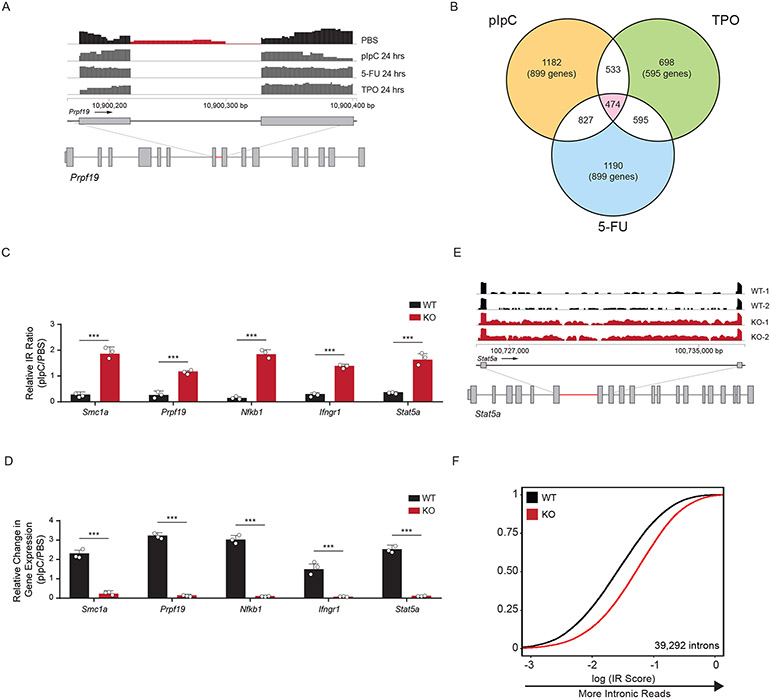
To gain insight into the molecular mechanisms underlying HSC activation, we performed mRNA-sequencing after in vivo treatment with pIpC, TPO, 5-FU, or PBS (control). Upon examining the RNA-sequencing data, we observed sequencing reads mapped to introns in quiescent HSCs that were absent in activated stem cells (Fig. 2A). To quantify this globally, we examined the proportion of intronic read (IR) density compared to intron-spanning read density as a metric for inefficient splicing (Extended Data Figure 2B). We observed a significant decrease in IR in activated compared to quiescent HSCs after exposure to pIpC (1183/3071 IR loci), 5-FU (827/3071 IR loci), and TPO (698/3071 IR loci). Among all treatments, 474 regions displayed greater than 2-fold change in IR in common (Fig. 2B, Extended Data Figure 2C, D, Supplementary Table 1). Gene Ontology (GO) analysis of the genes in this overlapping set revealed an enrichment for genes involved in metabolism and splicing of RNA, cell cycle, and chromatin modifying enzymes (Extended Data Figure 2E). Several genes in these processes exhibited increased IR ratios in activated KO HSCs, and a concomitant decrease in RNA expression levels (Fig. 2C, D, Extended Data Figure 2F, G). These data show that the intronic landscape, or intronome, is dynamically processed upon activation of HSCs.
Figure 2: Activation of Hematopoietic Stem Cells involves upregulation of mRNA splicing.
(A) RNA sequencing track of the Prpf19 locus in PBS treated (black) and pIpC, 5-FU, or TPO treated (dark grey) murine HSCs. Region in red highlights intronic reads (IR) in PBS-treated compared to stimuli-treated mice (n = 4 animals per group). (B) Venn-diagram showing the number of overlapping IR loci between different activation stimuli (pIpC, TPO, and 5-FU) compared to control (PBS). (C, D) RT-qPCR validation of relative IR (top) and changes in gene expression (bottom) in WT and KO HSCs. IR ratios were normalized to β-actin (n = 5 animals per experiment, 3 independent experiments, mean values +/− SD, unpaired t-test with Welch’s correction, *** p < 0.001). (E) RNA sequencing track of the Stat5a locus in WT (black) and KO (red) mouse HSCs. Highlighted region in red is expanded to show increased IR in KO compared to WT HSCs. (F) eCDF for 39,292 introns in WT and KO HSCs (n = 5 animals per experiment, 2 independent experiments) showing greater intronic reads in KO compared to WT HSCs (curve shifting to the right indicates more intronic reads).
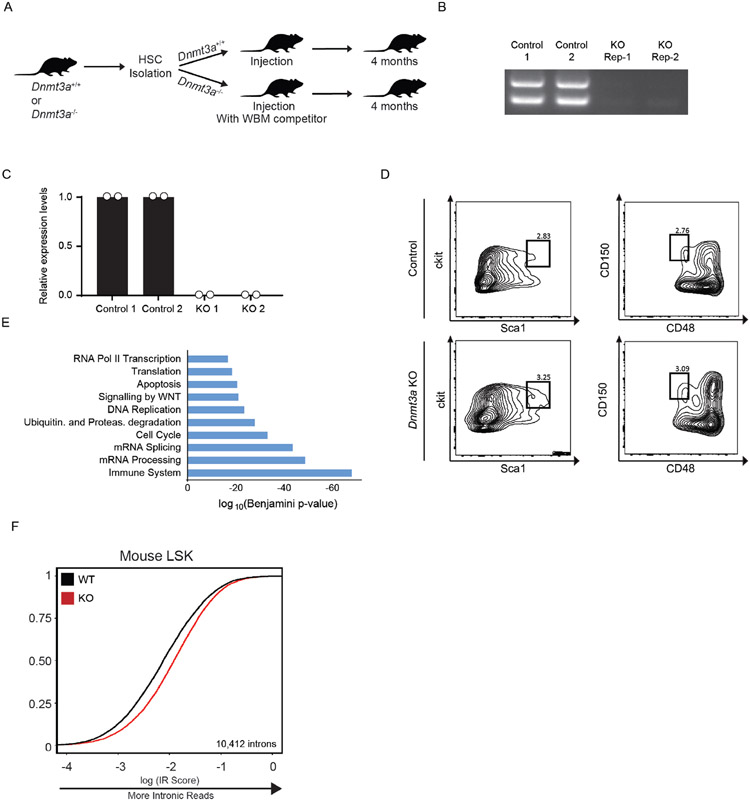
We previously showed that DNMT3A loss in HSCs leads to aberrant differentiation upon serial transplantation of HSCs (18,21). To determine whether splicing differences could also be observed in Dnmt3a KO cells after a longer time period including multiple cell cycles, we performed mRNA sequencing of WT and KO stem cells after HSC transplantation (Extended Data Figure 3A-D). KO HSCs displayed greater IR than WT HSCs. We quantified this transcriptome-wide and observed mis-splicing at 39,292 introns (Fig. 2E,F, Supplementary Table 2). GO analysis of genes with greater IR in KO HSCs revealed essential cellular processes including components of the immune system, cell cycle, RNA splicing, and ribosome biogenesis (Extended Data Figure 3E). Furthermore, RNA sequencing of KO progenitors downstream of HSCs also revealed greater mis-splicing suggesting that defects in splicing are propagated through at least the earliest stages of commitment (Extended Data Figure 3F). Together, these data reveal that intronome regulation is impaired during activation and turnover of KO HSCs in vivo.
DNMT3A is required for mRNA Processing in Activated Stem Cells
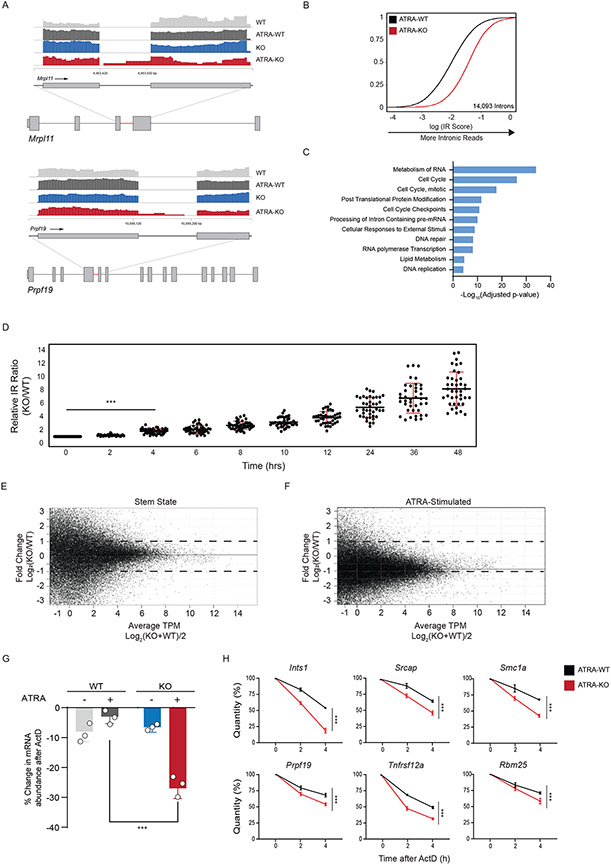
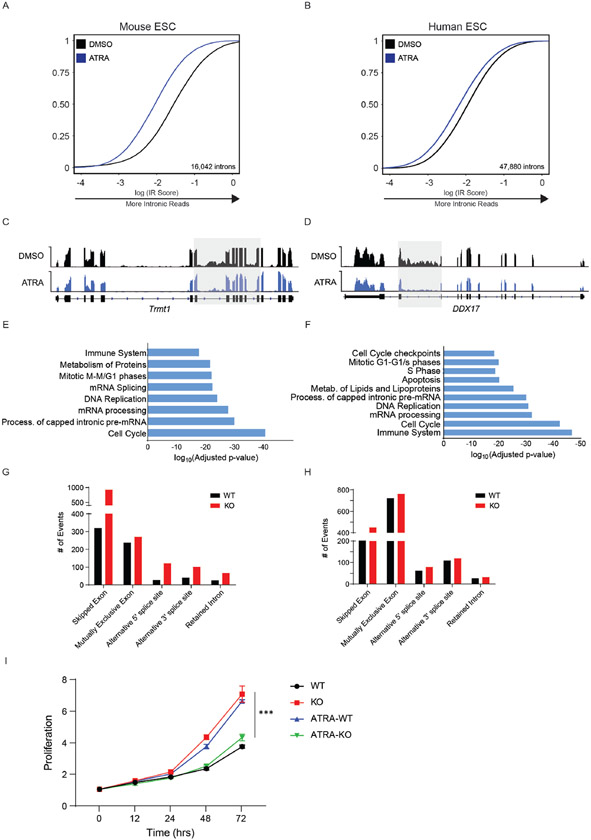
To determine whether disrupted RNA processing was a feature of other stem cells lacking DNMT3A, we turned to embryonic stem cells (ESCs). ESCs also depend on de novo DNA methyltransferases for appropriate differentiation during long-term propagation, but whether it has an acute rule in ESC activation is unknown. We first treated WT mouse and human ESCs (mESCs and hESCs) with a vitamin A derivative, All-Trans Retinoic Acid (ATRA), to induce a stem state switch from pluripotency towards differentiation (32). Similar to in vivo activation of mouse HSCs, ATRA-stimulation resulted in a global decrease in intronic-reads at genes belonging to core cellular processes (Extended Data Figure 4A-F). We next treated WT and Dnmt3a KO mESCs with ATRA to determine the importance of DNMT3A for this change in splicing. IR analysis of transcripts with greater intronic reads in ATRA-treated KO mESCs revealed greater mis-splicing at 14,093 introns (Fig. 3A, B, Supplementary Table 3). Gene ontology analysis of mis-spliced genes revealed essential cellular pathways similar to mHSCs, including cell cycle, mRNA processing, and DNA repair (Fig. 3C). We confirmed the increase in mis-splicing at several loci by measuring the relative IR ratio of nascent RNA upon ATRA-stimulation (Fig. 3D). In addition, we performed alternative splicing analysis using multivariate analysis of transcript splicing (rMATs) and observed minimal overlap with targets of IR (Extended Data Figure 4G,H and Supplementary Table 4 and 5).
Figure 3: DNMT3A regulates pre-mRNA processing during exit from Stem State.
(A) RNA sequencing tracks of the Mrpl11 and Prpf19 locus in WT (light grey), KO (blue), WT stimulated (ATRA-WT, dark grey), and KO stimulated (ATRA-KO, red) mouse ESCs (mESCs). Highlighted region (red) is expanded to show greater intronic reads in KO stimulated mESCs. (B) eCDF for 14,093 introns in ATRA-WT and ATRA-KO stimulated mESCs (n = 2 biologically independent samples). (C) Gene Ontology (GO) enrichment analysis of mis-spliced genes in ATRA-KO compared to ATRA-WT mESCs. (D) RT-qPCR validation of intronic read ratio at indicated times (hours) after ATRA stimulation. IR ratios were normalized to β-actin (n = 40 loci, 3 biologically independent experiments per loci and 2 biologically independent samples, mean values +/− SD, two-tailed paired t-test, *** p < 0.001). (E) MA (ratio intensity) plot of mRNA-seq reads from WT and KO mESCs in stem state (n = 2 biologically independent samples). Dots indicate transcripts. Solid line indicates median fold change from transcripts. Dashed line indicates 2-fold increase (top) and decrease (bottom) in transcript abundance. Data represents an integration of all samples. (F) MA plot of mRNA-seq reads in ATRA-WT and ATRA-KO mESCs (n = 2 biologically independent samples). Data represents an integration of all samples. (G) % changes in mRNA after treatment of WT and KO mESCs with actinomycin D before and after stimulation. Errors bars represent SD from 3 biologically independent samples and 2 independent experiments. Unpaired t-test with Welch's correction. (H) Accelerated mRNA decay at mis-spliced genes in KO stimulated mESCs. Quantity was normalized to levels of β-actin. Error bars represent SD from 3 biologically independent samples and 2 independent experiments. Unpaired t-test with Welch’s correction was used to test significance.
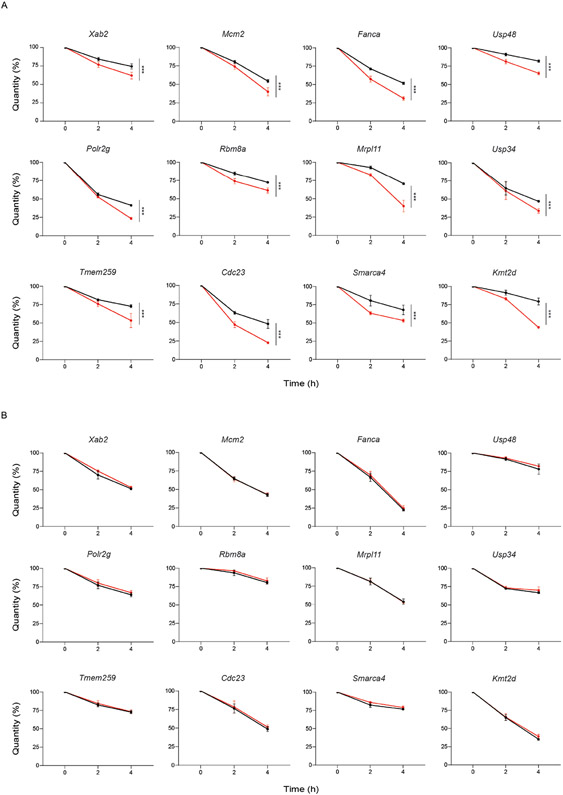
Since there is an increase in mis-spliced transcripts belonging to important genes in ATRA-treated KO cells, we next queried whether there was a general impact on transcript abundance. While KO cells displayed minimal changes in transcripts compared to WT, there was a global decrease in mRNA abundance in ATRA-treated KO cells (Fig. 3E, F). We also observed a slower growth rate for ATRA-treated KO compared to WT cells (Extended Data Figure 4I). This response is similar to the delayed growth observed after stimulating KO HSCs in vivo (Fig. 1E). The rapid increase in inefficient splicing and transcriptome-wide decrease in mRNA abundance hinted that DNMT3A loss may affect mRNA stability upon stem cell activation. To assess whether mRNA turnover is impaired in KO cells, we measured the decay rates of mis-spliced mRNAs. Decays rates of mis-spliced genes were accelerated in DNMT3A KO cells after ATRA-stimulation, while remaining unchanged at stem state (Fig 3G, H, Extended Data Figure 5). This indicates that the proper splicing coordinated by DNMT3A, and stability of mRNA are important during exit from the stem state. The accelerated decay of mis-spliced transcripts may indicate a role for nonsense mediated decay (NMD) stimulated by differentiation signals.
DNMT3A impacts splicing independent of DNA methylation
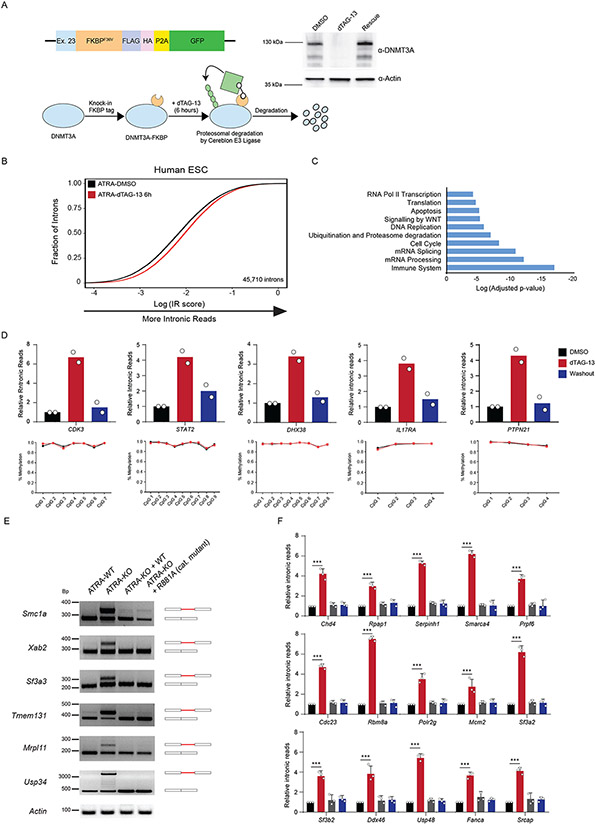
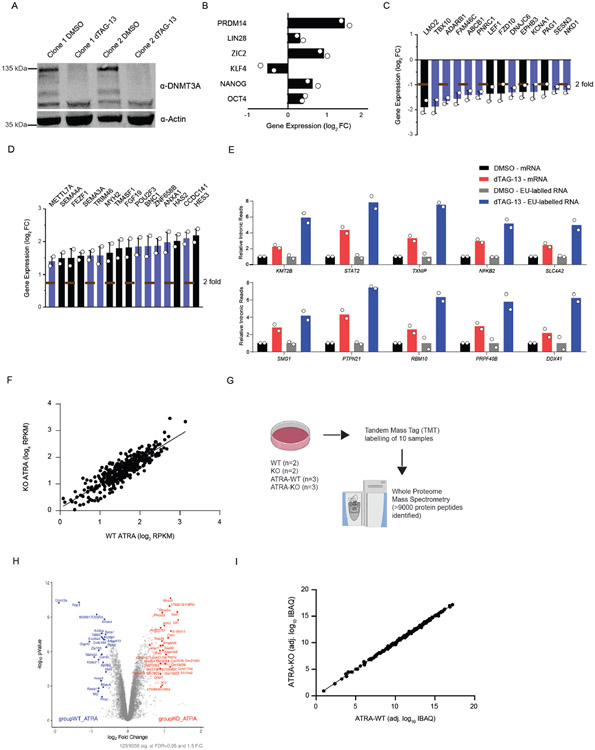
Having established that DNMT3A plays a role in the acute stem state switch, we considered the potential mechanisms. While changes in DNA methylation at CpG dinucleotides located in introns may alter splicing outcomes (33-35), substantial methylation changes require rounds of cell division (17,18,36). The rapid effect on the stem cell state suggested other roles of DNMT3A. To examine this, we utilized a FKBP-based protein degradation system (dTAG) (37,38). If efficient splicing requires DNMT3A presence rather than its catalytic function , rapid degradation of the protein prior to ATRA-stimulation should cause mis-splicing. To test this, we introduced the FKBP12 (F36V) fragment into the endogenous DNMT3A locus using CRISPR. The addition of dTAG13 to the culture medium induced rapid degradation of the fusion protein, which returned to steady-state levels after replacing with fresh culture media (washout) (Figure 4A). Importantly, loss of DNMT3A for 12 hours did not alter the expression of key pluripotency genes (Extended Data Figure 6A-D). There is a subtle but rapid global increase in IR after ATRA-stimulation of dTAG13-treated cells. (Figure 4B, C, Supplementary Table 6). We corroborated the increase in IR through qRT-PCR and did not observe any significant changes in DNA methylation at mis-spliced loci (Figure 4D). To verify that nascent transcripts were affected, we isolated EU-labelled RNA after degradation of DNMT3A and observed a significant increase in IR (Extended Data Figure 6E). This suggests that mis-splicing observed in ATRA-KO cells may not require DNMT3A-mediated changes in DNA methylation and that nascent RNA processing may be impaired.
Figure 4: DNA methylation by DNMT3A is not required to rescue mis-splicing in activated stem cells.
(A) Schematic of degron construct, the degradation strategy and western blot validation after rapid degradation of FKBP-tagged DNMT3A using dTAG-13 in human ESCs (hESCs). Homology template containing an FKBP tag was introduced at the endogenous DNMT3A loci with CRISPR. Upon addition of dTAG-13, FKBP-tagged DNMT3A recruits E3 Ligase, Cereblon to polyubiquitinate and signal DNMT3A for degradation through the ubiquitin proteasome system. Western blot of DNMT3A before and after treatment with dTAG-13 for 6 hours. Washout was performed by replacing media and culturing in fresh media without dTAG-13 for an additional 12 hours. (B) eCDF for 45,710 introns in ATRA-DMSO and ATRA-dTAG-13 hESCs (n = 2 biologically independent samples) after 12 hours of treatment with dTAG-13 followed by ATRA-stimulation. Data represents an integration of all samples. (C) Gene Ontology enrichment analysis of mis-spliced genes in ATRA-dTAG-13 compared to ATRA-DMSO hESCs. (D) (top) qRT-PCR of loci displaying increased intronic reads (IR) in human ES cells (hESCs) six hours after degradation and ATRA-stimulation of FKBP-tagged DNMT3A and rescue of DNMT3A expression. (bottom) Amplicon bisulphite sequencing of intron-retained loci after rapid degradation of DNMT3A in ATRA-dTAG-13 hESCs. Bisulfite primers were created to cover all CpGs in introns. Genomic localization of each intron is: CDK3 (chr17:73998223-73998329), STAT2 (chr12:56740408-56740603), DHX38 (chr16:72144976-72146312), IL17RA (chr22:17582933-17583029), and PTPN21 (chr14:88936077-88936266). (E) Reverse Transcriptase-PCR (RT-PCR) of mis-spliced loci in ATRA-WT, ATRA-KO, and ATRA-KO after rescue with exogenous WT and catalytically inactive mutant R881A, mouse DNMT3A. (F) RT-qPCR of 15 additional mis-spliced genes (n = 3 biologically independent samples and 2 independent experiments, error bars represent mean +/− SD).
To further determine if the DNA methylating activity of DNMT3A is important for splicing during the stem state switch, we re-introduced wildtype and a catalytic inactive variant of DNMT3A into KO mESCs prior to stimulation with ATRA. Previous work showed that the R881A (R885A in human DNMT3A) point mutation results in loss of DNA methylation catalytic activity without altering DNA binding affinity (39,40). Both the wildtype and catalytic-inactive DNMT3A rescued defects in splicing, indicating that its catalytic function is not required for preserving splicing efficiency (Figure 4E, F). Furthermore, to rule out an indirect effect on splicing mediated via alterations in its regulators, we analyzed changes in splicing-associated factors at the gene expression and proteome level in WT vs KO activated stem cells, finding no significant changes (Extended Data Figure 6F-I) at a time point where changes in splicing are observed. This suggests a closely coordinated mechanism between DNMT3A and splicing facilitates the stem state switch.
DNMT3A recruits core spliceosome components to RNA Polymerase II and mRNA
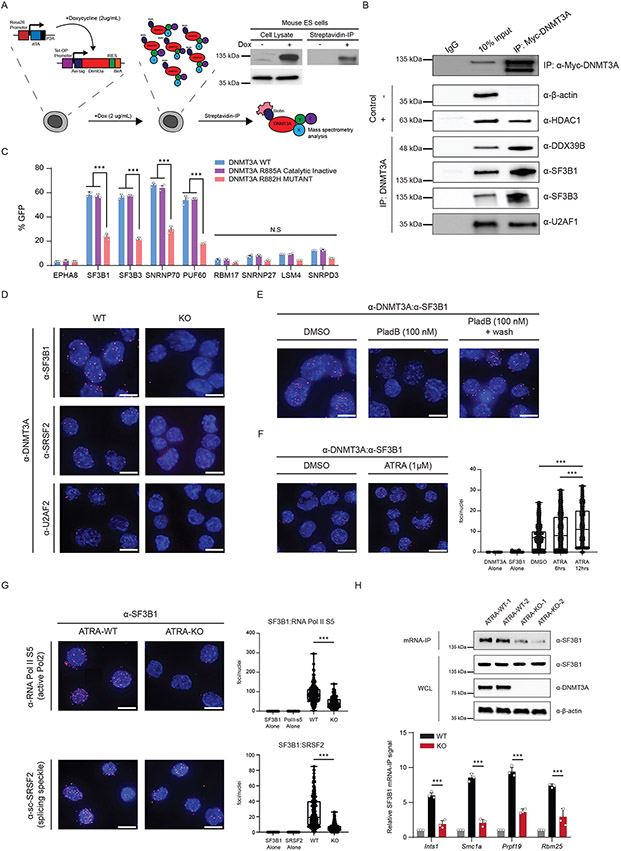
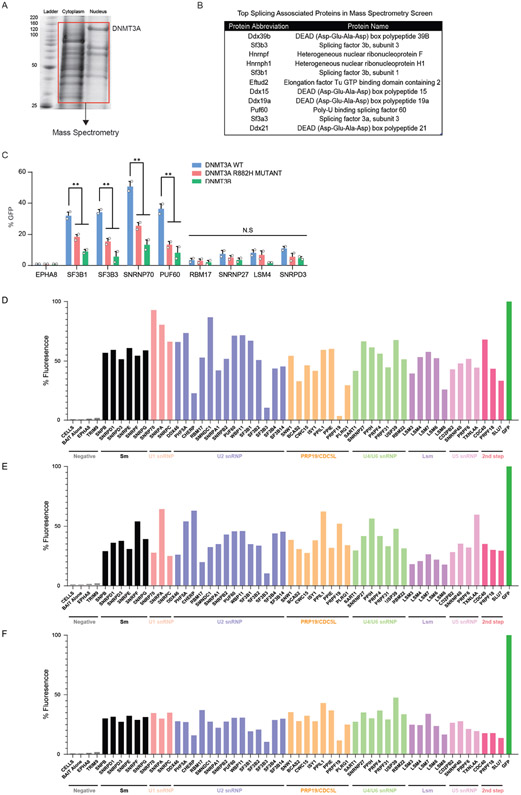
To investigate the mechanisms through which DNMT3A may influence splicing, we sought to identify protein interacting partners. We created an in vivo biotinylation system in murine embryonic stem cells (mESCs) and performed co-immunoprecipitation and mass-spectrometry analysis (Figure 5A, Extended Data Figure 7A,B). Among the targets, spliceosome-associated proteins were enriched in the pulldown, as exemplified by SF3B1, a core U2 snRNP protein frequently mutated in individuals with clonal disorders (Extended Data Figure 1). We corroborated putative interactions through co-immunoprecipitation (Co-IP) of DNMT3A and probed for endogenous splicing factors (Fig. 5B). To broadly test the association of DNMT3A with splicing complexes, we performed an in vivo Bimolecular Fluorescence Complementation (BiFC) screen between wildtype and mutant DNMT3A and 54 splicing-associated factors from major spliceosome subcomplexes. DNMT3A associated with several spliceosome members, with the strongest interactions occurring with members of early spliceosome complexes (Fig. 5C, Extended Data Figure 7C). Notably, the catalytically inactive variant of DNMT3A did not disrupt the interaction while a hotspot DNMT3A mutant (R882H) common in patients with hematologic malignancies, as well as the other de novo DNA methyltransferase, DNMT3B, showed decreased association with several splicing factors (Fig. 5C, Extended Data Figure 7D-F).
Figure 5: DNMT3A recruits spliceosome components to RNA polymerase II and mRNA.
(A) Schematic of the inducible in vivo biotinylation system for DNMT3A in murine ES cells. Western blot validation of biotinylated DNMT3A after induction with 2ug/mL doxycycline in mouse ES cells (left) and immunoprecipitation with streptavidin coated magnetic beads (right). (B) Western blot after exogenous expression and co-immunoprecipitation of MYC-tagged DNMT3A in human embryonic kidney cells (HEK 293T). 10% input and eluates were probed for the indicated splicing-associated factors. HDAC1 was the positive control and β-actin was the negative control. (C) BiFC analysis of DNMT3A-interacting spliceosome components after lentiviral expression of human DNMT3A variants (n = 4 biologically independent samples and 2 independent experiments, mean values +/− SD, unpaired t-test with Welch's correction). (D) Proximity ligation assay (PLA) of DNMT3A and splicing-associated factors in mESCs. (E) PLA of DNMT3A and SF3B1 after treatment with 100nM Pladienolide B for 6 hours, and washout of the drug for 4 hours. (F) PLA of DNMT3A and SF3B1 at 0, 6h, and 12h after ATRA-stimulation in mESCs. Image represents interacting foci 12h after ATRA-stimulation (n = 3 biologically independent samples and 2 independent experiments). (G) PLA of SF3B1 and SRSF2/SC-35 or active RNA polymerase in ATRA-WT and ATRA-KO cells (n = 3 biologically independent samples and 2 independent experiments). (H) top western blot probing for SF3B1 after mRNA-IP in ATRA-WT and ATRA-KO cells. bottom SF3B1 mRNA-IP qPCR in ATRA-WT and ATRA-KO cells. All values relative to IgG control (in grey) (n = 3 biologically independent samples and 2 independent experiments, mean values +/− SD). Panels F-H – unpaired t-test with Welch’s correction. Scale bars on all immunofluorescent images represent 10μm.
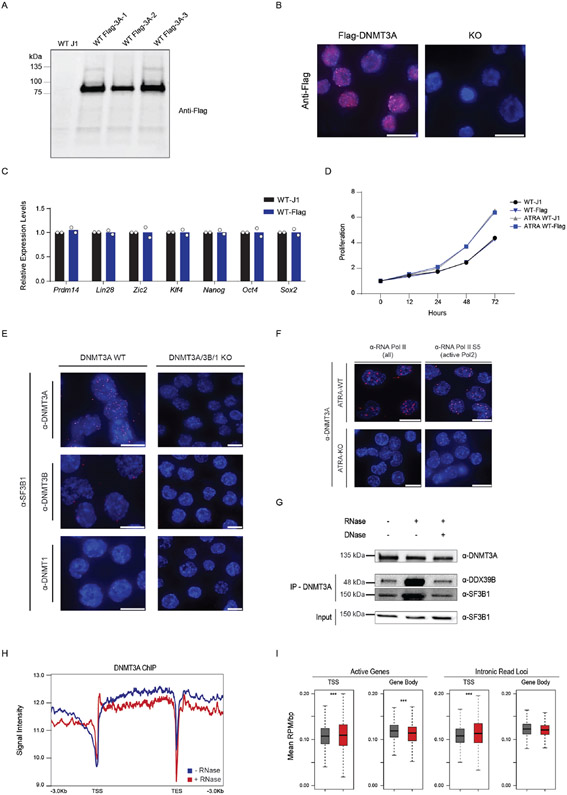
To determine whether these associations are direct, we performed an in situ targeted analysis of protein interaction through proximity ligation (PLA). For specific identification of DNMT3A, we used CRISPR to introduce a flag tag at the endogenous Dnmt3a locus (Extended Data Figure 8A-D). We observed that DNMT3A interacts with SF3B1, SRSF2/SC-35, and several splicing-associated factors (Fig. 5D). Importantly, SF3B1 did not interact with other DNA methyltransferases (Extended Data Figure 8E). Pladienolide B (PladB) is a small molecule inhibitor of SF3B1 and other U2-snRNP components of the spliceosome which leads to mis-splicing. Treatment with Pladienolide B (PladB) for 4 hours abolished the interaction between DNMT3A and SF3B1, and a washout of the drug led to reestablishment of the interaction (Fig. 5E). Upon stimulation with ATRA, the number of DNMT3A:SF3B1 foci increased in a time-dependent manner, suggesting that these together may coordinate the earliest stages of the stem state switch through direct interaction (Fig. 5F).
Further inspection of our mass spectrometry screen revealed an enrichment for two core subunits of RNA polymerase, POLR2A and POLR2B. Recent work has uncovered that splicing complexes associate with active RNA polymerase II (RNAPII) and regulate transcription dynamics (41,42). We hypothesized that upon stimulation, DNMT3A may mediate the interaction between splicing factors and RNAPII. Using PLA, we found that DNMT3A associates with active RNAPII in ATRA-treated cells (Extended Data Figure 8F). Since splicing factors primarily associate with active RNAPII, we next tested the impact of DNMT3A loss on this interaction. We observed a drastic reduction in interaction between SF3B1 and active RNAPII and SRSF2 in ATRA-KO cells (Fig. 5G). Next, we asked if the interaction of DNMT3A with splicing factors was mediated by nucleic acids. Neither treatment with DNase nor RNase disrupted the interaction of DNMT3A with SF3B1 (Extended Data Figure 8G). This supports the hypothesis that DNMT3A and SF3B1 may directly interact. Since the interaction between DNMT3A and transcription machinery may be through RNA, we performed ChIP-sequencing of DNMT3A before and after RNase A. Intriguingly, DNMT3A displayed decreased gene body occupancy upon treatment with RNase A (Extended Data Figure 8H,I). Finally, if DNMT3A tethers SF3B1 to coordinate splicing, SF3B1 localization to introns may be decreased in KO cells. To test this, we performed mRNA Immunoprecipitation (mRIP) in ATRA-treated WT and KO cells, observing a decreased association between SF3B1 and mRNA in ATRA-KO cells. Furthermore, SF3B1 RIP-qPCR after mRNA enrichment revealed decreased association with mis-spliced introns in KO cells (Figure 5H). Together, DNMT3A’s interaction with SF3B1 is important for proper SF3B1 localization to introns in ATRA-stimulated ES cells.
Spliceosome inhibition promotes apoptosis of DNMT3A Mutant Stem and Leukemia Cells
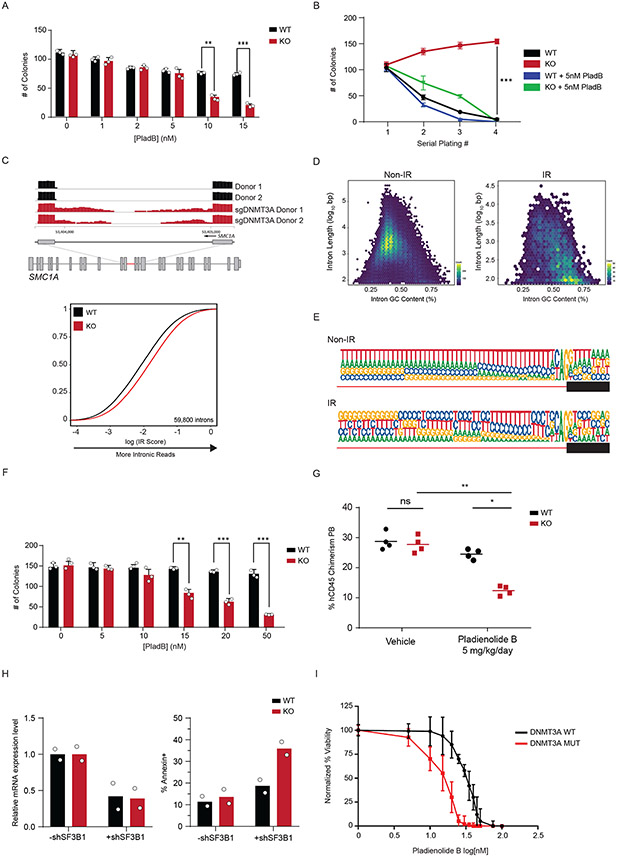
Since treatment with PladB impacted the interaction of DNMT3A with SF3B1 (Figure 5E), we next tested the functional consequence to combining DNMT3A loss and splicing inhibition. To do this, we treated WT and KO mouse HSPCs with PladB ex vivo and evaluated stem cell colony formation. We observed a significant difference in the number of colonies at 10nM of PladB (Figure 6A). Importantly, serial replating of Dnmt3a KO HSPCs led to a modest expansion of stem cell colonies. Treatment with 5nM PladB drastically reduced expansion of KO cells (Figure 6B), indicating that spliceosome inhibition may be a vulnerability in Dnmt3a KO stem cells.
Figure 6: Loss of DNMT3A in Human Hematopoietic cells reveals a therapeutic vulnerability to spliceosome inhibition.
(A) Colony formation assay of Dnmt3a WT and KO murine hematopoietic stem and progenitor (LSK) cells treated with indicated amounts of Pladienolide B (PladB) (n = 3 animals and 2 independent experiments, mean values +/− SD, unpaired t-test with Welch’s correction). (B) Serial replating colony formation assay of murine Dnmt3a WT and KO stem cells (n = 3 animals and independent experiments of Dnmt3a WT (black), Dnmt3a KO (red), Dnmt3a WT + PladB (5nM) (blue), Dnmt3a KO + PladB (5nM) (green)). p < 0.05 = **, p < 0.01 = ***. Mean values +/− SD are shown, unpaired t-test with Welch’s correction. (C) top RNA sequencing track of the SMC1A locus in Cas9 (black) and sgDNMT3A (red) CD34+ HSPCs from 2 patients. Highlighted region in red is expanded to show increased intronic reads in sgDNMT3A compared to Cas9 HSPCs. bottom eCDF for 59,800 introns in DNMT3A WT and KO human CD34+ HSPCs (n = 2 donors). (D) Hexbin plot showing relative abundance of mis-spliced introns based on length (y-axis) and GC-content (x-axis) of non-IR (left) and IR (right) loci in human sgDNMT3A versus Cas9 Donor HSPCs. The total number of intron count contained within each hex is indicated by its colour (n = 2 donors). The colours range from blue to yellow. A yellow hexbin represents the highest number of introns with a given length and GC content. Non-IR targets were predominantly long and low in GC content, while IR targets are short and high in GC content. (E) The 3′ splice site motif of loci with intronic reads (IR) vs loci without intronic reads (Non-IR) in sgDNMT3A human donor CD34+ HSPCs versus Cas9 HSPCs (n = 2 donors). (F) Colony formation assay of Cas9 and sgDNMT3A donor CD34+ HSPCs after treatment with indicated amounts of PladB. n = 3 donors and experiments, mean values +/− SD. Unpaired t-test with Welch’s correction. (G) Percent human CD45 chimerism in the peripheral blood of recipient NSG mice with either WT or KO K562 cells four days after the last of five treatments with vehicle or PladB (5mg/kg/day) (n = 4 animals per group, mean values ± SD; two-way ANOVA with Turkey’s multiple comparison tests; * p<0.05, ** p<0.01). (H) Bar plot of mRNA expression levels (left) and apoptosis (right) in WT and KO isogenic K562 cells after shRNA-mediated knockdown of SF3B1. (I) AnnexinV apoptosis assay comparing DNMT3A WT (black, n = 10) vs. DNMT3A MUTANT (red, n = 20) AML patients after treatment with indicated concentrations of PladB. N = 30 biologically independent donor cells per PladB concentration, mean values +/− SD. Patient mutation profiles are in Supplementary Table 8. Unpaired t-test with Welch’s correction was used to test significance.
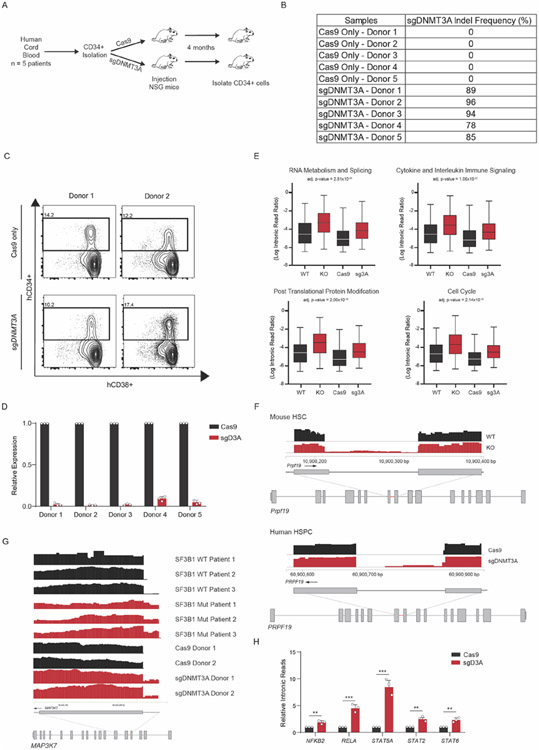
We next determined if DNMT3A is important for splicing in hematopoietic stem and progenitor cells (HSPCs) from patients. We used CRISPR-Cas9 to ablate DNMT3A in CD34+ stem cells from multiple donors (Extended Data Figure 9A-D). sgDNMT3A HSPCs displayed significantly greater IR (Figure 6C, Supplementary Table 7). Analysis of the common mis-spliced genes in murine and human DNMT3A KO stem cells revealed an enrichment for genes associated with immune regulation, mRNA processing, cell cycle, and proteasomal degradation (Extended Data Figure 9E,F). Importantly, we observed several mis-splicing events also observed in Myelodysplastic Syndrome (MDS) patients with SF3B1 mutations such as components of the NFKB and JAK-STAT pathway (43,44) (Extended Data Figure 9G,H).
Splicing factor mutant cells display increased sensitivity to splicing inhibitors due to an accumulation of mis-spliced RNA (45-47). We hypothesized that if DNMT3A loss also impacted splicing through similar modalities, mis-spliced loci would share comparable features. We found that mis-spliced loci in DNMT3A KO HSPCs were enriched for short and GC-rich transcripts (Figure 6D). Motif enrichment analysis revealed a greater probability of GC-rich introns at mis-spliced loci (Figure 6E). These features are consistent with targets of mis-splicing after inhibition of the spliceosome (45). We also observed decreased colony numbers with sgDNMT3A-treated HSPCs (Figure 6F). Together, this suggests that DNMT3A loss, SF3B1 mutation, and splicing inhibition through a SF3B inhibitor may operate through similar modalities to impact stem cell function.
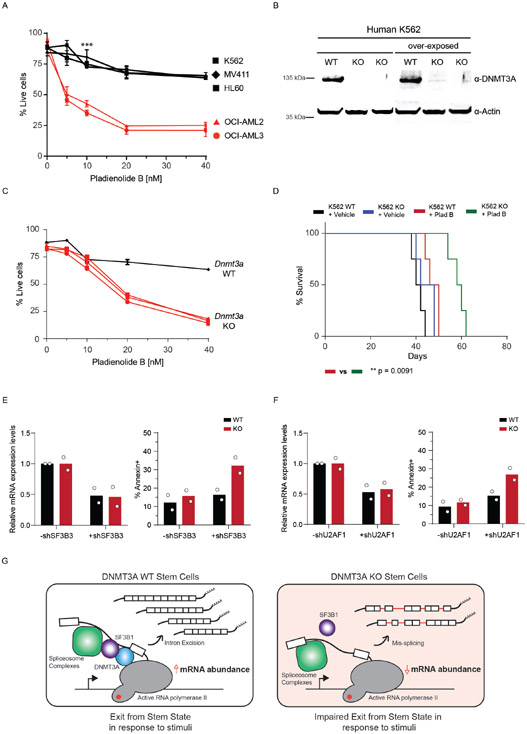
While mutations in DNMT3A in CH are observed at multiple residues across the protein, the R882 hotspot mutation is frequently observed in patients with AML. Increased mis-splicing in KO cells indicates that splicing inhibition maybe be synthetic lethal in DNMT3A mutant cells. To test this, we examined the sensitivity of several DNMT3A WT and mutant human leukemia cell lines to PladB. DNMT3A mutant cells (OCI-AML2 and OCI-AML3) were significantly more sensitive than wild-type cells to PladB (Extended Data Figure 10A). To address whether loss of DNMT3A alone was sufficient to confer sensitivity to splicing inhibition, we generated isogenic KO K562 leukemia cells. Treatment of KO cells with PladB impaired their survival in vitro and reduced leukemic burden and extended survival in vivo (Figure 6G, Extended Data Figure 10B-D). To rule out off-target effects due to PladB, we performed shRNA-mediated knockdown of SF3B1, SF3B3, and U2AF1; their knockdown led to significantly increased apoptosis in KO compared to WT cells (Figure 6H, Extended Data Figure 10E,F). Lastly, bone marrow and peripheral blood samples from AML patients with DNMT3A mutations displayed greater sensitivity to PladB than with WT DNMT3A, suggesting a potential application for splicing inhibitors independent of spliceosome mutations (Fig. 6I, Supplementary Table 8).
Discussion
Here, we propose that hematopoietic and embryonic stem cells undergo a stem state shift dependent on efficient splicing coordinated by DNMT3A (Extended Data Figure 10G). DNMT3A interacts with components of the spliceosome and upon induction, enforces a switch that involves splicing factor recruitment to active RNA polymerase II and nascent mRNA. Since DNMT3A interacts with the spliceosome, which binds to pre-mRNAs, DNMT3A can direct the regulation of properly spliced mRNA at a global level. As shown here, this is especially important when stem cells rapidly respond to activation signals. This reveals a consequence to loss of DNMT3A that warrants further study in the hematopoietic, nervous, and other systems where DNMT3A mutations are known to have pathologic consequences (48-52).
We unravel a role for DNMT3A as a coordinator of splicing efficiency in murine and human stem cell activation independent of catalytic DNA methylation function. Our study sheds insight into how co-transcriptional processes may be regulated through scaffolding of the spliceosome to RNA polymerase. Importantly, we suggest potential temporal and spatial regulation for spliceosome recruitment through DNMT3A upon stem cell activation. The importance of modulating spliceosome expression has been established for stem cell totipotency (53). In contrast, stem cell pluripotency, activation, and eventual differentiation require sufficient splicing factor expression and localization which is in part coordinated by DNMT3A. Importantly, while perturbation of splicing factors is known to affect expression of other splicing factors, we did not observe significant changes in their expression in Dnmt3a-KO activated stem cells, supporting the notion that DNMT3A is directly involved in the upregulation of proper splicing to satisfy demand during differentiation. Nevertheless, we cannot exclude additional indirect effects.
Our study reveals convergence between epigenetic regulators and splicing factors to regulate a stem state switch which may impact differentiation. Cells lacking DNMT3A ineffectively coordinate splicing, and therefore produce mis-spliced unstable RNA during activation. Importantly, not all genes and introns are affected, so loss of DNMT3A leads to mis-regulation of splicing, not a pervasive general defect. Furthermore, our analysis did not identify significant overlap of intronic reads with alternatively spliced transcripts suggesting there are distinct governing mechanisms, but the role of DNMT3A in alternative splicing may be of future interest. Our findings suggest that DNMT3A mutant leukemia cells are sensitive to pharmacologic inhibition of the spliceosome which merits further testing in vivo.
Overall, the findings presented here set the stage for harnessing mRNA splicing and intronome regulation for stem cell and gene therapies, dissecting a broader role for DNMT3A as a modulator of splicing in other developmental transitions, and for exploring a potential synergy between inefficient splicing and DNA methylation in promoting age-associated clonal disorders and targeting hematopoietic malignancies.
Materials and Methods
Cell Culture
HL60, K562, MV411, OCI-AML2, OCI-AML3, and IMS cells were cultured in RPMI 1460 supplemented with 10% FBS, 5% Pen/Strep, 5% L-Glutamine. HEK293T cells from ATCC were cultured in DMEM supplemented with 10% FBS, 5% Pen/Strep, 5% L-Glutamine. Mouse J1 embryonic stem cells were cultured on 0.1% gelatin-coated plates without feeder. DMEM KO medium supplemented with Glutmax, Non-essential amino acids, and leukemia-inhibitory factor (LIF) was used. The H9 (WA09) hESC line was obtained from Wisconsin Alumni Research Foundation (WiCell Research Institute, Madison, WI). H9 cells were cultured feeder-free on plates coated with Matrigel (Corning, 354277) in Gibco™ StemFlex™ Medium (Thermo Fisher Scientific, A3349401).
Genome editing of Human Embryonic Stem Cells (hESCs)
The H9 (WA09) hESC line was obtained from Wisconsin Alumni Research Foundation (WiCell Research Institute, Madison, WI). H9 cells were cultured feeder-free on plates coated with hESC-Qualified Matrigel® (Corning, 354277) in Gibco™ StemFlex™ Medium (Thermo Fisher Scientific, A3349401). For CRISPR/Cas9-facilitated homologous recombination, ribonucleoprotein complexes (RNPs) were prepared by incubating 40pmol of TrueCut™ Cas9 Protein v2 (Thermo, A36497) with 60pmol of modified sgRNA (Synthego) for 10 min at room temperature. RNPs were nucleofected into dissociated H9 cells (5x10^5), along with 1.32μg of a dsDNA donor template encoding the Degron tag (FKBP12F36V-FLAG-HA-P2A-EGFP) flanked by homology arms to DNMT3A. The P3 Primary Cell 4D-Nucleofector™ Kit (Lonza) and program CB-150 were used. Cells were allowed to re-attach to a fresh Matrigel-coated plate and expanded before undergoing FACS. After FACS for GFP+ cells, single-cell derived colonies were manually picked and expanded as clonal lines. Twelve colonies were selected expanded and interrogated by PCR for the presence of the WT and Degron-tagged allele.
RA-mediated stimulation of mESCs and degron-tagged hESC clones
Dnmt3a WT and KO mESCs were dissociated with Trypsin. 1x10⁶ cells were resuspending in stimulation media (ES cell media -lif) with either DMSO or 1μM all-trans retinoic acid (ATRA)) for 24 hours.
H9 cells were dissociated using Accutase (Stemcell Technologies, #07920), seeded on plates coated with Matrigel in StemFlex medium supplemented with 10μM Y-27632 (Stemcell Technologies, #72302), and allowed to attach for 2 hours. Cells were pre-treated for 3 hours with either DMSO or 500nM dTAG-13 to initiate DNMT3A degradation. The medium was then substituted with N2H medium plus 1μM ATRA and 10μM Y-27632 with either DMSO or 500nM dTAG-13. N2H medium consists of: 1x N2 supplement, 1x NEAA, 1x Pen/Strep, 55μM β-mercaptoethanol, and 2 μg/mL heparin in DMEM-F12.
Cell Proliferation
3,000 mESC cells were added per well in a gelatin-coated 96-well plate. The cell proliferation was assessed by assaying cells at various time points using Promega’s CellTiter 96® Aqueous One Solution Cell Proliferation Assay kit, following the manufacturer’s protocols. For each sample tested, the signal from the assay was normalized to the value observed at 5 or 24 h after plating.
Animals
All animals were housed at Baylor College of Medicine (BCM). All procedures were completed in accordance with the guidelines for the Care and Use of Laboratory Animals, following approval by IACUC at BCM. Mice used for hematopoietic stem cell (HSC) transplantation and induced differentiation with 5-fluorouricil were in the C57BL/6 background, distinguished by the presence of CD45.1 and CD45.2 alleles. Immunocompromised NSG mice were used for human CD34+ transplantation studies.
Transplantation
Mx1-cre Dnmt3afl/fl were generated and used for HSC transplantation as described in Challen et al. 2011. In brief, floxed alleles in donor CD45.2 HSCs were deleted 4-6 weeks prior to primary transplantation into 6- to -8-week-old C57BL/6 CD45.1 recipients by retro-orbital injection after split dose of 11 Gy of irradiation. Deletion of floxed alleles carried out in donor HSCs was confirmed before transplantation. After 4 months, bone marrow cells were harvested and FACS was performed to isolate pure HSCs. A cocktail of biotinylated lineage markers (Ter119, Mac1, Gre1, CD8, CD4, B220) and CD45.1 were used with anti-biotin to separate a purified stem and progenitor population using AutoMACs. LT-HSCs (APC-CY7 Ckit+, PE-CY7 Sca1+, FITC Lin−, PE CD150+, APC CD48−) cells were isolated using FACS.
Cord blood cells were provided by the M.D. Anderson Cord Blood bank and processed by standard protocols. In brief, for CD34+ cord blood transplantation, 6-8-week-old NSG mice were exposed to a sub-lethal (2.5 Gy) dose of total body irradiation. The irradiated recipients were transplanted with 150,000-250,000 CD34+ cord blood cells that had been isolated from individual cord blood donors and expanded for 48 hours in culture, then split into one Cas9-only and one Cas9/sgDNMT3A RNP electroporated aliquot. Each aliquot was injected into recipients 6 hours post electroporation for a total of 54 hours in culture. To confirm the knock-out efficiency of engrafted cells, human DNMT3A exon 10 was amplified by PCR from peripheral blood or harvested bone marrow cells, and an agarose gel was run to confirm exon 10 deletion.
For xenograft transplantation, 2x10⁶ DNMT3A KO K562 cells were injected intravenously into NSG mice. Mice were bled retro-orbitally to check for % of hCD45, 2 weeks post-engraftment. Mice with less than 10% engraftment were excluded from the study. 5mg/kg/day of Pladienolide B (PladB) was intravenously injected for 5 days and hCD45 levels were measured by flow cytometry after one week.
DNMT3A cloning, vectors, and virus production
In vivo inducible biotinylated-DNMT3A mESCs were created and induced as described in (Gu, T., Lin, X., Cullen, S.M. et al. 2017). Constructs were subcloned into a pCAG vector generating myc-tagged DNMT3A constructs and flag-tagged GFP.
For BiFC, DNMT3A cDNA were subcloned into the pINDUCER doxycycline-inducible lentiviral expression system. Lentiviruses and retroviruses were produced by transiently transfecting shRNA or cDNA constructs using Mirus Bio TransIT transfection protocols into 293T cells and harvesting viral supernatants 48 h after transfection. DNMT3A WT and mutant were cloned into retroviral vector pQCXIN-VN-dest. and splicing factors were cloned into retroviral vector pQCXIP-NC-dest.
Co-Immunoprecipitation & Mass Spectrometry
Nuclear and Cytoplasmic lysate were lysed in RIPA buffer and was then incubated with streptavidin M280 beads from Thermo fisher (catalog: 11205D) for 1 hour at 4°C to capture the biotinylated Dnmt3a protein complex. The beads were then briefly washed in the lysis buffer, boiled in 2X NUPAGE® LDS sample buffer (Life Technologies) and resolved on NuPAGE 10% Bis-Tris Gel (Life Technologies) (Extended Data Fig. 7a). The eluted proteins were visualized with Coomassie Brilliant blue-stain and both nuclear and cytoplasmic lanes were excised into gel pieces and combined according to the molecular weight. The individual gel piece was destained and subject to in-gel digestion using trypsin (GenDepot T9600, Houston, TX). The tryptic peptides were resuspended in 10μl of loading solution (5% methanol containing 0.1% formic acid) and subjected to nanoflow LC-MS/MS analysis with a nano-LC 1000 system (Thermo Scientific) coupled to Orbitrap Elite (Thermo Scientific) mass spectrometer. The peptides were loaded onto a Reprosil-Pur Basic C18 (1.9 μm, Dr. Maisch GmbH, Germany) pre-column of 2cm X 100μm size. The precolumn was switched in-line with an in-housed 5cm x 150μm analytical column packed with Reprosil-Pur Basic C18 equilibrated in 0.1% formic acid/water. The peptides were eluted using a 75min discontinuous gradient of 4-26% acetonitrile/0.1% formic acid at a flow rate of 800nl/min. The eluted peptides were directly electro-sprayed into Orbitrap Elite mass spectrometer operated in the data-dependent acquisition mode acquiring fragmentation spectra of the top 25 strongest ions and under the direct control of Xcalibur software (Thermo Scientific).
Mass Spectrometry Enrichment analysis
Obtained MS/MS spectra were searched against target-decoy mouse refseq database in Proteome Discoverer 1.4 interface (Thermo Fisher) with Mascot algorithm (Mascot 2.4, Matrix Science). Variable modification of phosphorylation on serine, threonine and tyrosin, oxidation on methionine, and protein N-terminal acetylation was allowed. The precursor mass tolerance was confined within 20 ppm with fragment mass tolerance of 0.5 Dalton and a maximum of two missed cleavages was allowed. The peptides identified from mascot result file were validated with a 5% false discovery rate (FDR) and the iBAQ algorithm was used to calculate the abundance of different proteins in the sample. Simply put, iBAQ was calculated based on normalization of summed peptide precursor area divided by the number of theoretically observable tryptic peptides for that protein.
Protein Extraction, Digestion, Labeling, and Mass Spectrometry Analysis:
Protein extraction, digestion and peptide fractionation was carried out based on the protocol adapted from PMID: 24719451. Briefly cells were lysed in 8M urea buffer, reduced/alkylated and digested using LysC and Trypsin proteases. The peptides (50μg per sample) were labeled with TMT10 plex isobaric label reagent (Thermo Fisher Scientific) according to manufacturer’s protocol. Offline fractionation on TMT-labeled peptides was done using Agilent 300Extend-C18 column (4.6mmX250mm,5μm) on Agilent 1260 Infinity II system at 1ml/min for 96min. The fractions were concatenated into 24 peptide pools. The deep-fractionated peptide samples were separated on an online nanoflow Easy-nLC-1000 system (Thermo Fisher Scientific) and analyzed on Orbitrap Exploris 480 mass spectrometer (Thermo Fisher Scientific). 1μg of each fraction was loaded on a pre-column (2cmX100μm I.D.) and separated on in-line 20cmX 75μm I.D. column (Reprosil-Pur Basic C18aq, Dr. Maisch GmbH, Germany) equilibrated in 0.1% formic acid (FA). The heated column was maintained at 60oC. Peptide separation was done at a flow rate of 200nl/min over 110min gradient time with different concentration of solvent B (2%to 30% 87min, 30% to 60% 6min, 60% to 90% 7min and finally hold at 50% 10min). The mass spectrometer was operated in a data dependent mode with 2second cycle time. The MS1 was done in Orbitrap (120000 resolution, scan range 375-1500m/z, 50ms Injection time) followed by MS2 in Orbitrap at 30000 resolution (HCD 38%) with TurboTMT algorithm. Dynamic exclusion was set to 20sec and the isolation width was set to 0.7m/z. The mass spectra were analyzed with Proteome Discoverer 2.1 software (Thermo Scientific) with Mascot 2.4 (Matrix Science) against NCBI refseq mus musculus database (updated 20200324). The following parameters were set for identification and quantification: 1) trypsin digestion with maximum two miscuts; 2) dynamic modification of oxidation (M), protein N-term acetylation, deamidation (NQ); 3) fixed modification of carbamidomethylation (C); 4) TMT10plex as static modification group; 5) precursor mass tolerance of 20ppm and fragment mass tolerance of 0.02Da; 6) reporter quantification used co-isolation threshold of 50 and average reporter S/N threshold of 10. The PSMs output file from PD was grouped at gene level. The gene product inference and iBAQ-based quantification was carried out using the gpGrouper algorithm (PMID: 30093420) to calculate peptide peak area (MS1) based expression estimates. The median normalized and log10 transformed iBAQ values were used for data analysis. The differentially expressed proteins were calculated using the moderated t-test to calculate p-values and log2 fold changes in the R package limma. The False Discovery Rate corrected pValue was calculated using the Benjamini-Hochberg procedure. Gene Set Enrichment Analysis (GSEA) (PMID: 16199517) was performed using the canonical pathway gene sets derived from KEGG and Reactome, hallmark gene set and Gene Ontology Biological process.
In situ Proximity Ligation Assay
mESCs were dried on coverglass (Fischer) and fixed in 4% paraformaldehyde for 10 min at room temperature, washed twice with PBS, and permeabilized with 0.1% (vol/vol) Triton X-100 for 30 min. Then the in-situ proximity ligation assay (in situ PLA) was performed according to the manufacturer’s protocol (Duolink #DUO92007, #DUO92001, #DUO92005) Briefly, after the cells were treated with a blocking solution for 1 h at room temperature, primary antibodies (diluted at 1:50) were incubated overnight at 4°C. The probes were incubated for 1 h at 37°C, followed by hybridization, ligation, amplification, and detection. After the cells were washed with Buffer A (3x) and B (2x), samples were counterstained with DAPI. Images were taken at 60X on a DeltaVision Elite Deconvolution microscope.
Bimolecular Fluorescence Complementation
DNMT3A human full-length and mutant cDNAs were cloned into the pQCXIN-VN-YFP fusion vector, in which N-terminal domain (residues 1-155) of Venus YFP was fused N-terminal to DNMT3A (bait). Human splicing cDNAs were obtained from one of several collections (Invitrogen, Addgene) or synthesized, fully sequence verified, and individually recombined into pQCXIP-NC-YFP fusion retroviral vector in which C-terminal Venus YFP (residues 156-239) was fused N-terminal to the splicing factor (prey). SUM159 breast cancer cells were transduced with the bait retroviruses. These cells were subsequently infected with the prey BiFC retroviruses expressing the RTKs, and cellular fluorescence was analyzed by flow cytometry in triplicate.
Co-immunoprecipitation and Immunoblotting
Splicing factor interactions were validated after exogenous expression of pCAG containing myc-tagged DNMT3A into HEK293T cells. Pierce anti-myc magnetic beads (Invitrogen 88843) were used to immunoprecipitate myc-tagged DNMT3A and associated proteins. The co-IP protocol was as described by the manufacturer. Binding buffer consisted of 25mM Tris-HCl pH. 8.0, 150 mM NaCl, 0.05% Tween-20. Wash buffer consisted of 125mM Tris-HCl pH. 8.0, 750mM NaCl, 0.25% Tween-20.
Cells were lysed in CytoBuster Protein Extraction Reagent for 20 minutes at room temperature. Soluble protein fraction was isolated after centrifugation at 14,000 RPM for 5 minutes at 4°C. 1X Laemlli Sample Buffer (Biorad, 161-0747) was added in a 1:1 ratio and heated at 95°C for 15 min. Eluates were run on 4-15% precast gels (Biorad 4561084) and transferred following standard western blot protocols. The following antibodies were used for western blotting: Flag (Sigma, F1804), SF3B1 (Bethyl, A300-996A), SF3B3 (Bethyl, A302-079A), DDX39B (H6) (Santa Cruz, sc-271395), c-Myc tag (9E10) (Thermo, 13-2500). β-actin (C4) (Santa Cruz, sc-47778) was used as a loading control.
RNA isolation and library preparation
Total RNA was isolated from mouse HSCs and human HSPCs using PicoPure RNA isolation kit (KIT0204). RNA from mESC and hESC was isolated using the Qiagen mini kit. 100 ng of total RNA was used was used as input for the Illumina TruSeq Stranded mRNA LT Prep Kit (20020594). Libraries were made following Illumina’s recommended protocol. Amplified libraries were purified and quantified using the KAPA quantification kit. RNA sequencing libraries were sequenced on an Illumina NextSeq 500 instrument (paired-end 75bp).
Nascent RNA Isolation
Mouse and Human ESCs were grown in 6-well plates. 0.2uM of EU was added for 6 hours. Nascent RNA was labelled and isolated using the Click-IT Nascent RNA Capture kit (C10365) kit from Invitrogen. Briefly, RNA was extracted using Trizol and total RNA was ribo-depleted with Illumina’s Ribo-Zero Gold rRNA Removal Kit (MRZG126) as per manufacturer’s recommendations. 2ug of Ribo-depleted Total RNA was subjected to further selection by Poly A purification beads provided in Illumina’s TruSeq Stranded mRNA LT Prep kit. Supernatant from incubation with beads was used as nascent RNA (Poly A− and Ribo-depleted).
mRNA Immunoprecipitation (mRIP)
200x106 Dnmt3a WT and KO mESCs were harvested and split into 10 groups each. 200ul of washed mRNA beads were added to each group. Protocol for isolating mRNA was followed as described in the Dynabeads™ mRNA Direct™ Purification Kit (61012) from Invitrogen. After elution, mRNA was either used to perform SF3B1-RIP qPCR or resuspended in 4X Laemlli Sample Buffer (Biorad, 161-0747) after which, western blot was performed. 1:1000 of primary antibody against SF3B1 (Bethyl, A300-996A) was used with 1:5000 of anti-rabbit secondary antibody.
RNA alignment
Paired-end stranded RNA-seq reads for both human and mouse samples were aligned using the splice aware aligner Hisat2 with default parameters. The coordinates and gene annotations used in all subsequent analyses were based on the human (hg19/GRCh37) and mouse (mm9/MGSCv37) reference genome builds and the corresponding RefSeq genes.
Intron Retention and Alternative Splicing definition and analysis
Hisat2-aligned reads were filtered for proper-paired reads (-f 2 flag in samtools). Intron annotations were parsed from RefSeq gene annotation files and were filtered to exclude features that overlap genomic loci on the same strand. Reads mapping to introns were counted using the Python module Pysam (https://github.com/pysam-developers/pysam). For each intron feature, we defined the following two read classes: (1) “intronic” reads mapping at least 6 bases contiguously within the intron and (2) “spanning” reads with ends mapping to the flanking exons. The intron retention (IR) score was then computed as the ratio of the RPKM-normalized “intronic” read density over the RPKM-normalized “spanning” read density. Introns with <10 spanning reads were excluded from all analyses. For analysis of introns with robust changes in expression, a spanning read threshold of 50 was implemented, and only introns with >2-fold changes in the IR score were kept. Statistical analyses were performed using R. Empirical cumulative distributions of IR scores were compared, and p-values estimated using a two-sided Kolmogorov-Smirnov test.
qPCR Validation
Total RNA was purified from mESCs by Trizol and resuspended in RNase-free H2O. 1ug RNA was used as input for the RT reaction using iScript™ Reverse Transcription Supermix. β-actin was used to normalize the data. β-actin fwd 5’GGCACCACACCTTCTACAATG and rev GGGGTGTTGAAGGTCTCAAAC. Other primers were designed and are listed in Supplementary Table 9.
Bisulphite DNA conversion and library preparation
Genomic DNA was extracted from hESC cells using the Qiagen AllPrep DNA/RNA Micro kit. DNA was subjected to bisulfite conversion using the Zymo Research EZ DNA Methylation Lightning Kit and was eluted into 10uL. Amplicon libraries were prepared using the Illumina’s Nextera XT DNA Library Preparation Kit (FC-131-1096). Libraries were spiked into dual-index sequencing runs.
Genome annotation
Mouse assembly mm10 (GRCm10) and Human assembly hg19 (GRCh19) were used as the reference genome and gene annotation, respectively. RNA-seq reads were aligned by using 2-pass STAR 2.5.2a.
Data Availability
Sequencing data that support the findings of this study have been deposited in the Gene Expression Omnibus (GEO) under accession code GSE222906. Source data are provided with this study. All other data supporting the findings of this study are available from the corresponding author on reasonable request.
Statistics and Reproducibility
No statistical method was used to predetermine sample size. No data were excluded from the analyses. The experiments were not randomized. No statistical methods were used to predetermine sample sizes but our sample sizes are similar to those reported in previous publications in the field. Data distribution was assumed to be normal but this was not formally tested. The Investigators were not blinded to allocation during experiments and outcome assessment. Different statistical tests used are indicated and described in the figure legends. Unless otherwise stated in the figure legends, 2 independent experiments were performed for all samples with 3 biologically independent samples or animals.
Extended Data
Extended Data Fig. 1. DNMT3A is frequently mutated in Clonal disorders.
(A) Number of individuals with somatic mutations in genes involved in Clonal Hematopoiesis (CH). (B) Number of individuals with somatic mutations in genes involved in Myelodysplastic Syndromes (MDS) and Acute Myeloid Leukemia (AML).
Extended Data Fig. 2. Enhanced Splicing Efficiency in Activated HSCs.
(A) Flow cytometry plot of CD150+ HSCs gated for CD34 after activation of WT and KO stem cells using 5-Flurouracil (5-FU) and Thrombopoietin (TPO) (n = 4 mice per group). (B) Schematic of Intronic Read (IR) ratio/score. Recently used in (Bowling and Wang, et al. Cell 2021). (C) Heatmap depicting IR ratio for each locus in PBS-treated vs. stimuli-treated mouse HSCs (n = 4 mice per replicate, 2 replicates per treatment). Red lines indicate presence of intronic reads at those loci. Raw data available in Extended Data Table 1. (D) Bar plot showing IR ratio for 437 common loci displayed greater splicing efficiency after exposure to stimuli. N = 4 animals and 2 independent experiments. Mean values +/− SD. Middle line represents mean, unpaired t-test with Welch’s correction). (E) Gene ontology enrichment analysis of commonly spliced genes displaying less intronic reads (IR) in activated stem cells after treatment with pIpC, 5-FU, and TPO. (F, G) RT-qPCR validation of relative IR (top) and changes gene expression (bottom) in WT and KO HSCs after activation with pIpC. IR ratios were normalized to β-actin (n = 4 animals and 3 independent experiments. Data shows mean values +/− SD, unpaired t-test with Welch’s correction).
Extended Data Fig. 3. Impaired Splicing in Dnmt3a KO mouse HSCs.
(A) Schematic of control and Dnmt3a KO mouse HSC transplantation. (B) Agarose gel electrophoresis image of amplified DNA from whole bone marrow of Mx1-cre and Dnmt3a KO mice after Hematopoietic Stem Cell (HSC) transplantation into CD45.1 recipient mice. (C) qPCR after ablation of Dnmt3a in mouse HSCs (2 biological replicates, 4 mice for each group). (D) Flow cytometry analysis of HSCs 4 months after transplant of Dnmt3a WT and KO HSCs into recipient CD45.1 mice. Lineage- Sca1+ Ckit+ (LSK) progenitor cells were processed on flow cytometer after lineage depletion. These were then used to purify stem cells and perform mRNA sequencing. Data shown in Figure 1J,K. (E) Gene Ontology analysis of genes displaying greater IR in KO HSCs compared to WT. (F) eCDF for 10,412 introns in WT and KO LSK progenitor cells (n = 2 biological replicates, 4 mice per group, p < 2.2x10⁻¹⁶).
Extended Data Fig. 4. Impaired growth rate in KO mESCs after ATRA-stimulation.
(A) eCDF for 16,042 introns in WT murine ES cells (mESCs) after ATRA-stimulation for 24 hours (2 independent biological samples), p < 2.2x10⁻¹⁶). (B) eCDF for 47,880 introns in WT human ES cells (hESCs) after ATRA-stimulation for 6 hours (n = 2 biological replicates, p < 2.2x10⁻¹⁶). (C) RNA sequencing track of the Trmt1 locus in mESCs after ATRA-stimulation. (D) RNA sequencing track of the DDX17 locus in hESCs after ATRA-stimulation. (E) Gene Ontology analysis of genes displaying less intronic reads in ATRA-treated compared to DMSO-treated mESCS. (F) Gene Ontology analysis of genes displaying less intronic reads in ATRA-treated compared to DMSO-treated hESCs. (G) Changes in alternative splicing between WT and KO mouse Hematopoietic stem cells. (H) Changes in alternative splicing between WT and KO activated mouse embryonic stem cells. (I) Growth curves comparing proliferation rate of WT (black), KO (red), WT after ATRA-stimulation (ATRA-WT, blue), and KO after ATRA-stimulation (ATRA-KO, green) mESCs. N = 3 biologically independent samples and 2 independent experiments. Mean values +/− SD. Unpaired t-test with Welch’s correction, p < 0.01 = *** comparing ATRA-WT and ATRA-KO.
Extended Data Fig. 5. Increased decay rates in KO mESCs after stimulation.
(A) Decay rates of 12 mRNAs in ATRA-WT and ATRA-KO mouse embryonic stem cells (mESCs). (B) Decay rates of 12 mRNAs in WT and KO stem state mESCs. For (A) and (B), Error bars represent SD (n = 3 biologically independent samples and 2 independent experiments for each gene, unpaired t-test with Welch’s correction).
Extended Data Fig. 6. Rapid degradation of DNMT3A causes mis-splicing.
(A) Western blot of human ESC clones with the DNMT3A degron system before and after treatment with dTAG-13 for 24 hours. (B) Expression of pluripotency factors 12 hours after treatment with dTAG-13 and ATRA (n = 2 biologically independent samples, mean values +/− SD) (C) Bar plot of genes downregulated (less than 2-fold) in dTAG-13 treated human ESCs (2 biologically independent samples, mean values +/− SD, unpaired t-test with Welch’s correction). Bars in black are genes that are associated with stem cell differentiation. (D) Bar plot of genes upregulated (greater than 2-fold) in dTAG-13 treated human ESCs (2 biologically independent samples, mean values +/− SD, unpaired t-test with Welch’s correction). Bars in black are genes that are associated with stem cell pluripotency. (E) qRT-PCR of intronic loci from mRNA and EU-labelled nascent RNA in DMSO and dTAG-13 treated human ESCs (n = 2 biologically independent experiments, mean values +/− SD). 2 independent experiments were performed for B-E. (F) Gene expression profile of over 200 splicing-associated factors in activated Dnmt3a WT and KO stem cells. (G) Schematic for TMT mass spectrometry and analysis. (H) Volcano plot showing protein expression levels in WT ATRA and KO ATRA stem cells (n = 3 biologically independent samples, red indicates greater than 0.5 fold change and blue indicates less than 0.5 fold change in activated Dnmt3a KO mouse ESCs). Data is an integration of all samples. (I) Protein expression profile of over 200 splicing-associated factors in activated Dnmt3a WT and KO stem cells (n = 3 biologically independent samples). Data is an integration of all samples.
Extended Data Fig. 7. DNMT3A associates with components of the spliceosome.
(A) Western blot validation of biotin-tagged DNMT3A after induction with 2ug/mL doxycycline in mouse ES cells (left) and immunoprecipitation with streptavidin coated magnetic beads (right). DNMT3A (at 130 kDa) is labeled. Red box indicates fractions of cytoplasmic and nuclear cell lysates used for mass spectrometry. (B) Table showing top splicing associated factors enriched in the co-immunoprecipitation and mass spectrometry analysis of biotin-tagged DNMT3A in mouse ES cells. (C) BiFC analysis of DNMT3A-interacting spliceosome components after lentiviral expression of human DNMT3A variants (n = 4 biologically independent samples and 2 independent experiments, mean values +/− SD, unpaired student’s t-test with Welch’s correction, mean values +/− SD, p < 0.05 = ** ). Bar graph depicting analysis of Bimolecular Florescence complementation (BiFC) where fluorescence signal is recorded when each component of the spliceosome (prey) was introduced to (D) human DNMT3A, (E) human DNMT3A R882H, (F) human DNMT3B (bait). 2 biologically independent experiments. Data shown represents mean values +/− SD.
Extended Data Fig. 8. Endogenous-tagging of DNMT3A and In situ interaction between DNMT3A and Splicing Factors.
(A) Western blot after introducing a flag-tag at the c-terminus of endogenous Dnmt3a in mESCs. (B) Immunofluorescence using anti-Flag antibody in Flag-DNMT3A cells versus Dnmt3a KO mESCs. (C) Expression of pluripotency factors in Flag-tagged mESCs compared to WT parental J1 cells (n = 2 biologically independent samples and experiments, mean values +/− SD). (D) Growth curves comparing proliferation rate of WT J1 (black) and flag-DNMT3A mESCs (blue), before and after stimulation with ATRA (n = 2 biologically independent samples and experiments). (E) Proximity Ligation Assay (PLA) of DNMT3A and DNA methyltransferases. (F) PLA of DNMT3A and inactive and active RNA polymerase II in ATRA-WT and ATRA-KO mESCs. Scale bars on all immunofluorescence images represent 10μm. (G) Co-immunoprecipitation (Co-IP) of DNMT3A before and after DNase and RNase treatment. (H) Chromatin Immunoprecipitation and sequencing (ChIP-seq) of DNMT3A before and after treatment with RNase A. (I) Box plot showing mean density of DNMT3A ChIP signal at all active genes and intronic read loci (*** = p < 0.01, n = 2 biologically independent samples). Scale bars on all immunofluorescent images represent 10μm. 2 biologically independent experiments were performed for panels A-G.
Extended Data Fig. 9. Deletion of DNMT3A in human donor stem cells.
(A) Schematic of control and sgDNMT3A edited CD34+ cord blood-derived stem cells transplanted into immunocompromised NSG mice. (B) We observed approximately 78-96% deletion efficiency across the five biological replicates as verified by amplicon sequencing. (C) Flow cytometry analysis of human progenitor cells in the bone marrow of three NSG recipient mice. Plots show expression of CD34 and CD38 in human cells (gated on hCD45) three months following injection of CD34+ cells from two experimental pairs (transfected with Cas9 only, or Cas9 and guides for DNMT3A. (D) qRT-PCR of exon 10 after electroporation of Cas9 only, or Cas9 and guides for DNMT3A in each of the 5 donor samples (error bars represent mean values +/− SD). (E) Gene Ontology (GO) enrichment analysis of mis-spliced genes in sgDNMT3A cells compared to Cas9 only CD34+ Donor HSPCs as compared to Dnmt3a WT and KO mouse HSCs (n = 2 donors, middle line, mean; top and bottom line, maxima and minima of range, respectively, two-tailed paired t-test). (F) RNA sequencing tracks of the Prpf19 locus in top WT (black) and KO (red) in mouse HSCs and bottom Cas9 (black) and sgDNMT3A (red) human HSPCs. Highlighted region in red is expanded to show increased IR in KO compared to WT HSCs. (G) RNA-sequencing tracks of the MAP3K7 locus in CD34+ cells from MDS patients with WT and Mutant SF3B1 compared with Cas9 and sgDNMT3A donor CD34+ cells. (H) qRT-PCR of NFKB and JAK-STAT pathway components in sgDNMT3A Donor HSPCs compared to Cas9 only. Error bars represent mean values +/− SD (n = 3 donors and independent experiments, unpaired t-test with Welch’s correction, ** p < 0.01, *** p < 0.001).
Extended Data Fig. 10. DNMT3A mutant leukemias are sensitive to splicing inhibition with Pladienolide B.
(A) AnnexinV apoptosis assay comparing DNMT3A WT (black) and DNMT3A mutant (red) cell lines (n = 3 biologically independent cell lines for WT, n = 2 biologically independent cell lines for mutant, *** p < 0.01 unpaired student’s t-test with Welch’s correction, error bars represent mean values +/− SD). (B) Western blot of isogenic WT and KO K562 cells (n = 2 biologically independent KO cells and 1 biologically independent WT cell). (C) Annexin V apoptosis assay comparing DNMT3A WT (black) and KO (red) in K562 cell lines (3 biological replicates, *** p < 0.01 unpaired student’s t-test, error bars represent mean values +/− SD). (D) Kaplan-Meier survival analysis of K562 WT and KO cells transplanted recipients after injection of vehicle or Pladienolide B (5mg/kg/day) for 5 days. Mice with less than 10% engraftment after 1.5 weeks were excluded. (n = 6 animals per group; Log-rank (Mantel-Cox) test; * p < 0.05, ** p < 0.01). (E) Bar plot of mRNA expression levels and apoptosis in WT and KO isogenic K562 cells (n = 2 biologically independent samples and 3 independent experiments) after shRNA-mediated knockdown of SF3B3. (F) Bar plot of mRNA expression levels and apoptosis in WT and KO isogenic K562 cells (n = 2 biologically independent samples and 2 independent experiments) after shRNA-mediated knockdown of U2AF1. (G) Upon exposure to activating stimuli, DNMT3A coordinates the upregulation of transcripts through increased splicing factor recruitment to RNA polymerase II and intronic pre-mRNA processing. Upon DNMT3A loss, stem cells are unable to effectively respond to activation signals due to impaired coordination of splicing components and efficiency of intron processing, which could negatively impact differentiation potential and alter stem cell fate.
Supplementary Material
Acknowledgements
We thank Antix Jain, Anna Malovannaya, and Sung Jung at the proteomics core at Baylor College of Medicine; Joel Sederstrom in the flow cytometry core; Taiping Chen at MD Anderson for providing Dnmt3a KO J1 6aa mouse ES cells; and Steven Kornblau at MD Anderson, Department of Leukemia for access to AML patient samples. This work was supported by NIH grants DK092883, CA183252, AG036695, F31DK113705, CA215226, CA186784, and CA125123. Also supporting this work were CPRIT (RP160884), the CDMPR/DOD Breast Cancer Research Program (1W81XWH1810573), the McNair Medical Institute, the Edward P. Evans Foundation, and the American Federation of Aging Research. BCM Mass Spectrometry Proteomics Core is supported by the Dan L. Duncan Comprehensive Cancer Center NIH award (P30 CA125123), CPRIT Core Facility Award (RP210227), and NIH High End Instrument award (S10 OD026804). In addition, this project was supported by the Cytometry and Cell Sorting Core at Baylor College of Medicine with funding from the CPRIT Core Facility Support Award (CPRIT-RP180672), the NIH (CA125123 and RR024574).
Footnotes
Competing Interests
The authors declare no competing interests.
References
- 1.Baldridge MT et al. , Quiescent haematopoietic stem cells are activated by IFN-γ in response to chronic infection. Nature 465, 793–797 (2010). [DOI] [PMC free article] [PubMed] [Google Scholar]
- 2.Essers MAG et al. , IFNα activates dormant haematopoietic stem cells in vivo. Nature 458, 904–908 (2009). [DOI] [PubMed] [Google Scholar]
- 3.Scheller M et al. , Hematopoietic stem cell and multilineage defects generated by constitutive β-catenin activation. Nat Immunol 7, 1037–1047 (2006). [DOI] [PubMed] [Google Scholar]
- 4.Wilson A et al. , Hematopoietic stem cells reversibly switch from dormancy to self-renewal during homeostasis and repair. Cell 135, 1118–1129 (2008). [DOI] [PubMed] [Google Scholar]
- 5.Tazikawa H et al. , Dynamic variation in cycling of hematopoietic stem cells in steady state and inflammation. J Exp Med 208, 273–284 (2011). [DOI] [PMC free article] [PubMed] [Google Scholar]
- 6.Yu VWC et al. , Epigenetic Memory Underlies Cell-Autonomous Heterogeneous Behavior of Hematopoietic Stem Cells. Cell 167, 1310–1322 (2016). [DOI] [PubMed] [Google Scholar]
- 7.Bick AG et al. , Inherited causes of clonal haematopoiesis in 97,691 whole genomes. Nature 586, 763–768 (2020). [DOI] [PMC free article] [PubMed] [Google Scholar]
- 8.Watson CJ et al. , The evolutionary dynamics and fitness landscape of clonal hematopoiesis. Science 367, 1449–1454 (2020). [DOI] [PubMed] [Google Scholar]
- 9.Genovese G et al. , Clonal hematopoiesis and blood-cancer risk inferred from blood DNA sequence. N Engl J Med 371, 2477–2487 (2014). [DOI] [PMC free article] [PubMed] [Google Scholar]
- 10.Jaiswal S et al. , Age-related clonal hematopoiesis associated with adverse outcomes. N Engl J Med 371, 2488–2498 (2014). [DOI] [PMC free article] [PubMed] [Google Scholar]
- 11.Jaiswal S et al. , Clonal hematopoiesis and risk of atherosclerotic cardiovascular disease. N. Engl. J. Med 377, 111–121 (2017). [DOI] [PMC free article] [PubMed] [Google Scholar]
- 12.Buscarlet M et al. , DNMT3A and TET2 dominate clonal hematopoiesis and demonstrate benign phenotypes and different genetic predispositions. Blood 130, 753–762 (2017). [DOI] [PubMed] [Google Scholar]
- 13.Xie M et al. , Age-related mutations associated with clonal hematopoietic expansion and malignancies. Nat Med 20, 1472–1478 (2014). [DOI] [PMC free article] [PubMed] [Google Scholar]
- 14.Pich O et al. , Discovering the drivers of clonal hematopoiesis. bioRxiv DOI: 10.1101/2020.10.22.350140 (2020). [DOI] [PMC free article] [PubMed] [Google Scholar]
- 15.McKerrell T et al. , Leukemia-associated somatic mutations drive distinct patterns of age-related clonal hemopoiesis. Cell Rep 10, 1239–1245 (2015). [DOI] [PMC free article] [PubMed] [Google Scholar]
- 16.Zink F et al. , Clonal hematopoiesis, with and without candidate driver mutations, is common in the elderly. Blood 130, 742–752 (2017). [DOI] [PMC free article] [PubMed] [Google Scholar]
- 17.Chen T et al. , Establishment and maintenance of genomic methylation patterns in mouse embryonic stem cells by Dnmt3a and Dnmt3b. Mol Cell Biol 23, 5594–5605 (2003). [DOI] [PMC free article] [PubMed] [Google Scholar]
- 18.Challen GA et al. , Dnmt3a is essential for hematopoietic stem cell differentiation. Nat Genet 44, 23–31 (2011). [DOI] [PMC free article] [PubMed] [Google Scholar]
- 19.Yang L et al. , DNMT3A in haematological malignancies. Nat Rev Cancer 15, 152–165 (2015). [DOI] [PMC free article] [PubMed] [Google Scholar]
- 20.Challen GA et al. , Dnmt3a and Dnmt3b have overlapping and distinct functions in hematopoietic stem cells. Cell Stem Cell 15, 350–364 (2014). [DOI] [PMC free article] [PubMed] [Google Scholar]
- 21.Jeong M et al. , Loss of Dnmt3a Immortalizes Hematopoietic Stem Cells In Vivo. Cell Rep 23, 1–10 (2018). [DOI] [PMC free article] [PubMed] [Google Scholar]
- 22.Mayle A et al. , Dnmt3a loss predisposes murine hematopoietic stem cells to malignant transformation. Blood 125, 629–638 (2015). [DOI] [PMC free article] [PubMed] [Google Scholar]
- 23.Wu H et al. , Dnmt3a-dependent nonpromoter DNA methylation facilitates transcription of neurogenic genes. Science 329, 444–448 (2010). [DOI] [PMC free article] [PubMed] [Google Scholar]
- 24.Banaszak LG et al. , Abnormal RNA splicing and genomic instability after induction of DNMT3A mutations by CRISPR/Cas9 gene editing. Blood Cells Mol Dis 69: 10–22. [DOI] [PMC free article] [PubMed] [Google Scholar]
- 25.Ladle BH et al. , De novo DNA methylation by DNA methyltransferase 3a controls early effector CD8+ T-cell fate decisions following activation. PNAS 113, 10631–10636 (2016). [DOI] [PMC free article] [PubMed] [Google Scholar]
- 26.Ghoneim HE et al. , De Novo Epigenetic Programs Inhibit PD-1 Blockade-Mediated T Cell Rejuvenation. Cell 170, 142–157 (2017). [DOI] [PMC free article] [PubMed] [Google Scholar]
- 27.Barwick BG et al. , B cell activation and plasma cell differentiation are inhibited by de novo DNA methylation. Nat Commun 15, 1900 (2018). [DOI] [PMC free article] [PubMed] [Google Scholar]
- 28.Zebley CC et al. , De novo DNA methylation programs regulate CAR T-cell exhaustion. J Immunol 204, Supplement 246.5 (2020). [Google Scholar]
- 29.Yoshihara H et al. , Thrombopoietin/MPL signaling regulates hematopoietic stem cell quiescence and interaction with the osteoblastic niche. Cell Stem Cell 1, 685–697 (2007). [DOI] [PubMed] [Google Scholar]
- 30.Walter D et al. , Exit from dormancy provokes DNA-damage-induced attrition in haematopoietic stem cells. Nature 520, 549–552 (2015). [DOI] [PubMed] [Google Scholar]
- 31.Dong S et al. , Chaperone-mediated autophagy sustains haematopoietic stem-cell function. Nature 591, 117–123 (2021). [DOI] [PMC free article] [PubMed] [Google Scholar]
- 32.Semrau S et al. , Dynamics of lineage commitment revealed by single-cell transcriptomics of differentiating embryonic stem cells. Nat Commun 8, 1096 (2017). [DOI] [PMC free article] [PubMed] [Google Scholar]
- 33.Maunakea AK et al. , Intragenic DNA methylation modulates alternative splicing by recruiting MeCP2 to promote exon recognition. Cell Res 23, 1256–1269 (2013). [DOI] [PMC free article] [PubMed] [Google Scholar]
- 34.Shukla S et al. , CTCF-promoted RNA polymerase II pausing links DNA methylation to splicing. Nature 479, 74–79 (2011). [DOI] [PMC free article] [PubMed] [Google Scholar]
- 35.Maor GL et al. , The alternative role of DNA methylation in splicing regulation. Trends Genet 31, 274–280 (2015). [DOI] [PubMed] [Google Scholar]
- 36.Liao J et al. , Targeted disruption of DNMT1, DNMT3A and DNMT3B in human embryonic stem cells. Nat Genet 47, 469–478 (2015). [DOI] [PMC free article] [PubMed] [Google Scholar]
- 37.Erb MA et al. , Transcription control by the ENL YEATS domain in acute leukaemia. Nature 543, 270–274 (2017). [DOI] [PMC free article] [PubMed] [Google Scholar]
- 38.Nabet B et al. , The dTAG system for immediate and target-specific protein degradation. Nat Chem Biol 14, 431–441 (2018). [DOI] [PMC free article] [PubMed] [Google Scholar]
- 39.Gowher H et al. , Mutational Analysis of the Catalytic Domain of the Murine Dnmt3a DNA-(cytosine C5)-methyltransferase. JMB 357, 928–941 (2006). [DOI] [PubMed] [Google Scholar]
- 40.Holz-Schietinger C et al. , Mutations in DNA Methyltransferase (DNMT3A) Observed in Acute Myeloid Leukemia Patients Disrupt Processive Methylation. JBC 287, 30941–30951 (2012). [DOI] [PMC free article] [PubMed] [Google Scholar]
- 41.Guo YE et al. , Pol II phosphorylation regulates a switch between transcriptional and splicing condensates. Nature 572, 543–548 (2019). [DOI] [PMC free article] [PubMed] [Google Scholar]
- 42.Caizzi L et al. , Efficient RNA polymerase II pause release requires U2 snRNP function. Mol Cell 81, 1920–1934 (2021). [DOI] [PubMed] [Google Scholar]
- 43.Lee SC et al. , Synthetic Lethal and Convergent Biological Effects of Cancer-Associated Spliceosomal Gene Mutations. Cancer Cell 34, 225–241 (2018). [DOI] [PMC free article] [PubMed] [Google Scholar]
- 44.Liu Z et al. , Mutations in the RNA Splicing Factor SF3B1 Promote Tumorigenesis through MYC Stabilization. Cancer Discovery DOI: 10.1158/2159-8290.CD-19-1330 (2020). [DOI] [PMC free article] [PubMed] [Google Scholar]
- 45.Seiler M et al. , H3B-8800, an orally available small-molecule splicing modulator, induces lethality in spliceosome-mutant cancers. Nat Med 24, 497–504 (2018). [DOI] [PMC free article] [PubMed] [Google Scholar]
- 46.Lee SC et al. , Modulation of splicing catalysis for therapeutic targeting of leukemia with mutations in genes encoding spliceosomal proteins. Nat Med 22, 672–678 (2016). [DOI] [PMC free article] [PubMed] [Google Scholar]
- 47.Bowling EA and Wang JH et al. , Spliceosome-targeted therapies trigger an antiviral immune response in triple-negative breast cancer. Cell 184, 384–403 (2021). [DOI] [PMC free article] [PubMed] [Google Scholar]
- 48.Huang Y et al. , Systematic profiling of DNMT3A variants reveals protein instability mediated by the DCAF8 E3 ubiquitin ligase adaptor. Cancer Discovery DOI: 10.1158/2159-8290.CD-21-0560 (2021). [DOI] [PMC free article] [PubMed] [Google Scholar]
- 49.Stroud H et al. , Early-Life Gene Expression in Neurons Modulates Lasting Epigenetic States. Cell 171, 1151–1164 (2017). [DOI] [PMC free article] [PubMed] [Google Scholar]
- 50.LaPlant Q et al. , Dnmt3a regulates emotional behavior and spine plasticity in the nucleus accumbens. Nat Neurosci 13, 1137–1143 (2010). [DOI] [PMC free article] [PubMed] [Google Scholar]
- 51.Lavery LA et al. , Losing Dnmt3a dependent methylation in inhibitory neurons impairs neural function by a mechanism impacting Rett syndrome. eLife 9, 1–27 (2020). [DOI] [PMC free article] [PubMed] [Google Scholar]
- 52.Rinaldi L et al. , Dnmt3a and Dnmt3b Associate with Enhancers to Regulate Human Epidermal Stem Cell Homeostasis. Cell Stem Cell 19(4): 491–501 (2016). [DOI] [PubMed] [Google Scholar]
- 53.Shen H et al. , Mouse totipotent stem cells captured and maintained through spliceosomal repression. Cell 184: 2843–2859 (2021). [DOI] [PubMed] [Google Scholar]
Associated Data
This section collects any data citations, data availability statements, or supplementary materials included in this article.
Supplementary Materials
Data Availability Statement
Sequencing data that support the findings of this study have been deposited in the Gene Expression Omnibus (GEO) under accession code GSE222906. Source data are provided with this study. All other data supporting the findings of this study are available from the corresponding author on reasonable request.


