Summary
Regulation of transcript structure generates transcript diversity and plays an important role in human disease1–7. The advent of long-read sequencing technologies offers the opportunity to study the role of genetic variation in transcript structure8–16. In this paper, we present a large human long-read RNA-seq dataset using the Oxford Nanopore Technologies platform from 88 samples from GTEx tissues and cell lines, complementing the GTEx resource. We identified just over 70,000 new transcripts for annotated genes, and validated the protein expression of 10% of novel transcripts. We developed a new computational package, LORALS, to analyse genetic effects of rare and common variants on the transcriptome via allele-specific analysis of long reads. We called allele-specific expression and transcript structure events, providing novel insights into the specific transcript alterations caused by common and rare genetic variants and highlighting the resolution gained from long-read data. We were able to perturb transcript structure upon knockdown of PTBP1, an RNA binding protein that mediates splicing, thereby finding genetic regulatory effects that are modified by the cellular environment. Finally, we use this dataset to enhance variant interpretation and study rare variants leading to aberrant splicing patterns.
Variation in transcript structure via RNA splicing and differences in the 5’ and 3’ untranslated regions (UTRs) is a key feature of gene regulation1. Disruption of transcript structure has a major role in human disease, with genetic variants associated with changes in splicing enriched in genome-wide associations for common diseases2–4 and implicated in many severe Mendelian diseases5–7. Common genetic variants affecting transcript structure can be mapped by transcript ratio and splicing quantitative trait locus (trQTL and sQTL) analyses that have further shown that genetic variants affecting gene expression levels and splicing tend to be distinct17–19. An orthogonal method to analyze genetic regulatory effects, allele-specific expression (ASE) analysis, has proven to be a highly sensitive method for studying rare genetic variants in cis20–22. However, the application of these approaches to short-read data relies on proxies for the full transcript structure and quantification, which are often inaccurate23–27. Furthermore, most metrics have focused on alternative splicing, leaving the role of UTRs obscure despite its demonstrated critical role in disease, within recent progress28–30. Long-read RNA sequencing technologies8,9 have now reached a mature stage, having already been used to study transcript structures10,11 and novel transcripts12–14, as well as early allele-specific analyses15,16. Allele-specific transcript structure (ASTS) analysis, enabled by long-read transcriptome data, could therefore provide important new information on how rare and common variants affect transcript structure and disease risk.
Overview of dataset
Altogether, cDNA from 90 samples from 56 donors and 4 K562 cell line samples were sequenced on the MinION and GridION ONT platforms. Fibroblast cell lines were used to test the platform and to assess the direct-cDNA versus PCR-cDNA RNA-seq protocols (Extended Figure 1A–C). Since the primary purpose of this study was to study allelic events, which require high coverage, we prioritized depth and sequenced the remaining samples using the PCR-cDNA protocol which does not require high RNA input and is preferred given the precious GTEx tissue samples. To evaluate the mRNA isolation protocol, we used the K562 cell lines (Extended Methods). The 90 GTEx samples included: 1) Assessment of replicability by five samples sequenced in duplicate and five samples in triplicate. Replicability was high (Spearman rho 0.86–0.95; Extended Figure 1D), leading us to merge the samples to increase depth; 2) The main dataset for analysis of transcriptome variation across tissues, consisting of 1–5 donors from 14 tissues; 3) Analysis of the effects of transcript perturbation by comparison of five GTEx fibroblast cell lines with and without PTBP1 RNA binding protein knockdown. Data were produced across two research centres (Extended Methods; Suppl. Table 1). All the GTEx samples had Illumina TruSeq short-read RNA-seq data and 85 samples (51 donors) had whole genome sequencing data made available by the GTEx Consortium4.
Principal component analysis (PCA) and hierarchical clustering of samples based on transcript expression correlation showed tissue clustering (Figure 1A,B and Extended Figure 1E), similar to the GTEx consortium analysis of short-read RNA-seq data4. Gene and transcript quantifications from long-read data were highly concordant with those from Illumina RNA-seq (median for genes and for transcripts; Figure 1C and Extended Figure 2A). Genes and transcripts with low correlation were enriched for lower expression in ONT data, higher complexity genes and transcripts with multiple exons (Extended Figure 2B–D). We manually checked the read coverage of some of the genes that displayed low correlation, such as PRELID1, which is better captured by ONT, and ARSB, which displays 3’ bias (Figure 1D). Overall, longer transcripts displayed higher 3’ bias, as assessed using only the mitochondrial transcripts (Methods; Figure 1E)14, and tissue-specific patterns were observed, such as shorter MT-ND5 in brain tissue and greater variability in cultured cell lines (Extended Figure 3).
Figure 1: Overview and quality control of the dataset.
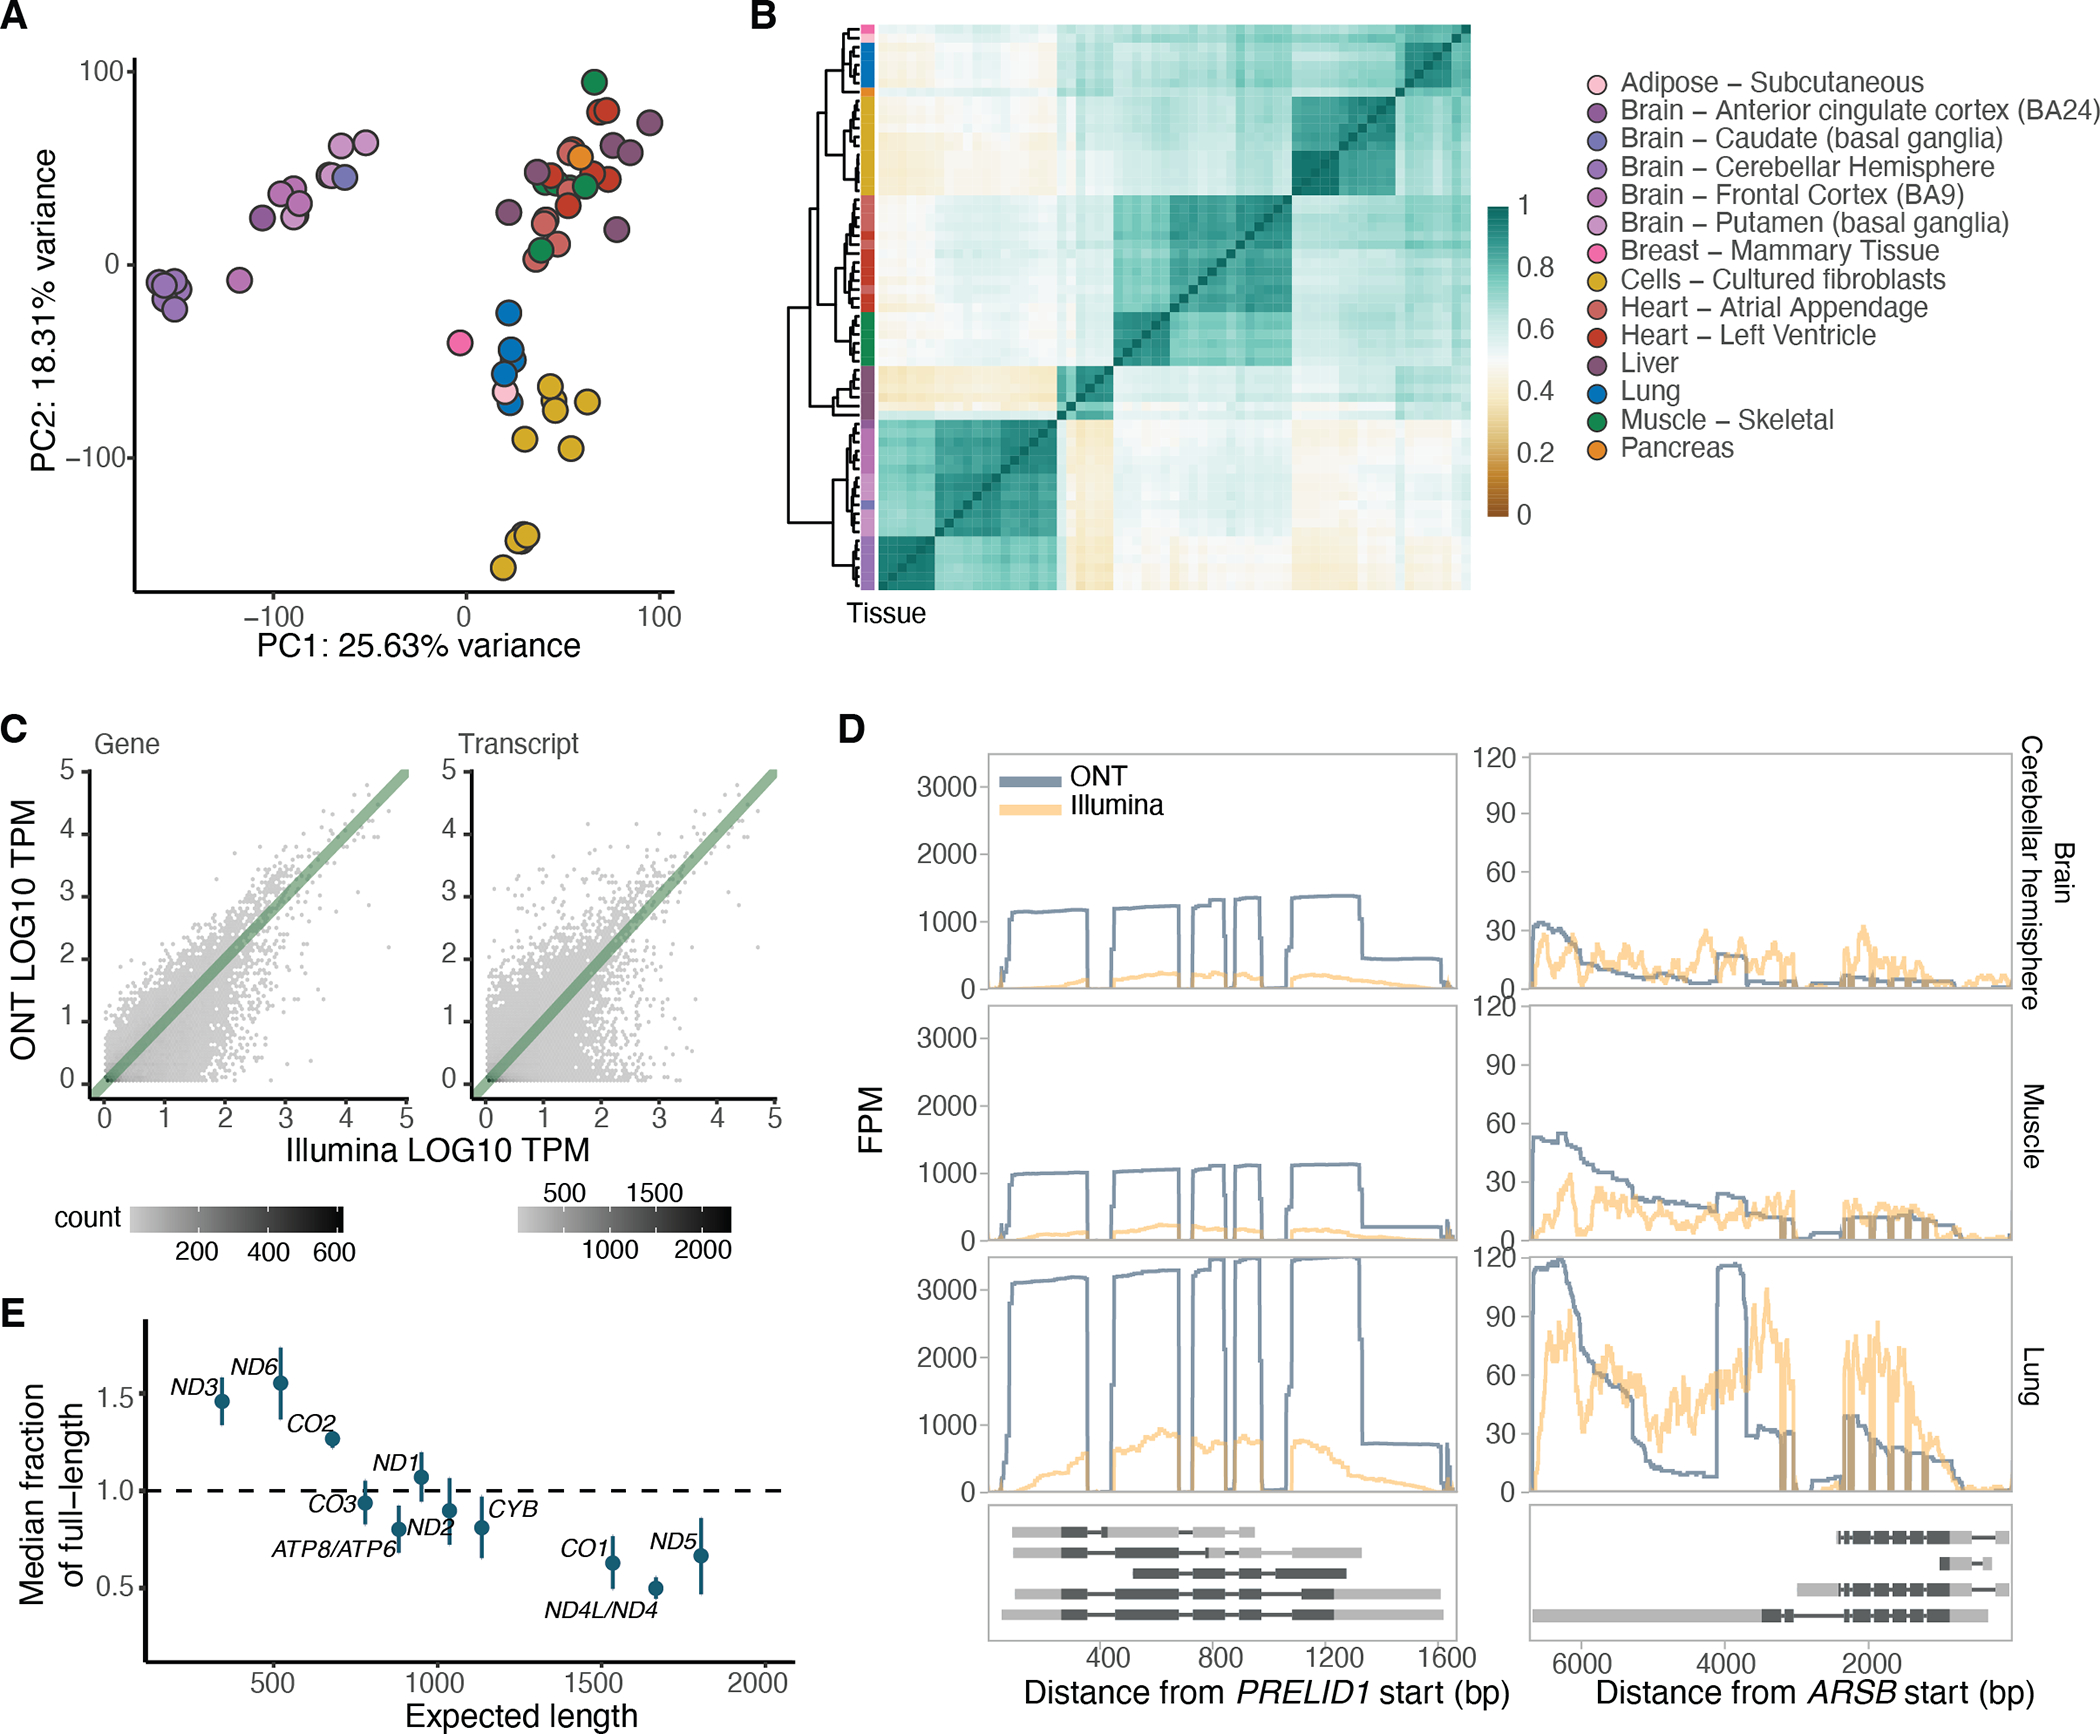
A) Principal component analysis of samples with replicates merged, without K562 cell lines and without PTBP1 knockdown samples, based on GENCODE transcript expression (>3 TPM in >5 samples). B) Hierarchical clustering of samples based on correlation of transcript expression (as in A), using Euclidean distance. C) Example of gene and transcript expression correlation between Illumina and ONT in the muscle tissue of GTEX-1LVA9. D) Two examples of genes displaying low correlation between ONT and Illumina. PRELID1 was better captured by ONT than Illumina, while ARSB had 3’ bias when assayed by ONT. They are shown across three different tissues and all protein-coding transcripts are plotted below. FPM: Fragments per million. E) Relationship between the expected transcript read length and the fraction of observed nanopore poly(A) RNA reads over the expected full length. Labels are for mitochondrial genes without the MT prefix. The transcript median was calculated per sample, and plotted is the median across all samples . Error bars represent standard deviation.
Discovery of novel transcripts
We used FLAIR31 to quantify transcripts and identify novel ones, defined as transcripts with intron chains not matching with any transcript in GENCODE (v26) (Methods). We found 93,718 transcripts across 21,067 genes (Suppl. Table 2), of which 77% were novel (Extended Figure 4A–C). In most cases we quantified one, often already annotated, transcript for a gene, while more novel transcripts were discovered in genes with a high number of annotated transcripts (Figure 2A). Of the novel transcripts, 47,678 shared at least one splice junction with annotated transcripts and 21,620 had intron retention. In fact, 87% of all intron retention events were novel (Figure 2B), which suggests the presence of pre-mRNA despite carrying out a poly-A enrichment step. On the other hand, only 37% of exon skipping events were novel, suggesting they are better represented in the existing annotations (Figure 2B). We compared our findings with the 33,984 transcripts defined by Workman et al.14 based on GM12878 cell lines using ONT direct and cDNA RNA-sequencing, which matched 13.1% of our transcripts, 3,604 of which were novel. Similarly, we compared our findings to the CHESS project, which identified 116,156 novel transcripts using short-read RNA-seq from multiple tissues, matching 32.6% of our transcripts, 10,630 of which were novel (Extended Figure 4D and Suppl. Table 3). Despite differences in tissue samples, sequencing method and parameters used to identify novel transcripts, these provide further evidence to support the identified transcripts.
Figure 2: Discovery of new transcripts and comparison between tissues.
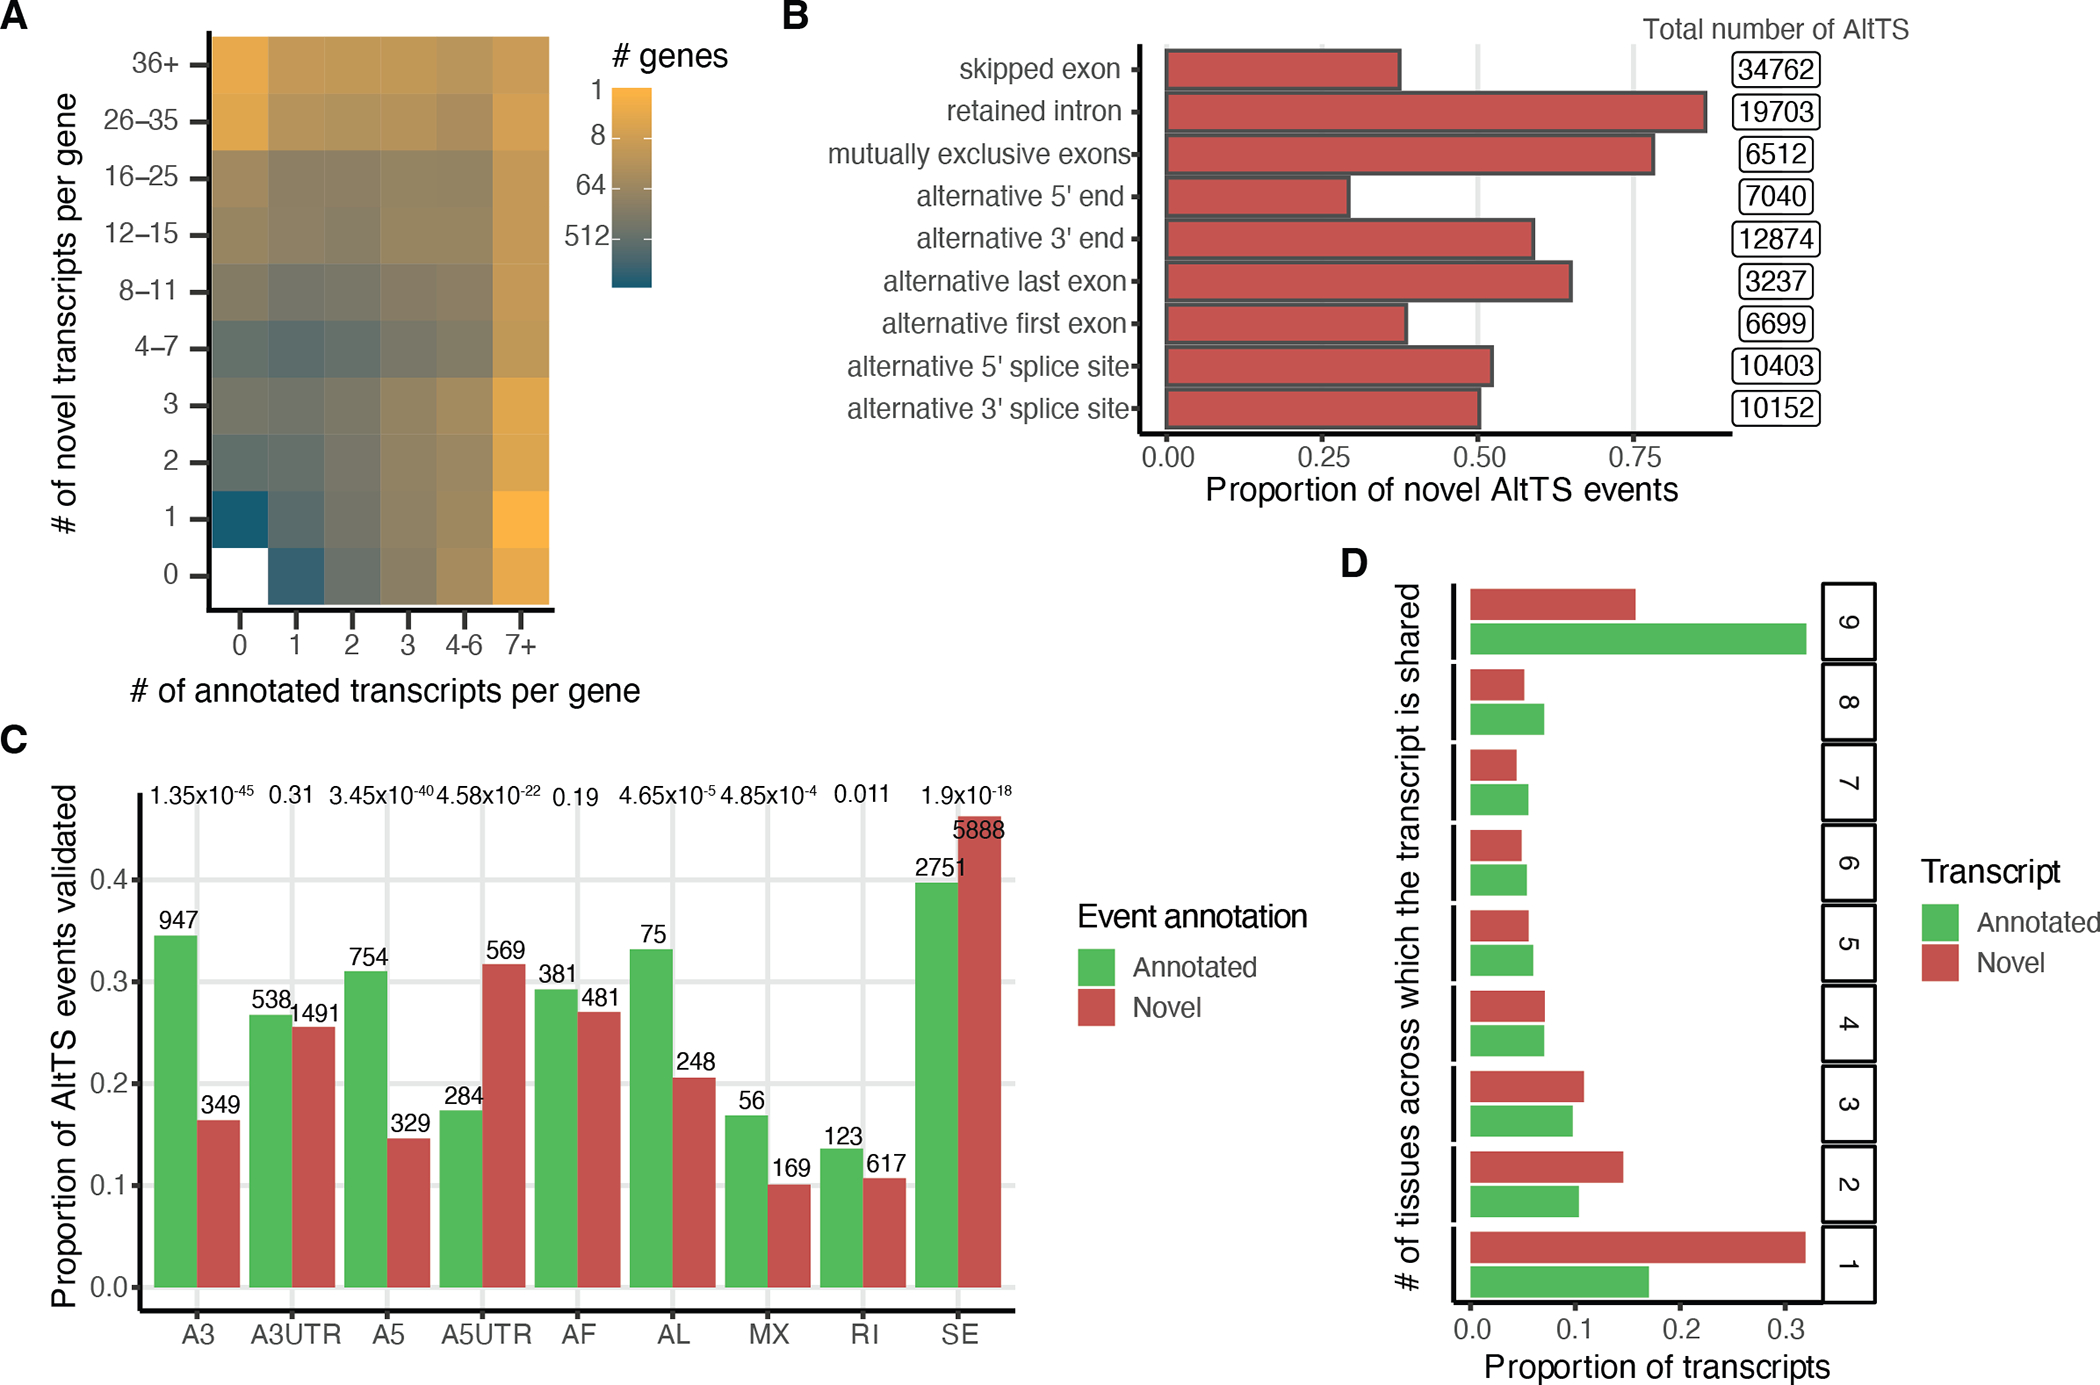
A) Number of annotated and novel transcripts per gene quantified in our dataset. B) Proportion of novel alternative transcript structure (AltTS) events across all quantified transcripts compared to GENCODEv26. C) Proportion of the AltTS events validated at the protein level by mass-spectrometry per novel or annotated. Enrichment was calculated using a two-sided proportionality test. D) Number of transcripts expressed at > 1 TPM in at least two samples and classified based on how many tissues express the transcript. A3: alternative 3’ splice site; A5: alternative 5’ splice site; AF: alternative first exon; AL: alternative last exon; A3UTR: alternative 3’ end; A5UTR: alternative 5’ end; MX: mutually exclusive exons; RI: retained intron; SE: skipped exon.
We validated our novel transcripts via proteome mass spectrometry data of 32 GTEx samples32. For most tissues a similar number of samples using long-read RNA-seq and proteomics were assayed, apart from brain tissue, where additionally the sub-regions between the two assays did not match (Suppl. Table 4). We limited this analysis to 33,251 transcripts (63% of which were novel) expressed at ≥5 TPM in a sample per tissue and tested for matches in the predicted amino-acid chain. Across tissues, 2,575 novel transcripts were validated with minimal effect from increasing the RNA abundance threshold (Extended Figure 5A–C and Suppl. Table 3). When compared to annotated alternative transcription events, higher validation was observed for novel alternative 5’ UTR and skipped exons, and both annotated and novel intron retention events showed low validation rates, but not different to each other (Figure 2C and Extended Figure 5D). This depletion could be partially explained by nonsense-mediated decay or other post-transcriptional events depleting protein products rather than poor quality of the transcript annotations. Alternative 3’ and 5’ splicing showed higher validation in annotated transcripts, suggesting that these types of events annotated by long reads might be due to technical limitations. For 608 genes we validated more than one transcript (1,304 total), with 823 transcripts being novel, often detecting tissue-specific protein transcript validation (Suppl. Table 5 and Extended Figure 5E).
Novel transcripts resulted in clearer clustering of samples by tissue based on transcript expression correlations and PCA (Extended Figure 6A,B), suggesting that novel transcripts capture tissue-specific expression patterns. We therefore examined the gene and transcript expression across nine tissues with at least five samples. Highly-expressed (>1 TPM) novel transcripts were tissue-specific, with 31.5% expressed in a single tissue (Figure 2D and Extended Figure 6C). This may explain their absence in existing annotations and highlights the potential for characterizing tissue-specific gene expression and regulation with long-read transcript analysis. We found thousands of transcripts exclusively expressed in a single tissue or having different transcript ratios across all nine tissues (Extended Figure 7). The tissues with the highest ratio of tissue-specific transcripts were the cerebellar hemisphere, liver and fibroblasts (8% of all differentially expressed transcripts), concordant with previous observation of high transcript diversity33,34.
Allele-specific analysis
Allele-specific analysis captures cis-regulatory genetic effects on expression and transcript structure17. The expression of a gene or a transcript is quantified for each haplotype of a sample, separated based on the allele at a heterozygous site. Sixty-four of the long-read RNA-seq samples also had phased whole genome sequencing information from GTEx4, which allowed us to carry out allelic analysis. To address local alignment biases caused by sequencing errors adjacent to the variant sites of interest, we developed an alignment pipeline where two haplotype-specific references are created for each donor (Extended Figure 8). To perform allele-specific expression (ASE) and allele-specific transcript structure (ASTS) analysis, where we test the relative usage of a transcript in relation to the other transcripts of the same gene (Figure 3A), we developed a new software package, LORALS (Long-Read Allelic analysis). In addition to adopting mappability and genotyping error filters previously developed for short-read data35, we introduced flags addressing the higher error rate of long-read data (Methods; Extended Figure 9). We performed power calculations using simulated data to test how read counts, number of transcripts, and effect size affect ASTS detection power (Methods; Extended Figure 10A).
Figure 3: Allelic analysis of long-read data.
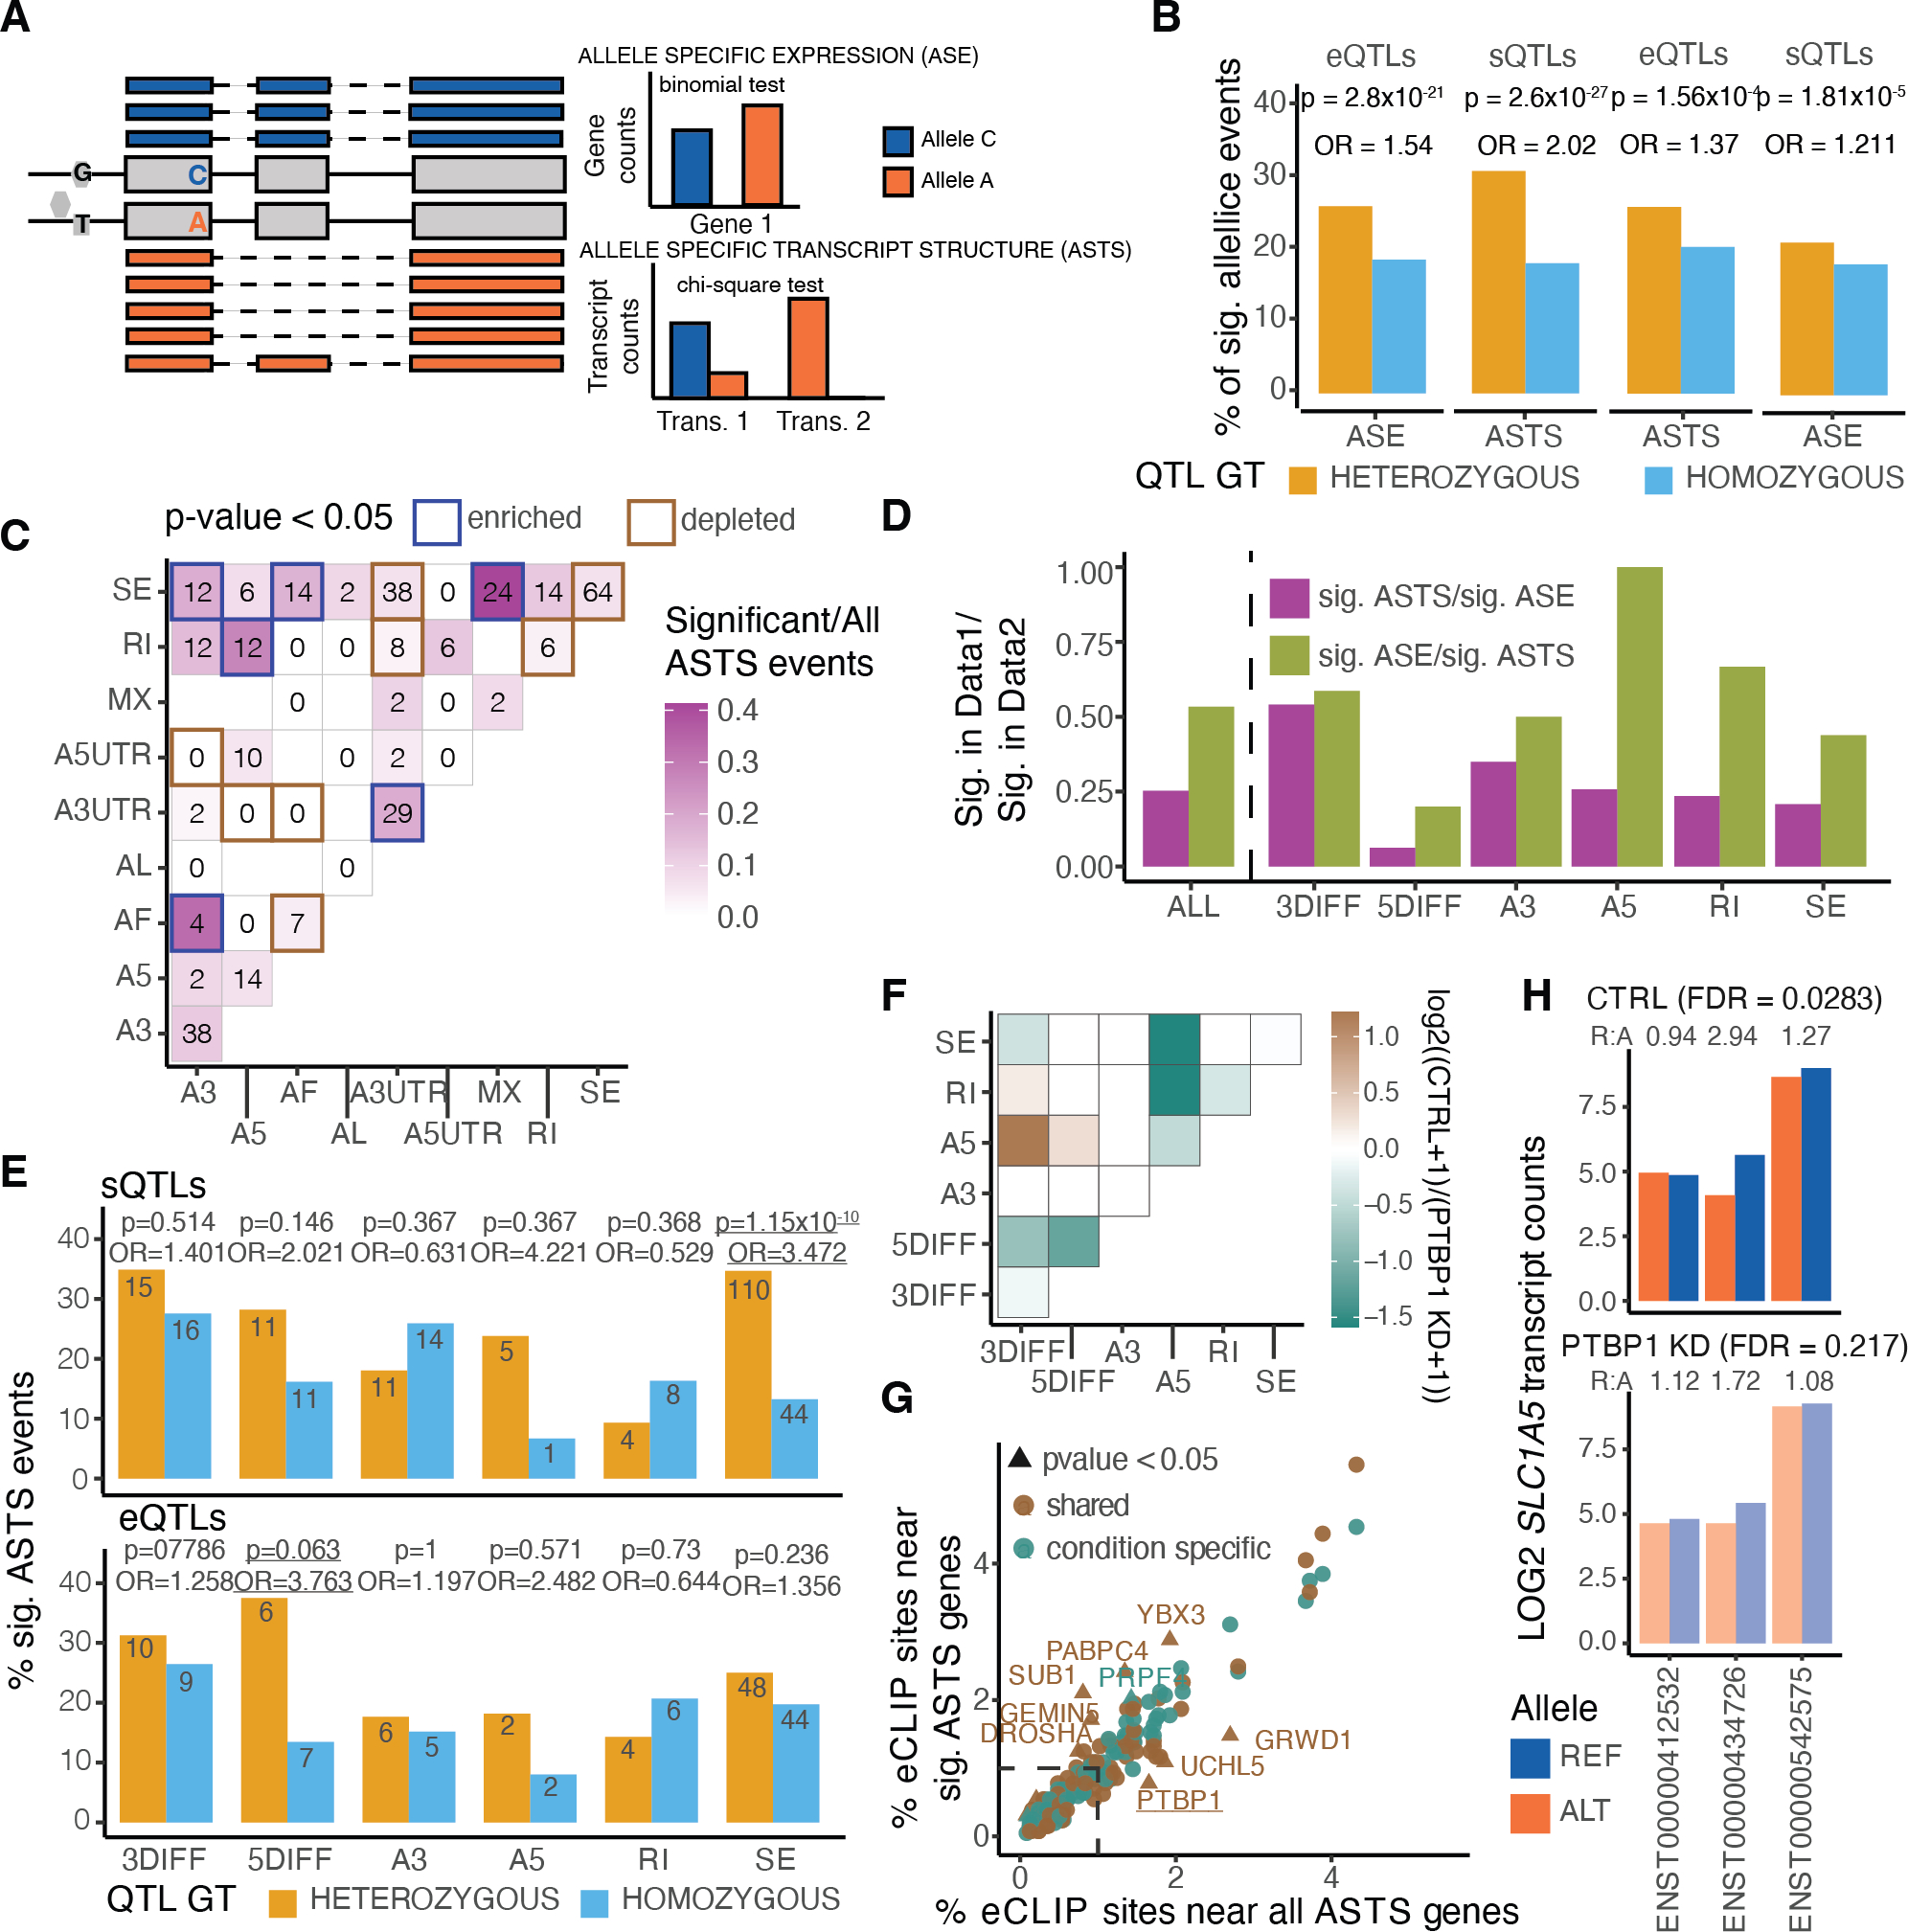
A) Illustration of allele specific analysis framework, data input and testing performed. B) Percentage of significant allele specific expression and transcript structure events for samples that are heterozygous or homozygous for a lead eQTL or sQTL variant for that gene. P-values from two-sided Fisher’s exact test. C) Co-occurrence of alternative transcript structure events within the transcripts used for ASTS analysis that are observed at least once per each event (or a single time for the diagonal) in a given gene. P-values from two-sided binomial test. D) Sharing of ASE and ASTS events for all events, and stratified by AltTS event. E) Percentage of significant ASTS for samples that are heterozygous or homozygous for a lead eQTL or sQTL variant for that gene, respectively, by type of event based on whether at least 50% of the differences in transcript can be assigned to that AltTS event. P-values from two-sided Fisher’s exact test. F) Changes in ASTS by PTPB1 knockdown, with the heatmap showing the co-occurrence of alternative transcript structure events that are observed at least once per each event (or a single time for the diagonal) in a given gene. Color corresponds to the log2 ratio of the number of events found in the control (CTRL) over PTBP1 knockdown (KD) samples. G) Percentage of eCLIP sites near genes tested for ASTS, annotated using a 10kb window. Genes stratified into shared or condition specific based on the overlap between control and PTBP1 knockdown. Marked are sets of peaks with p-value < 0.05 using a two-sided binomial test. H) Example of a gene, SLC1A5, where transcript read counts display significant ASTS only in the PTBP1 knock-down sample.
Having established and optimized our pipeline, we performed the analysis using the FLAIR-aligned transcripts. Per sample, an average of 8.9% of genes analysed for ASE and 7.7% of genes analysed for ASTS had a statistically significant event, with the discovery being proportional to the library size. To maximize power for generalizable insights, we analysed all ASE (3,437 significant out of 36,077 across 6,680 unique genes) and ASTS events (331 significant out of 3,858 across 1,207 unique genes) combined across samples (Extended Figure 10B). For 77% of genes analysed for ASTS we quantified and tested the counts of 2 transcripts per gene, while the remaining ranged between 3 and 14 (Extended Figure 10C). Per tissue, 71% of the genes were tested for ASTS in a single donor (Extended Figure 10D). Within the remaining 29%, there were 47 genes which consistently displayed ASTS across donors within a tissue (Suppl. Table 6). Most of these had over two highly expressed transcripts (Binomial test p-value = 3.2×10⁻⁴), suggesting that they can withstand variability.
Comparing the long-read ASE events to the ones reported for short-read GTEx v8 data35, we observed moderate concordance when looking at the p-values in short-read data using the long-read significant ASE events and vice-versa (Extended Figure 11A). Of the 341 events that were significant in both datasets, 83% had the same direction of effect, opposite direction mostly observed in fibroblast cell lines that were passaged since Illumina sequencing was carried out (Extended Figure 11B–E). Differences were explained by low read depth and some variants being filtered out in one of the datasets (Extended Figure 11F), for example, 445 variants with significant ASE in long-read data were filtered in short-read data due to the mapping bias flag. Next, we sought to establish that ASE and ASTS recapitulate genetic regulatory effects of expression and splicing QTLs (eQTL and sQTL) mapped by GTEx4. Individuals who are heterozygous for a QTL lead SNP are expected to show increased allelic imbalance compared with those who are homozygous, and such significant enrichments were observed in the data (Figure 3B).
Classification of alternative transcript structure (AltTS) changes enables better understanding of the nature of the ASTS events, and thus genetic variants affecting transcript structure. When considering each AltTS event alone, the most common was exon skipping, followed by alternative 3’ splice sites and 3’ UTR events that were enriched for significant ASTS (Extended Figure 12A). To support this, we found that variants located in the 3’ end were more likely to lead to significant ASTS events, compared to 5’ end variants (chi-square p-value = 2.46×10⁻⁴; Extended Figure 12B). We then examined the combination of two types of AltTS events per gene (Figure 3C). We observed that certain AltTS events co-occurred more commonly in genes with significant ASTS, compared to all events. For example, the combination of mutually exclusive exons with exon skipping (binomial test p-value = 2.05×10⁻⁸). On the other hand, there were combinations that were depleted from significant ASTS events, notably the combination of alternative 3’ UTR with any other event. This highlights the distinct effect of alternative UTR regions within the significant ASTS genes, missed in most sQTL mapping approaches.
To better understand the relationship between genetic effects on expression and transcript structure, we compared the ASE and ASTS events. We found that 222 of the 880 significant ASE genes displayed significant nominal p-values in ASTS . This proportion was larger when looking at significant ASTS, where we found that 176 of the 330 genes displayed significant nominal p-values in ASE (π; Figure 3D). This indicates that changes in transcript structure are often accompanied by changes in transcript levels, but less often the other way around. When repeating this analysis stratified by AltTS events we observed that an exception to this were ASTS events caused by alternative 3’ ends, where an equal proportion of events were ASE and ASTS (Figure 3D).
Based on these observations, we examined sQTL-significant genes in ASE, where we observed a difference between heterozygous and homozygous individuals (Fisher’s exact test p-value=1.81×10⁻⁵). When looking at eQTLs, we also observed that more heterozygous donors had significant ASTS compared to homozygous (Fisher’s exact test p-value=1.56×10⁻⁴; Figure 3B), indicating that genetically induced expression differences manifest in ASTS. To test the origin of this, we stratified the events by the AltTS events. We observed that the sQTLs were mostly manifesting in differences in exon skipping (34.2%; Figure 3E), as expected, while eQTLs were manifesting not only in total expression differences but also in transcript structure changes of the 5’ end of a gene (33.3%; Figure 3E). Differences in the 5’ end of a gene are therefore driving the capture of eQTLs in ASTS data, which would be normally missed by sQTL mapping.
This breakdown of events allows us to revisit existing sQTLs and find examples where ASTS data enables better understanding of the exact molecular events associated with the genetic variant, potentially contributing to diseases and traits (Methods; Suppl. Table 7). DUSP13, for example, is a gene specifically expressed in muscle, and has three sQTL intron excision phenotypes colocalizing with a single locus associated with body fat percentage4. Multiple transcripts arise from this gene, but in both donors displaying ASTS we observed that the transcript ENST00000372700 lacking four middle exons was more highly expressed from the risk allele (Extended Figure 12C). As further validation, GTEx short-read transcript ratios recapitulated this pattern (Extended Figure 12D). We were therefore able to pinpoint to the exact events leading to differences in transcript expression from the two alleles and potentially predisposing to high body fat percentage.
To test how ASTS captures changes in the effects of cis-regulatory variants due to perturbation of the cell’s splicing machinery, we knocked down PTBP1 RNA binding protein (RBP) in five GTEx fibroblast cell lines. PTBP1 mediates exon skipping in pre-mRNAs and is involved in the 3′-end processing of mRNA. We therefore expected to see a disturbance of transcript expression as well as ASTS patterns for some genes upon siRNA knockdown. Indeed, we found 3,061 differentially expressed genes, 70% of which were validated with short-read data, and 4,220 differentially expressed transcripts (Extended Figure 13A,B). Exon exclusion and longer alternative 3’ UTR events were enriched in transcripts significantly upregulated in PTBP1 knockdown samples (Extended Figure 13C).
We then compared allelic events in the knockdown and control samples (Methods and Extended Figure 14A). We observed different transcript processing events between the two conditions, indicating that heterozygous genetic variants driving the ASTS in control samples lose their effect in the absence of PTBP1 (Extended Figure 14B). To increase our power, we re-sequenced the same samples on the PromethION platform, resulting in a minimum 22 million reads per sample. We re-identified allelic imbalance for 87% of the ASE events and 58% of the ASTS events (Extended Figure 14C). We observed an enrichment of condition-specific events in ASTS compared to ASE (Fisher’s exact test p-value = 2.89×10⁻¹⁰; Extended Figure 14D), consistent with the fact that PTBP1 affects splicing and not gene expression at the allelic level. The control samples were enriched for ASTS with 3’ end differences combined with alternative 5’ splice sites, while alternative 5’ splice sites combined with exon skipping or intron retention were enriched in knockdown-specific ASTS (Figure 3F).
We hypothesized that condition-specific ASTS events upon RBP knockdown might reflect different regulation modes than those that are shared. We expect those to be driven by heterozygous variants within RNA binding protein sites detectable in eCLIP peaks36 (Suppl. Table 8). We focused on the genes with at least one heterozygous variant falling in an eCLIP site (82% of ASTS genes), and tested whether specific RBPs were differentially enriched near significant ASTS genes that were specific to a condition or shared. PTBP1 sites harbouring heterozygous variants were depleted from ASTS events shared between the two conditions (p-value = 0.0087; Figure 3G), concordant with the expectation that these events are driven by PTBP1 independent processes. We discovered 35 condition-specific ASTS events with PTBP1 eCLIP peaks, equally distributed between the control and the knockdown. For example, in SLC1A5, a donor has a heterozygous site within a PTB1 eCLIP site and ASTS that is attenuated upon PTPB1 knockdown (Figure 3H and Extended Figure 14E). These analyses are consistent with a model where changes in the that changes in the cellular environment altering splicing regulation can affect the molecular function of genetic variants.
Rare variant interpretation
Finally, we evaluated the potential to better interpret rare variants with novel transcript annotations and ASTS data from long reads. We complemented the GENCODE v26 annotation with an additional 73,599 transcripts, and reannotated genetic variants from GTEx WGS data using VEP37 (Methods). The most severe consequence for a variant changed for 0.75% of all variants (Extended Figure 15A), 16,435 of which were coding (3.27% of coding variants). We used CADD scores as a proxy for the pathogenicity of a variant and as further support for validity of the re-classifications. We observed that variants reassigned to a more severe consequence had on average a higher CADD score than those that retained the same annotation (Figure 4A and Suppl. Table 9). An exception to this were variants previously annotated as non-coding transcript exons and reassigned as coding but assigned a lower CADD score, suggesting that some of the novel transcripts we identify might not be coding. The higher CADD scores for variants reassigned as pathogenic provides independent evidence that our novel transcripts detect real biology and functional variants that may have been missed before. We therefore re-annotated ClinVar variants, resulting in the reassignment of 9,582 variants (1.23%). We observed that variants with uncertain benign or pathogenic clinical significance and no assertion criteria were reassigned at the highest rate (4% and 3.1%), while pathogenic variants with higher reviewer support were reassigned at the lowest rates (Extended Figure 15B). This provides an explanation for the conflicting reports of these variants and a potential pathogenic mechanism.
Figure 4: Variant interpretation through novel transcripts and allele-specific transcript structure analysis.
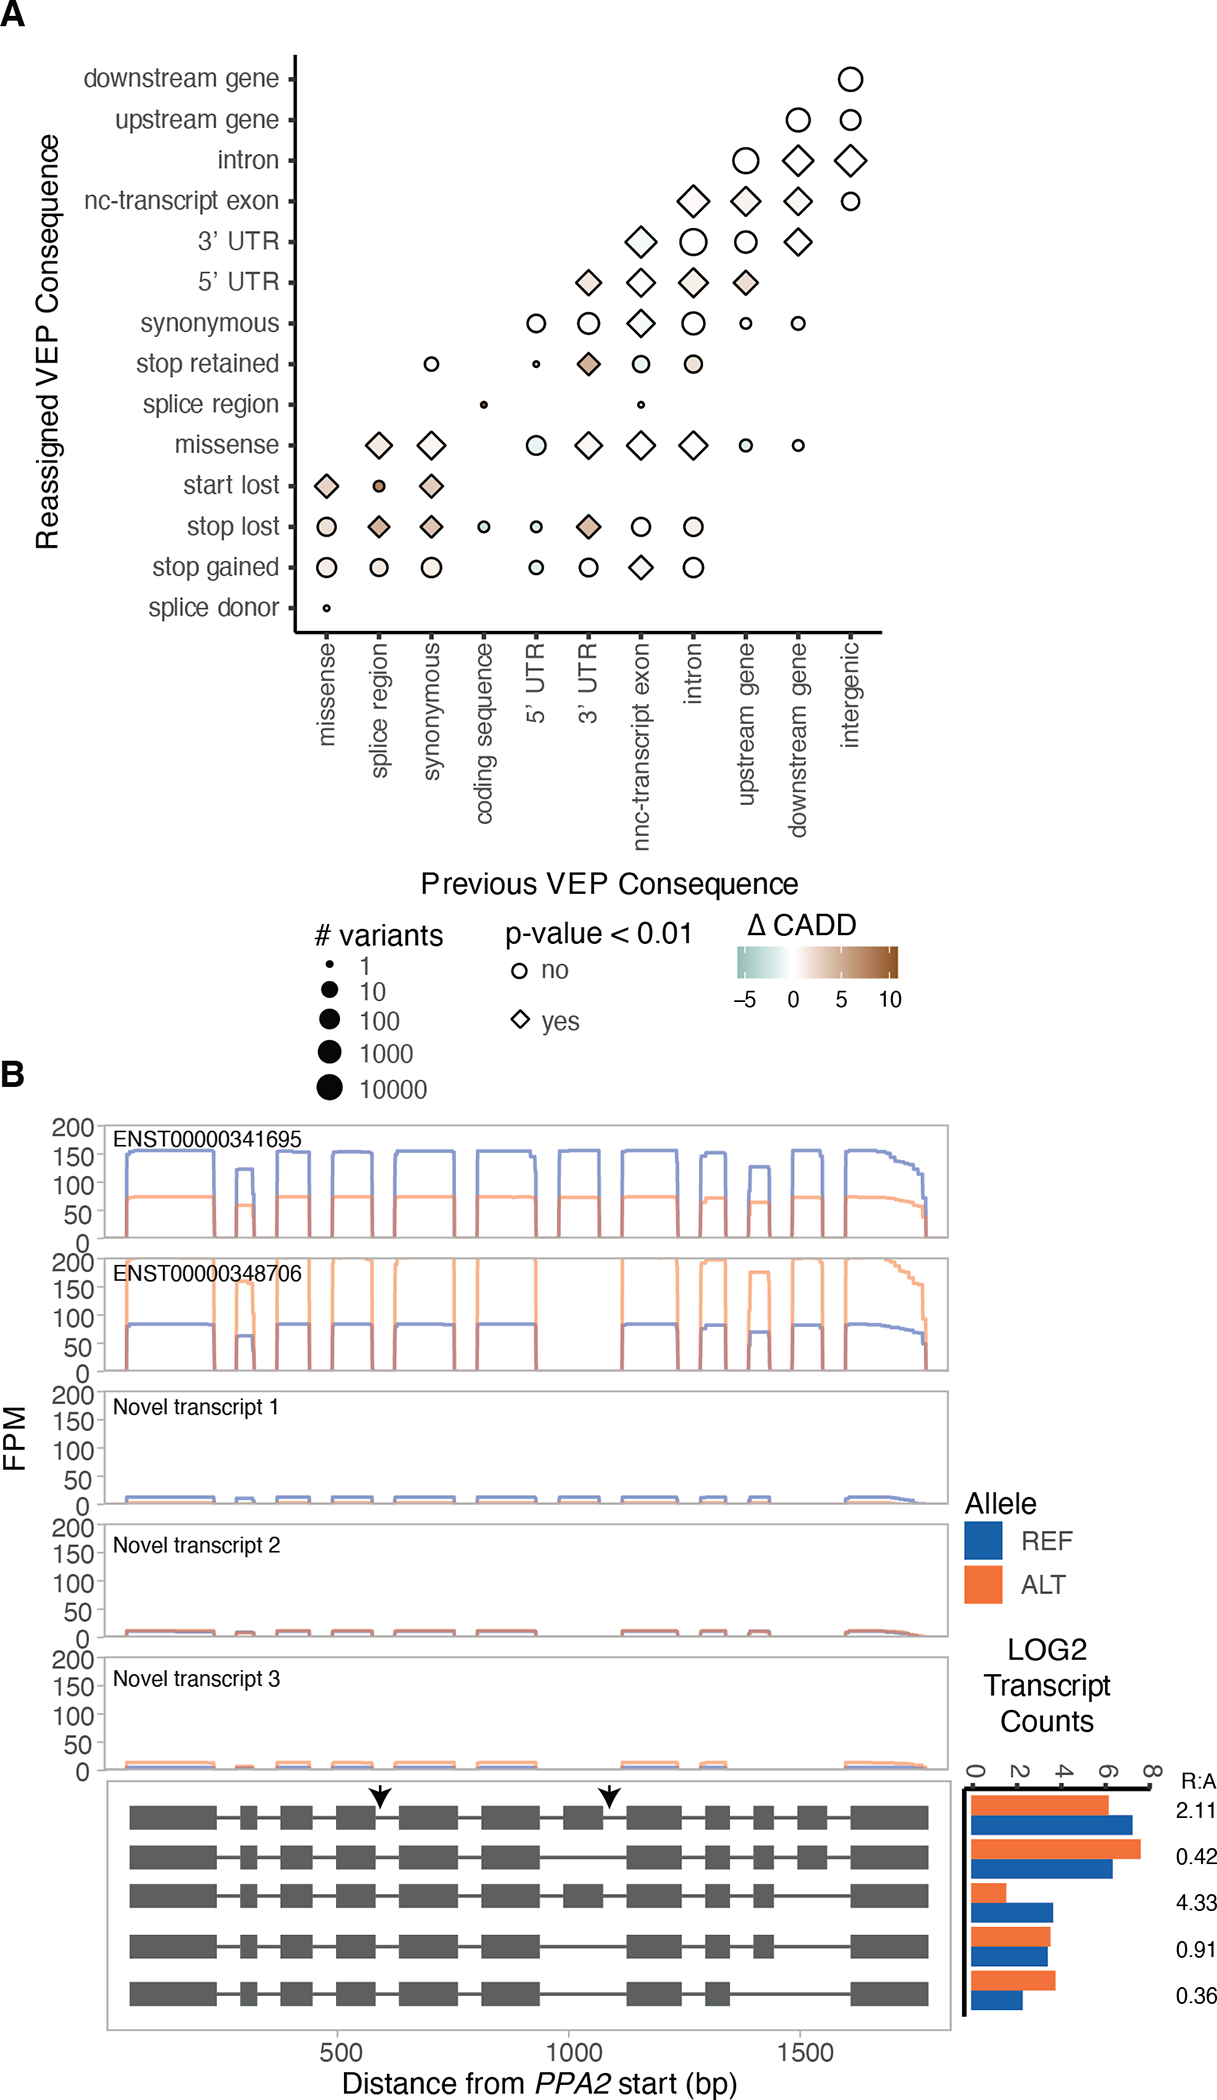
A) Difference in the mean CADD score of variants that were reassigned to a more severe consequence when the GENCODE gene annotations were complemented with the novel FLAIR transcripts, compared to variants that retained their annotation (down sampled to a similar size). P-values from two-sided t-test. B) PPA2 is an example of a gene with a rare heterozygous variant in a sample that is a GTEx splicing outlier and has significant ASTS, with read pileups, and grey arrows indicating the rare variants.
Long-read allelic data provides the opportunity to observe rare variants disrupting transcriptional regulation. GTEx has previously defined individuals that are extreme ASE, expression and splicing outliers, and shown that they are enriched for having rare genetic variants in the gene’s vicinity22,38. While our sample size is insufficient for analogous analysis of ASTS outliers, we tested the presence of rare (MAF<0.01) heterozygous variants within a 10kb window of each ASTS gene. Across all samples, missense variants were enriched for being in significant ASTS genes compared to all genes measured for ASTS (Extended Figure 15C,D). This indicates that ASTS can capture rare variant effects on transcript structure. Additionally, we observed that significant ASTS genes were enriched within splicing outliers (Extended Figure 15E). Finally, we searched for specific examples where a rare variant is likely causing ASTS in our data (Suppl. Table 10). Out of eleven genes where an individual has a rare heterozygous variant, is a splicing outlier as defined by GTEx, and has significant ASTS, we highlight two examples: PPA2 has two intron variants chr4:105409456:G:A and chr4:105449015:G:A (MAF = 5.97×10⁻⁴ and 9.55×10⁻³) with the alternative allele having higher expression levels of transcript ENST00000348706 and lower expression of ENST00000341695 (Figure 4B) and NDUFS4 (Extended Figure 15E,F).
Long-read allelic data provides the opportunity to observe rare variants disrupting transcriptional regulation. GTEx has previously defined individuals that are extreme ASE, expression and splicing outliers, and shown that they are enriched for having rare genetic variants in the gene’s vicinity22,38. While our sample size is insufficient for analogous analysis of ASTS outliers, we tested the presence of rare (MAF<0.01) heterozygous variants within a 10kb window of each ASTS gene. Across all samples, missense variants were enriched for being in significant ASTS genes compared to all genes measured for ASTS (Extended Figure 15C,D). This indicates that ASTS can capture rare variant effects on transcript structure. Additionally, we observed that significant ASTS genes were enriched within splicing outliers (Extended Figure 15E). Finally, we searched for specific examples where a rare variant is likely causing ASTS in our data (Suppl. Table 7). Out of eleven genes where an individual has a rare heterozygous variant, is a splicing outlier as defined by GTEx, and has significant ASTS, we highlight two examples: PPA2 has two intron variants chr4:105409456:G:A and chr4:105449015:G:A (MAF = 5.97×10⁻⁴ and 9.55×10⁻³) with the alternative allele having higher expression levels of transcript ENST00000348706 and lower expression of ENST00000341695 (Figure 4B) and NDUFS4 (Extended Figure 15E,F).
Discussion
In this study, we present the largest dataset of long-read RNA-seq to date, using material derived from cell lines and human tissues collected by the GTEx project. We identified 71,735 novel transcripts, which is higher than any other long-read study12–14 likely due to our large sample size and tissue diversity, which is consistent with the high number of tissue-specific novel transcripts discovered. Supported by a high validation rate of the novel transcripts in high-throughput mass spectrometry proteome data32, our data makes an important contribution to human transcript annotations. Expanding long-read studies to further tissues and cell types, coupled with more extensive validation efforts, will enable better understanding of regulatory mechanisms of different types of transcript changes12, functionally distinct protein isoforms that different transcripts can give rise to39, and improved variant annotation, as demonstrated by our analysis.
Long reads provide the ability to map allelic effects over transcripts, instead of just expression40, thus providing the opportunity to analyze cis effects of genetic variants on transcripts. We developed LORALS, a toolkit for allelic analysis specific to long reads, considering various biases inherent to the technology. It is tuneable and applicable to any long-read data, improving on previous work in this field14,15. We observed that the majority of ASTS events coincided with ASE, indicating that genetic effects on transcript usage rarely happen by reciprocally flipped transcript expression, but are typically accompanied by change in total expression levels which could happen for example via altered stability of specific transcripts41. However, the widespread co-occurrence of ASTS with ASE as well as eQTLs manifesting as ASTS are seemingly at odds with multiple QTL mapping studies that have established that expression and splicing are affected by distinct regulatory variants and processes3,4,17. The ability to distinguish the exact alternative transcript structure events in ASTS data allowed us to discover allele-specific 5’ differences as the cause of eQTLs manifesting in transcript structure changes, while expression and splicing are indeed highly independent. Given that promoter differences greatly affect gene expression levels and that most sQTL mapping methods do not capture variation in UTRs, this explains both the low overlap between causal variants of sQTLs and eQTLs and the overlap of ASTS with ASE and eQTLs.
These results reinforce the emerging understanding29 of the importance of analysing the transcriptome not at the level of genes or imprecisely defined splicing, but rather with a detailed characterization of specific transcripts, their changes and combinations. These insights are readily captured by long-reads. Given the role of genetic variants affecting transcript structure in disease risk2–4,42,43, we anticipate that a high-resolution characterization of the transcriptome with long-read data will be an important approach for the discovery of regulatory mechanisms of disease-associated variants.
Methods
Fibroblasts cell culture and PTBP1 siRNA transfection
Fibroblast cell lines derived from skin samples from the lower leg and biobanked as part of the GTEx Consortium were cultured in DMEM media supplemented with 10% FBS and 1% Penicillin/Streptomycin (Corning). Transfections were performed 24h after initial seeding of 500,000 cells in 10cm dishes. Transfection mixtures were prepared with 6μg per dish of siRNA pools (Dharmacon SO-2720501G, SO-2703775G), Lipofectamine 2000 (Thermo Fisher), and Opti-MEM reduced serum media (Corning) according to proprietary guidelines. Mixtures were added to cell cultures containing reduced volumes of 5ml DMEM media for 6 hours before increasing volumes to 10ml with fresh media. Cells were harvested 96h after transfection.
SDS-PAGE and Western Blotting
Protein was extracted by boiling 75,000 cells at 95°C for 5 minutes in 100 μl 2 x Laemmli Sample Buffer (Bio-Rad) and 2-mercaptoethanol (5%) as a reducing agent. SDS-PAGE was run on 10% Mini-PROTEAN TGX gels (Bio-Rad) in Tris/Glycine/10%SDS Buffer. Proteins were transferred onto nitrocellulose membranes. 5% nonfat milk was used for blocking. Primary antibodies from mouse for PTBP1 (used in 1:4,000 dilution; Thermo Fisher Scientific) and rabbit for GAPDH (used in 1:10,000 dilution; Cell Signaling Technology) were incubated overnight at 4°C. Secondary antibodies (LI-COR IRDye; donkey anti-mouse IgG polyclonal antibody (800CW; Size=100 μg) and donkey anti-rabbit IgG polyclonal antibody (680RD; Size=100 μg) were incubated for 1h at room temperature (RT). Membranes were imaged on the Li-cor Odyssey CLx.
Generation of long-read RNA-seq data
Generally following the manufacturer’s instructions, the protocol detailed in Supplementary Methods was utilized.
Sequencing and basecalling
Libraries were prepared with 300ng of input total RNA using the Illumina TruSeq kit and sequenced on the NextSeq 550 platform. Sequencing of mRNA samples was performed on the GridION X5 and MinION platform (Oxford Nanopore Technologies) for 48 hours. To basecall the raw data we used ONT’s Guppy tool (v3.2.4).
Genome and transcriptome alignments
We used minimap2 version 2.1145 to align the reads to the GRCh38 human genome reference using -ax splice -uf -k14 –secondary=no parameters. We also aligned to the GENCODE v26 transcriptome using -ax map-ont parameters. We used NanoPlot46 to calculate alignment statistics. We obtained a median of 6,343,016 raw reads per sample, of which on average 80% (s.d. 16%) aligned to the genome (Extended Figure 1A). The median read length was 709bp and 789bp for raw and aligned reads, respectively (Extended Figure 1B). We observed a higher median read length in samples sequenced using the direct-cDNA ONT protocol when compared to the PCR-cDNA protocol (t-test p-value = 0.022), at the expense of lower read depth (t-test p-value = 6.45×10⁻³) (Extended Figure 1C).
We used the method outlined in Workman et al.28 to calculate 3’ bias in our data which only focuses on reads assigned to transcripts encoded in the mitochondrial genome. The reasoning for using mitochondrial transcripts was that they are abundant across all tissues, are single exon, and have variable lengths. We limited our analysis to reads that aligned within a 50 nucleotide window of the 3’ end of the gene. We calculated the median proportion of full-length reads per sample, as well as across all samples, along with standard deviations.
All read pile-up plots were made using wiggleplotr47.
Transcript detection and characterization
We defined transcripts using FLAIR v1.431. Four heart left ventricle samples from cardiovascular disease patients were included for the novel transcript calling (phs001539.v1.p1). We used the samples that had been aligned to the genome and applied FLAIR-correct to correct misaligned splice sites using GENCODE v26 annotations. We merged all samples and ran FLAIR-collapse per chromosome to generate a first-pass transcript set by grouping reads on their splice junction chains and only keeping transcripts supported by at least 10 reads. We only kept reads with transcription start sites (TSS) that fell within promoter regions defined by taking a window 10bp upstream and 50bp downstream of the gene start site based on GENCODE v26 build and that spanned ≥80% of the transcript with ≥25 nucleotides coverage into the first and last exon. Reads that passed these filters were then realigned to the first-pass transcript set, retaining alignments with MAPQ >10.
We further filtered our transcript discovery set using TransDecoder software (https://github.com/TransDecoder/TransDecoder/) to remove transcripts with no ORFs. We integrated Pfam and Blast databases in this search, using the default parameters, to select the ORFs with the most functional coding potential. We removed transcripts where all open reading frames (ORF) were marked as being partial 3’ and 5’. We further limited our discovery to transcripts encoding at least 100 amino acids long transcripts. This step decreased the number of novel transcripts from 159,882 to 93,718.
Transcripts were compared to GENCODE v26, Workman et al. flair-called transcripts28 and CHESS transcripts48 using gffcompare49. Transcripts with exact intron chain-match were marked as annotated, while all others were marked as novel.
Transcript quantification
We used flair quantify31 to quantify transcripts from all samples where reads had been aligned (1) GENCODE v26 and (2) the newly identified transcripts. Reads were normalised using transcripts per million normalisation and were filtered for transcripts expressed at least 5TPM in at least 3 samples prior to clustering analysis. Similarly, for the comparison between ONT and Illumina, reads were normalised using transcripts per million normalisation, filtered for protein-coding genes and limited to those with expression higher than 1TPM in both Illumina and ONT. Lowly correlated genes were defined by residual analysis of the Spearman correlations (Suppl. Figure 3).
Alternative transcript structure events definition
We used SUPPA (v2.3)50 to define alternative 3’ splicing (A3), 5’ splicing (A5), first exon (AF), last exon (AL), intron retention (RI), exon skipping (SE) and mutually exclusive exons (MX). We supplemented these annotations with alternative UTR regions, which for the purposes of this study were assumed to be the last exons. We used a window size of 10 nucleotides around splice sites to allow for error.
Protein validation of highly-expressed transcripts
For the tissues assayed in the GTEx proteomics database32 (heart, brain, liver, lung, muscle, pancreas and breast), we identified the transcripts expressed at higher than 5 TPM per sample. We used the output peptide fasta file from TransDecoder analysis to get the amino-acid sequence for each of the maintained transcripts. In total, 33,251 transcripts were maintained. To optimize our search-space, we grouped together brain samples from different regions as well as heart samples from different regions.
Raw files from the GTEx proteomics study32 were first converted to mzXML files and submitted to the Trans-Proteomic Pipeline (TPP) (http://tools.proteomecenter.org/wiki/index.php?title=Software:TPP) for database search. The Comet search engine was used for the database51. Mass tolerance of precursor ions was set to 10ppm and fragment ions was set to 1.0 amu. Up to two missed cleavages were allowed for trypsin digestion. Methionine oxidation was set to variable modification. Cysteine carbamidomethylation and peptide N-terminal and Lysine TMT modifications were set to be static modifications. After searches, peptides were filtered and scored by the PeptideProphet algorithm and proteins were scored afterwards using ProteinProphet52. Protein probability greater than 0.99 and group_sibling_id of “a”, which marks the protein containing the largest number of total peptides, were used for the confident identification of the transcript.
Differential transcript expression and transcript usage
We used the nine tissues with at least five samples (brain cerebellar hemisphere, frontal cortex and putamen, cultured fibroblasts, atrial appendage and left ventricle from the heart, liver, lung and muscle). Differential expression was performed with DEseq253 pairwise using the Wald method and across all samples using the likelihood ratio test (LRT). We used replicates using the function collapseReplicates. We used a cut-off for statistical significance at FDR=0.05. Differential transcript usage was performed with DRIMSeq54. Only the replicate with the highest read coverage was maintained in the analysis. All analysis was done in a pair-wise manner, with a cut-off for statistical significance at FDR=0.05.
Differential gene and transcript expression analysis between the control and PTBP1 knockdown samples were performed in the same way as above. For differential gene expression we used quantifications made based on the GENCODE gene annotation, since each gene’s differential gene expression status was validated using Illumina RNA-seq protocol on the same samples. For transcript differential expression we used the FLAIR transcripts.
Allele-specific analysis
Alignment strategy
We used the bcftools package to filter for only heterozygous variants per donor. We complemented the WGS and short-read RNA-seq phasing by long-read RNA-seq read phasing with HAPCUT255, run using all available RNA-seq libraries per subject. The haplotype phasing had been informed by the short-read RNA-seq data and we further switched the phase of a median of 0.05% of the heterozygous variants using the long-read data.
We generated a reference genome per haplotype of each donor and re-aligned the reads to each of the two references using the same parameters as described above. For each read, we retrieved the two MAPQ scores, and if different kept the one with the highest score; while the ties were randomly chosen between the two references. This approach led to a difference in alignment for on average 4.8% (Suppl. Figure 9C) of the reads containing a heterozygous variant. We examined the first position of each aligned read to better understand the source of the high reference bias observed. Most reads (98.4%) aligned to the exact same location, which suggests that the reference bias was mediated by local misalignment within the read, probably stemming from insertions/deletions adjacent to the variant of interest (Suppl. Figure 9D). A small proportion of reads (1.2%) did not align when using the personalised reference genomes. Thus, showing that our approach allows for most long reads to reliably be assigned to a haplotype.
Data acquisition
SNP-level allele-specific data was generated using a software developed specifically for long-read data (LORALS). We flagged multi-mappability sites, sites that were part of the blacklist regions from ENCODE and monoallelic sites as determined by GTEx. Regions with multi-mapping reads were constructed using the alignability track from UCSC using a threshold of 0.1, meaning that a 100-kmer aligning to that site aligns to at least 5 other locations in the genome with up to 2 mismatches. Monoallelic sites were defined across all their tissue for each sample, by testing whether there are no more reads supporting two alleles than would be expected from sequencing noise alone, indicating potential genotyping errors (FDR < 1%).
We introduced two ONT-specific flags, namely, the ratio of reference and alternative allele containing reads to the total read number for a site, which we set to greater than 80%, and the number of reads containing indels within a 10bp window of the heterozygous variant. This filter was determined by counting the number of base-pairs that were matched within the window and required at least 8 of them to not be INDELs. If at the site the proportion of indel containing-reads was greater than 80%, it was flagged. Additionally, the reads that contained over 8 INDELs within the window were filtered out. Finally, only variants that were covered by at least 20 reads were kept.
After filtering the flagged sites, we maintained a median of 77% (s.d. 4%) of the sites per sample, with the most stringent filter being the ratio of indel containing reads which removed 22% of the sites (s.d. 4%). For the variant sites that passed these filters we checked to which transcript each read was assigned to. We then created haplotype tables per gene across all of its transcripts. These tables were filtered for genes that had at least two transcripts, where each transcript has at least 10 reads and the total expression of a gene was greater than 36 reads. In case multiple variants associated with a gene, the one with the highest total coverage was selected for the analysis.
We compared the reference ratios per gene and transcript across the samples for which we had either data from more than one tissue or which were sequenced in duplicates or triplicates. We observed a higher spearman correlation for samples from the same tissue (median for ASE and for ASTS) compared to samples from different tissues (median for ASE and for ASTS). We therefore merged the duplicate samples to increase our read depth.
Statistical analysis, simulations and power analysis
Allele-specific analysis is based on the framework outlined in40,56. For a given gene and biallelic variant, we define allelic expressions e0, and e1 as the sum of all transcripts produced from a gene located on the same chromosome copy as each allele. We define log aFC as the expression originating from the alternative allele versus the reference allele (Eq. 1) and the reference ratio as the proportion of the reads originating from the reference allele over the total number of reads (Eq. 2)
| (Eq. 1) |
| (Eq. 2) |
To test for statistical significant allele specific analysis, a binomial test was used to determine whether it is significantly different from the expected 0.5. Binomial test p-values were corrected for multiple hypothesis testing using the Benjamini-Hochberg procedure (FDR < 5%).
When testing for allele specific transcript structure, we performed power analysis to estimate the fraction of the cases where the distribution of transcript expression produced from the gene on the haplotypes were significantly different. Let be the allele-specific dosage for the transcript from haplotype . We denote as the allelic expression fraction of the transcript , where . The dependence of the two distributions and is determined by the chi-squared test (). P-values are corrected for multiple hypothesis testing using the Benjamini-Hochberg procedure (FDR < 5%).
The read counts, number of transcripts for each gene and the log aFC16 are the factors that affect the power of the statistical test. Regarding the aFC factor, the maximum power happens at log aFC equal to zero, indicating equal expression in both haplotypes. Thus, for our analysis we assume that the log aFC is zero and statistical power is estimated to determine the dependency of allele-specific transcript structure analysis on the total coverage and transcript counts to detect an effect of a given size. The effect size is given by cohen’s w, as defined in equation (Eq. 3)57,
| (Eq. 3) |
This is applied on contingency table from and where is the total count table which in this case is 2. To give an idea of how the change in transcript ratios affects the magnitude of the effect size, the following and pairs are presented in Suppl. Table 12, for (interpreted as medium effect size).
Data simulations
To perform the power estimation, the simulated allelic expressions and are produced from a multinomial distribution of two normalized random vectors and that specify the effect size of interest. The significant difference of and is determined by the chi-squared test (nominal p-value < 0.01). Power estimation based on simulated transcript count data for a set of read counts and number of transcripts for the effect sizes of 0,1 (small effect), 0.3 (medium effect) and 0.5 (large effect), is calculated. The effect size is rounded for one digit. In order to detect ASTS with effect size 0.5 with 60% power, assuming aFC=0, total read coverage of 36 was required. For effect size 0.3, at least 100 reads were needed. For the detection of smaller effect sizes, we were underpowered, with even up to 500 reads. These simulations informed our power to detect events of different effect sizes (Suppl. Figure 12E).
Comparison across datasets
For the comparison between two datasets significant results we used π1 statistic setting lambda between 0 and 0.8 in increments of 0.001. (http://github.com/jdstorey/qvalue). For all pi1 calculations we only used genes that could be captured in both datasets. Comparison to GTEx ASE events obtained by Illumina were done using the SNV-level read counts, annotated using the GENCODE annotations, for continuity. The datasets were merged and the variant with the highest read count across both methods was selected per gene across samples.
Colocalization analysis
We mined all colocalization results between GTEx sQTLs and 5,586 GWAS traits4 and filtered for loci with rcp > 0.5 and removed the HLA region. We then mapped each sQTL to its corresponding gene and overlapped that gene set with the significant ASTS genes per tissue. For the overlapping genes we verified that the lead sQTL used for colocalization was a heterozygous variant in the donor for which we had ASTS data. This strict filtering resulted in five genes SRP14, DUSP13, CD36, IFITM2, and ELP5.
Combinatorial allele-specific analysis in control and PTBP1 KD samples
For each donor the control and the knockdown samples were processed together, and the most highly covered variants using both samples were selected per gene. Specific allelic events per condition were defined using an FDR threshold of 0.05.
We downloaded all eCLIP (bed narrowPeak) RNA protein binding data in GRCh3858. All peaks were overlapped with the heterozygous variants per donor using bedtools intersect59. Finally, the maintained peaks were annotated to the nearest gene using a 10kb window around each gene.
Annotation of variant consequences
Annotation of protein-coding regions was generated by running Ensembl VEP (version 104) with the --most_severe flag on the GTEx v8 release. We did two rounds of annotation, the first one using non-small RNA genes from the GENCODE v26 GTF and the second one by supplementing this annotation with newly identified FLAIR transcripts for these genes. We predicted the productivity of each transcript using flair predictProductivity.py (v1.4)31 using only the longest ORF for each transcript. The frame of each transcript was corrected using genomeTools (v1.6.1)60.
Transcripts were first annotated based on the gene biotypes. Transcripts originating from protein-coding genes were classified as protein-coding if both a start and a stop codon were found, nonsense-mediated-decay if a premature termination codon was found, processed transcript if there was no start codon, and nonstop decay if there was a start but no stop codon. Novel transcripts without a conclusive CDS frame found had their biotype revised. Novel transcripts marked as protein-coding, processed transcript, sense intronic, antisense or lincRNA with intron retention, had their biotype changed to retained intron. Similarly, protein-coding and processed transcripts that came from the opposite strand were re-annotated as antisense, if they overlapped an intron as sense-overlapping and if they were intergenic as lincRNAs. If none of these conditions were filled, protein coding transcripts had their annotation changed to processed transcript. The gene coordinates were extended if one of the transcripts was found to be outside them. This led to 73,599 transcripts added.
CADD scores for all annotated variants were obtained using the v1.5 release61. We compared the CADD scores between the reassigned and the non-reassigned variants (down-sampled to match the size of the total number of reassigned variants per consequence group). We then used a t-test to compare the means of the two groups.
Rare variant analysis
We extracted all heterozygous variants within a 10kb window around each gene assessed for ASTS in a donor specific manner. Variants were filtered for MAF <0.01 and the worst consequence was maintained per variant. We found a median of four rare variants per gene. We observed that 50% of genes across all samples had at least one rare variant. We calculated enrichment using a binomial test, setting all variants as background.
Extended Data
Extended Figure 1: Quality control of the dataset.
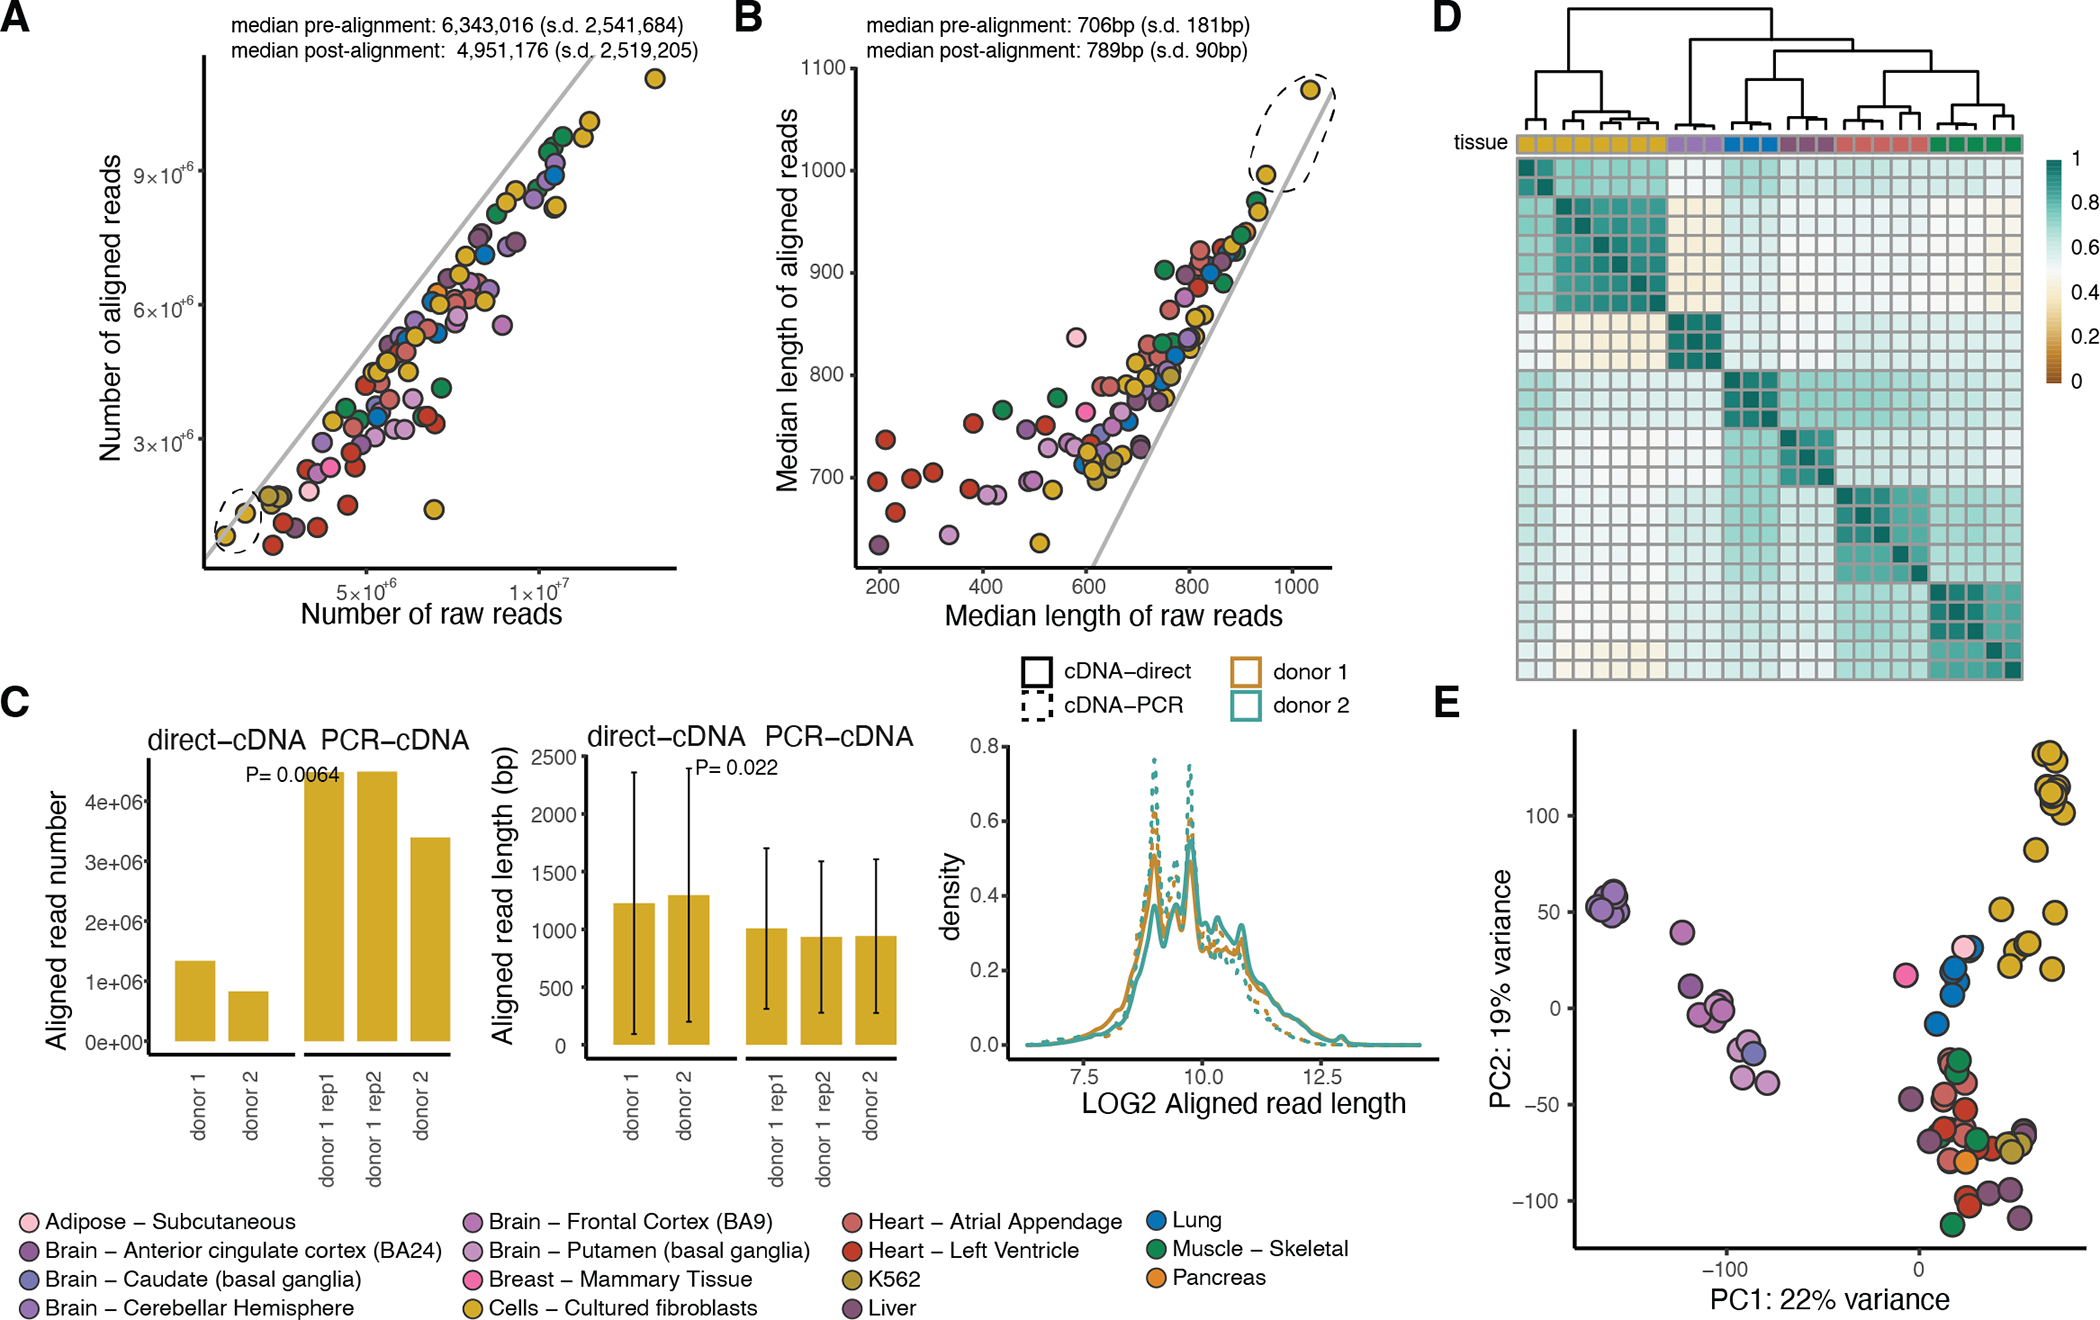
A) Number and B) median length of raw and aligned reads per sample. The diagonal lines correspond to intercept = 0. With the dashed black circle, we highlight the two samples sequenced using the direct-cDNA technology. C) Read number and read length in two fibroblast cell line samples (one of which was sequenced in replicate) that were sequenced using both the direct-cDNA and the PCR-cDNA protocol for 48 hours. P-values were calculated using a two-sided t-test. Error bars: standard deviation from the mean. D) Hierarchical clustering using Euclidean distance for replicate samples aligned to GENCODE for transcripts with expression above 3 TPM in at least 5 samples. E) Principal component analysis using all 88 samples aligned to GENCODE (v26) for transcripts with expression above 3 TPM in at least 5 samples.
Extended Figure 2: Comparison between ONT and Illumina gene expression.
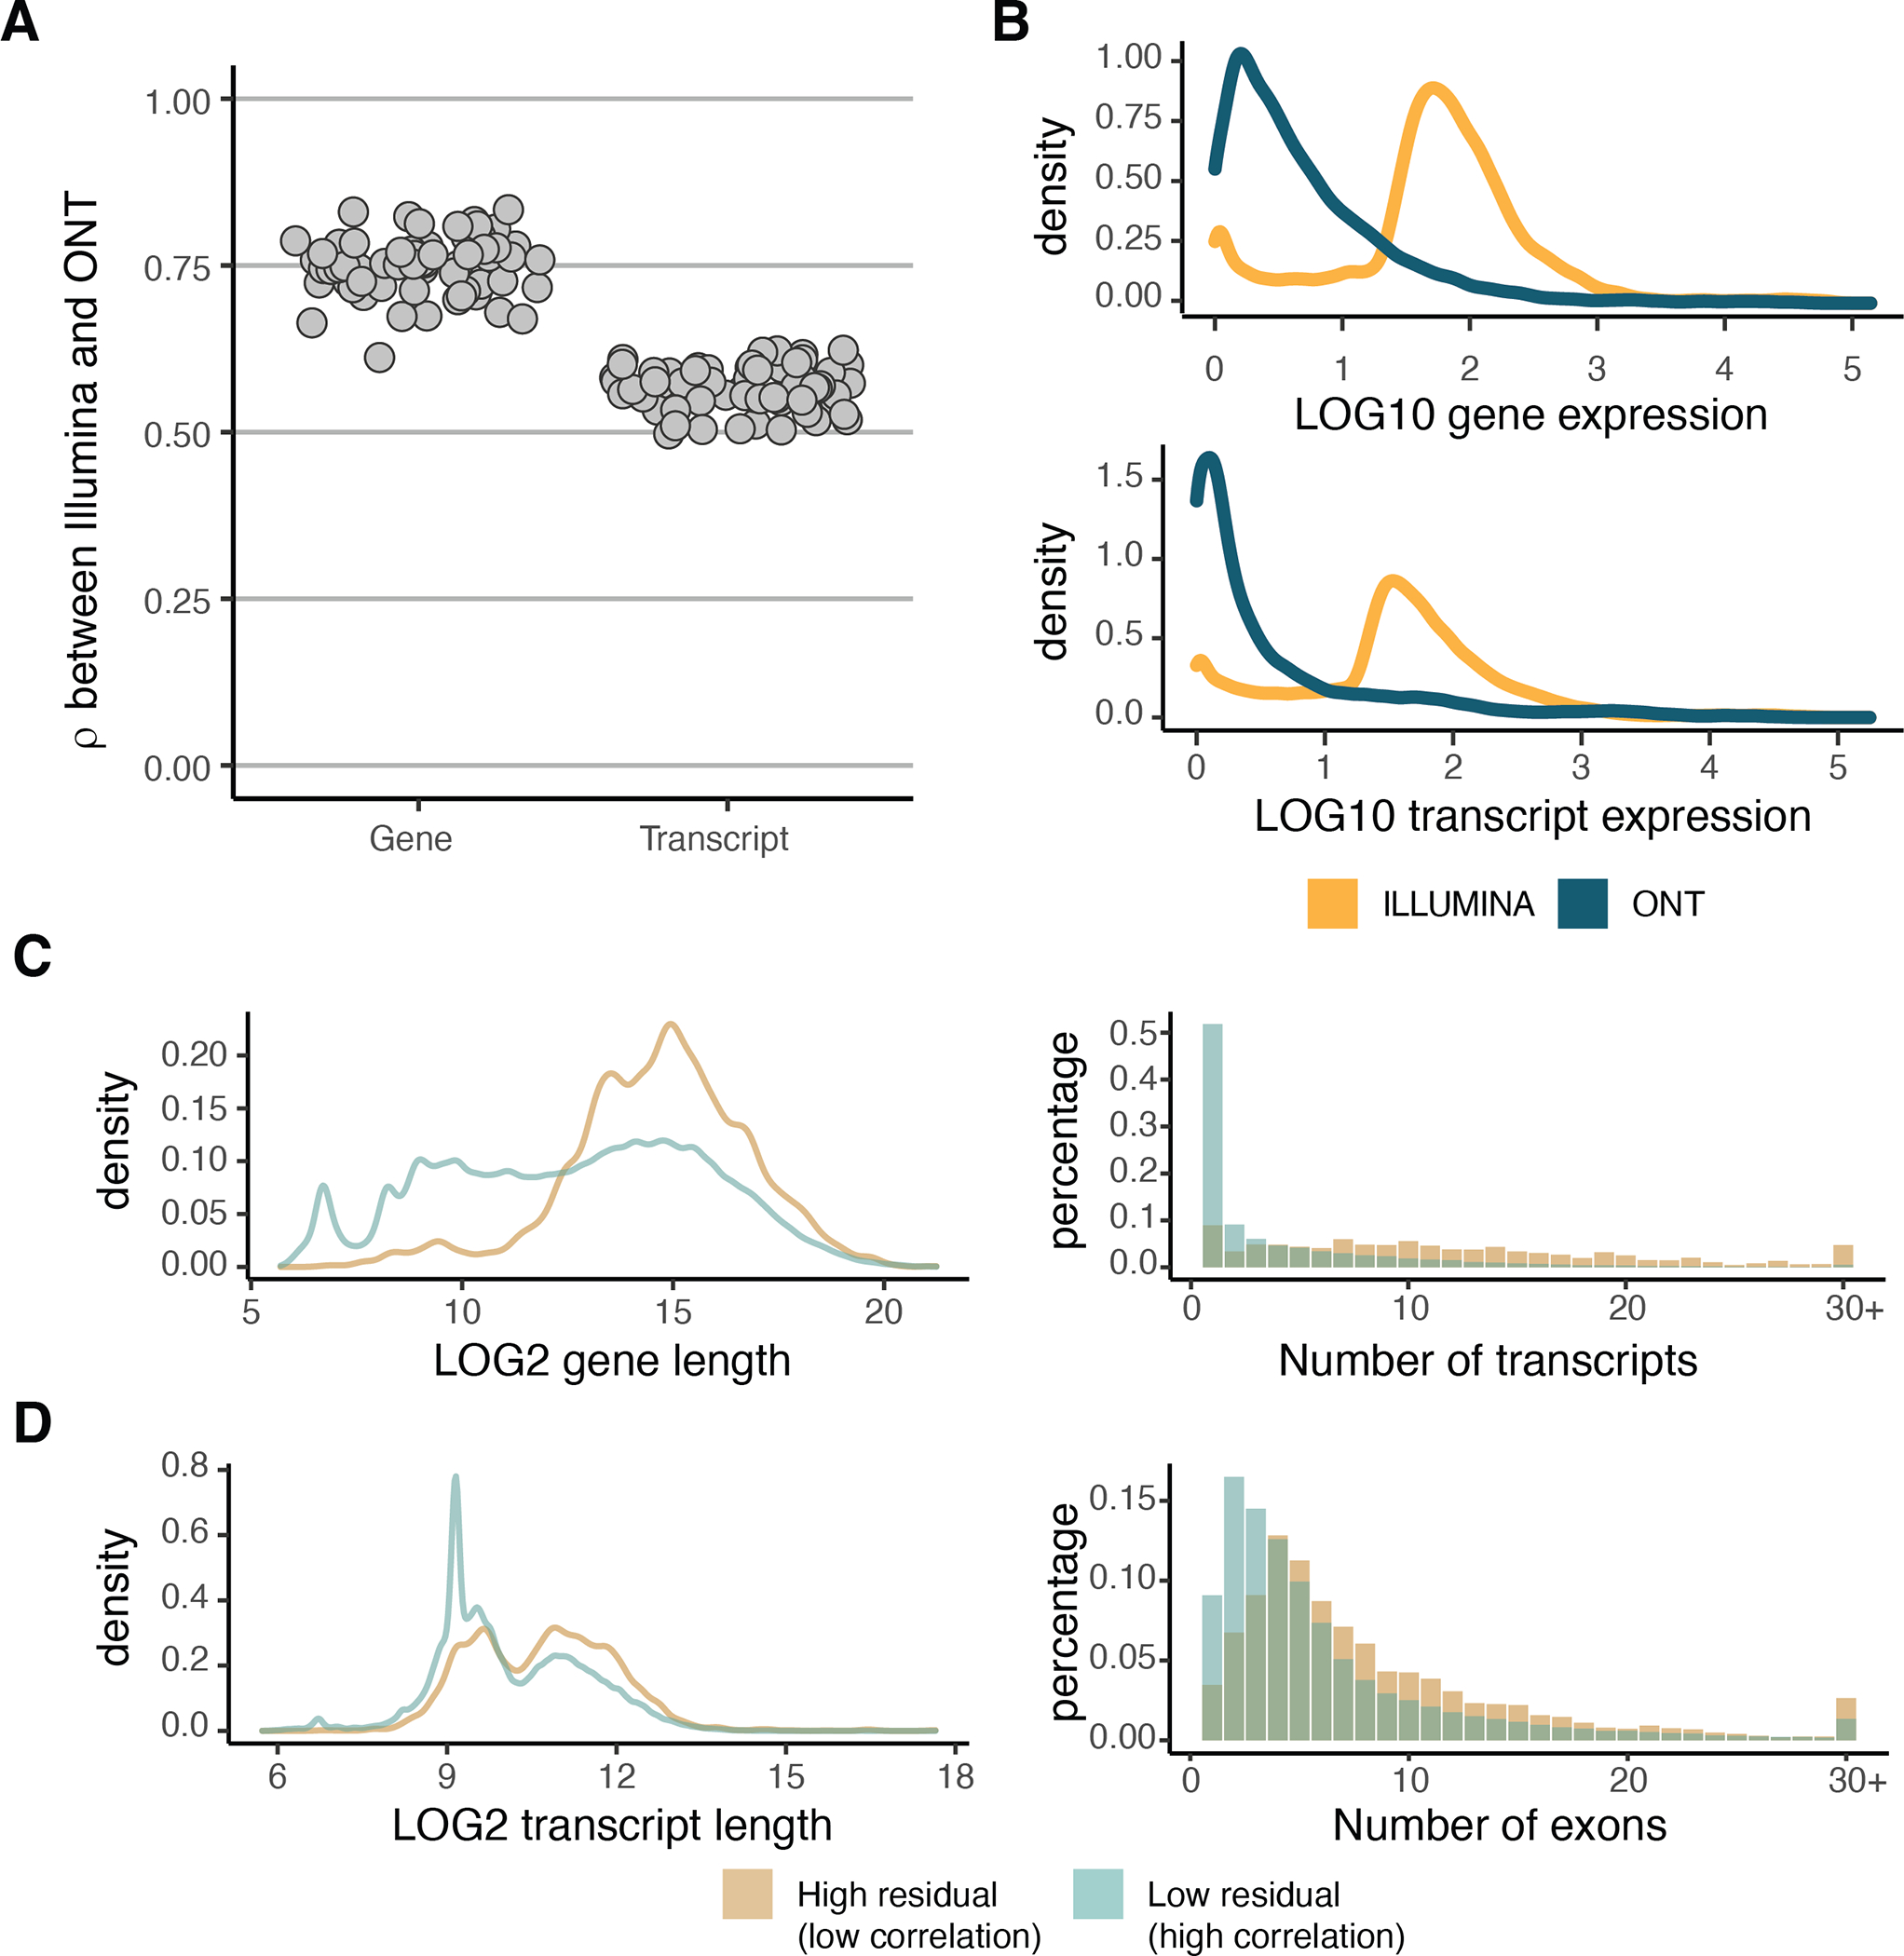
A) Correlation between the transcriptome of each sample quantified by ONT and by Illumina sequencing technologies. B) Normalized gene and transcript expression for high residual (|residual| > 1) genes and transcripts retrieved from the Spearman correlation analysis. C) Characteristics of genes and D) transcripts with high or low residuals with respect to gene/transcript length, number of transcripts per gene and number of exons per transcript.
Extended Figure 3: Three prime bias analysis using mitochondrial reads.
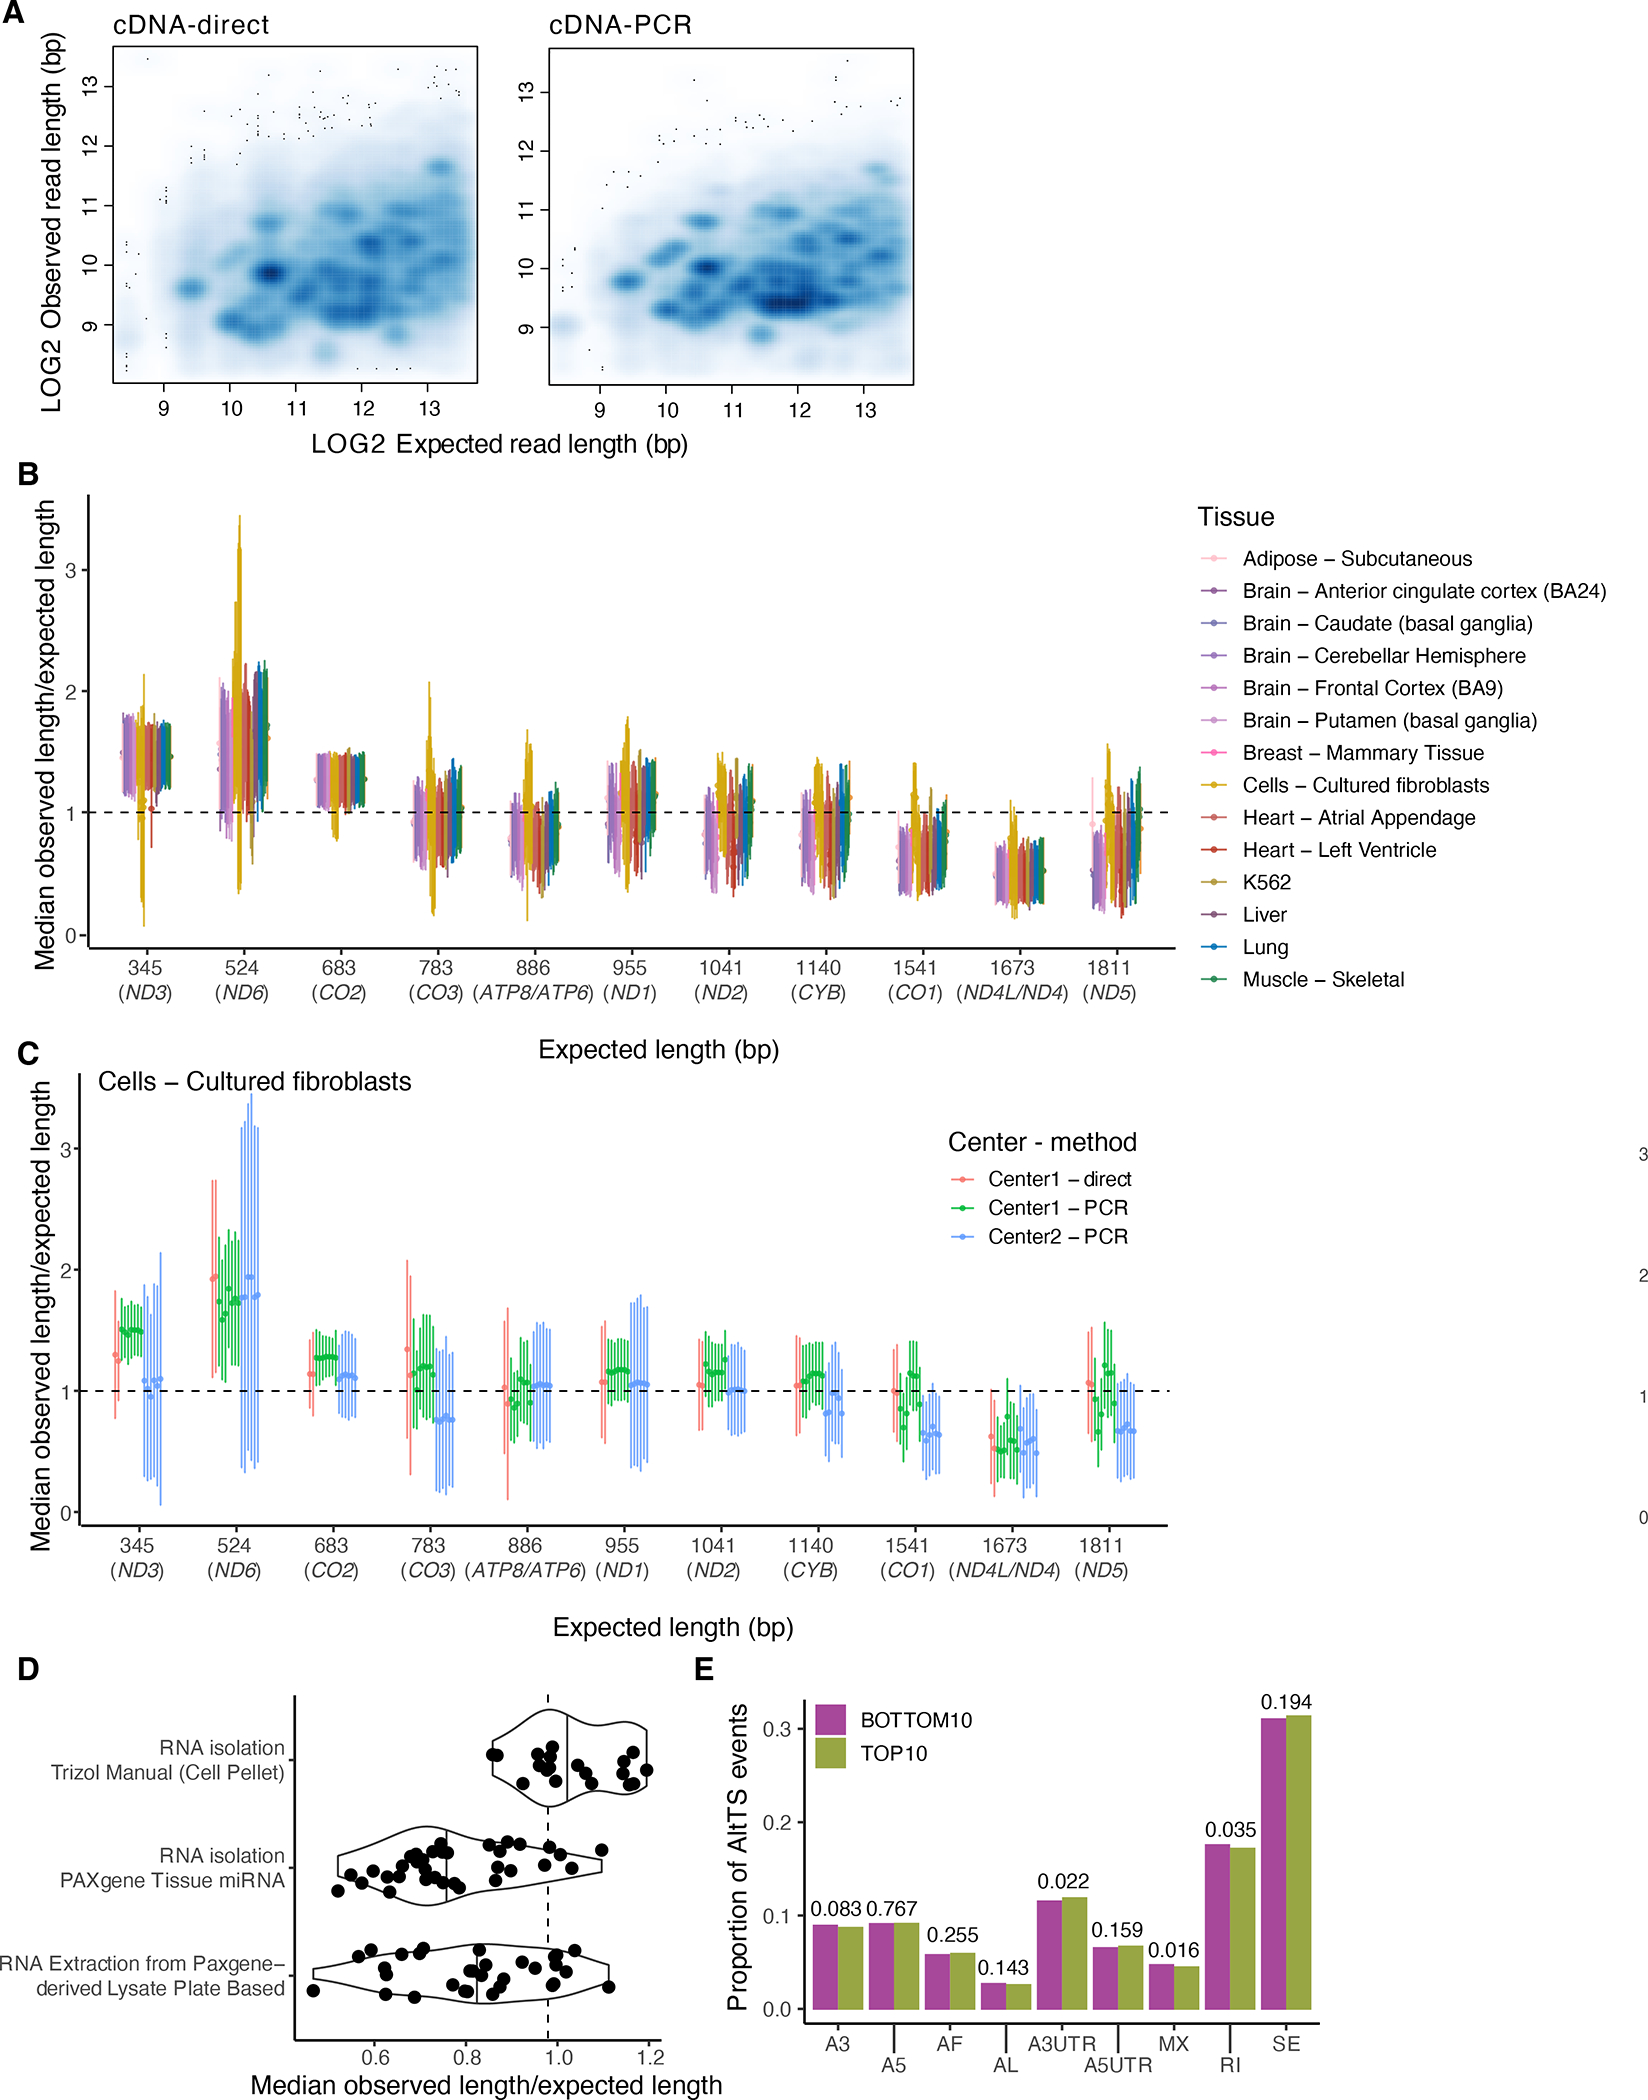
A) Observed versus expected read length for one sample sequenced using both direct (Spearman ) and PCR cDNA (Spearman ) protocols. The discrete clusters below the diagonal represent incorrect assignments to GENCODE isoforms (potential novel transcripts), and the diffuse shading represents fragmented RNA. Relationship between the expected transcript read length and the fraction of observed nanopore poly(A) RNA reads over the expected full length by sample for B) all samples and C) only fibroblasts. Labels are for mitochondrial genes without the MT prefix. The median was calculated per sample and error bars represent standard deviation. D) Median fraction of full-length per method by which RNA was isolated. E) Comparison of alternative transcription structure events found in highly expressed transcripts in the top and bottom 10% of samples ranked by 3’ bias. We observed no difference between the two deciles when using a two-sided proportionality test.
Extended Figure 4: FLAIR transcript characterisation.
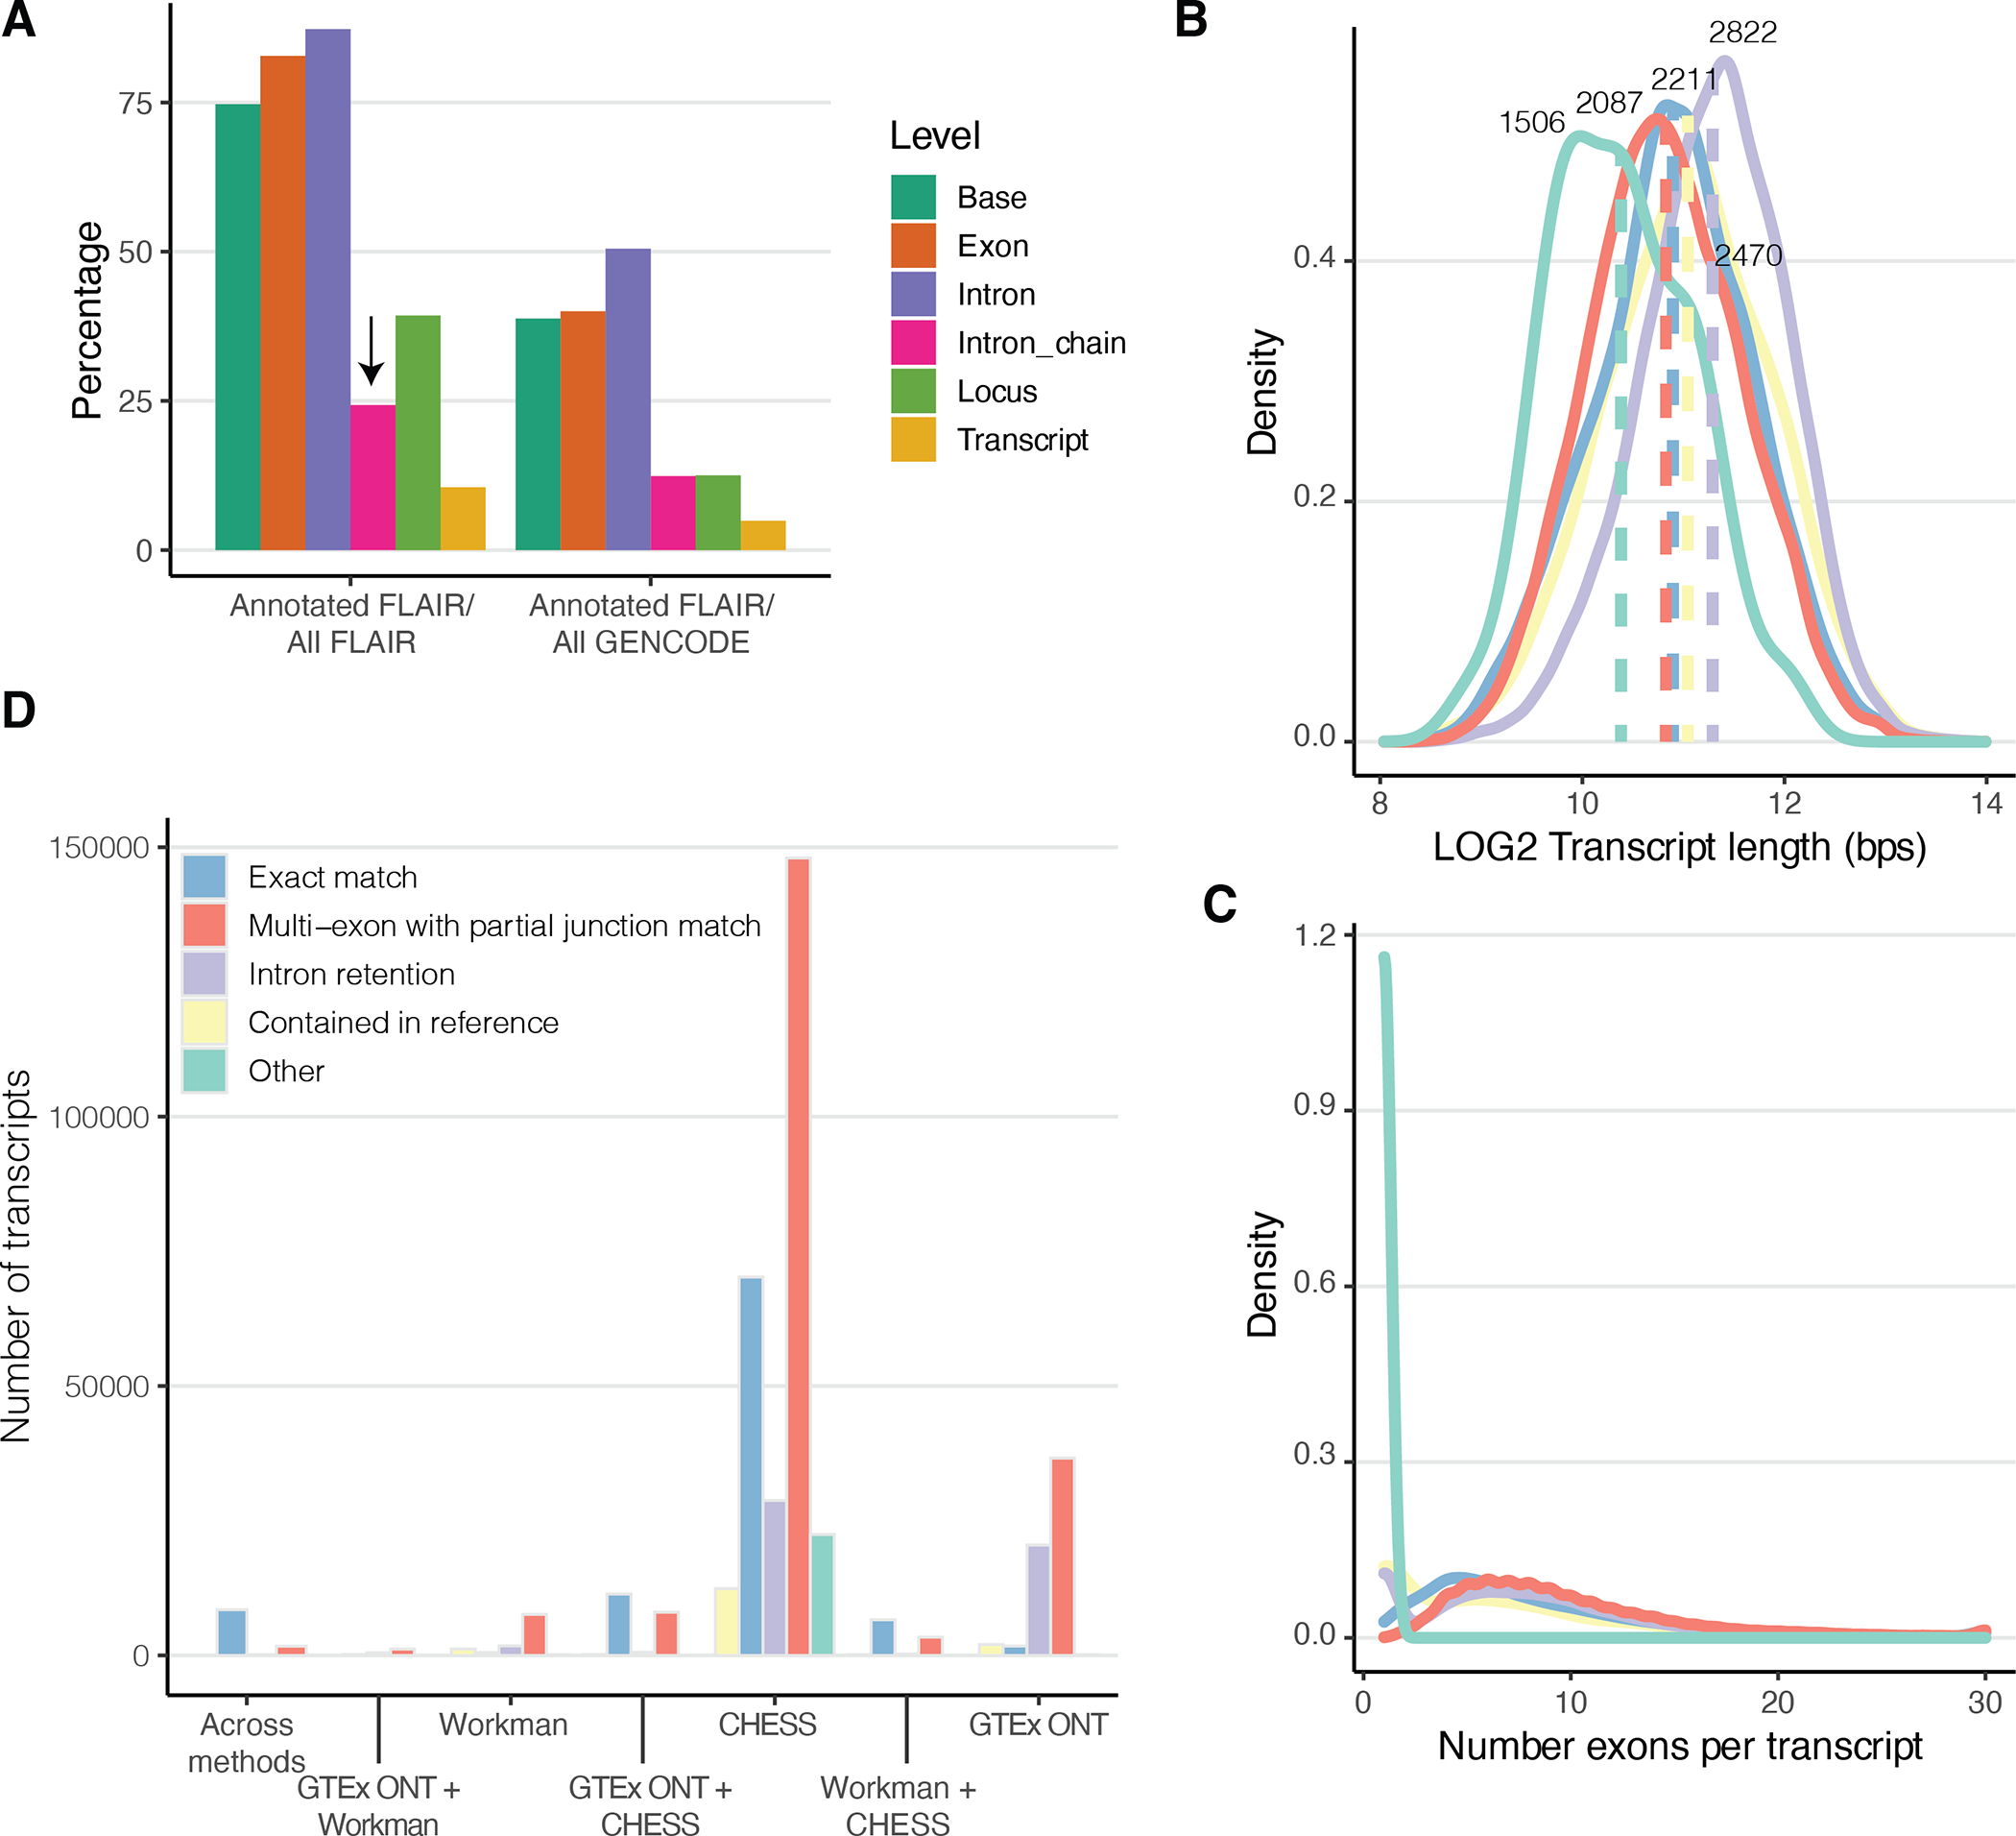
A) FLAIR transcripts comparison to GENCODE with respect to different genomic levels. The difference between intron chain and transcript is that the former only looks at matching the intron boundaries, therefore allowing variation in the UTR regions. B) Transcript length and C) number of exons per transcript classified by comparison to GENCODE. D) Number of overlapping transcripts between the ones identified in this paper and the ones released by a) CHESS and b) Workman.
Extended Figure 5: Protein validation analysis of transcripts from matched tissues.
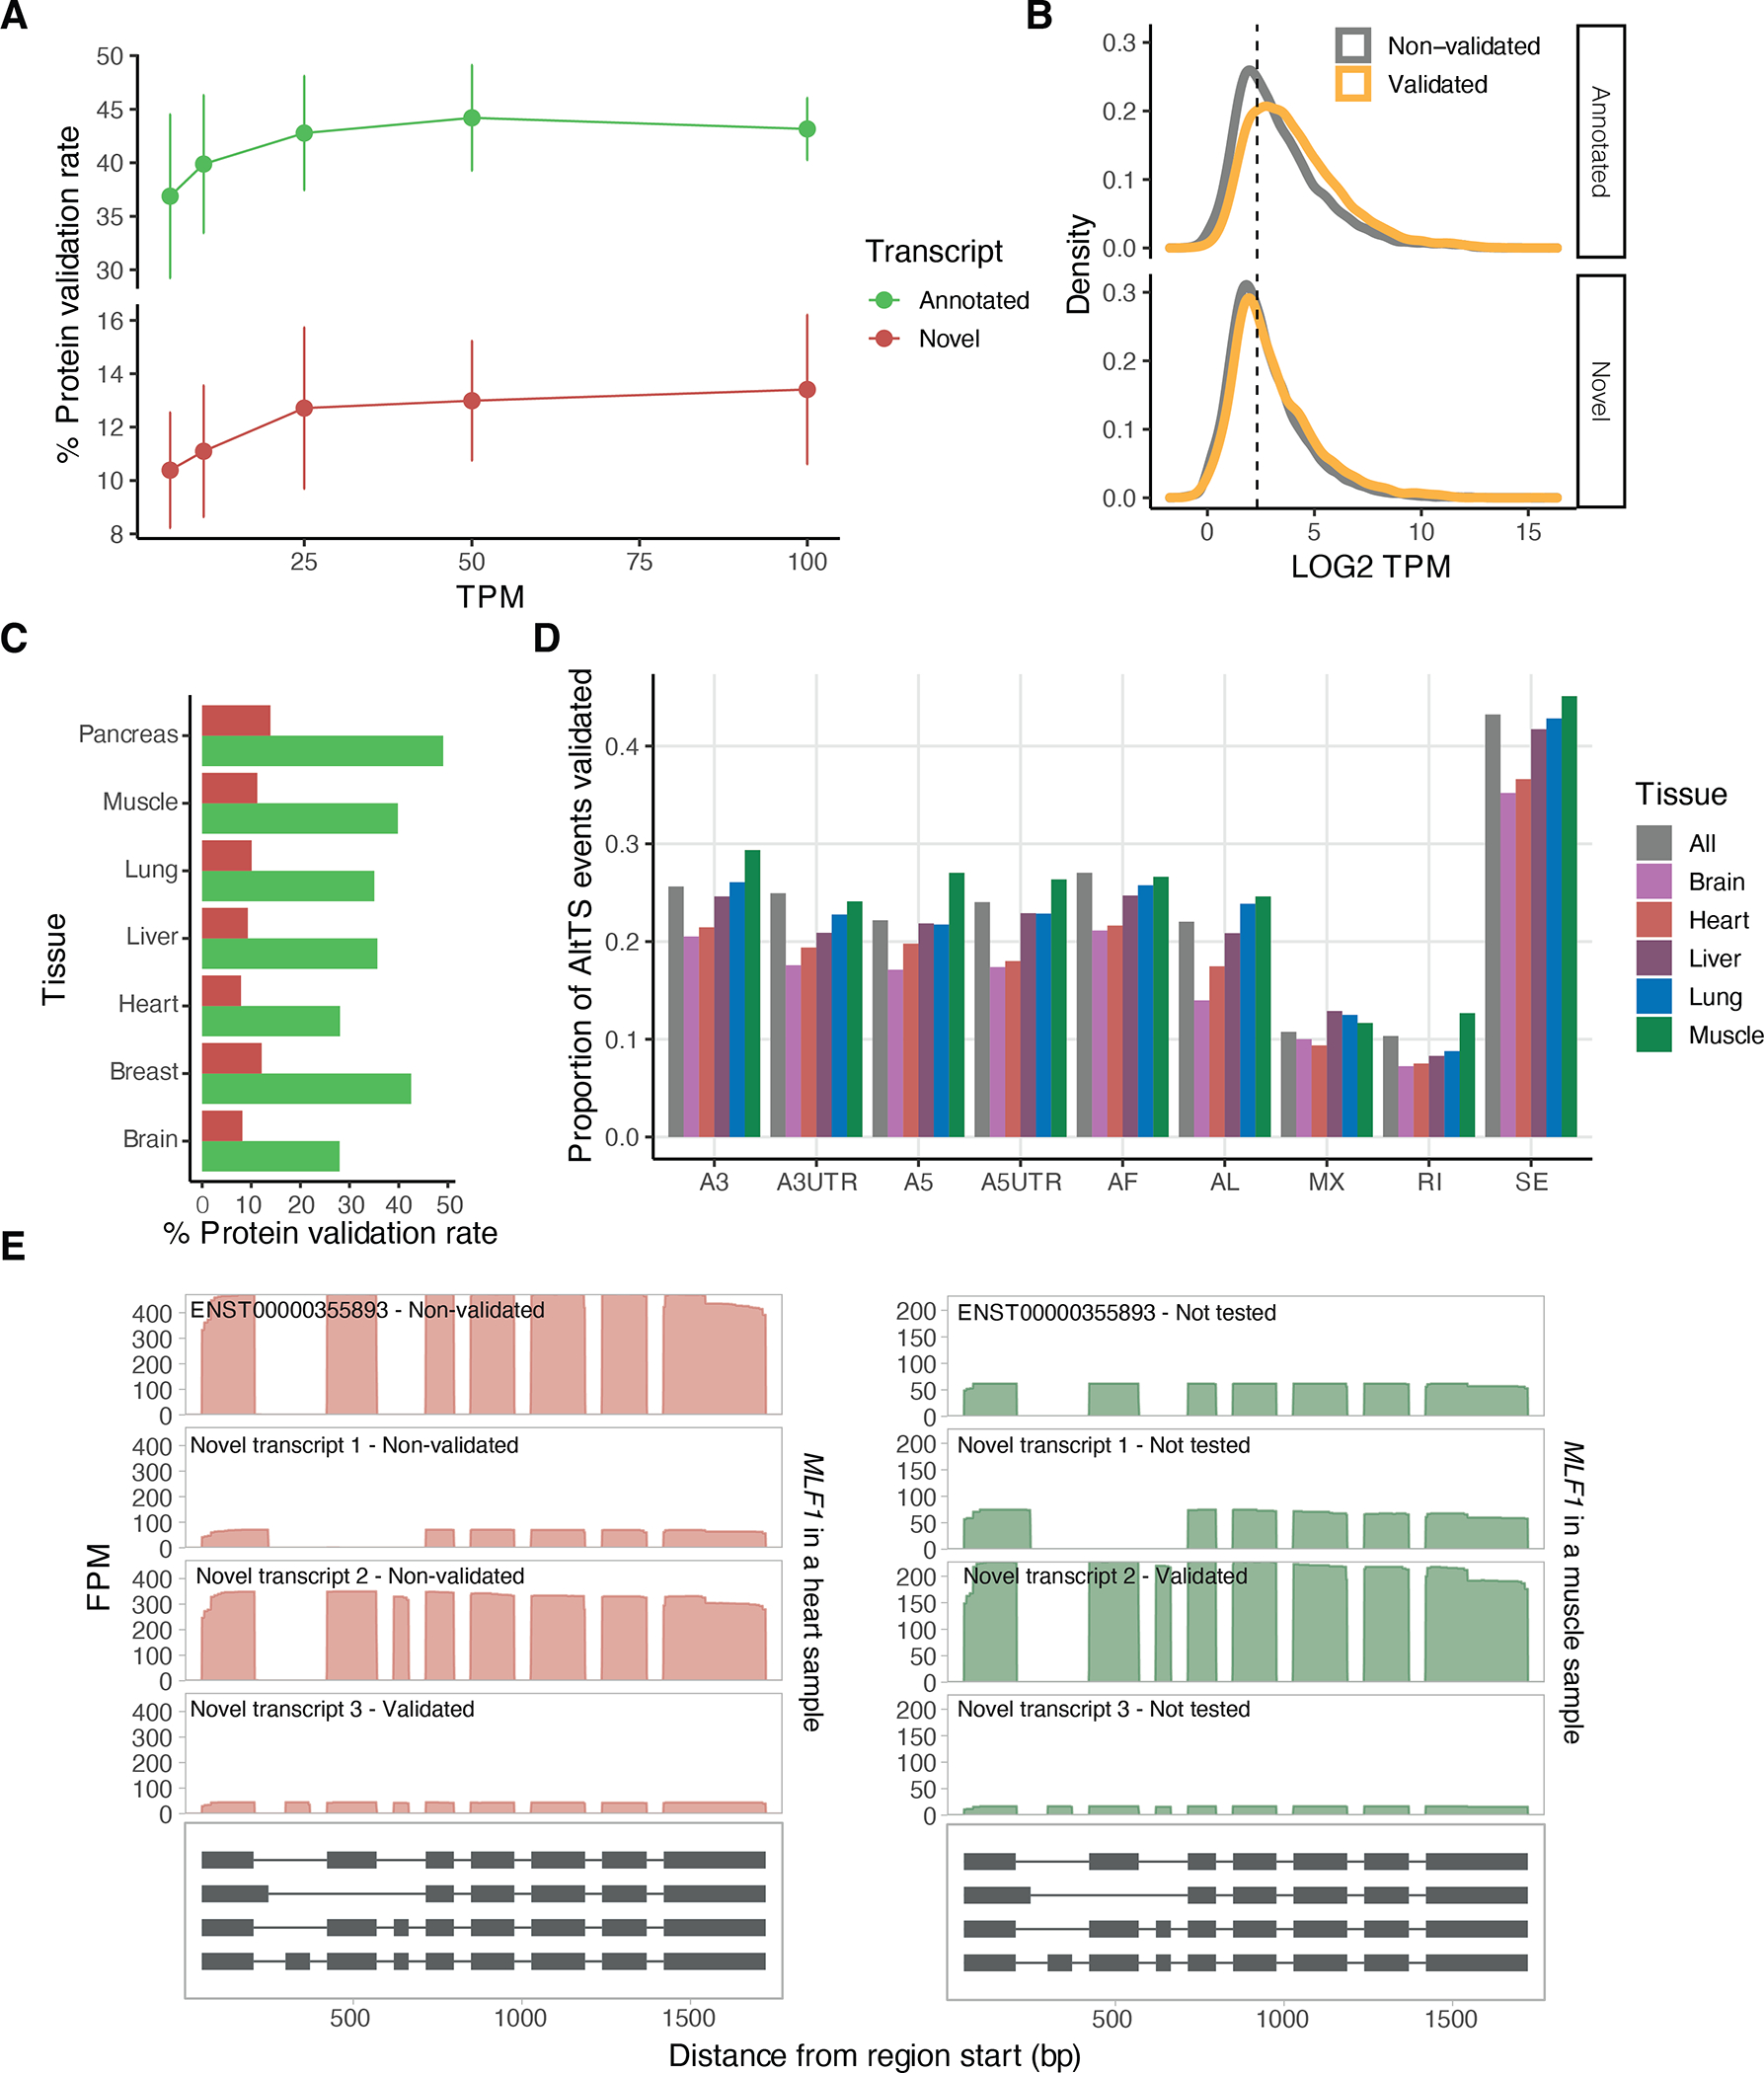
A) Percentage of validated transcripts at the protein level using mass spectrometry for different TPM thresholds. Each point represents the mean across assayed tissues and error bars represent the standard deviation. B) Mean expression per tissue with over one sample (lung, liver, heart, muscle and brain) of annotated and novel transcripts stratified by their validation status. The vertical line denotes the 5TPM threshold used. C) Percentage of validated transcripts at the protein level using mass spectrometry per primary tissue. D) Proportion of the AltTS events validated per tissue. E) MLF1 is an example of a gene with multiple highly-expressed transcripts across both muscle and heart tissues with a different transcript validated in each tissue. A3: alternative 3’ splice site; A5: alternative 5’ splice site; AF: alternative first exon; AL: alternative last exon; A3UTR: alternative 3’ end; A5UTR: alternative 5’ end; MX: mutually exclusive exons; RI: retained intron; SE: skipped exon.
Extended Figure 6: Transcript expression overview of novel and annotated transcripts.
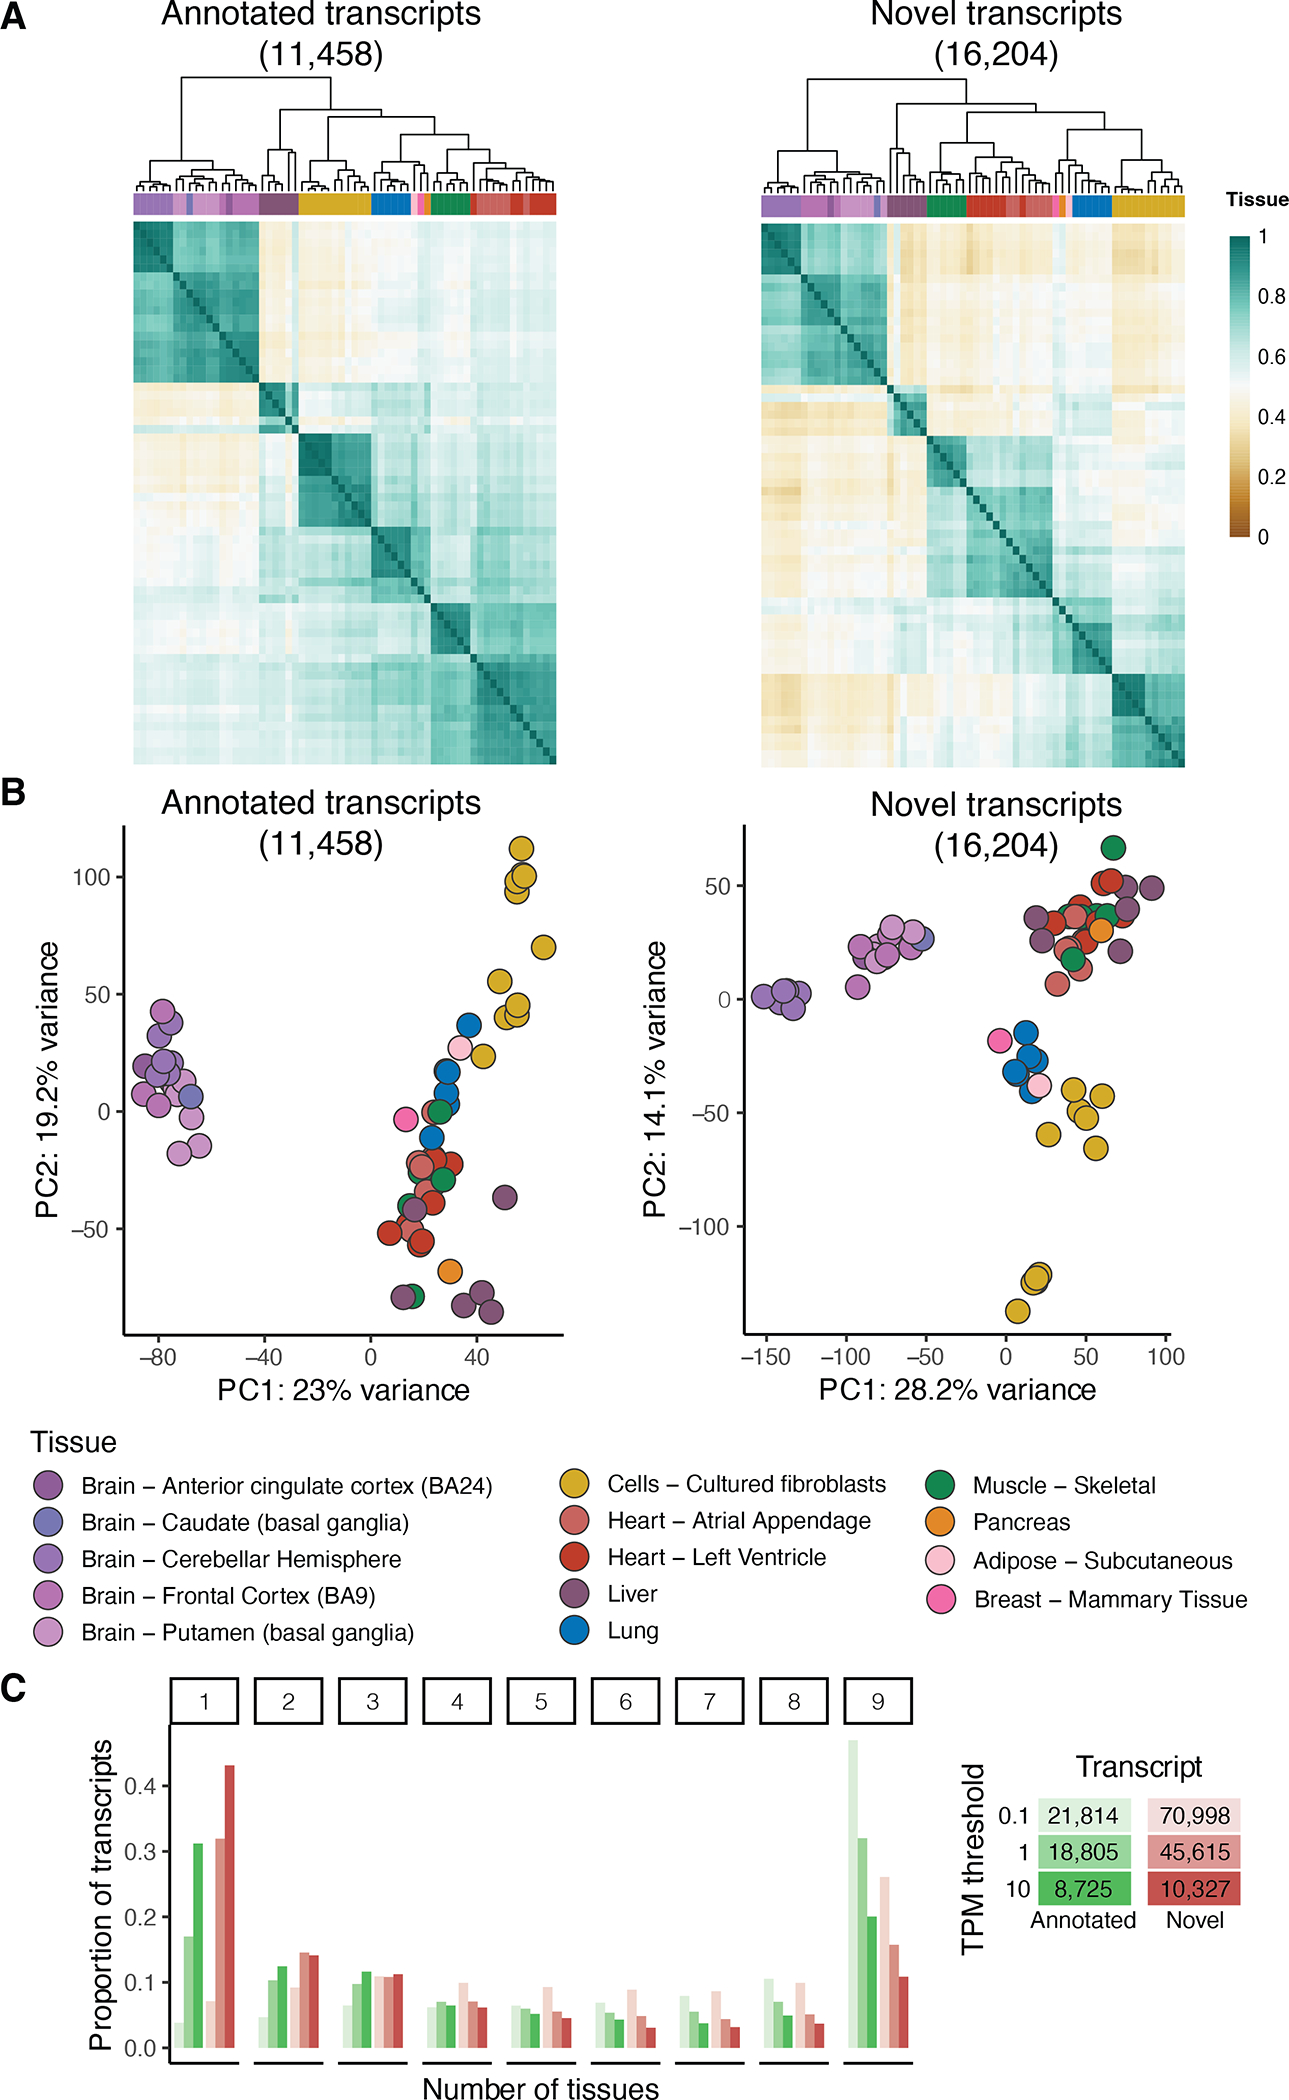
A) Hierarchical clustering using euclidean distance and B) principal component analysis for selected samples aligned to GENCODE for transcripts with expression above 5 TPM in at least 3 samples separated based on whether they are novel or not. C) Proportion of transcripts expressed at different TPM thresholds and classified based on how many tissues express the transcript in at least two samples. The total number of transcripts per group and threshold is included in the legend.
Extended Figure 7: Differential transcript expression and usage between tissues.
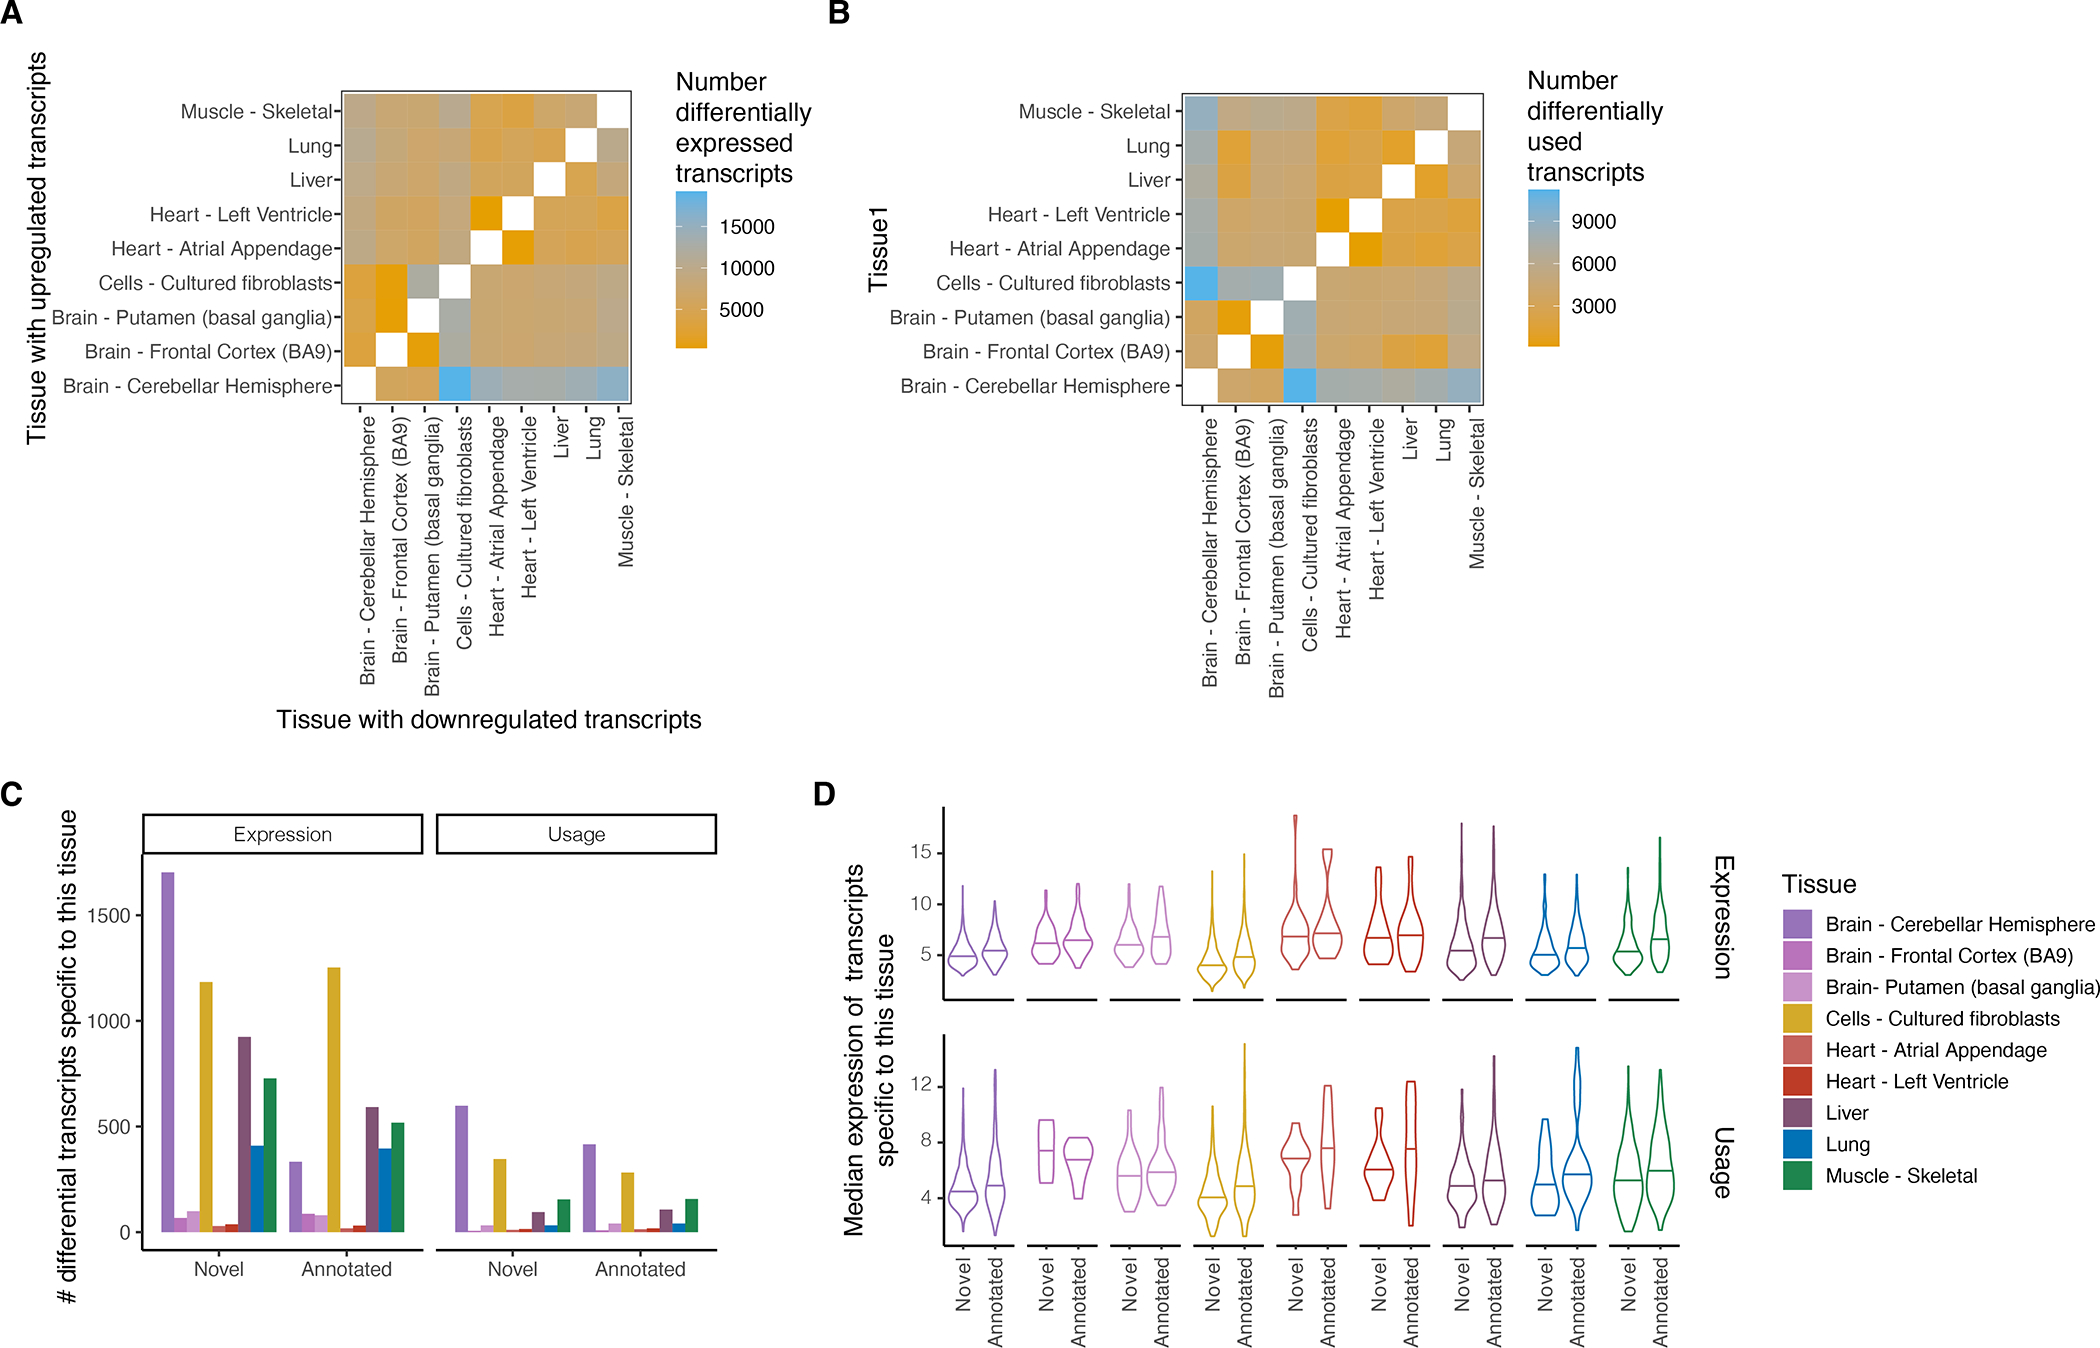
Heatmap of number of differentially A) upregulated transcripts and B) used transcripts (FDR ≤ 0.05) in pairwise comparison of tissues with at least five samples. In differential expression analysis we identify up- or down-regulated transcripts per pairwise comparison (asymmetrical heatmap) while in the differential transcript usage analysis there is no direction of effect (symmetrical heatmap). C) Number of differentially expressed or used transcripts that were specific to that tissue. D) Median gene expression across all transcripts that are specific to a tissue.
Extended Figure 8: LORALS pipeline development and aligning statistics.
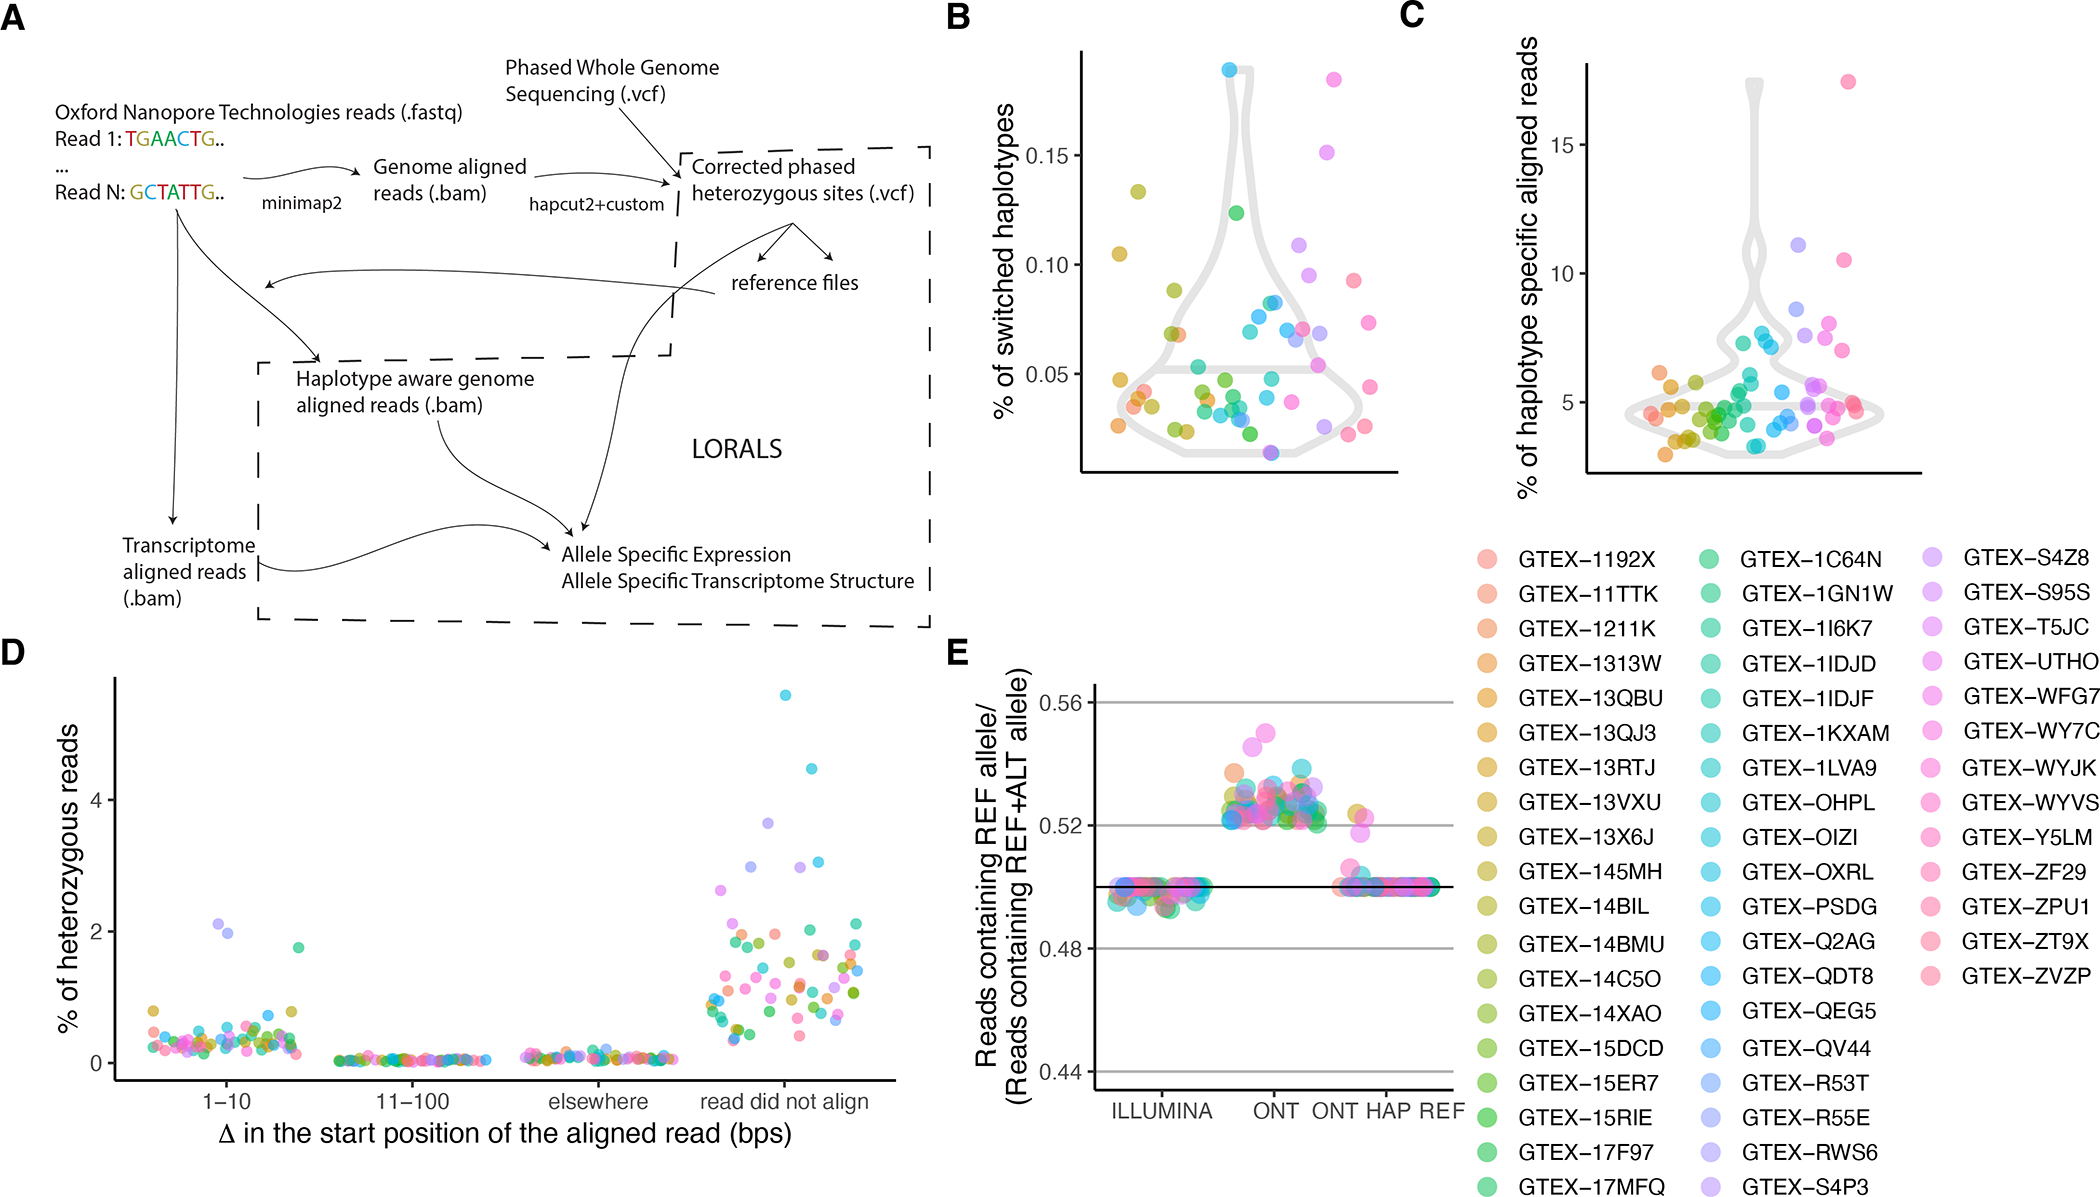
A) Pipeline for allele-specific analysis. Raw long-reads are first aligned to the genome using minimap2. This alignment is used to correct the phase of some of the heterozygous variants on the whole genome sequencing vcf. This new file is then used to generate personalized genome reference files against which the raw reads are again aligned using minimap2. The raw reads are also aligned to the transcriptome using minimap2. The VCF file along with the genome aligned reads and the transcriptome aligned reads are then fed into LORALS for allelic analysis. B) Percentage of switched haplotypes per donor informed by the long-read data. For this all samples from the same donor were merged to harmonize the files. C) Percentage of haplotype specific reads calculated as reads having a higher mapping score when using a personalized genome reference. D) Delta calculated as the difference in the start position of the aligned read between the genome aligned and the personalized genome aligned reads. Not shown are the reads that had Delta = 0. E) Reference ratio for the samples present in this study sequenced using Illumina technology and ONT technology aligned with two different approaches.
Extended Figure 9: LORALS pipeline allele specific analysis filter setting.
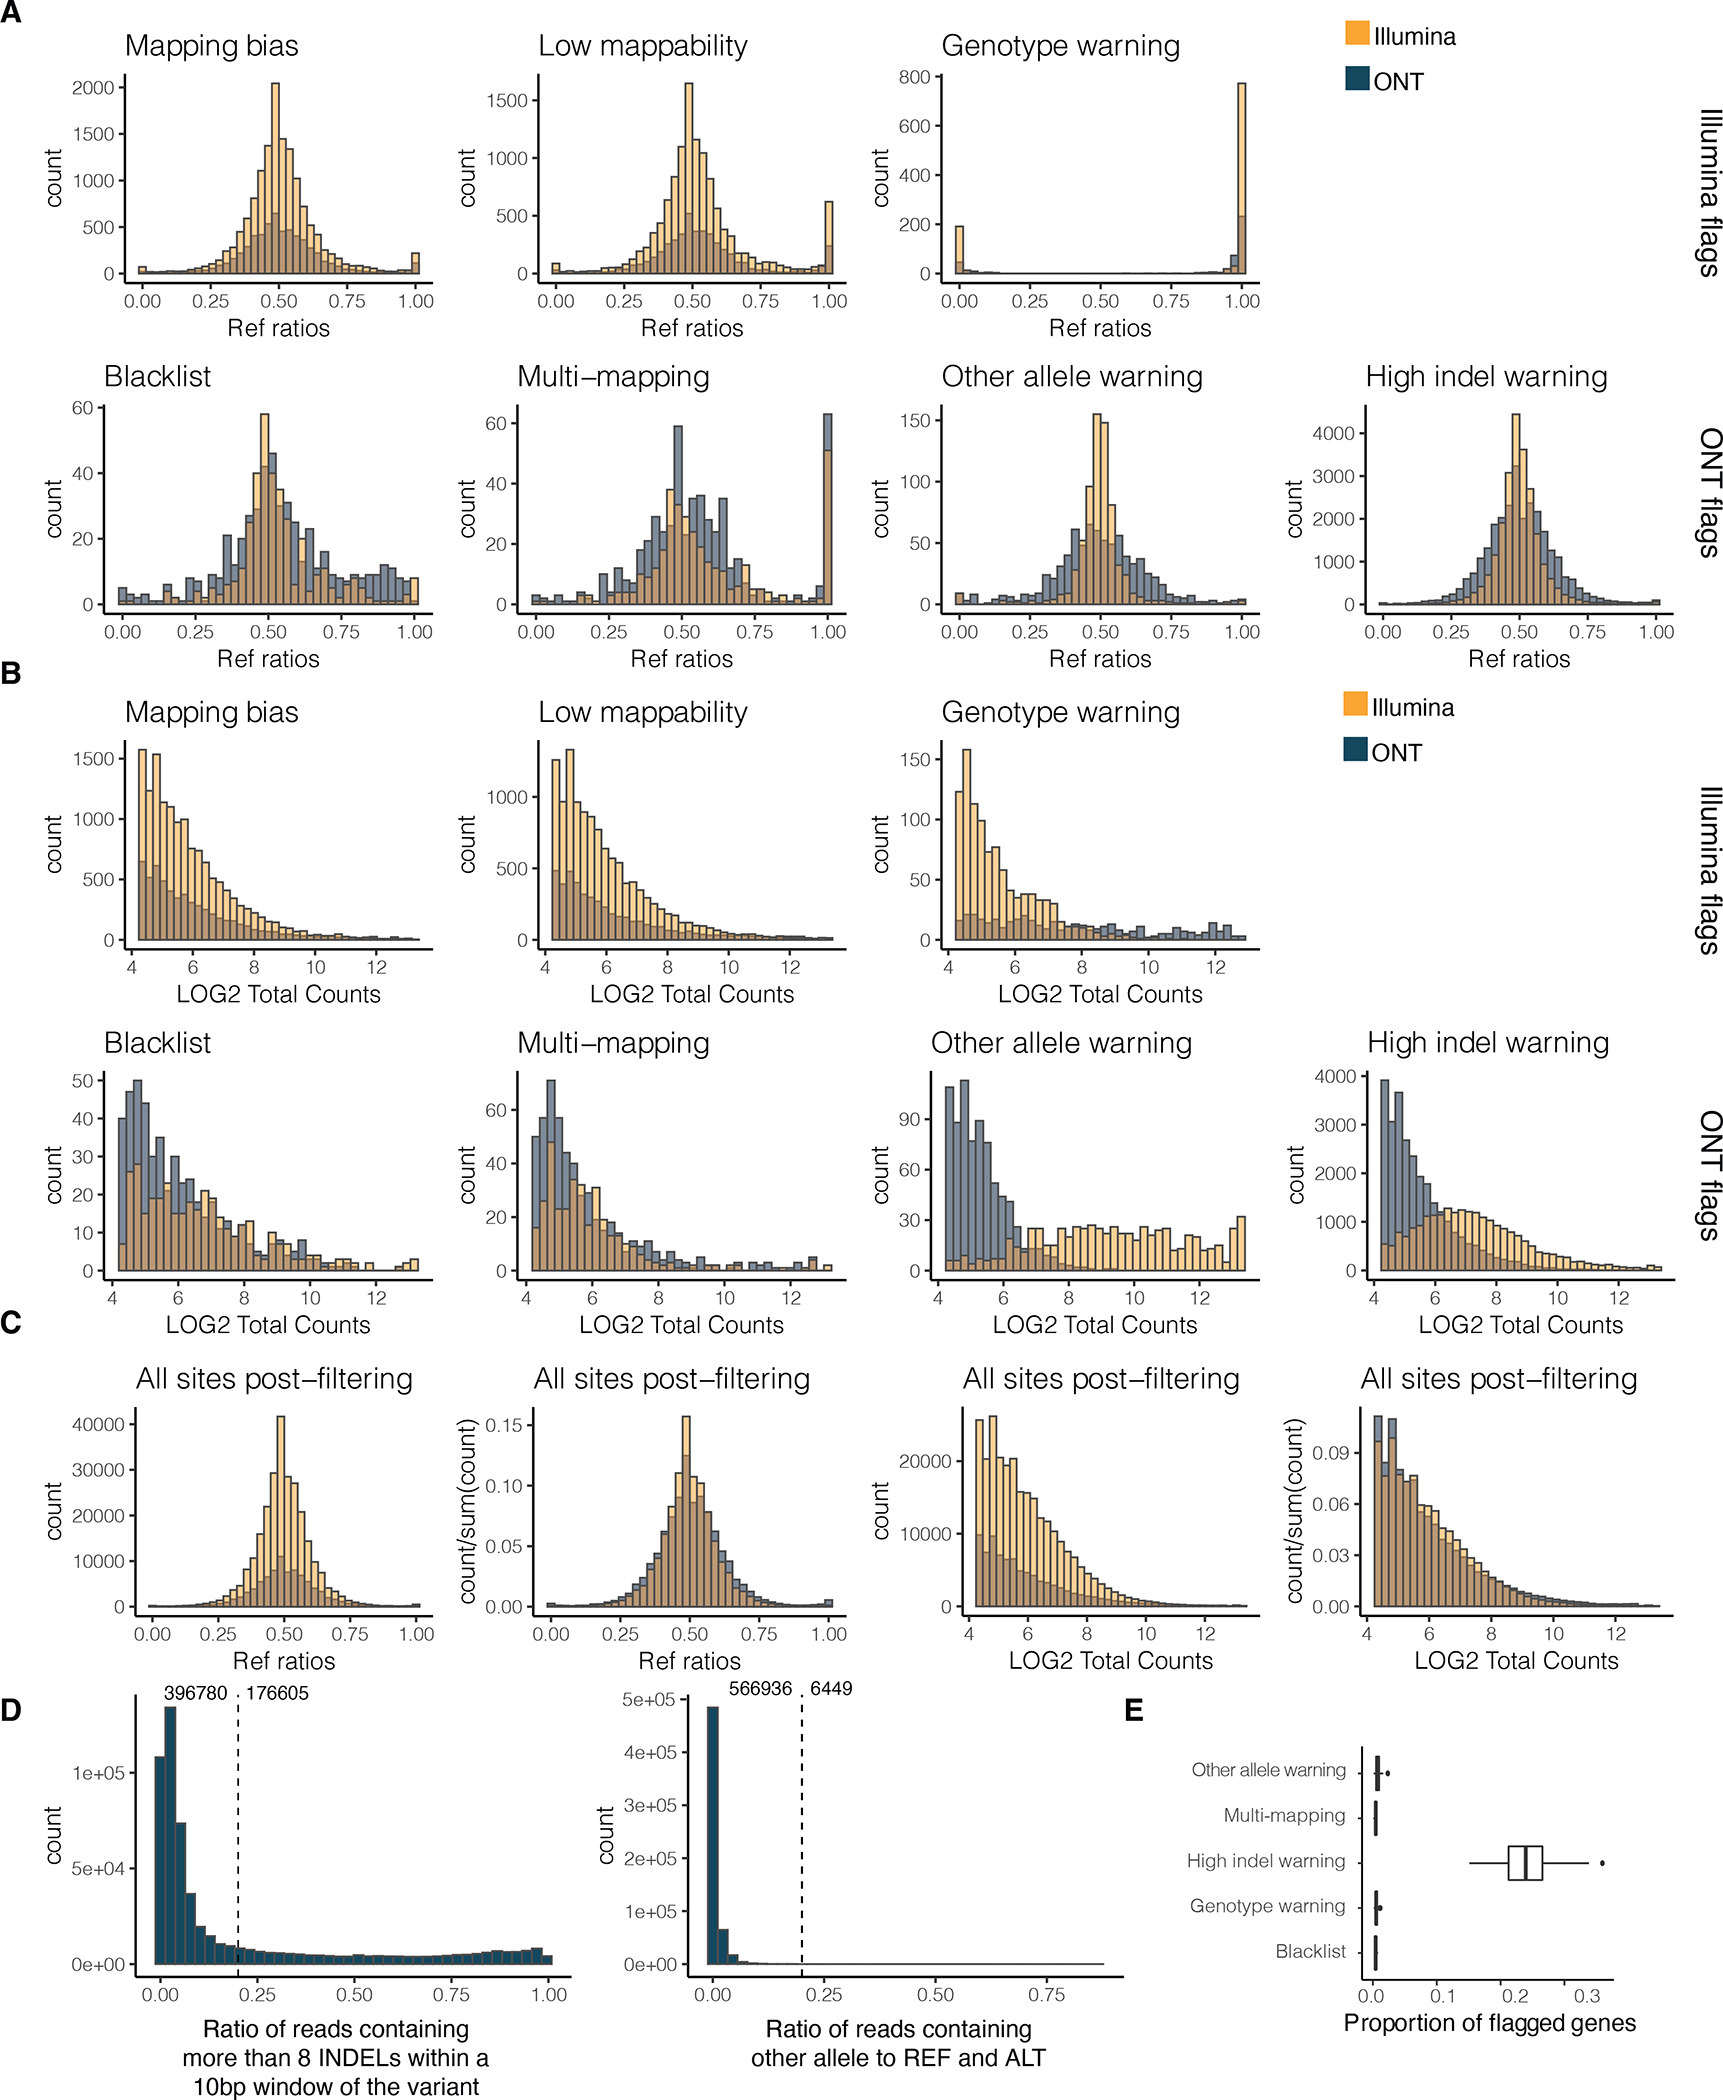
A) Reference ratio and B) normalised reads counts across different Illumina and ONT flags for both of these sequencing technologies. Mapping bias: mapping bias in simulations; Low mappability: low-mappability regions (75-mer mappability < 1 based on 75mer alignments with up to two mismatches based on the pipeline for ENCODE tracks and available on the GTEx portal); Genotype warning: no more reads supporting two alleles than would be expected from sequencing noise alone, indicating potential genotyping errors (FDR < 1%); Blacklist: ENCODE blacklist. Multi-mapping: regions with multi-mapping reads constructed using the alignability track from UCSC using a threshold of 0.1 (so that a 100kmer aligning to that site aligns to at least 5 other locations in the genome with up to 2 mismatches); Other allele warning: regions where the proportion of ref or alt containing reads is lower than 0.8; High indel warning: sited where the proportion of non-indel containing is lower than 0.8. C) Reference ratios and normalised reads counts of all kept sites across Illumina and ONT sequencing technologies. D) Distribution of the high indel warning ratios and the other allele ratios across all samples. E) Proportion of genes with at least 20 overlapping reads flagged per filter. The proportion was calculated across all genes for each sample . The center corresponds to the median, the lower and upper hinges correspond to the 25th and 75th percentiles and the whiskers extend from the hinge to the smallest/largest value no further than 1.5 * inter-quartile range from the hinge.
Extended Figure 10: Allele specific analysis on all GTEx samples.
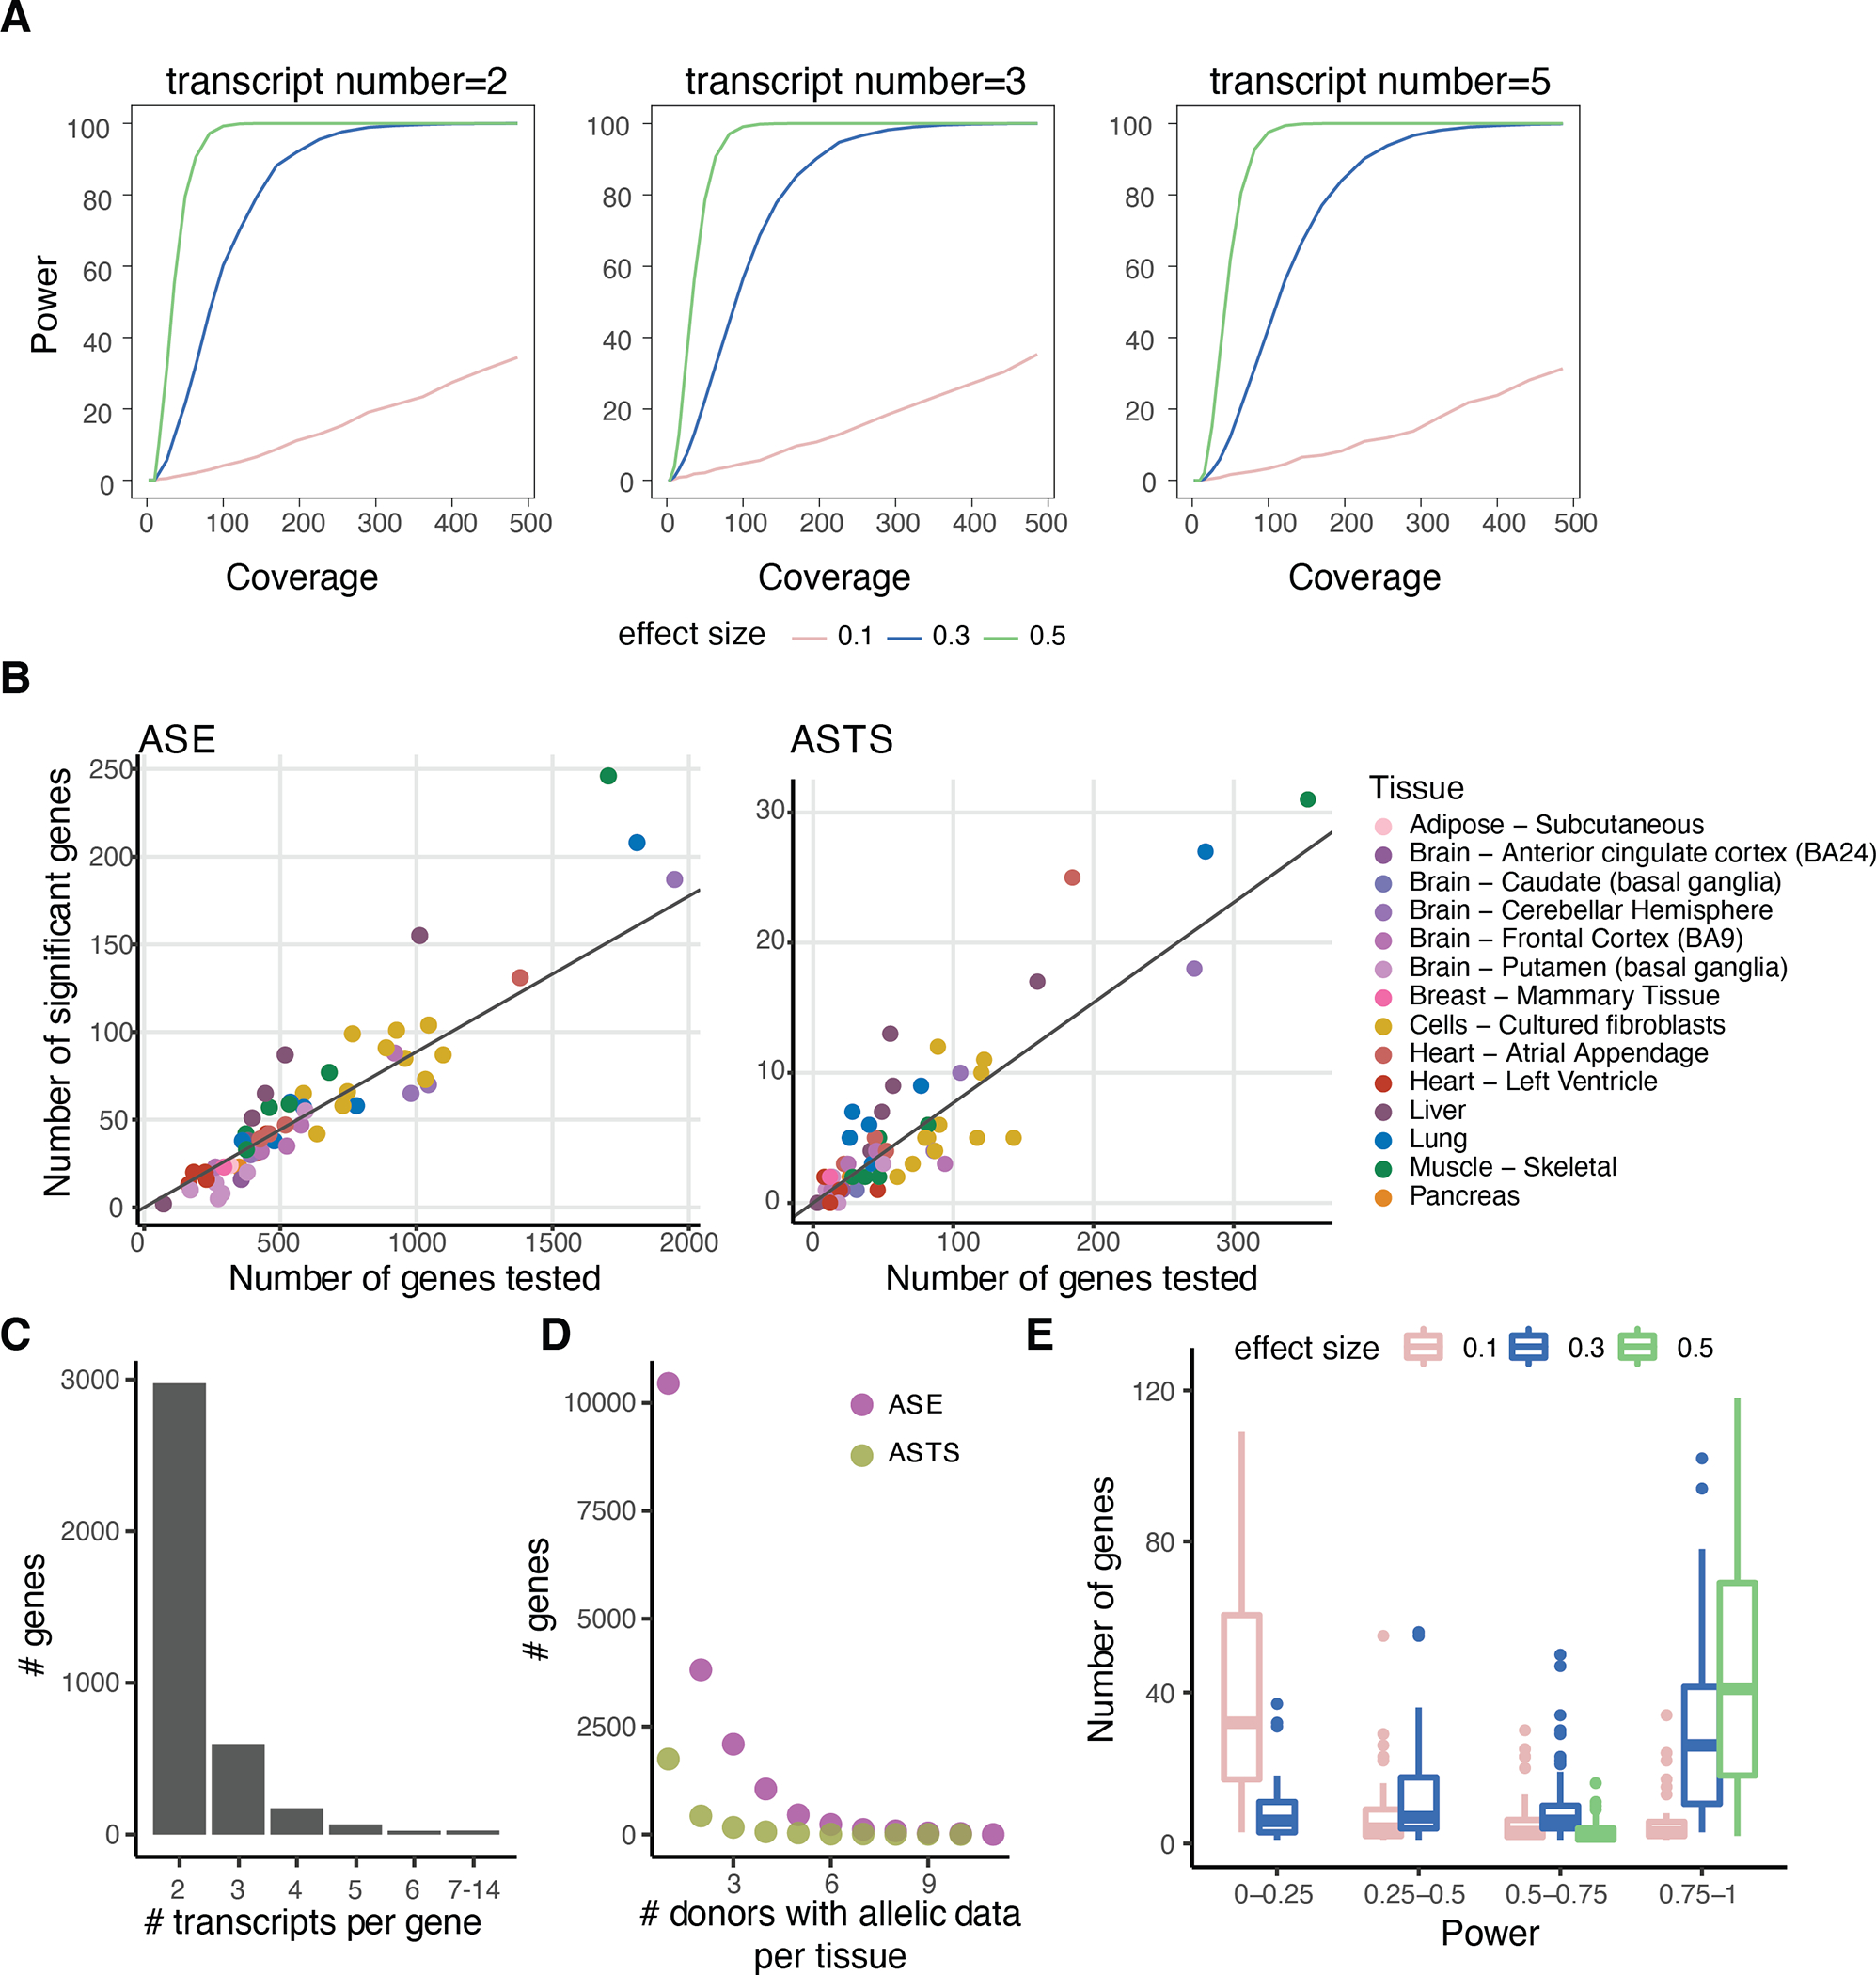
A) Estimated power for different number of transcripts (2, 3 or 5) with respect to the coverage (x-axis) for effect sizes 0.1 (low), 0.3 (medium) and 0.5 (high), derived from simulated count data. B) Number of genes tested for allele-specific expression (ASE) and allele-specific transcript structure (ASTS) and number of significant genes. The diagonal indicates the median percentage of significant genes (9% and 9%, respectively). C) Number of transcripts per gene tested for ASTS. D) Number of genes with allelic data across donors per tissue for ASE and ASTS. E) Total number of genes calculated per sample at different levels of powerOutliers are hidden for ease of viewing. The center corresponds to the median, the lower and upper hinges correspond to the 25th and 75th percentiles and the whiskers extend from the hinge to the smallest/largest value no further than 1.5 * inter-quartile range from the hinge.
Extended Figure 11: Comparison of allele specific expression between ONT and Illumina.
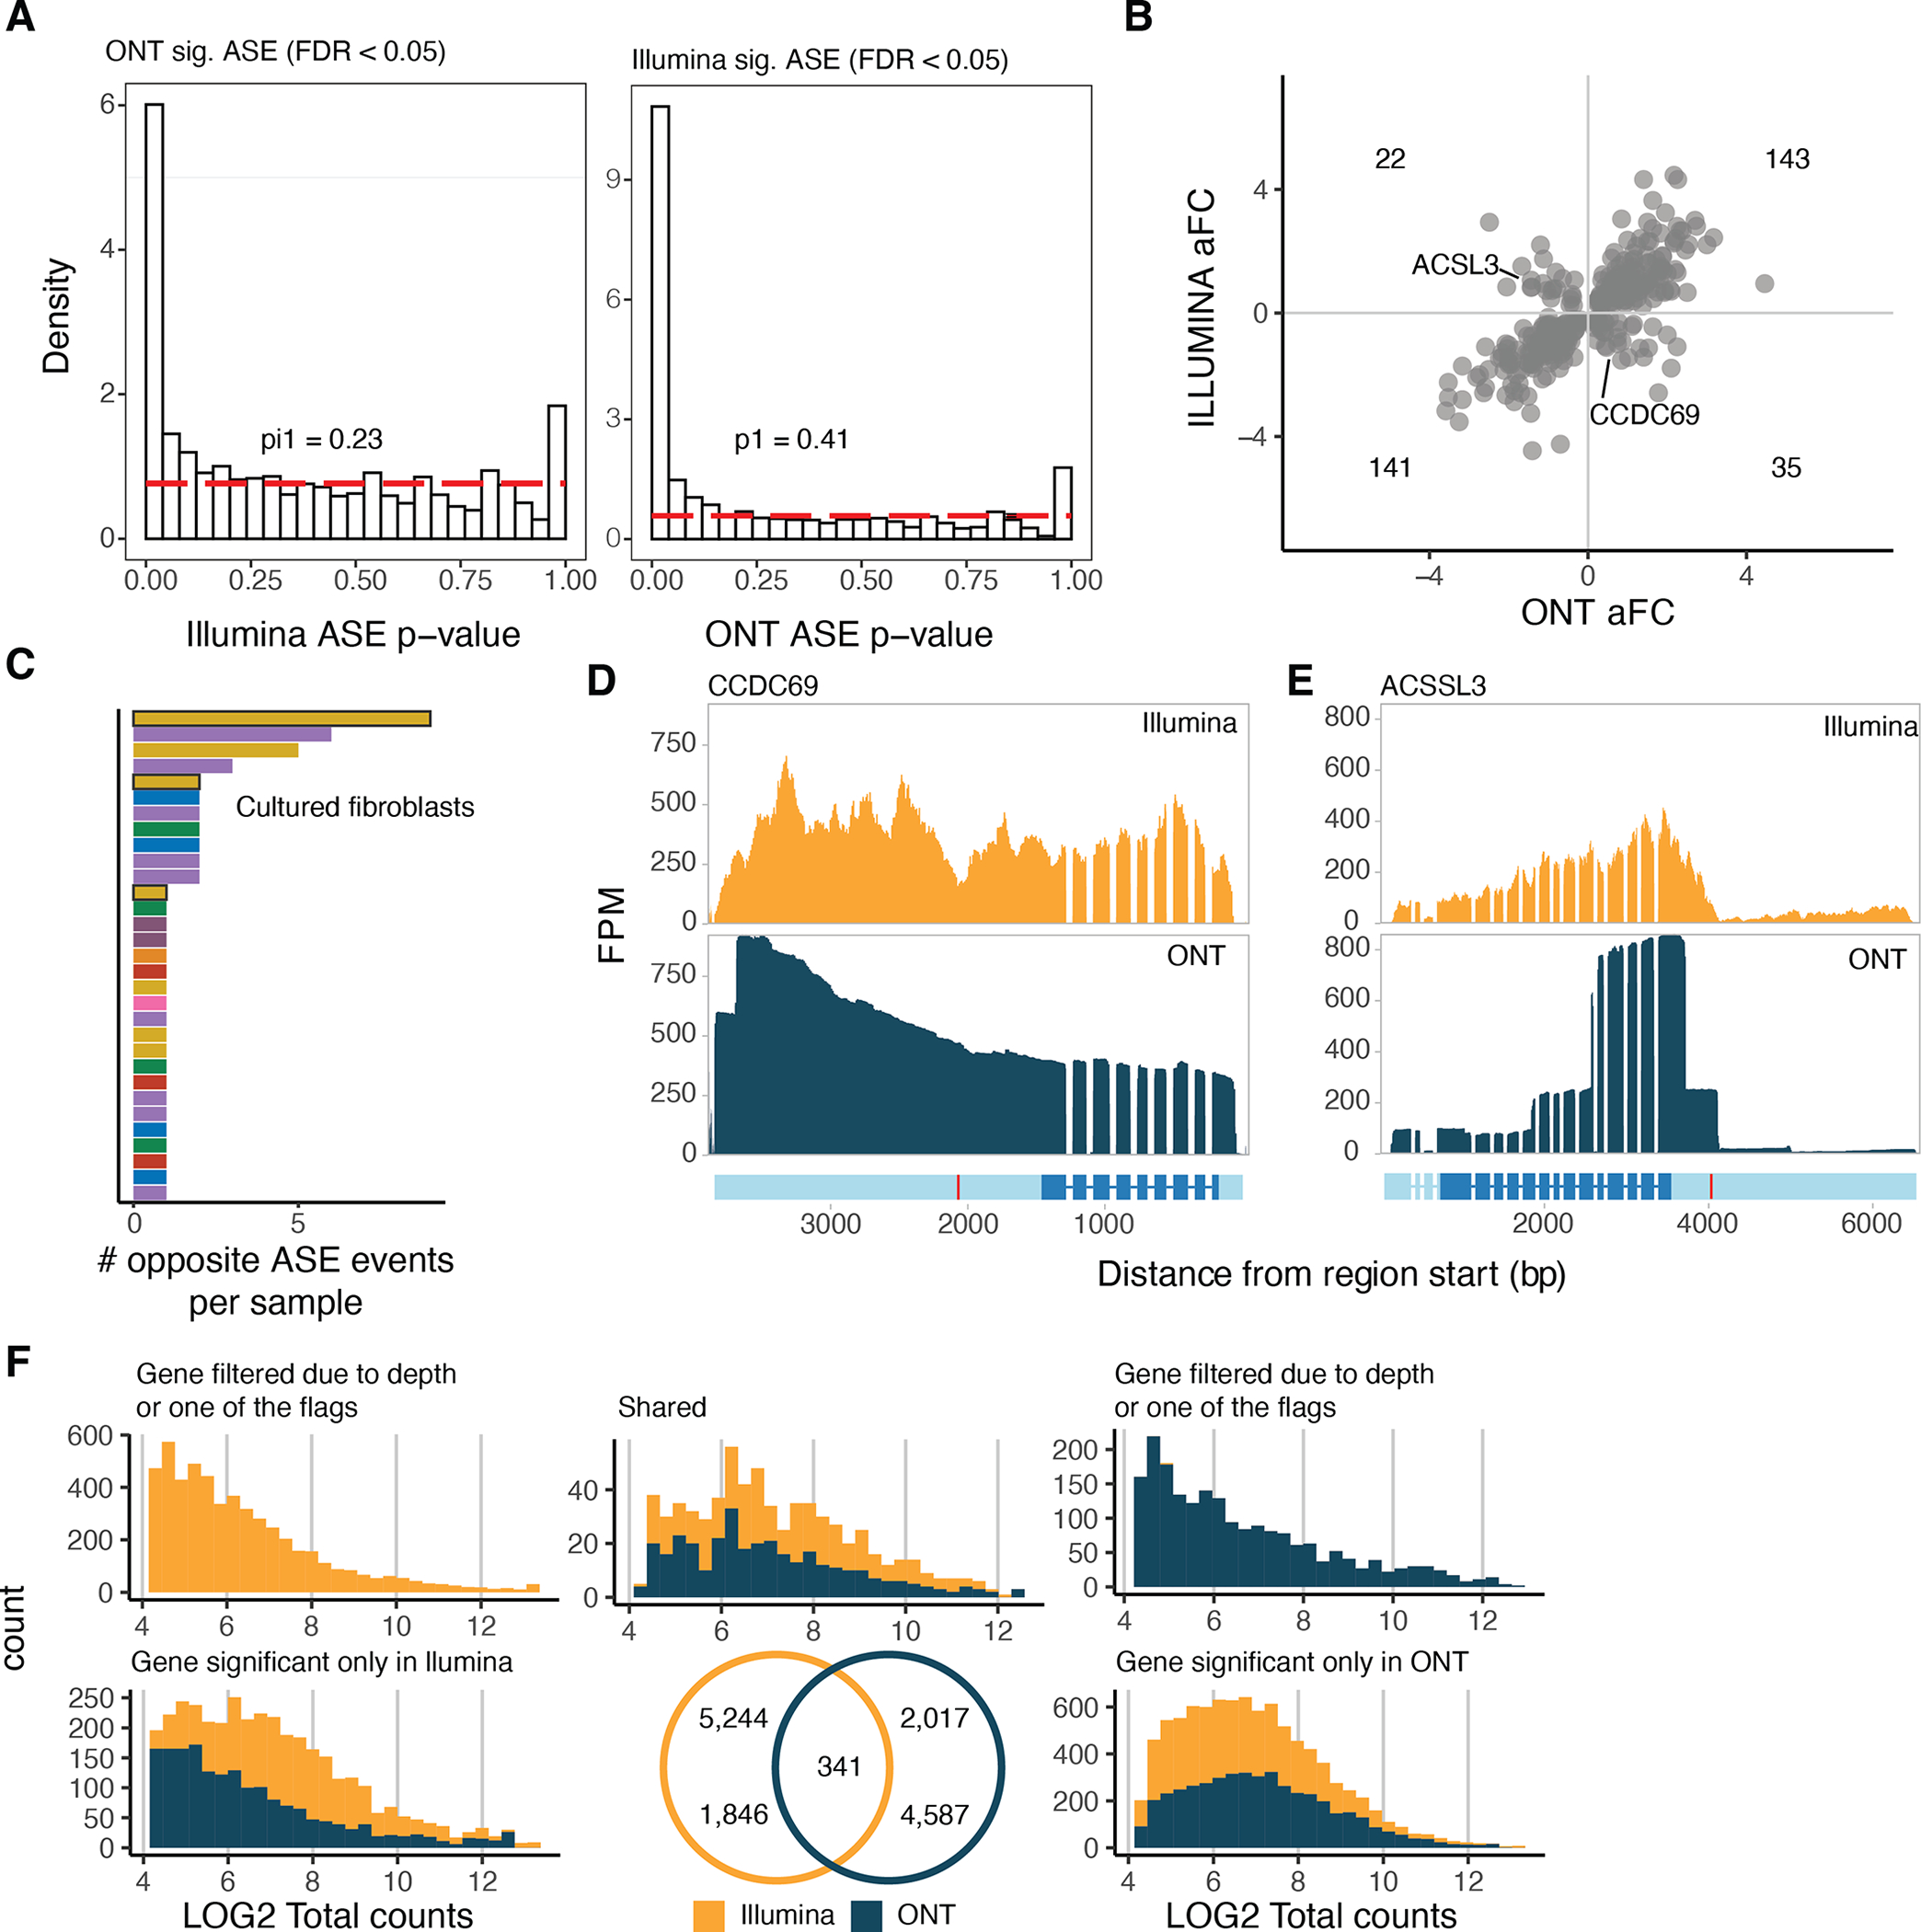
A) Proportion of significant ASE genes discovered using Illumina or ONT and replicated in the other method. Pi1 calculations are carried out up to p-value = 0.5. B) Log allelic fold-change of Illumina and ONT of the shared ASE genes. C) Number of ASE events with opposite directions between ONT and Illumina per sample. Highlighted are the five fibroblast cell lines that were further cultured prior to sequencing, where 12/57 events were observed. RNA-seq read pile-ups for D) CCDC69 and E) ACSSL3 which have ASE in the opposite direction between the two methods. In red is shown the variant used to parse the reads between the two haplotypes. CCDC69 differences can be attributed to a depression in the Illumina read pile-ups while ACSSL3 can be attributed to the variant being in the 3’UTR, which is not well captured by Illumina reads. F) Venn diagram of the significant ASE genes discovered by Illumina and ONT. The LOG2 of total counts for each method is shown for each group of the Venn diagram.
Extended Figure 12: Alternative transcript structure event annotation of allele specific events.
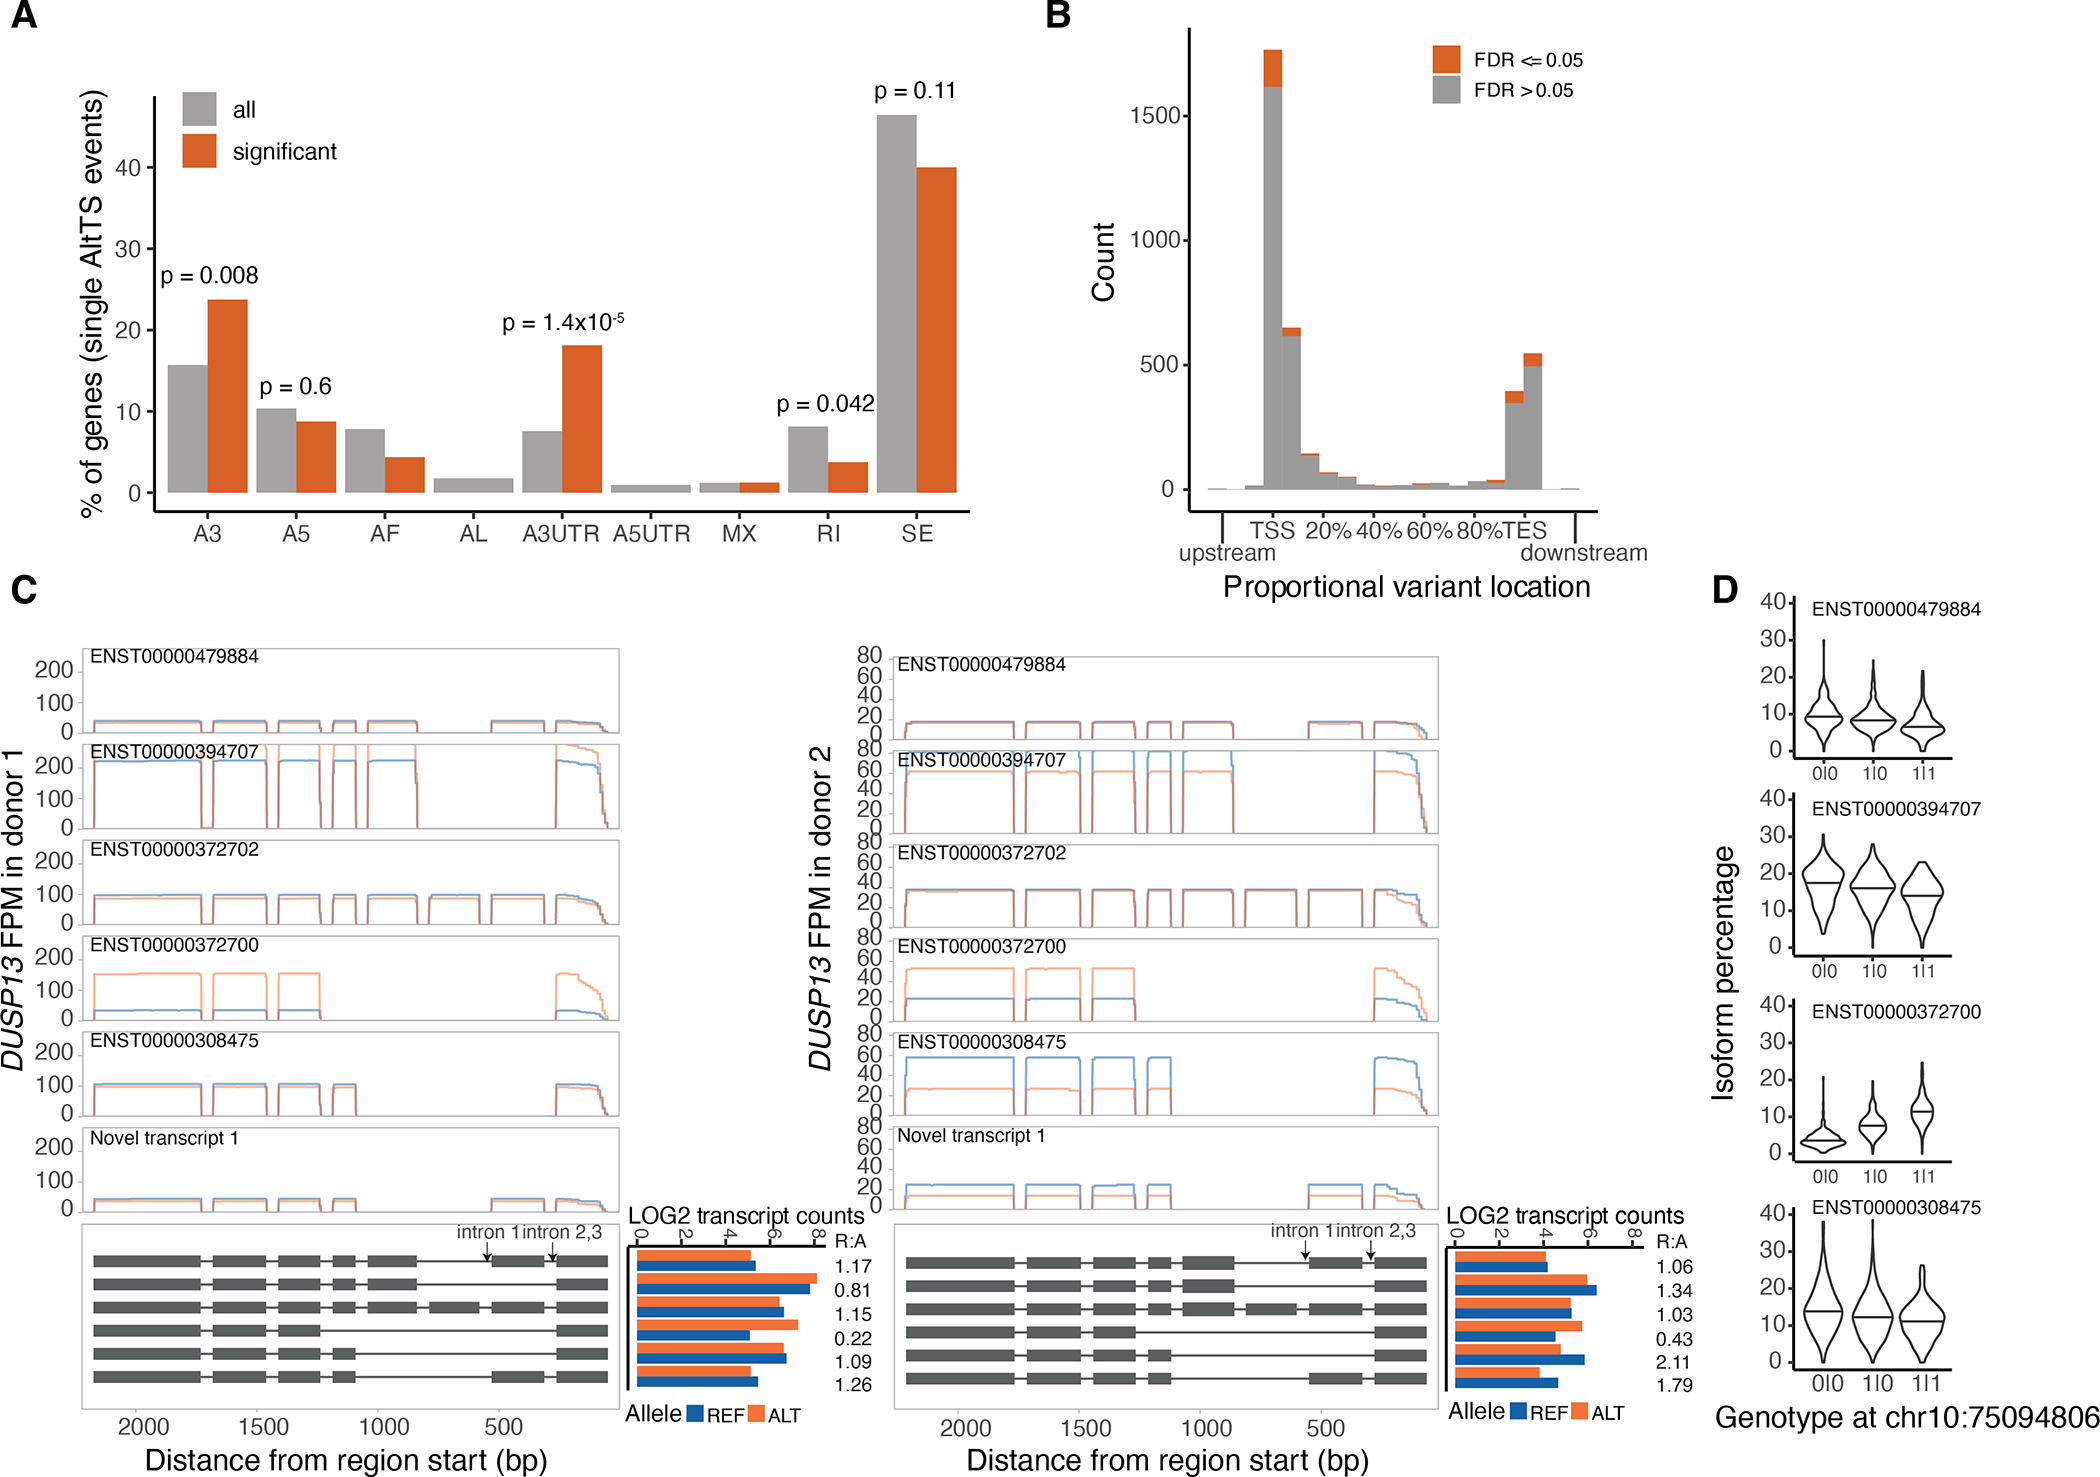
A) Percentage of genes displaying a single alternative transcript structure event. P-values were calculated using a two-sided binomial test. A3: alternative 3’ splice site; A5: alternative 5’ splice site; AF: alternative first exon; AL: alternative last exon; A3UTR: alternative 3’ end; A5UTR: alternative 5’ end; MX: mutually exclusive exons; RI: retained intron; SE: skipped exon. B) Average relative location of heterozygous variant used for ASTS event, by grouping all the transcripts of an ASTS event together. C) Read pile-ups per transcript for the two donors displaying ASTS in DUSP13 gene. In the lower panel the transcript structure is shown, without details of the coding sequence. D) Transcript percentage for four of the five DUSP13 annotated transcripts with high read coverage in the GTEx v8.
Extended Figure 13: Differential expression analysis between PTBP1-KD and control samples.
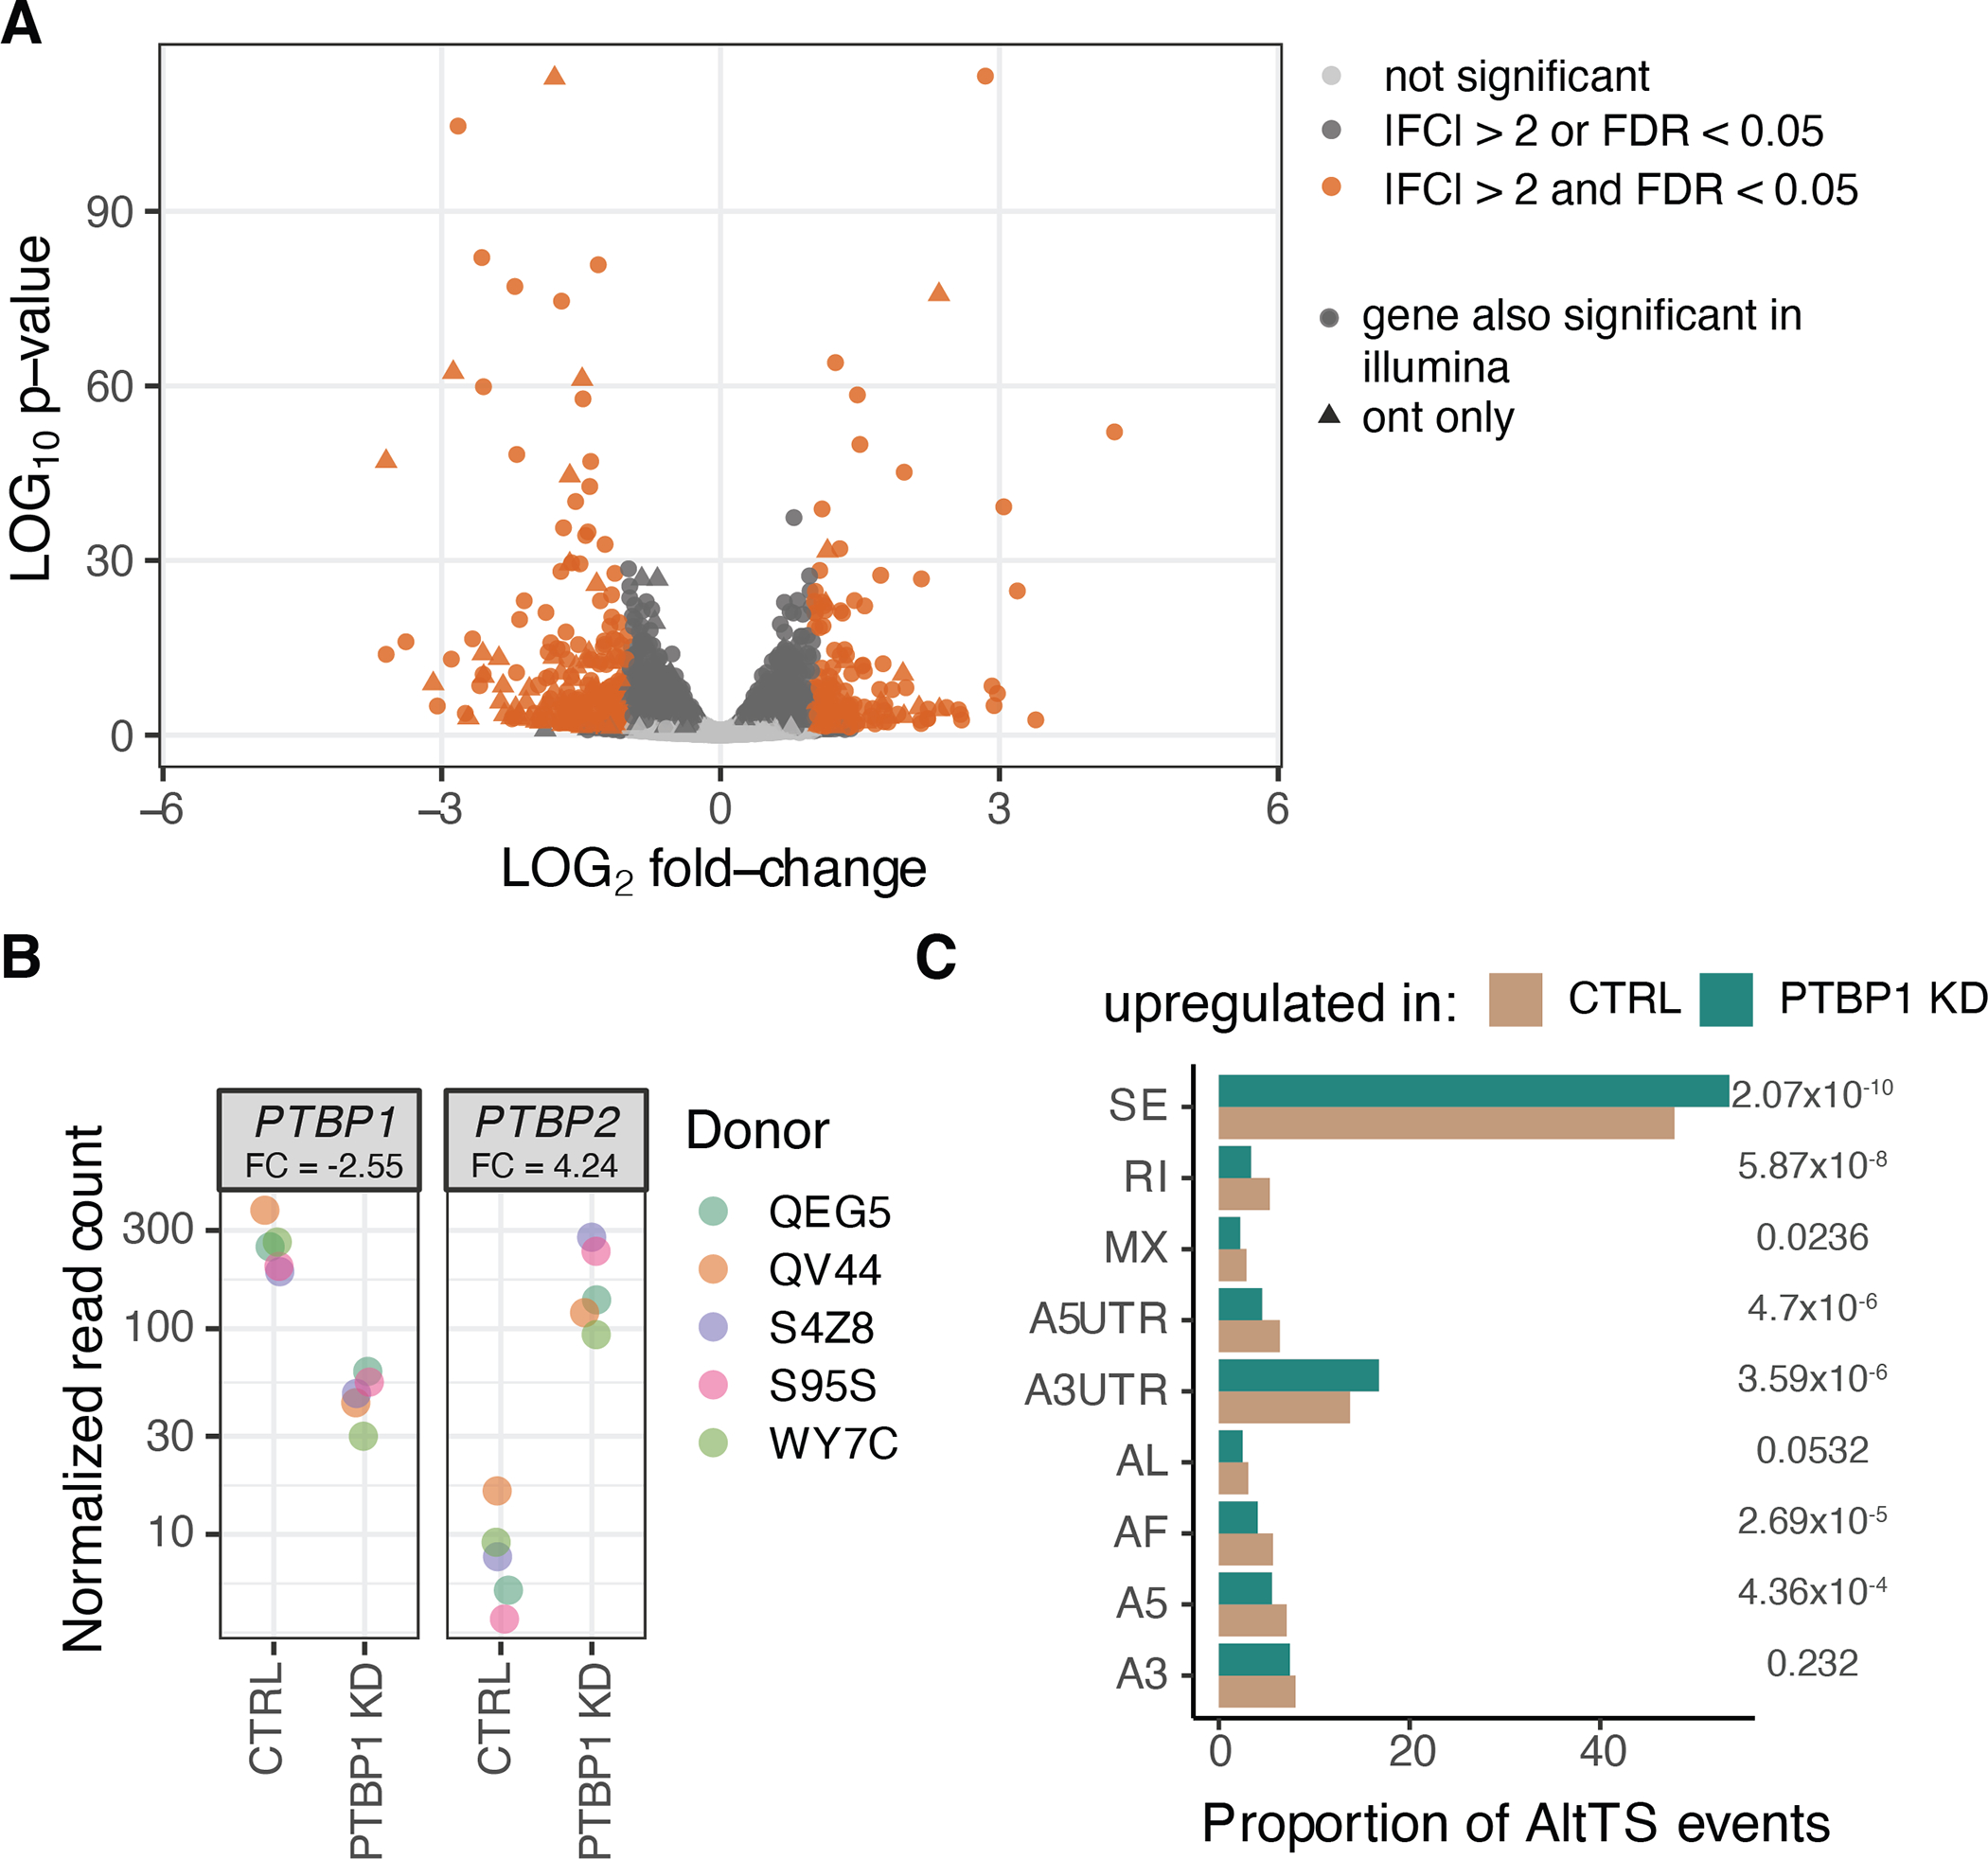
A) Volcano plot from differential gene expression between control and samples with PTBP1 knockdown using ONT data. P-values were calculated using the Wald test in DESeq2. B) Gene expression profile in PTBP1 and PTBP2 genes (PTBP2 under normal circumstances has its expression restricted to the brain). C) Proportion of different alternative transcript structure events in transcripts upregulated in the control or the PTBP1 knockdown samples. P-values were calculated using a two-sided proportionality test.
Extended Figure 14: Allele specific analysis of PTBP1-KD and control samples.
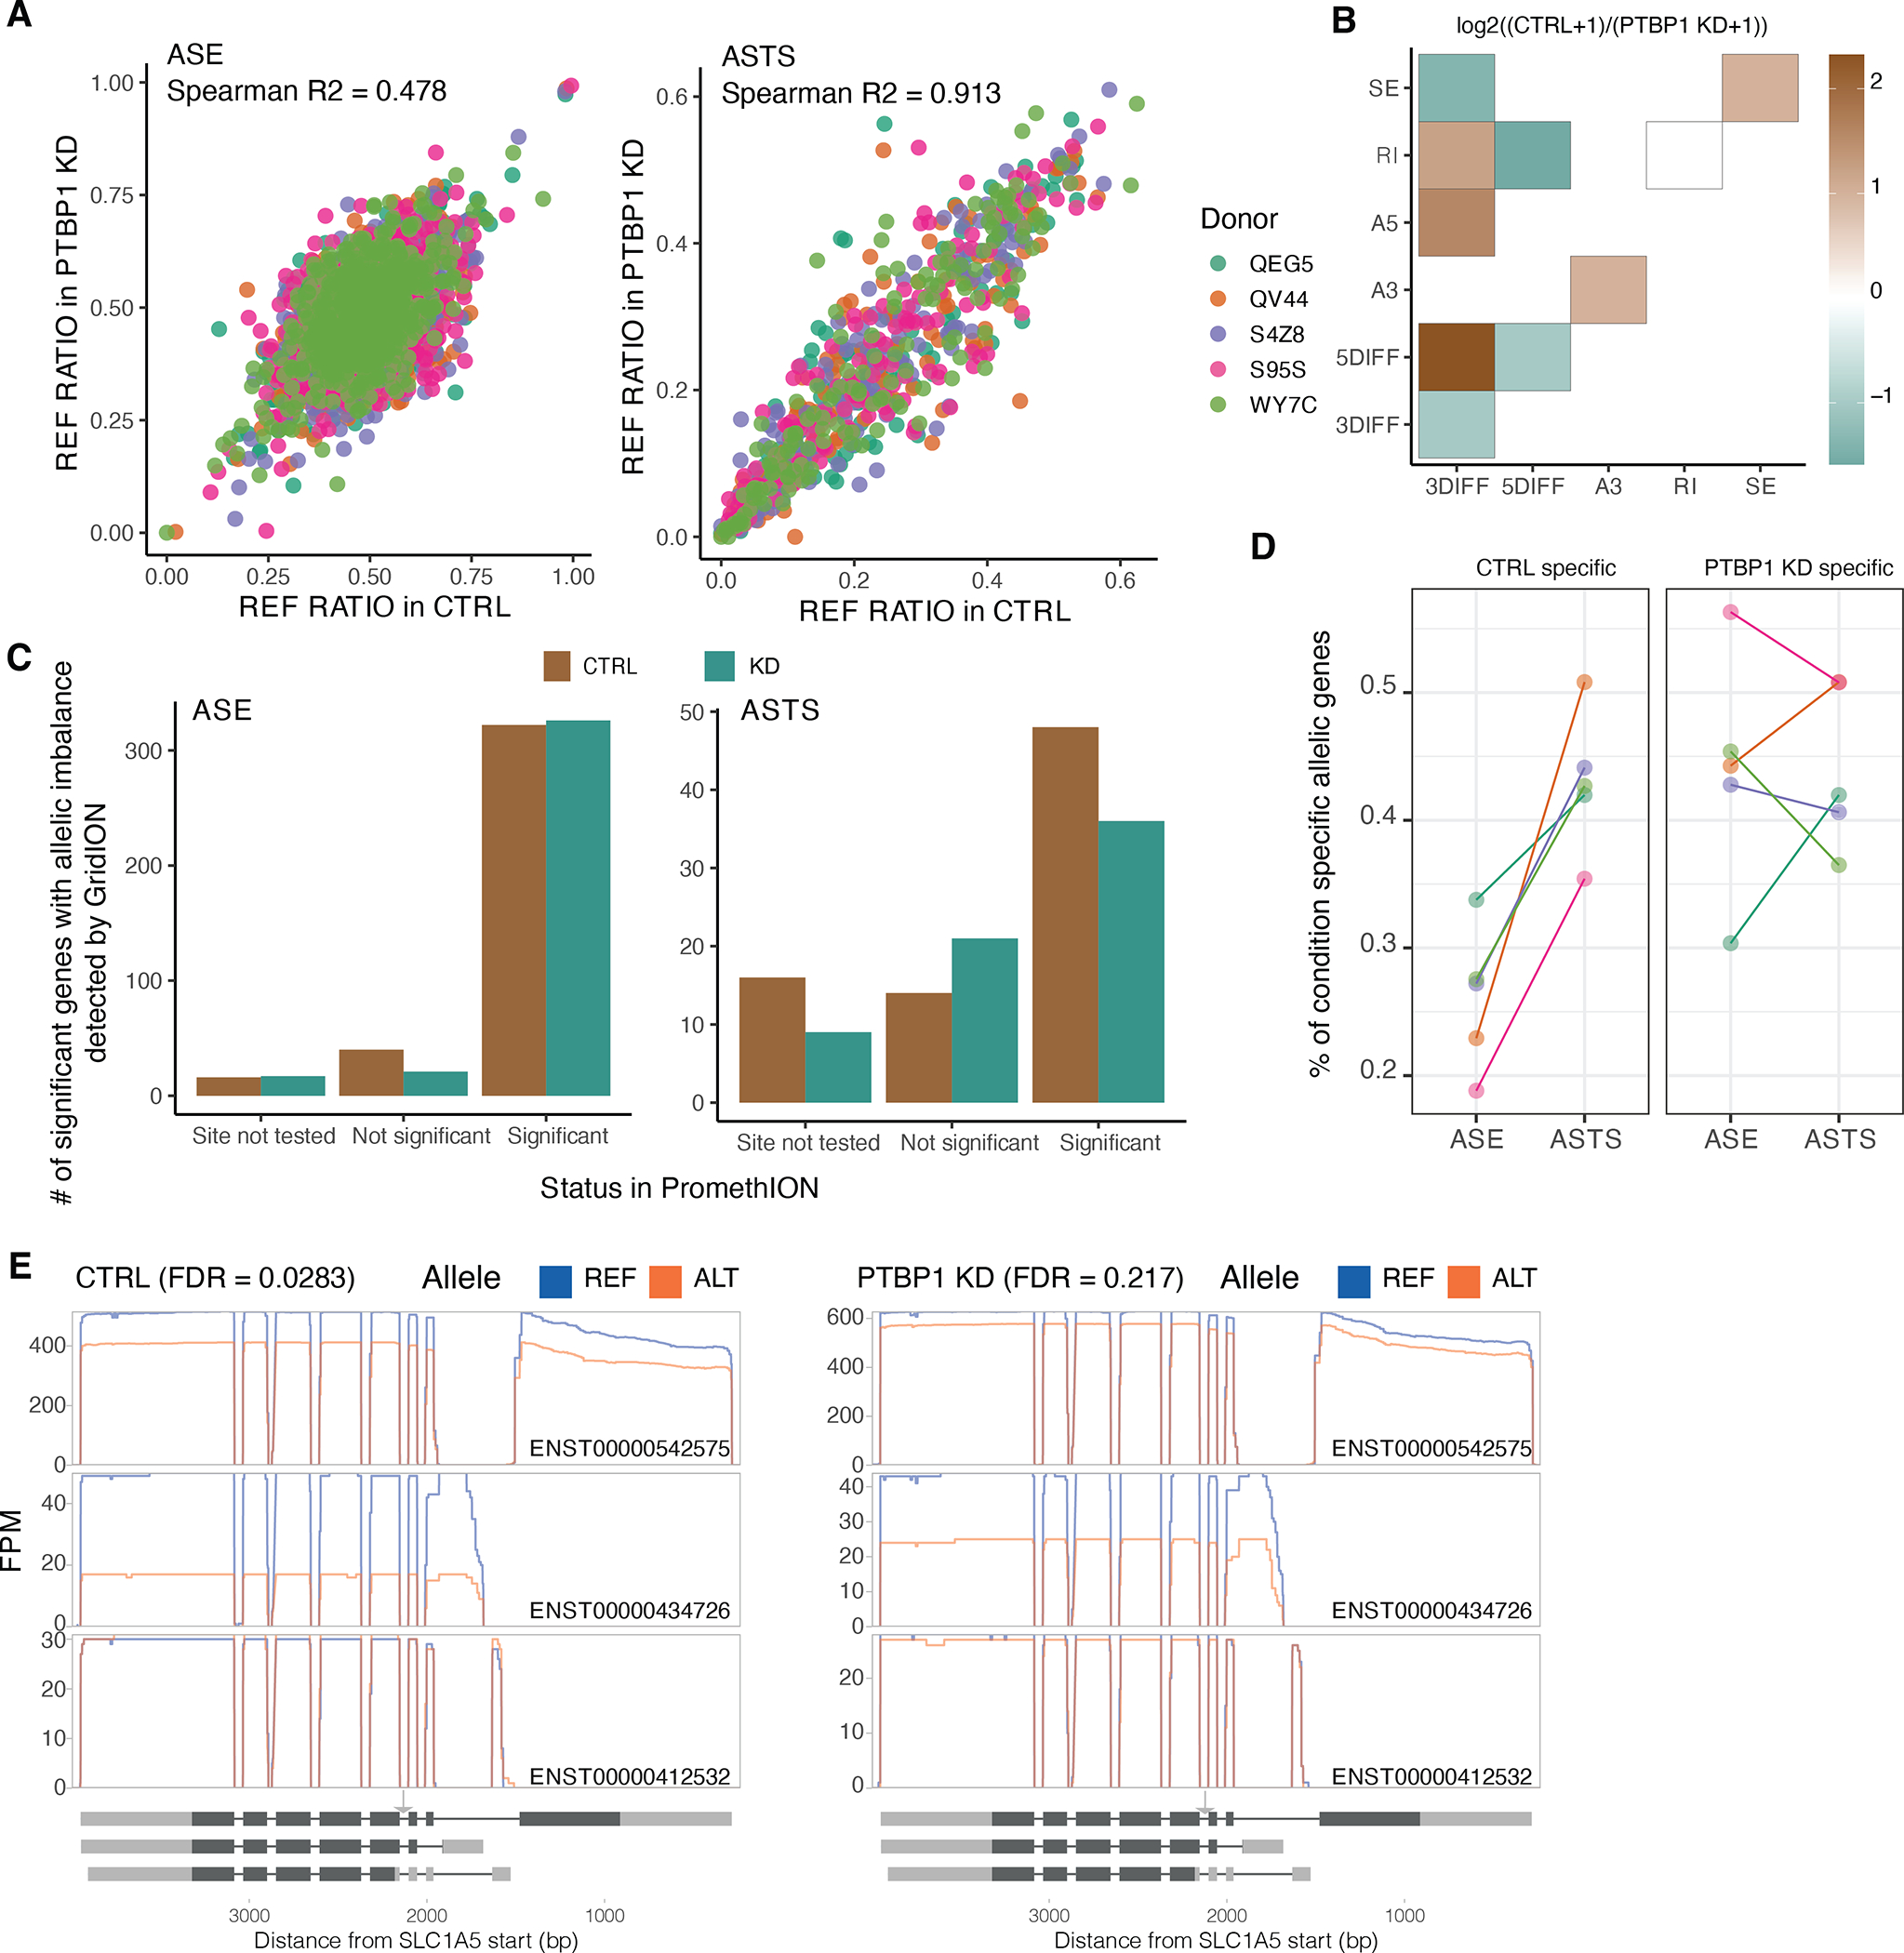
A) Correlation between the control and the PTBP1 knockdown samples in the reference ratio of gene expression and transcript structure. B) Changes in ASTS by PTPB1 knockdown, as assayed by gridION, with the heatmap showing the co-occurrence of alternative transcript structure events that are observed at least once per each event (or a single time for the diagonal) in a given gene. Color corresponds to the log2 ratio of the number of events found in the control over PTBP1 knockdown (KD) samples. C) Number of significant ASE and ASTS genes found by GridION categorized based on their status in the PromethION data from the same samples. D) Proportion of genes displaying allele-specific patterns specifically in either control or PTBP1 knockdown samples. E) SLC1A5 gene transcript read pile-ups which display significant ASTS only in the control sample only. The arrow indicates the location of the PTBP1 eCLIP site which contains a heterozygous variant in that donor.
Extended Figure 15: Variant interpretation through novel transcripts and allele-specific transcript structure analysis.
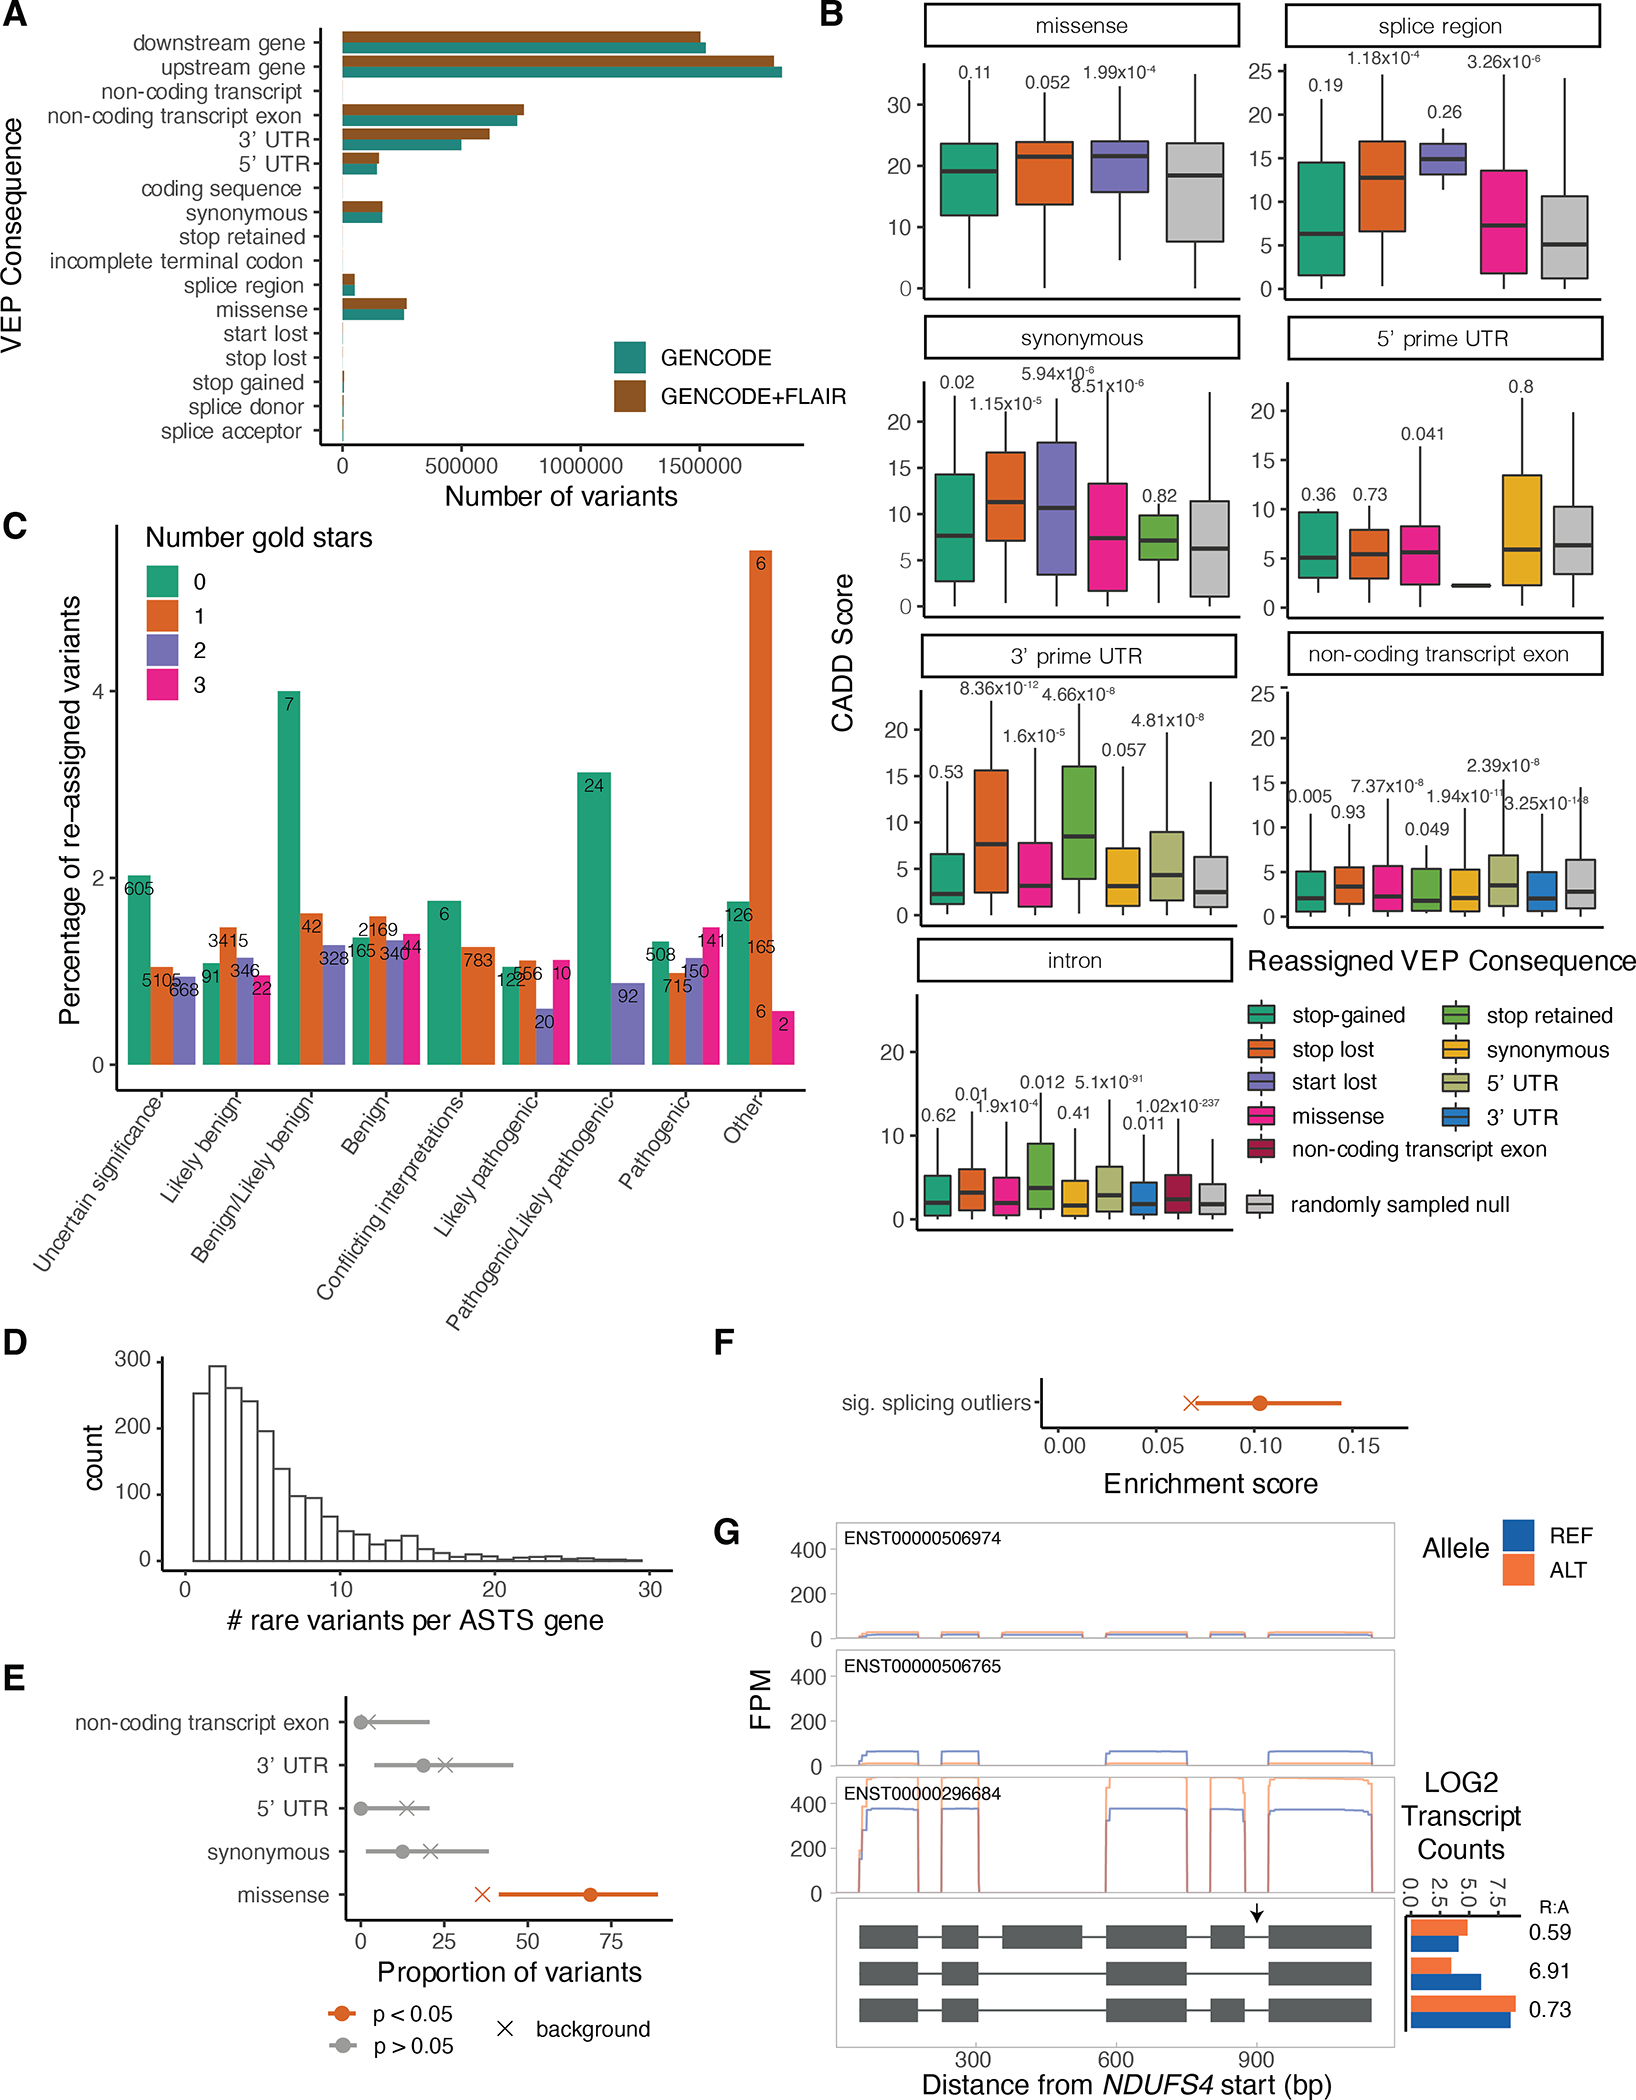
A) Number of variants per variant effect predictor (VEP) category using GENCODE v26 protein-coding genes with or without novel FLAIR transcripts. B) CADD score distribution of variants that were reassigned to a more severe consequence when the GENCODE gene annotations were complemented with the novel FLAIR transcripts, compared to variants that retained their annotation (down sampled to a similar size). P-values from two-sided t-test. The center corresponds to the median, the lower and upper hinges correspond to the 25th and 75th percentiles and the whiskers extend from the hinge to the smallest/largest value no further than 1.5 * inter-quartile range from the hinge. C) Percentage of variants per clinical significance category that get reassigned when supplementing the gene annotation with the novel transcripts. The numbers above the bars correspond to the number of re-assigned variants. D) Number of rare variants per ASTS gene (10kb window around gene). E) Proportion of rare heterozygous variants per annotation in significant ASTS events. As a background all ASTS events were used, and p-values were calculated using a two-sided binomial testing. F) Enrichment of the significant ASTS genes within splicing outliers. As a background all ASTS genes were used and p-values were calculated using a two-sided binomial test. G) NDUFS4 as an example of a gene with a rare heterozygous variant in a sample that is a GTEx splicing outlier and has significant ASTS, with read pileups, with grey arrows indicating the rare variants. Log normalised transcript counts per allele are plotted per transcript, with the REF:ALT ratios marked for each.
Supplementary Material
Acknowledgements:
We thank Michael Micorescu and Konstantinos Potamousis from the Oxford Nanopore Technologies commercial team for their help in generating the data.
Funding:
DAG was funded by NIH grants R01GM124486 and U24DK112331. TL was funded by NIH grants R01GM124486, R01GM122924, R01AG057422 and UM1HG008901. PH was funded by NIH grant R01GM124486. AG was funded by Roy and Diana Vagelos Pilot Grant. Funding for long read sequencing of GTEx samples at the Broad was provided by a Broad Ignite grant. NE, and PM were supported by NIGMS award R01GM140287. NRT was funded by NIH grant K01-HL140187.
Footnotes
Conflicts of interest: DAG is currently a fellow at Vertex Pharmaceuticals. XD, EDH, and SJ are employees of Oxford Nanopore Technologies and are shareholders and/or share option holders. FA has been an employee of Illumina, Inc., since 8 November 2021. PTE has received sponsored research support from Bayer AG and IBM Health, and he has served on advisory boards or consulted for Bayer AG, MyoKardia and Novartis; none of these activities are related to the work presented here. DGM is a founder with equity in Goldfinch Bio, a paid advisor to GSK, Insitro, Third Rock Ventures, and Foresite Labs, and has received research support from AbbVie, Astellas, Biogen, BioMarin, Eisai, Merck, Pfizer, and Sanofi-Genzyme; none of these activities are related to the work presented here. BC is currently employed at Third Rock Ventures. The other authors declare no competing interests.
Code availability
All original code used in the manuscript is released as part of a software package: https://github.com/LappalainenLab/lorals. General scripts are available at: https://github.com/LappalainenLab/lorals_paper_code (https://doi.org/10.5281/zenodo.6529254).
Data availability
Raw long read data generated as part of this manuscript are available in the GTEx v9 release under dbGAP accession number phs000424.v9 and on AnVIL at https://anvil.terra.bio/#workspaces/anvil-datastorage/AnVIL_GTEx_V9_hg38. The GTF file of flair transcripts, along with the transcript-level overall and allelic expression quantifications from GENCODE v26 and flair transcripts are available on the GTEx portal (https://gtexportal.org/home/datasets). The GTEx WGS, Illumina short-read, the allelic analysis, eQTLs and sQTLs and enloc colocalization files which are all part of the GTEx v8 release phs000424.v8. Additionally, we used the transcript and gene counts available on (https://gtexportal.org/home/datasets). The GRCh38 human genome reference and GENCODEv26 processed for GTEx were used in this analysis (https://console.cloud.google.com/storage/browser/gtex-resources). The CHESS and Workman transcript datasets were downloaded from GitHub (https://github.com/chess-genome/chess and https://github.com/nanopore-wgs-consortium/NA12878). ENCODE eCLIP data was downloaded from https://www.encodeproject.org/.
References
- 1.Park E, Pan Z, Zhang Z, Lin L & Xing Y The Expanding Landscape of Alternative Splicing Variation in Human Populations. Am. J. Hum. Genet. 102, 11–26 (2018). [DOI] [PMC free article] [PubMed] [Google Scholar]
- 2.Nicolae DL et al. Trait-Associated SNPs Are More Likely to Be eQTLs: Annotation to Enhance Discovery from GWAS. PLoS Genet. 6, e1000888 (2010). [DOI] [PMC free article] [PubMed] [Google Scholar]
- 3.Li YI et al. RNA splicing is a primary link between genetic variation and disease. Science 352, 600–604 (2016). [DOI] [PMC free article] [PubMed] [Google Scholar]
- 4.Consortium GTEx. The GTEx Consortium atlas of genetic regulatory effects across human tissues. Science 369, 1318–1330 (2020). [DOI] [PMC free article] [PubMed] [Google Scholar]
- 5.Cummings BB et al. Improving genetic diagnosis in Mendelian disease with transcriptome sequencing. Sci. Transl. Med. 9, (2017). [DOI] [PMC free article] [PubMed] [Google Scholar]
- 6.Kremer LS et al. Genetic diagnosis of Mendelian disorders via RNA sequencing. Nat. Commun. 8, 15824 (2017). [DOI] [PMC free article] [PubMed] [Google Scholar]
- 7.Gonorazky HD et al. Expanding the Boundaries of RNA Sequencing as a Diagnostic Tool for Rare Mendelian Disease. Am. J. Hum. Genet. 104, 466–483 (2019). [DOI] [PMC free article] [PubMed] [Google Scholar]
- 8.Sedlazeck FJ, Lee H, Darby CA & Schatz MC Piercing the dark matter: bioinformatics of long-range sequencing and mapping. Nat. Rev. Genet. 19, 329–346 (2018). [DOI] [PubMed] [Google Scholar]
- 9.Amarasinghe SL et al. Opportunities and challenges in long-read sequencing data analysis. Genome Biol. 21, 30 (2020). [DOI] [PMC free article] [PubMed] [Google Scholar]
- 10.Oikonomopoulos S, Wang YC, Djambazian H, Badescu D & Ragoussis J Benchmarking of the Oxford Nanopore MinION sequencing for quantitative and qualitative assessment of cDNA populations. Sci. Rep. 6, 31602 (2016). [DOI] [PMC free article] [PubMed] [Google Scholar]
- 11.Weirather JL et al. Comprehensive comparison of Pacific Biosciences and Oxford Nanopore Technologies and their applications to transcriptome analysis. F1000Res. 6, 100 (2017). [DOI] [PMC free article] [PubMed] [Google Scholar]
- 12.Anvar SY et al. Full-length mRNA sequencing uncovers a widespread coupling between transcription initiation and mRNA processing. Genome Biol. 19, 46 (2018). [DOI] [PMC free article] [PubMed] [Google Scholar]
- 13.Tardaguila M et al. SQANTI: extensive characterization of long-read transcript sequences for quality control in full-length transcriptome identification and quantification. Genome Res. (2018) doi: 10.1101/gr.222976.117. [DOI] [PMC free article] [PubMed] [Google Scholar]
- 14.Workman RE et al. Nanopore native RNA sequencing of a human poly(A) transcriptome. Nat. Methods 16, 1297–1305 (2019). [DOI] [PMC free article] [PubMed] [Google Scholar]
- 15.Tilgner H, Grubert F, Sharon D & Snyder MP Defining a personal, allele-specific, and single-molecule long-read transcriptome. Proc. Natl. Acad. Sci. U. S. A. 111, 9869–9874 (2014). [DOI] [PMC free article] [PubMed] [Google Scholar]
- 16.Tilgner H et al. Comprehensive transcriptome analysis using synthetic long-read sequencing reveals molecular co-association of distant splicing events. Nat. Biotechnol. 33, 736–742 (2015). [DOI] [PMC free article] [PubMed] [Google Scholar]
- 17.Lappalainen T et al. Transcriptome and genome sequencing uncovers functional variation in humans. Nature 501, 506 (2013). [DOI] [PMC free article] [PubMed] [Google Scholar]
- 18.Battle A et al. Characterizing the genetic basis of transcriptome diversity through RNA-sequencing of 922 individuals. Genome Res. 24, 14–24 (2014). [DOI] [PMC free article] [PubMed] [Google Scholar]
- 19.Li YI et al. Annotation-free quantification of RNA splicing using LeafCutter. Nat. Genet. 50, 151–158 (2018). [DOI] [PMC free article] [PubMed] [Google Scholar]
- 20.Rivas MA et al. Human genomics. Effect of predicted protein-truncating genetic variants on the human transcriptome. Science 348, 666–669 (2015). [DOI] [PMC free article] [PubMed] [Google Scholar]
- 21.Smith D et al. A rare IL33 loss-of-function mutation reduces blood eosinophil counts and protects from asthma. PLoS Genet. 13, e1006659 (2017). [DOI] [PMC free article] [PubMed] [Google Scholar]
- 22.Mohammadi P et al. Genetic regulatory variation in populations informs transcriptome analysis in rare disease. Science 366, 351–356 (2019). [DOI] [PMC free article] [PubMed] [Google Scholar]
- 23.Trapnell C et al. Transcript assembly and quantification by RNA-Seq reveals unannotated transcripts and isoform switching during cell differentiation. Nat. Biotechnol. 28, 511–515 (2010). [DOI] [PMC free article] [PubMed] [Google Scholar]
- 24.Li B & Dewey CN RSEM: accurate transcript quantification from RNA-Seq data with or without a reference genome. BMC Bioinformatics 12, 323 (2011). [DOI] [PMC free article] [PubMed] [Google Scholar]
- 25.Bray NL, Pimentel H, Melsted P & Pachter L Erratum: Near-optimal probabilistic RNA-seq quantification. Nat. Biotechnol. 34, 888 (2016). [DOI] [PubMed] [Google Scholar]
- 26.Teng M et al. A benchmark for RNA-seq quantification pipelines. Genome Biol. 17, 74 (2016). [DOI] [PMC free article] [PubMed] [Google Scholar]
- 27.Patro R, Duggal G, Love MI, Irizarry RA & Kingsford C Salmon provides fast and bias-aware quantification of transcript expression. Nat. Methods 14, 417–419 (2017). [DOI] [PMC free article] [PubMed] [Google Scholar]
- 28.Pai AA et al. Widespread shortening of 3’untranslated regions and increased exon inclusion are evolutionarily conserved features of innate immune responses to infection. PLoS Genet. 12, e1006338 (2016). [DOI] [PMC free article] [PubMed] [Google Scholar]
- 29.Alasoo K et al. Genetic effects on promoter usage are highly context-specific and contribute to complex traits. Elife 8, (2019). [DOI] [PMC free article] [PubMed] [Google Scholar]
- 30.Mittleman BE et al. Alternative polyadenylation mediates genetic regulation of gene expression. Elife 9, (2020). [DOI] [PMC free article] [PubMed] [Google Scholar]
- 31.Tang AD et al. Full-length transcript characterization of SF3B1 mutation in chronic lymphocytic leukemia reveals downregulation of retained introns. Nat. Commun. 11, 1438 (2020). [DOI] [PMC free article] [PubMed] [Google Scholar]
- 32.Jiang L et al. A Quantitative Proteome Map of the Human Body. Cell 183, 269–283.e19 (2020). [DOI] [PMC free article] [PubMed] [Google Scholar]
- 33.Yeo G, Holste D, Kreiman G & Burge CB Variation in alternative splicing across human tissues. Genome Biol. 5, R74 (2004). [DOI] [PMC free article] [PubMed] [Google Scholar]
- 34.Reyes A & Huber W Alternative start and termination sites of transcription drive most transcript isoform differences across human tissues. Nucleic Acids Res. 46, 582–592 (2018). [DOI] [PMC free article] [PubMed] [Google Scholar]
- 35.Castel SE et al. A vast resource of allelic expression data spanning human tissues. Genome Biol. 21, 234 (2020). [DOI] [PMC free article] [PubMed] [Google Scholar]
- 36.Van Nostrand EL et al. A large-scale binding and functional map of human RNA-binding proteins. Nature 583, 711–719 (2020). [DOI] [PMC free article] [PubMed] [Google Scholar]
- 37.McLaren W et al. The Ensembl Variant Effect Predictor. Genome Biol. 17, 122 (2016). [DOI] [PMC free article] [PubMed] [Google Scholar]
- 38.Ferraro NM et al. Transcriptomic signatures across human tissues identify functional rare genetic variation. Science vol. 369 eaaz5900 (2020). [DOI] [PMC free article] [PubMed] [Google Scholar]
- 39.Yang X et al. Widespread Expansion of Protein Interaction Capabilities by Alternative Splicing. Cell 164, 805–817 (2016). [DOI] [PMC free article] [PubMed] [Google Scholar]
- 40.Castel SE, Levy-Moonshine A, Mohammadi P, Banks E & Lappalainen T Tools and best practices for data processing in allelic expression analysis. Genome Biol. 16, 195 (2015). [DOI] [PMC free article] [PubMed] [Google Scholar]
- 41.Sibley CR et al. Recursive splicing in long vertebrate genes. Nature 521, 371–375 (2015). [DOI] [PMC free article] [PubMed] [Google Scholar]
- 42.Scotti MM & Swanson MS RNA mis-splicing in disease. Nat. Rev. Genet. 17, 19–32 (2016). [DOI] [PMC free article] [PubMed] [Google Scholar]
- 43.Gandal MJ et al. Transcriptome-wide isoform-level dysregulation in ASD, schizophrenia, and bipolar disorder. Science 362, (2018). [DOI] [PMC free article] [PubMed] [Google Scholar]
Methods References
- 44.GTEx Consortium. Human genomics. The Genotype-Tissue Expression (GTEx) pilot analysis: multitissue gene regulation in humans. Science 348, 648–660 (2015). [DOI] [PMC free article] [PubMed] [Google Scholar]
- 45.Li H Minimap2: pairwise alignment for nucleotide sequences. Bioinformatics 34, 3094–3100 (2018). [DOI] [PMC free article] [PubMed] [Google Scholar]
- 46.De Coster W, D’Hert S, Schultz DT, Cruts M & Van Broeckhoven C NanoPack: visualizing and processing long-read sequencing data. Bioinformatics 34, 2666–2669 (2018). [DOI] [PMC free article] [PubMed] [Google Scholar]
- 47.Alasoo K Wiggleplotr: Make read coverage plots from bigwig files. (2017).
- 48.Pertea M et al. CHESS: a new human gene catalog curated from thousands of large-scale RNA sequencing experiments reveals extensive transcriptional noise. Genome Biol. 19, 208 (2018). [DOI] [PMC free article] [PubMed] [Google Scholar]
- 49.Pertea G & Pertea M GFF Utilities: GffRead and GffCompare. F1000Research vol. 9 304 (2020). [DOI] [PMC free article] [PubMed] [Google Scholar]
- 50.Trincado JL et al. SUPPA2: fast, accurate, and uncertainty-aware differential splicing analysis across multiple conditions. Genome Biol. 19, 40 (2018). [DOI] [PMC free article] [PubMed] [Google Scholar]
- 51.Keller A, Nesvizhskii AI, Kolker E & Aebersold R Empirical statistical model to estimate the accuracy of peptide identifications made by MS/MS and database search. Anal. Chem. 74, 5383–5392 (2002). [DOI] [PubMed] [Google Scholar]
- 52.Deutsch EW et al. Trans-Proteomic Pipeline, a standardized data processing pipeline for large-scale reproducible proteomics informatics. Proteomics Clin. Appl. 9, 745–754 (2015). [DOI] [PMC free article] [PubMed] [Google Scholar]
- 53.Love MI, Huber W & Anders S Moderated estimation of fold change and dispersion for RNA-seq data with DESeq2. Genome Biol. 15, 550 (2014). [DOI] [PMC free article] [PubMed] [Google Scholar]
- 54.Nowicka M & Robinson MD DRIMSeq: a Dirichlet-multinomial framework for multivariate count outcomes in genomics. F1000Research vol. 5 1356 (2016). [DOI] [PMC free article] [PubMed] [Google Scholar]
- 55.Edge P, Bafna V & Bansal V HapCUT2: robust and accurate haplotype assembly for diverse sequencing technologies. Genome Res. 27, 801–812 (2017). [DOI] [PMC free article] [PubMed] [Google Scholar]
- 56.Mohammadi P, Castel SE, Brown AA & Lappalainen T Quantifying the regulatory effect size of cis-acting genetic variation using allelic fold change. Genome Res. 27, 1872–1884 (2017). [DOI] [PMC free article] [PubMed] [Google Scholar]
- 57.Cohen J Statistical Power Analysis for the Behavioral Sciences. (Academic Press, 2013). [Google Scholar]
- 58.Van Nostrand EL et al. A large-scale binding and functional map of human RNA-binding proteins. Nature 583, 711–719 (2020). [DOI] [PMC free article] [PubMed] [Google Scholar]
- 59.Quinlan AR & Hall IM BEDTools: a flexible suite of utilities for comparing genomic features. Bioinformatics 26, 841–842 (2010). [DOI] [PMC free article] [PubMed] [Google Scholar]
- 60.Gremme G, Steinbiss S & Kurtz S GenomeTools: a comprehensive software library for efficient processing of structured genome annotations. IEEE/ACM Trans. Comput. Biol. Bioinform. 10, 645–656 (2013). [DOI] [PubMed] [Google Scholar]
- 61.Rentzsch P, Witten D, Cooper GM, Shendure J & Kircher M CADD: predicting the deleteriousness of variants throughout the human genome. Nucleic Acids Res. 47, D886–D894 (2019). [DOI] [PMC free article] [PubMed] [Google Scholar]
Associated Data
This section collects any data citations, data availability statements, or supplementary materials included in this article.
Supplementary Materials
Data Availability Statement
Raw long read data generated as part of this manuscript are available in the GTEx v9 release under dbGAP accession number phs000424.v9 and on AnVIL at https://anvil.terra.bio/#workspaces/anvil-datastorage/AnVIL_GTEx_V9_hg38. The GTF file of flair transcripts, along with the transcript-level overall and allelic expression quantifications from GENCODE v26 and flair transcripts are available on the GTEx portal (https://gtexportal.org/home/datasets). The GTEx WGS, Illumina short-read, the allelic analysis, eQTLs and sQTLs and enloc colocalization files which are all part of the GTEx v8 release phs000424.v8. Additionally, we used the transcript and gene counts available on (https://gtexportal.org/home/datasets). The GRCh38 human genome reference and GENCODEv26 processed for GTEx were used in this analysis (https://console.cloud.google.com/storage/browser/gtex-resources). The CHESS and Workman transcript datasets were downloaded from GitHub (https://github.com/chess-genome/chess and https://github.com/nanopore-wgs-consortium/NA12878). ENCODE eCLIP data was downloaded from https://www.encodeproject.org/.


