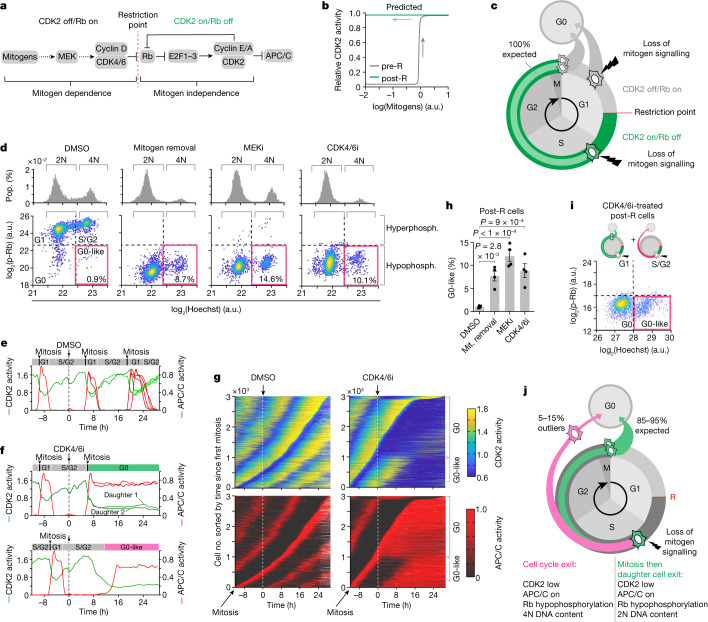
Fig. 1. Mitogen signalling maintains CDK2 activity in S/G2.
a, Textbook signalling pathway indicating that the R point marks the switch from mitogen dependence to independence. b, Mathematical model adapted from Yao et al.8 showing bistability and hysteresis in CDK2 activity with respect to mitogen signalling. c, Predicted fates for pre- and post-R cells made by the R-point model. d, Histograms show DNA content (upper panels). Scatterplots of Rb phosphorylation versus DNA content (lower panels). Pink boxes mark the G0-like state (hypophosphorylated Rb and 4N DNA content). The percentage of G0-like cells is indicated. N = 2,000 cells per condition. e, CDK2 and APC/C activity from an example MCF-10A cell treated with DMSO at the indicated time. The cell divides multiple times, giving rise to four granddaughter cells (Supplementary Video 1). f, CDK2 and APC/C activity from two example MCF-10A cells treated with CDK4/6i at the indicated time. In the upper panel, the cell divides, and its daughters arrest in G0. In the lower panel, the cell exits the cell cycle to a G0-like state without dividing (Supplementary Videos 2 and 3). g, Heat maps show CDK2 and APC/C activity sorted by time of mitosis for cells treated with DMSO (left panels) or a CDK4/6i (right panels). Extended Data Fig. 2b demonstrates how CDK2 and APC/C activities are converted to the heat map. h, Percentages of post-R cells that exit to the G0-like state after mitogen (Mit.) removal, MEKi or CDK4/6i. Error bars represent s.e.m. from n = 4 independent experiments. P values were calculated using a one-way analysis of variance. P values from top to bottom are 9 × 10⁻⁴, less than 1 × 10⁻⁴ and 2.8 × 10⁻³. i, Scatterplot of Rb phosphorylation versus DNA content for CDK4/6i-treated post-R cells from g showing two distinct cell cycle trajectories for post-R cells after loss of mitogen signalling. The pink box indicates the G0-like state, and cartoons (upper panel) show cell cycle trajectories. N = 3,621 cells. j, Schematic showing observed fate outcomes for post-R cells after loss of mitogen signalling. a.u., arbitrary unit. phosph., phosphorylation.

