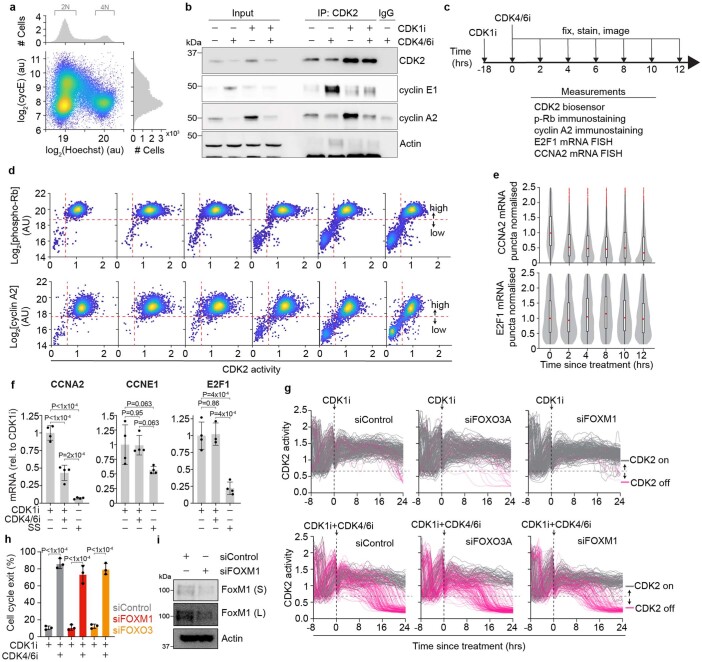
Extended Data Fig. 7. CDK4/6 activity maintains CCNA2 transcription.
a, Asynchronous HeLa cells were fixed and then stained with a cyclin E1 antibody. Histograms show DNA content (top) and cyclin E1 levels (right). Density scatter plot of cyclin E1 levels vs DNA content (bottom). N = 63,031 cells are plotted. b, Coimmunoprecipitation of CDK2 in either asynchronous cells or cells treated with a CDK1i overnight and then treated with and without a CDK4/6i for 4 hrs. Representative of n = 2 experiments. c, Schematic outlining the experimental design used for Fig. 3b and Extended Data Fig. 7d,e. Cells were first pre-treated with a CDK1i to enrich for post-R cells, and then treated with a CDK4/6i before being fixed, stained, and imaged at the indicated timepoints. d, Density scatter plots of cyclin A2 levels (top row) and phospho-Rb levels (bottom row) plotted against CDK2 activity measured in single-cells. The vertical dashed red line indicates the threshold of CDK2 activity that is required to maintain Rb phosphorylation (CDK2 = 0.6). The horizontal dashed red lines separate cells with hypo- vs hyper-phosphorylated Rb (bottom row) and cells with high vs low cyclin A2 protein levels (top row). N > 1,700 Cells per plot. e, Violin and box plots showing single-cell levels of CCNA2 mRNA puncta (top row) and E2F1 mRNA puncta as measured by mRNA FISH. mRNA puncta levels were normalized to the 0 hr treatment. Top: N = 3850, 0 hr; 1579, 2 hr; 2252, 4 hr; 2212, 8 hr; 2316, 10 hr; 2405, 12 hr cells. Bottom: N = 2908, 0hr; 1814, 2 hr; 2306, 4 hr; 1843, 8 hr; 2030, 10 hr; 2098, 12 hr cells. The box plots show the median (centre line), interquartile range (box limits), and minimum and maximum values (whiskers). f, qRT-PCR data showing mRNA levels normalized to CDK1i treated after treatment with a CDK4/6i for 2 hrs, or 24 hrs of mitogen removal as a positive control. Error bars represent SD from N = 3 replicates. Representative of n = 3 experiments. P-values were calculated using a one-way ANOVA. P-values from top to bottom; CCNA2: <1 × 10⁻⁴, <1 × 10⁻⁴, 2 × 10⁻⁴, CCNE1: 0.063, 0.95, 0.063, E2F1: 4 × 10⁻⁴, 0.86, 4 × 10⁻⁴. SS, serum starvation. g, Single-cell traces of CDK2 activity aligned to time of treatment for cells treated as indicated. Grey and pink traces represent cells with CDK2 > 0.6 and CDK2 < 0.6 at the end of the observation period, respectively. N = 200 Cells per plot. h, Quantification of the percent of cells that exit the cell cycle as in (g). Error bars represent SEM from n = 3 experiments. P-values were calculated using a one-way ANOVA. P-values from left to right: <1 × 10⁻⁴, <1 × 10⁻⁴, <1 × 10⁻⁴. i, Western blot validation of FoxM1 knockdown using siRNA. S, short exposure; L, long exposure. Representative of n = 2 experiments.

