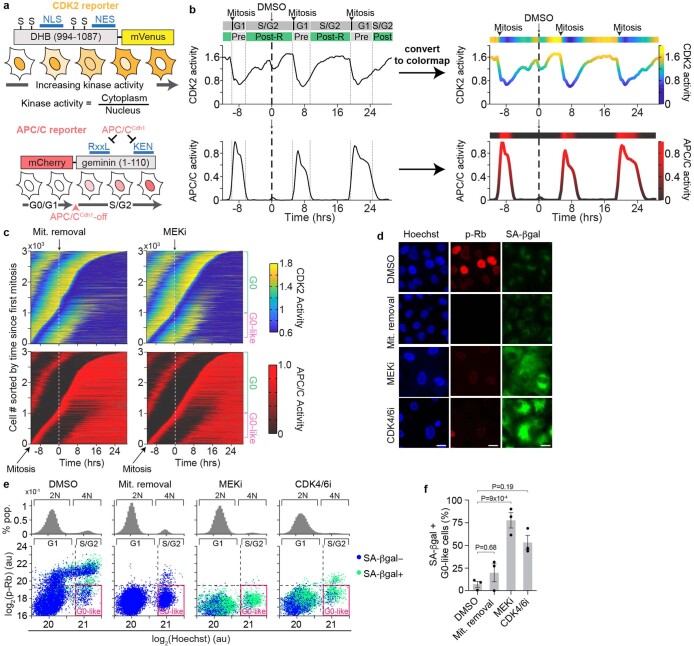
Extended Data Fig. 2. CDK2 and APC/C activity measured in live cells.
a, Schematic of the fluorescent biosensors used for CDK2 activity (left) and APC/C activity (right). A detailed description of how the sensors work can be found in4,15,16. b, Example single-cell trace shows CDK2 (top) and APC/C (bottom) activity before and after DMSO treatment. Vertical grey lines indicate phase transitions and green bars show the region we considered cells to be post-Restriction Point (Post-R). Raw activity traces (left) are converted to a colormap format (right) to allow for analysing thousands of time series from asynchronous cells in one graph (see Figs. 1g and 2a and Extended Data Figs. 2c and 3a). c, Heatmaps showing CDK2 and APC/C activity aligned to mitosis for three thousands of cells treated as indicated. Mit, Mitogens. d, Representative fluorescent microscopy images of cells treated as indicated for 7 days and stained for DAPI to visualize nuclei, phospho-Rb, and a fluorescent probe to detect senescence-associated beta-galactosidase activity (SA-βgal; left). Scale bar is 20 μm. Images are representative cells from n = 3 independent experiments. e, Histograms show DNA content for each treatment (top). Scatter plots of Rb phosphorylation vs DNA content for each treatment (bottom). Each dot represents a single-cell and is coloured based on the status of SA-βgal staining. Pink boxes mark the G0-like state (hypho-phosphorylated Rb and 4N DNA content). Each plot contains N > 22,000 cells. f, Quantification of percent of cells that have high SA-βgal staining, 4N DNA content, and hypo-phosphorylated Rb from (e). Error bars represent SEM from n = 3 experiments. P-values were calculated using a one-way ANOVA. P-values from top to bottom: 0.19, 9 × 10⁻⁴, 0.68.

