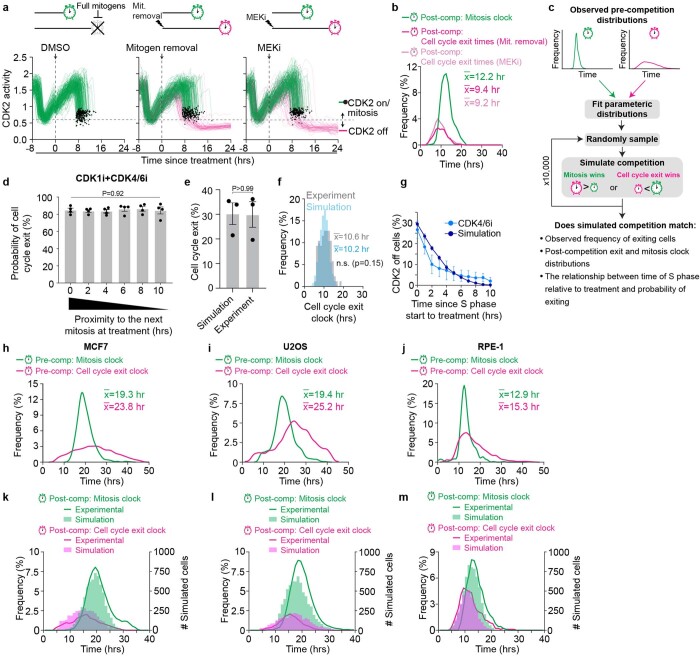
Extended Data Fig. 5. Simulated competition matches experimental data.
a, Single cell traces of CDK2 activity for DMSO, mitogen removal, and MEKi treatment aligned to time of treatment. Green traces depict cells that remained committed to the cell cycle and entered mitosis (indicated by black dot). Pink traces depict cells that lost CDK2 activity (CDK2 < 0.6) and exited the cell cycle. N = 232, 282, and 252 cells respectively. b, Histograms showing the post-competition distribution of S/G2 length (mitosis clock) and the post-competition distribution of times to lose CDK2 activity (cell cycle exit clock) as measured from (a). Median times for each distribution are shown. c, Schematic outlining the Monte Carlo algorithm used to simulate temporal competition between the mitosis and cell cycle exit clocks. d, Probability of cell cycle exit as a function of time since start of S phase at treatment. Error bars represent SEM from n = 4 experiments. One-way ANOVA show no significant effect of time since S phase at treatment on the probability of exiting the cell cycle. P = 0.92. e, Comparison of observed frequency of cell cycle exit for cells which received the CDK4/6i within 1 hr of entering S phase with results from the Monte Carlo simulation. Error bars represent SEM from n = 3 experiments. P-values were calculated using a two-tailed Mann-Whitney U test. P > 0.99. f, Comparison of observed distribution of cell cycle exit times for cells which received the CDK4/6i within 1 h of entering S phase with results from the Monte Carlo simulation. Median times for each distribution are indicated. A Wilcoxon Rank Sum test was used to test for statistical significance. Not significant (n.s.). g, Comparison of observed frequency of cell cycle exit as a function of time since the start of S phase at treatment with the results from the Monte Carlo simulation. Error bars represent SEM from n = 3 experiments. h–j, Histograms of the pre-competition times for cell cycle exit and mitosis from MCF7 (h), U2OS (i), and RPE-1 (j) cells. Data measured from single-cell data form Extended Data Fig. 4de,f. k–m, Histograms of the post-competition times for cell cycle exit and mitosis from MCF7 (k), U2OS (l), or RPE-1 (m) cells. Lines represent experimentally measured distributions and solid bars represent the simulated distributions from the Monte Carlo simulations.

