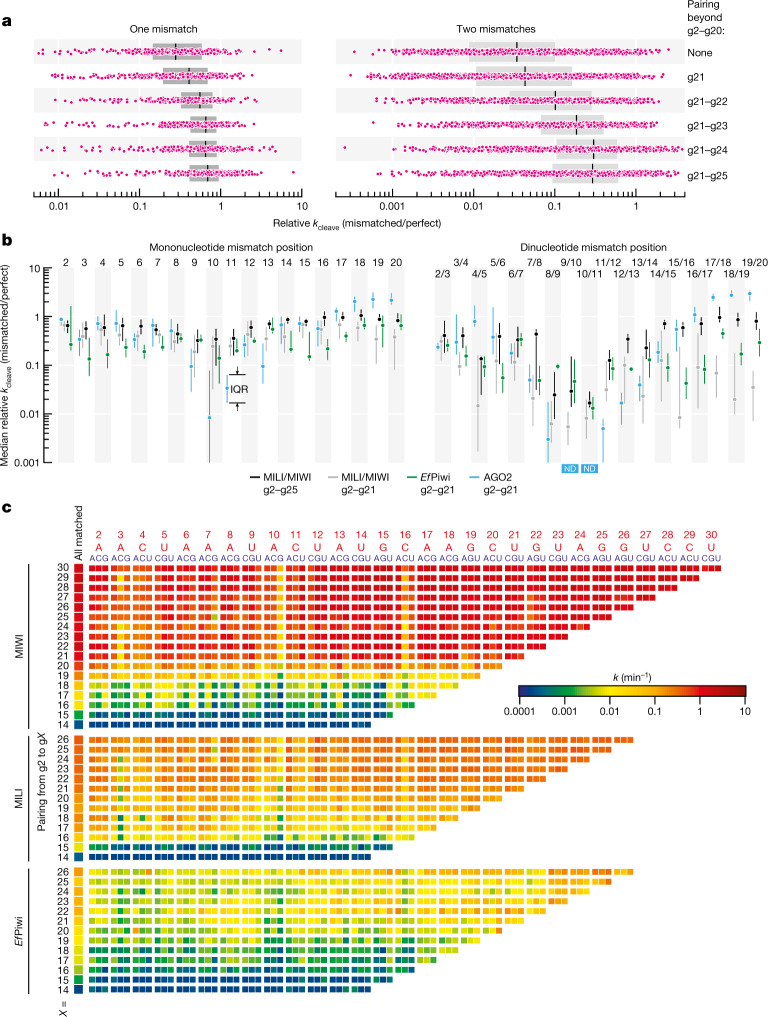
Fig. 2. PIWI slicing tolerates mismatches with any target nucleotide.
a, Change in pre-steady-state cleavage rate for one or two mismatches (pink) between g2 and g20. For one mismatch, n = 456: all 19 possible positions × 3 geometries × 4 piRNAs × MILI and MIWI. For two mismatches, n = 1,368: all 171 possible combinations × 1 geometry × 4 piRNAs × MILI and MIWI. Box plots show the IQR and median. Statistical analysesare in Extended Data Fig. 3c. b, Change in pre-steady-state cleavage rate for one or two consecutive mismatches between g2 and g20 for contiguous g2–g21 or g2–g25 pairing for MILI, MIWI, EfPiwi and mouse AGO2. Median and IQR are shown. For one mismatch, n = 24 (3 geometries × 4 piRNAs × MILI and MIWI); n = 6 for EfPiwi (3 geometries × 2 piRNAs); n = 21 for AGO2 (3 geometries for L1MC guide and 3 geometries × 3 contexts for let-7a and miR-21 guides). For two consecutive mismatches, n = 8 (1 geometry × 4 piRNAs × MILI and MIWI); n = 2 for EfPiwi (1 geometry × 2 piRNAs); n = 19 for AGO2 (1 geometry for L1MC RISC and 9 geometries for let-7a and miR-21 RISCs). All data and statistical analyses are in Extended Data Fig. 4. ND, not detected. c, MIWI, MILI and EfPiwi pre-steady-state cleavage rates (k) for targets of L1MC piRNA containing a single unpaired nucleotide. Position and identity of mononucleotide mismatch in targets (indicated in blue) of L1MC piRNA (indicated in red) are on the top of the chart.

