

Abstract
This study is conducted to identify the microbial architecture and its functional capacity in the Asian population via the whole metagenomics approach. A brief comparison of the Asian countries namely Malaysia, India, China, and Thailand, was conducted, giving a total of 916 taxa under observation. Results show a close representation of the taxonomic diversity in the gut microbiota of Malaysia, India, and China, where Bacteroidetes, Firmicutes, and Actinobacteria were more predominant compared to other phyla. Mainly due to the multi-racial population in Malaysia, which also consists of Malays, Indian, and Chinese, the population tend to share similar dietary preferences, culture, and lifestyle, which are major influences that shapes the structure of the gut microbiota. Moreover, Thailand showed a more distinct diversity in the gut microbiota which was highly dominated by Firmicutes. Meanwhile, functional profiles show 1034 gene families that are common between the four countries. The Malaysia samples are having the most unique gene families with a total of 67,517 gene families, and 51 unique KEGG Orthologs, mainly dominated by the metabolic pathways, followed by microbial metabolism in diverse environments. In conclusion, this study provides some general overview on the structure of the Asian gut microbiota, with some additional highlights on the Malaysian population.
Supplementary Information
The online version contains supplementary material available at 10.1007/s13205-023-03671-3.
Keywords: Discriminant features in bacterial populations, Diversity and functional analysis, Human gut, Microbial community, Whole metagenomics analysis
Introduction
Microorganisms live symbiotically with humans, forming various distinct communities in different parts of the human body known as the microbiota. One of the most important microbiota in the human body resides in the gut, playing significant and complex roles in the host system. For instance, regulating physiological processes such as degradation of food source (Rowland et al. 2018; Valdes et al. 2018; Vernocchi et al. 2020), production of enzymes and hormones (Neuman et al. 2015; Fukui et al. 2018; Martin et al. 2019), modulates the host’s metabolism (Holmes et al. 2012; Martin et al. 2019; Zhang et al. 2019a, b), maintaining homeostasis in the gut environment (Gagnière et al. 2016; Dicks et al. 2017; Lazar et al. 2018), and regulating the immune system (Holmes et al. 2012; Martin et al. 2019; Zhang et al. 2019a, b). Moreover, by evidence of previous studies, the role and function of the gut microbiota is not limited to the gut, but also influences other parts of the body such as the brain via the gut–brain axis, where the gastrointestinal tract communicates through a bidirectional network of signaling pathways consisting of multiple connections involving the immune system and bacterial metabolites and products (Calvani et al. 2018; Huang et al. 2019; Ma et al. 2019; Morais et al. 2020).
In general, the gastrointestinal tract harbors a diverse microbial community along the mouth, esophagus, stomach, small and large intestine, rectum, and anus. Food digestion and nutrients absorption occurs mainly in the small intestine, where it then passes to the colon for further water absorption, production of vitamins and waste solidification. There are many factors that contribute to the structure of the host’s gut microbiota, such as genetics, age, mode of birth, diet, medicine, and stress (Kelsen and Wu 2012; Gagnière et al. 2016; Bajinka et al. 2020). For instance, previous studies have shown how stress and depression influence the composition of the gut microbiota which, in turn, changes the gut permeability, and results in a leaky gut. Commonly dysbiosis occurs with over representation of intestinal pathobionts which accelerate systemic inflammation in the host by translocating across the epithelial barrier to reach the extraintestinal tissue (Kiecolt-glaser et al. 2018). This condition allows microorganisms to penetrate into the blood circulation and produce an inflammatory response (Madison and Kiecolt-Glaser 2019). Dietary pattern is also one of the main factors that influences the composition of the gut microbiota. Studies have reported the gut microbiota response toward different type of diets such as Western diet and also plant-rich diet. The studies showed that a western diet implicated a less healthy diet, resulting in a reduced intestinal epithelial defenses and promotion of pathogenic bacteria that affects carcinogenic pathways (Bolte et al. 2021; Ibragimova et al. 2021). Meanwhile, a plant-based diet causes an increment of microorganisms that produce short-chain fatty acids (SCFA), which have shown to improve metabolic markers and reduce cancer risk (Bolte et al. 2021; Ibragimova et al. 2021).
In correspond to these various factors, it is difficult to obtain a concrete justification on the composition of the gut microbiota either in healthy or unhealthy individuals. Many studies have been conducted to study on the unique composition of the gut microbiota and their association with the host’s demographic properties such as ethnicity, lifestyle, sex and age, and geographic location (Zeller et al. 2014; Rampelli et al. 2020; Zhang et al. 2019a, b; Kaur et al. 2020; Luan et al. 2020) However, these studies require a large number of samples to get an overview of the gut microbiota for the population. Furthermore, due to their complex role and importance to human health, the gut microbiota has reached the forefront in research studies. Many studies have reported the relationship between the gut microbiota with various gastrointestinal diseases such as ulcerative colitis, irritable bowel syndrome, inflammatory bowel disease, and colorectal cancer (Manichanh et al. 2012; Wang et al. 2018; Hills et al. 2019; Ortigao et al. 2020; Fan et al. 2021). However, not limited to the gastrointestinal tract, some studies also show the relationship between the gut microbiota and other diseases such as kidney failure diabetes, autism spectrum disorder (ASD), and also Parkinson’s (Bliss and Whiteside 2018; Sherwin et al. 2018; Stavropoulou et al. 2021).
With recent findings in hand, knowledge on the association of microorganisms in the gut community with their host, including the influence of various factors shows the uniqueness of different population. Nevertheless, there is still a scarcity in fundamental knowledge for understanding the unique gut microbiota in humans. As most studies would directly link the gut microbiota with disease-related individuals (Zeller et al. 2014; Thomas et al. 2019; Wirbel et al. 2019), it is still crucial to understand the gut microbiota within a healthy human body. For this purpose, whole metagenomic analysis on the gut microbiota of normal individuals was conducted to analyze the distinct gut community between different geographic population.
Moreover, in favor of the advanced technology in next generation sequencing, whole metagenomics sequencing or also known as shotgun metagenomics sequencing would provide a finer view of the gut community in terms of coverage and depth on identifying microbial genomes in the sample (Laudadio et al. 2018; Tyagi et al. 2019). In comparison to the more favorable metagenomics approach which focuses on the 16S region of the microbial genome (16S metagenomic sequencing), the whole metagenomics sequencing is less prone to primer bias during polymerase chain reaction (PCR) as direct sequencing on the samples are feasible (Poretsky et al. 2014). Furthermore, another advantage of the shotgun approach is the ability to predict potential genes for getting a basic understanding on the functional contribution of the gut microbiota to the host (Di Guglielmo et al. 2019; Kwon et al. 2019; Medina et al. 2019).
In short, gut microbiota plays vital roles in our body mechanisms and immune system to maintain a healthy condition. Although, numerous studies have been conducted to understand their symbiotic relationship in the human body, it is still unclear due to the complexity of the microbial community followed by their extensive roles and physiological properties. Thus, it is essential to study on the architecture of the microbial community as a fundamental knowledge for further understanding their significant contribution in the human body. Hence, to explore the structure of the human gut community, this paper reports on the taxonomic and functional profiles of gut microbiota representing several distinct populations in Asia via the whole metagenomics approach.
Methodology
Data collection
In this study, we randomly selected 33 samples of healthy individuals from Asia countries namely Malaysia, Thailand (Raethong et al. 2021), India (Gupta et al. 2019), and China (Yu et al. 2017). Whole metagenomic sequences of the gut microbiome were retrieved from NCBI by the following accession IDs: PRJNA637175, PRJNA531273, and PRJEB10878. Meanwhile, samples from Malaysia were collected from University Malaya Medical Centre (UMMC), Petaling Jaya, Selangor and sequenced in this study. Ethics approval have been approved by Medical Research Ethics Committee, University of Malaya Medical Center, Malaysia, with reference MRECID.NO: 201914-6975. The Malaysian metagenome sequences have been deposited in NCBI Sequence Read Archive, with BioProject accession ID: PRJNA872758.
Metagenomics analyses
Data pre-processing
Sequence quality of the raw sequences were analyzed and cleaned using FastQC v.0.11.9 (Andrews 2010), and Trimmomatic v.0.36 (Bolger et al. 2014) to obtain high-quality data. The sequences were then screened for host contamination by aligning to the human reference genome, Hg38 via Bowtie2 (Caspi et al. 2014) and SAMtools (Caspi et al. 2014). Quality checking was repeated to ensure high-quality sequences are obtained.
Taxonomic and functional profiling
High-quality sequences were then classified using Metagenomic Phylogenetic Analysis 3, MetaPhlAn3 v.3.0.7 (Beghini et al. 2021), a taxonomic profiling tool that implements a marker-gene mapping algorithm. MetaPhlAn3 was run using default parameters and mapped to the CHOCOPhlAn pangenome database. Functional profiling of the high-quality sequences was conducted using the HMP Unified Metabolic Analysis Network 3, HUMAnN3 v.3.0.0.alpha.4 (Beghini et al. 2021) pipeline with default parameters, the gene families were identified based on the UniRef90 database, a sub-cluster of the UniProt Reference Clusters, UniRef (Suzek et al. 2007). Moreover, functional groups were analyzed with reference to KEGG Orthology, KO (Kanehisa et al. 2008), and mapping of the metabolic pathway profiles via MetaCyc (Caspi et al. 2014), a metabolic pathway database.
Statistical validation
Statistical validation was conducted using Bioconductor packages in R software (v.4.0.5). Alpha diversity was analyzed based on Observed and Chao for species richness, and Shannon, and Simpson indices representing species diversity. Linear discriminant analysis (LDA) and effect size (LEfSe) (Segata et al. 2011) were conducted with Kruskal–Wallis test at alpha-value = 0.05, and LDA threshold of 2.0.
Results and discussion
Gut microbiota is a complex and dynamic structure in the human body that plays crucial roles in maintaining an optimum health condition. Characterizing the architecture of the gut microbiota in healthy individuals is an important initial step in understanding the association of the microbiota with health and disease. Generally, the gut microbiota of a healthy adult may harbor thousands of bacterial species which are dominantly from Bacteroidetes and Firmicutes phyla (Candela et al. 2012; Rinninella et al. 2019). Studies have shown the gut inhabiting a unique and diverse microbiota of which the taxonomic composition varies among individuals.
In this study, we aim to look at the different structure of the gut microbiota among healthy individuals coming from different countries in Asia, namely Malaysia, Thailand, India, and China. Table 1 shows a summary of the taxonomic composition of the different countries which is also represented in Fig. 1. The 4 Asian countries share 81 common species, while Thailand have the highest number of unique species, followed by China, India, while Malaysia showed the least with a total of 10 unique species, namely Bacteroides sp. CAG_144, Bacteroides sp. OM08_11, Blautia coccoides, Clostridium clostridioforme, Clostridium sp. D5, Firmicutes bacterium CAG_424, Lactonifactor longoviformis, Parabacteroides sp. CAG_409, Prevotella disiens, and Streptococcus pasteurianus. Based on the results, the gut microbiota of the Asian population is dominated by four major phyla namely Firmicutes, Bacteroidetes, Actinobacteria, and Proteobacteria as shown in Fig. 2. However, Thailand has shown a smaller abundance of the Bacteroidetes, while being dominated by Firmicutes, which was also reported similarly by La-ongkham et al. (2020) and Raethong et al. (2021), whereas India has a larger composition of Bacteroidetes than the other three major phyla mentioned earlier.
Table 1.
Taxonomic comparison of the gut microbiota between Asian countries
| Country | Taxa size | Unique species | Common species |
|---|---|---|---|
| Malaysia | 161 | 10 | 81 |
| Chinaa | 266 | 30 | |
| Indiab | 144 | 26 | |
| Thailandc | 345 | 103 |
Fig. 1.
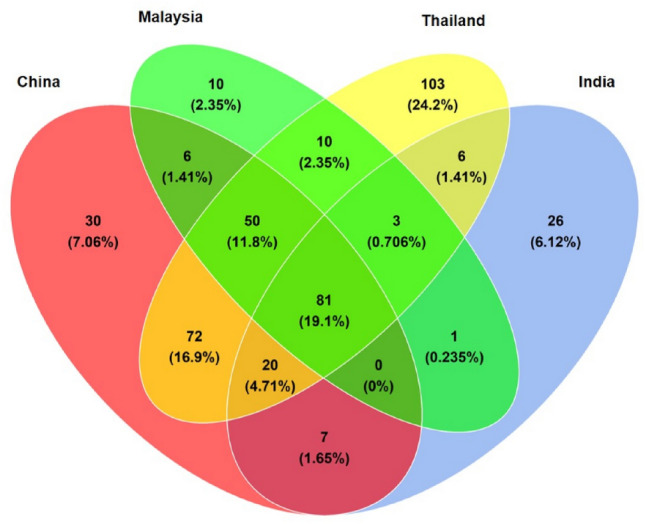
Taxonomic comparison between Asian countries showing unique and common species in the gut microbiota shared between Malaysia, China, Thailand and India population
Fig. 2.

Taxonomic comparison between Asian gut microbiota at phylum level based on the relative abundances
Furthermore, Tables 2, 3, 4, 5 show list of top 20 most abundant species in the gut microbiota of each population. In general, the diversity of the gut microbiota in each population was predominated by normal flora and commensals. Malaysia had greater abundance for commensal bacteria such as Bacteroidetes vulgatus and Eubacterium eligens, compared to Thailand, India and China. Well-known probiotics from actinobacteria phyla such as Bifidobacterium pseudocatenulatum and Bifidobacterium bifidum were also ranked in the top ten in the Malaysian gut microbiota. Meanwhile, Faecalibacterium prausnitzii and Eubacterium species such as Eubacterium rectale, Eubacterium sp. CAG_180, were found relatively high in Thailand population. This finding is also reported by La-ongkham et al. (2020), where F. prausnitzii showed the highest abundance among healthy groups of Thai population, suggesting this species as a potential biomarker for a healthy gut in Thai individuals. F. prausnitzii are capable of producing high amounts of butyrate and produces anti-inflammatory effects, which are vital for human health (Li et al. 2008; Sokol et al. 2008; Miquel et al. 2014; La-ongkham et al. 2020). The results also show that Proteobacteria such as Escherichia coli and Klebsiella pneumoniae were also abundant in the gut microbiota for Thailand, India, and China population. Interestingly, in the Indian population, Megasphaera elsdenii was found to be highly abundant with a relative abundance of 4.55%, and shared by 70% of the population. The genus Megasphaera was also found in the other countries of interest, but their relative abundance was lower at less than 1.5%. This lactate-utilizing bacterium is one of the important commensals in the gut microbiota as they ferment lactate to produce propionate via the acrylate pathway (Reichardt et al. 2014; Louis et al. 2022). Moreover, a previous study by Bhute et al. (2016) also reported on the distinct abundance of M. elsdenii species in healthy Indian individuals. Hence, also indicating that this species can also be a potential biomarker for healthy Indians. In addition, India also showed higher abundance of a diverse Prevotella sp. namely Prevotella copri, Prevotella stercorea, Prevotella sp. CAG_279, and Prevotella sp. CAG_5226, which may suggest the influence of vegetarian practice in their culture. Meanwhile, China showed the highest abundance of E. coli compared to the other countries with a relative abundance of 8.598%. A pectin-utilizing bacterium Lachnospira pectinoschiza, was also relatively high in the gut microbiota of China population. Pectin, a complex carbohydrate is found in the plant cell wall, and fruits such as carrots, apples, and citrus (Flint et al. 2012; Van der Merwe 2021).
Table 2.
Top 20 most abundant species in Malaysian gut microbiota
| Phylum | Species | Relative abundance (%) |
|---|---|---|
| Firmicutes | Eubacterium rectale | 11.298 |
| Bacteroidetes | Bacteroides vulgatus | 11.068 |
| Bacteroidetes | Prevotella copri | 9.070 |
| Bacteroidetes | Bacteroides stercoris | 6.631 |
| Actinobacteria | Bifidobacterium adolescentis | 5.073 |
| Firmicutes | Faecalibacterium prausnitzii | 3.248 |
| Bacteroidetes | Bacteroides uniformis | 2.667 |
| Actinobacteria | Bifidobacterium pseudocatenulatum | 2.584 |
| Firmicutes | Eubacterium eligens | 2.399 |
| Actinobacteria | Bifidobacterium bifidum | 1.964 |
| Firmicutes | Roseburia faecis | 1.874 |
| Firmicutes | Fusicatenibacter saccharivorans | 1.760 |
| Firmicutes | Dialister sp. CAG_357 | 1.698 |
| Bacteroidetes | Parabacteroides distasonis | 1.582 |
| Firmicutes | Dorea longicatena | 1.574 |
| Actinobacteria | Bifidobacterium longum | 1.529 |
| Bacteroidetes | Bacteroides eggerthii | 1.438 |
| Bacteroidetes | Bacteroides ovatus | 1.341 |
| Firmicutes | Holdemanella biformis | 1.341 |
| Firmicutes | Coprococcus comes | 1.330 |
Table 3.
Top 20 most abundant species in Thailand gut microbiota
| Phylum | Species | Relative abundance (%) |
|---|---|---|
| Firmicutes | Faecalibacterium prausnitzii | 11.997 |
| Firmicutes | Eubacterium rectale | 10.568 |
| Firmicutes | Eubacterium sp. CAG_180 | 6.411 |
| Actinobacteria | Bifidobacterium adolescentis | 5.445 |
| Proteobacteria | Escherichia coli | 5.378 |
| Firmicutes | Roseburia inulinivorans | 4.653 |
| Firmicutes | Streptococcus salivarius | 3.658 |
| Firmicutes | Fusicatenibacter saccharivorans | 3.266 |
| Firmicutes | Ruminococcus torques | 2.636 |
| Firmicutes | Roseburia faecis | 2.219 |
| Firmicutes | Roseburia intestinalis | 1.897 |
| Firmicutes | Ruminococcus bromii | 1.733 |
| Actinobacteria | Collinsella aerofaciens | 1.619 |
| Firmicutes | Holdemanella biformis | 1.593 |
| Bacteroidetes | Prevotella sp. CAG_1031 | 1.346 |
| Proteobacteria | Klebsiella pneumoniae | 1.277 |
| Firmicutes | Coprococcus comes | 1.215 |
| Firmicutes | Streptococcus parasanguinis | 1.178 |
| Bacteroidetes | Bacteroides uniformis | 1.169 |
| Firmicutes | Anaerostipes hadrus | 1.087 |
Raw sequences were obtained from Raethong et al. (2021)
Table 4.
Top 20 most abundant species in India gut microbiota
| Phylum | Species | Relative abundance (%) |
|---|---|---|
| Bacteroidetes | Prevotella copri | 36.051 |
| Bacteroidetes | Prevotella stercorea | 4.680 |
| Firmicutes | Megasphaera elsdenii | 4.554 |
| Bacteroidetes | Bacteroides vulgatus | 4.175 |
| Firmicutes | Dialister succinatiphilus | 4.153 |
| Actinobacteria | Bifidobacterium adolescentis | 3.015 |
| Bacteroidetes | Prevotella sp. CAG_279 | 2.747 |
| Proteobacteria | Escherichia coli | 2.715 |
| Firmicutes | Eubacterium rectale | 2.619 |
| Proteobacteria | Klebsiella pneumoniae | 2.461 |
| Firmicutes | Butyrivibrio crossotus | 2.455 |
| Firmicutes | Faecalibacterium prausnitzii | 2.228 |
| Firmicutes | Clostridium sp. CAG_510 | 2.159 |
| Actinobacteria | Collinsella aerofaciens | 1.607 |
| Bacteroidetes | Prevotella sp. CAG_5226 | 1.557 |
| Firmicutes | Lactobacillus ruminis | 1.352 |
| Firmicutes | Ruminococcus bromii | 1.247 |
| Actinobacteria | Bifidobacterium longum | 1.134 |
| Proteobacteria | Klebsiella variicola | 1.114 |
| Firmicutes | Eubacterium sp. CAG_180 | 0.933 |
Raw sequences were obtained from Gupta et al. (2019)
Table 5.
Top 20 most abundant species in China gut microbiota
| Phylum | Species | Relative abundance (%) |
|---|---|---|
| Bacteroidetes | Bacteroides vulgatus | 9.414 |
| Proteobacteria | Escherichia coli | 8.598 |
| Bacteroidetes | Prevotella copri | 6.590 |
| Bacteroidetes | Bacteroides stercoris | 6.245 |
| Firmicutes | Faecalibacterium prausnitzii | 5.404 |
| Bacteroidetes | Bacteroides uniformis | 4.640 |
| Proteobacteria | Klebsiella pneumoniae | 3.933 |
| Firmicutes | Lachnospira pectinoschiza | 2.959 |
| Firmicutes | Roseburia inulinivorans | 2.363 |
| Bacteroidetes | Parabacteroides merdae | 2.090 |
| Bacteroidetes | Bacteroides ovatus | 2.045 |
| Firmicutes | Ruminococcus bromii | 1.961 |
| Firmicutes | Eubacterium rectale | 1.924 |
| Actinobacteria | Bifidobacterium adolescentis | 1.742 |
| Firmicutes | Eubacterium eligens | 1.655 |
| Bacteroidetes | Bacteroides thetaiotaomicron | 1.554 |
| Firmicutes | Roseburia faecis | 1.528 |
| Actinobacteria | Collinsella aerofaciens | 1.464 |
| Bacteroidetes | Bacteroides eggerthii | 1.459 |
| Firmicutes | Anaerostipes hadrus | 1.451 |
Raw sequence were obtained from Yu et al. (2017)
Alpha and beta diversity was conducted to validate the taxonomic diversity in the gut microbiota across different population. Figure 3 demonstrates alpha diversity analyses which evaluates the structure of microbial community within each population by measuring the species richness (number of OTUs present in the population) and species diversity (abundances of the OTUs present in the population). The results show a greater species richness and diversity in Thailand population compared to the other countries, indicating a more diverse microbial community in the gut microbiota of the Thailand population. Moreover, Malaysian population had a relatively smaller species richness and diversity which was mainly due to the small sample size in comparison to the other populations (Thailand, India, and China). Meanwhile, to compare diversity across the different populations, beta diversity was conducted and the different taxonomic composition between the Asian countries is shown in Figs. 4 and 5. For this purpose, Jaccard index was conducted to show differences in the microbial community based on the presence/absence of OTUs, whereas Bray Curtis dissimilarity index analyzes the differences by incorporating the relative abundances of the microbial community in each population.
Fig. 3.

Alpha diversity of the gut microbiota of the Asian countries, consisting of different metrices namely Observed and Chao1 for estimating species richness, whereas Shannon and Simpson for evaluating species diversity
Fig. 4.

Principal coordinate analysis (PCoA) of the gut microbiota of the Asian countries based on Jaccard Index metrics, clustered at 95% confidence interval. The PCoA shows the distance of microbial diversity based on the presence/absence of the microbial OTUs in the gut community between Malaysia, India, China, and Thailand. a Jaccard index on the whole taxa. b Jaccard index on taxa size N = 100. c Jaccard index on taxa size N = 90
Fig. 5.

Principal coordinate analysis (PCoA) of the gut microbiota of the Asian countries based on Bray Curtis Dissimilarity metrics, clustered at 95% confidence interval. The PCoA shows the distance of microbial diversity in the gut community between Malaysia, India, China, and Thailand. a Bray Curtis dissimilarity based on the whole taxa. b Bray Curtis dissimilarity based on taxa size N = 100. c Bray Curtis dissimilarity based on taxa size N = 90
Beta diversity was conducted on the whole taxa, and narrowed to a smaller taxa size consisting of N = 100 and N = 90 to observe their differences in clustering and diversity. Results in Figs. 4a, b, 5a, b show that the taxa diversity between the gut microbiota of the Asian countries do have some common diversity when compared at the whole taxa level, but starts to differ significantly when the size of taxa was narrowed down to N = 90 as shown in Figs. 4c, 5c. This shows that the diversity in the gut microbiota across Malaysia, Thailand, India and China may share some common taxonomic structure within the intermediate species as shown at the whole taxa level and N = 100. Interestingly, the gut microbiota of Malaysian population was clustered with both India and China clusters, and the diversity differs with Thailand as it does not fall into Thailand cluster. Thailand had a more distinct diversity compared to Malaysia, India, and China, as it was separated into a distinct cluster at N = 90. As Malaysia consist of a wide variety of races, which includes Indian and Chinese, the results may indicate that the clustering was due to a common lifestyle or dietary habit between the different races which shapes a common trait in the structure of the gut microbiota between Malaysia, China, and India. In this case, although Thailand is a neighboring country to Malaysia, the culture and dietary preference differs from the Malaysian culture. A Thai meal consist of rice, eaten with a variety of side dishes that commonly consist of vegetables, seafood, eggs, and meat, and balanced with different flavors such as sweet, sour, salty, and spicy (La-ongkham et al. 2015; Phoonlapdacha et al. 2022). Meanwhile, results of the dietary pattern represented in this study, in Supplementary Table 1, suggest that Malaysians prefer to eat more vegetables and white meat, with an average of 2.00, and 1.67 times per day. Compared to other type of diet namely fruits, dairy, fish, and red meat with the consumption at an average 1.00 times per day. However, due to the very limited sample size, the dietary information based on our samples may only suggest on the food preference, and may not reflect the actual dietary pattern of the population. More samples should be included in future studies to get a more significant picture on the dietary preference for the Malaysian population.
Although the dietary preference in Asian countries is most likely similar, the food in each country or region is unique based on the culture and availability of the raw ingredients that are indigenous to the area. Asians are well known to practice high fiber and carbohydrate foods, such as rice and wheat as staple food, and higher consumption of fruits and vegetables, compared to animal proteins (La-ongkham et al. 2015; Nitisinprasert et al. 2016; Shondelmyer et al. 2018; Dhakan et al. 2019; Lu et al. 2021; Phoonlapdacha et al. 2022). High abundances of Prevotella sp. in this study may also reflect the high consumption of plant-rich diet as many studies have also reported on the correlation between the abundance of Prevotella sp. with diet rich in vegetables (Bhute et al. 2016; Nitisinprasert et al. 2016; Kisuse et al. 2018; Pareek et al. 2019; Phoonlapdacha et al. 2022). Meanwhile, the food preference in India are mostly wheat, grains, and rice as their staple food, which are consumed with legumes, assorted spices, vegetables, and yogurt (Shondelmyer et al. 2018). Similarly, rice and wheat are the staple food in China, and they also prefer a high fiber diet mainly vegetables, accompanied with animal and vegetable protein such as pork, chicken, and soy beans (Lu et al. 2021). Studies also showed a close relation between Bacteroides and Prevotella sp., and high consumption of fiber, protein, and animal fat (Singh et al. 2017; Costea et al. 2018). Bacteroides enterotypes was also reported to increase in the gut microbiota of individuals who practice a western diet which comprises high intake of fat and proteins (Singh et al. 2017; Phoonlapdacha et al. 2022). Moreover, high abundance of Bifidobacterium can be observed in individuals who practice rice and wheat diet, whereas, the species decreases in low wheat content diet such as gluten-free diet, low-gluten diet, and diet low in fermentable oligosaccharides, disaccharides, monosaccharides, and polyols (FODMAP) (Singh et al. 2017; Lu et al. 2021). Moreover, Asians also practice high consumption of fermented foods such as tempeh, cheese, fermented soy beans, yogurt, budu, belacan, ragi, and tapai (Dimidi et al. 2019; Tamang et al. 2020; Leeuwendaal et al. 2022).
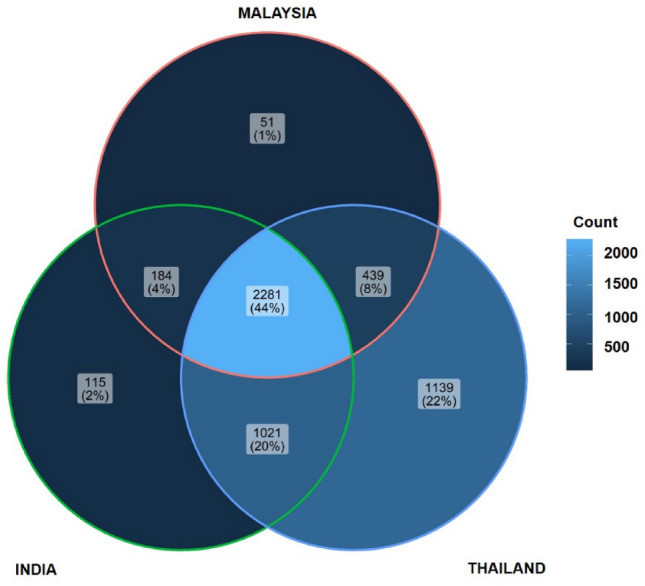
In addition, functional profile was constructed by evaluating potential gene families and pathways associated to the gut microbiota. Gene families were identified and compared among the four countries of interest. As shown in Fig. 6, Malaysia has the highest number of unique gene families among the four Asian countries, with a total of 67,517 gene families, followed by India, China, and Thailand, while they share a total of 1034 common gene families. The gene families were also mapped to KEGG Orthology (KO) database for further functional ortholog classification, and compared between Malaysia, India, and Thailand. China had no gene families mapped to KO; hence, it was not included in the analysis. The functional orthologs provide information on the molecular-level functions of genes and proteins. Visualization of the comparison between KOs associated to the gut microbiota of each country is illustrated in Fig. 7. Malaysia had mapped to a total of 51 KOs that are unique to the other countries as listed in Table 6, while sharing a total of 2281 KOs with India and Thailand. The unique KOs are mostly involved in metabolism, signaling and cellular processes, and genetic and environmental information processing. From the results, a total number of 34 major pathways have been associated with Malaysia’s unique KOs, having metabolic pathways as the top pathway with 14 hits of sub-pathways, followed by microbial metabolism in diverse environments as listed in Supplementary Table 2 and summarized in Fig. 8.
Fig. 6.

Comparison of gene families associated with the gut microbiota in Asian population obtained based on UniRef 90 clusters from UniRef database
Fig. 7.
Comparison of KEGG Orthologs (KO) associated with the gut microbiota in Asian population (Malaysia, India and Thailand)
Table 6.
List of unique KEGG Orthologs (KO) associated with Malaysian gut microbiota
| KO ID | Symbol | Name | EC no. |
|---|---|---|---|
| K00663 | aacA | Aminoglycoside 6ʹ-N-acetyltransferase | EC:2.3.1.82 |
| K00666 | K00666 | Fatty-acyl-CoA synthase | EC:6.2.1.- |
| K01174 | nuc | Micrococcal nuclease | EC:3.1.31.1 |
| K01482 | DDAH, ddaH | Dimethylargininase | EC:3.5.3.18 |
| K01501 | E3.5.5.1 | Nitrilase | EC:3.5.5.1 |
| K01848 | E5.4.99.2A, mcmA1 | Methylmalonyl-CoA mutase, N-terminal domain | EC:5.4.99.2 |
| K01849 | E5.4.99.2B, mcmA2 | Methylmalonyl-CoA mutase, C-terminal domain | EC:5.4.99.2 |
| K02945 | RP-S1, rpsa | Small subunit ribosomal protein S1 | – |
| K02958 | RP-S15e, RPS15 | Small subunit ribosomal protein S15e | – |
| K03048 | rpoE | DNA-directed RNA polymerase subunit delta | – |
| K03328 | TC.PST | Polysaccharide transporter, PST family | – |
| K03336 | iolD | 3D-(3,5/4)-Trihydroxycyclohexane-1,2-dione acylhydrolase (decyclizing) | EC:3.7.1.22 |
| K03337 | iolB | 5-Deoxy-glucuronate isomerase | EC:5.3.1.30 |
| K03366 | butA, budC | Meso-butanediol dehydrogenase /(S,S)-butanediol dehydrogenase / diacetyl reductase | EC:1.1.1.- 1.1.1.76 1.1.1.304 |
| K04767 | acuB | Acetoin utilization protein AcuB | – |
| K04940 | odh | Opine dehydrogenase | EC:1.5.1.28 |
| K05020 | opuD, betL | Glycine betaine transporter | – |
| K05303 | K05303 | O-Methyltransferase | EC:2.1.1.- |
| K05305 | FUK | Fucokinase | EC:2.7.1.52 |
| K06973 | K06973 | Uncharacterized protein | – |
| K06975 | K06975 | Uncharacterized protein | – |
| K06978 | K06978 | Uncharacterized protein | – |
| K06980 | ygfZ | tRNA-modifying protein YgfZ | – |
| K06987 | K06987 | Uncharacterized protein | – |
| K06989 | nadX, ASPDH | Apartate dehydrogenase | EC:1.4.1.21 |
| K06993 | K06993 | Ribonuclease H-related protein | – |
| K06997 | yggS, PROSC | PLP dependent protein | – |
| K07218 | nosD | Nitrous oxidase accessory protein | – |
| K07651 | resE | Two-component system, OmpR family, sensor histidine kinase ResE | EC:2.7.13.3 |
| K07696 | nreC | Two-component system, NarL family, response regulator NreC | – |
| K09859 | K09859 | Uncharacterized protein | – |
| K10240 | cebE | Cellobiose transport system substrate-binding protein | – |
| K11145 | mrnC | Mini-ribonuclease III | EC:3.1.26.- |
| K11175 | purN | Phosphoribosylglycinamide formyltransferase 1 | EC:2.1.2.2 |
| K11177 | yagR | Xanthine dehydrogenase YagR molybdenum-binding subunit | EC:1.17.1.4 |
| K11178 | yagS | Xanthine dehydrogenase YagS FAD-binding subunit | EC:1.17.1.4 |
| K11179 | tusE, dsrC | tRNA 2-thiouridine synthesizing protein E | EC:2.8.1.- |
| K11180 | dsrA | Dissimilatory sulfite reductase alpha subunit | EC:1.8.99.5 |
| K11181 | dsrB | Dissimilatory sulfite reductase beta subunit | EC:1.8.99.5 |
| K11183 | fruB, fpr | Multiphosphoryl transfer protein | EC:2.7.1.202 |
| K11184 | chr, crh | Catabolite repression HPr-like protein | – |
| K11689 | dctQ | C4-dicarboxylate transporter, DctQ subunit | – |
| K12218 | icmP, trbA | Intracellular multiplication protein IcmP | – |
| K14665 | amhX | Amidohydrolase | EC:3.5.1.- |
| K15855 | csxA | Exo-1,4-beta-d-glucosaminidase | EC:3.2.1.165 |
| K16928 | mtaT | Energy-coupling factor transport system substrate-specific component | – |
| K17108 | GBA2 | Non-lysosomal glucosylceramidase | EC:3.2.1.45 |
| K18197 | yesW | Rhamnogalacturonan endolyase | EC:4.2.2.23 |
| K18846 | npmA | 16S rRNA (adenine(1408)-N(1))-methyltransferase | EC:2.1.1.180 |
| K19134 | csx10 | CRISPR-associated protein Csx10 | – |
| K21405 | acoR | Sigma-54 dependent transcriptional regulator, acetoin dehydrogenase operon transcriptional activator AcoR | – |
Fig. 8.

The figure shows a list of pathways from MetaCyc database mapped to Malaysia’s unique KO, with number of hits are being represented at the end of each bar. The number of hits represent the number of sub-pathways being complemented to the respective major pathways
Meanwhile, since there is scarce information on the gut microbiota of the Malaysian population for healthy individuals, further comparative insights on Malaysia and other countries have been done. Significant differentially abundant species have been identified based on linear discriminant analysis (LDA) effect size (LEfSe). This approach was conducted to calculate taxa that is best discriminated between Malaysia and each of the other countries. Figures 9 and 10 show the LEfSe results, indicating significant discriminative taxa between the gut microbiota of Malaysian individuals and those from Thailand, India, and China, respectively. These results are also supported with a list of significant differentially abundant species derived from the LEfSe analysis in Supplementary Table 3–5. Interestingly, Malaysia showed a higher number of significant species when compared to each of the Asian countries involved, regardless of the smaller sample size. Thus, suggesting, Malaysians have a more unique gut microbiota compared to Thailand, India, and China. Furthermore, the functional contribution of the significant differentially abundant species was also further analyzed by mapping to MetaCyc database to predict the respective pathway complement of the gut microbiota from the annotated metagenomes. Figure 11 represents the summary of the pathways associated with the microorganisms in the gut microbiota, and further details on the list of pathways are included in the Supplementary Table 6–8. Moreover, top ten pathways associated with the significant differentially abundant species obtained from the comparison between Malaysia and the other countries are also listed in Tables 7, 8, 9. In comparison to Malaysia, the top pathways represented by the significant differentially abundant species in China and Thailand were mainly associated with Proteobacteria such as K. pneumoniae and E. coli, respectively. Meanwhile, the top pathways observed in Malaysian population were mainly associated with Actinobacteria and Firmicutes such as Bifidobacterium, Megamonas, and Acidaminococcus. Most of the pathways listed are related to carbohydrate fermentation, and synthesizing amino acids and essential metabolites such as aromatic amino acids, vitamins, and energy, which are vital for the microorganisms to survive in the gut. However, further meta-transcriptomic and metabolomics analysis are required to further assess the functional contribution of the microbiota and their relationship to the human host.
Fig. 9.


The figures represent the linear discriminant features between the gut microbiota of Malaysia and other countries, with LDA score > 2.0, and p value < 0.05. The linear discriminant features represent taxa at phylum to species level. a Linear discriminant features between the gut microbiota of Malaysia and Thailand population. b Linear discriminant features between the gut microbiota of Malaysia and India population. c Linear discriminant features between the gut microbiota of Malaysia and China population
Fig. 10.

The figures represent the linear discriminant features between the gut microbiota of Malaysia and other countries from phylum to genus level, with LDA score > 2.0, and p value < 0.05 in a cladogram. a Linear discriminant feature between the gut microbiota of Malaysia and Thailand population. b Linear discriminant features between the gut microbiota of Malaysia and India population. c Linear discriminant features between the gut microbiota of Malaysia and China population
Fig. 11.

The figures represents the number of significant differentially abundant species and their complementary pathways based on LEfSe results. a Comparison of the significant differentially abundant species and their complementary pathways between the gut microbiota of Malaysia and Thailand population. b Comparison between Malaysia and India population. c Comparison between Malaysia and China population
Table 7.
Top 10 pathways associated with significant differentially abundant species between Malaysia and Thailand gut microbiota
| Country | Top 10 pathways | Phylum | Genus | Species |
|---|---|---|---|---|
| Malaysia |
ARO-PWY: chorismate biosynthesis I COA-PWY-1: coenzyme A biosynthesis II (mammalian) COA-PWY: coenzyme A biosynthesis I COMPLETE-ARO-PWY: superpathway of aromatic amino acid biosynthesis HISDEG-PWY: L-histidine degradation I PANTO-PWY: phosphopantothenate biosynthesis I PANTOSYN-PWY: pantothenate and coenzyme A biosynthesis I PEPTIDOGLYCANSYN-PWY: peptidoglycan biosynthesis I (meso-diaminopimelate containing) PWY-2942: L-lysine biosynthesis III PWY-1042: glycolysis IV (plant cytosol) PWY-4242: pantothenate and coenzyme A biosynthesis III |
Firmicutes | Acidaminococcus | Acidaminococcus intestini |
| Thailanda |
PWY0-1586: peptidoglycan maturation (meso-diaminopimelate containing) NONOXIPENT-PWY: pentose phosphate pathway (non-oxidative branch) PWY-7111: pyruvate fermentation to isobutanol (engineered) PWY-7663: gondoate biosynthesis (anaerobic) PWY-5667: CDP-diacylglycerol biosynthesis I PWY0-1319: CDP-diacylglycerol biosynthesis II VALSYN-PWY: L-valine biosynthesis ILEUSYN-PWY: L-isoleucine biosynthesis I (from threonine) PWY-6305: putrescine biosynthesis IV PWY-7220: adenosine deoxyribonucleotides de novo biosynthesis II |
Proteobacteria | Escherichia | Escherichia coli |
aRaw sequences were obtained fromRaethong et al. (2021)
Table 8.
Top 10 pathways associated with significant differentially abundant species between Malaysia and India gut microbiota
| Country | Top 10 pathways | Phylum | Genus | Species |
|---|---|---|---|---|
| Malaysia |
PWY-7237: myo-, chiro- and scillo-inositol degradation PWY-6737: starch degradation V TRPSYN-PWY: L-tryptophan biosynthesis |
Firmicutes | Megamonas | Megamonas hypermegale |
|
PWY0-1586: peptidoglycan maturation (meso-diaminopimelate containing) PWY-2942: L-lysine biosynthesis III COA-PWY-1: coenzyme A biosynthesis II (mammalian) ILEUSYN-PWY: l-isoleucine biosynthesis I (from threonine) VALSYN-PWY: l-valine biosynthesis DAPLYSINESYN-PWY: l-lysine biosynthesis I COA-PWY: coenzyme A biosynthesis I |
Actinobacteria | Bifidobacterium | Bifidobacterium pseudocatenulatum | |
| Indiaa | No pathway mapped to species | |||
aRaw sequence were obtained fromGupta et al. (2019)
Table 9.
Top 10 pathways associated with significant differentially abundant species between Malaysia and China gut microbiota
| Country | Top 10 pathways | Phylum | Genus | Species |
|---|---|---|---|---|
| Malaysia |
DTDPRHAMSYN-PWY: dTDP-l-rhamnose biosynthesis I PWY-5384: sucrose degradation IV (sucrose phosphorylase) PWY-7220: adenosine deoxyribonucleotides de novo biosynthesis II PWY-7222: guanosine deoxyribonucleotides de novo biosynthesis II |
Actinobacteria | Bifidobacterium | Bifidobacterium bifidum |
|
PWY-6609: adenine and adenosine salvage III PWY-7197: pyrimidine deoxyribonucleotide phosphorylation PWY-7111: pyruvate fermentation to isobutanol (engineered) VALSYN-PWY: l-valine biosynthesis PWY-5686: UMP biosynthesis PANTO-PWY: phosphopantothenate biosynthesis I |
Firmicutes | Megamonas | Megamonas funiformis cag 377 | |
| PWY-7111: pyruvate fermentation to isobutanol (engineered) | Firmicutes | Acidaminococcus | Acidaminococcus intestini | |
| Chinaa |
PWY0-1586: peptidoglycan maturation (meso-diaminopimelate containing) PWY-7111: pyruvate fermentation to isobutanol (engineered) PWY-1042: glycolysis IV (plant cytosol) VALSYN-PWY: l-valine biosynthesis ILEUSYN-PWY: l-isoleucine biosynthesis I (from threonine) ASPASN-PWY: superpathway of l-aspartate and l-asparagine biosynthesis PWY-5913: TCA cycle VI (obligate autotrophs) FERMENTATION-PWY: mixed acid fermentation PWY-6803: phosphatidylcholine acyl editing PWY-7219: adenosine ribonucleotides de novo biosynthesis |
Proteobacteria | Klebsiella | Klebsiella pneumoniae |
aRaw sequences were obtained from Yu et al. (2017)
In conclusion, the healthy gut microbiota in the Asian population namely, Malaysia, India, China, and Thailand are predominated by Firmicutes, Bacteroidetes, Actinobacteria, and Proteobacteria. Top abundant species shows that the gut microbiota is colonized by normal flora and commensals such as B. vulgatus, Eubacterium, and Bifidobacterium species. Most of the gut microbiota observed are involved in the production of short-chain fatty acids (SCFA) by various carbohydrate fermentation pathways as represented in the functional profile. The taxonomic profile also proved findings from recent studies on the potential biomarkers for Thailand and India gut microbiota such as the high abundance of F. prausnitzii and M. elsdenii in their respective gut community. Moreover, this study also provides an overview on the gut microbiota of healthy Malaysian population, comprising a high abundance of commensals in the top species that are mainly shaped by Bacteroidetes, Firmicutes, and Actinobacteria. Information on the gut microbiota of healthy Malaysians generated by the whole metagenomics approach have not yet been reported. Hence, these provisional findings are a stepping stone for future research on the gut community of healthy Malaysian population. It is recommended to increase the number of samples, including samples from different regions or ethnicity in the future to get a wider perspective and coverage on the gut microbiota of Malaysian population. It is also recommended to relate the study with specific diseases and compare the gut microbiota between healthy and disease-related individuals, as it may give more insights to the roles of the gut microbiota in the human body. Since the microbial population in the gut environment is diverse and influenced by various factors, it is difficult to gain more information on the symbiotic association of the gut microbiota with human health. A comparison of an individual or a population by their health progression from healthy to unhealthy may provide a more significant differences in the gut microbiota. Hence, providing a clearer picture on how the different conditions of the host also shape the gut community and vice versa.
Supplementary Information
Below is the link to the electronic supplementary material.
Acknowledgements
This work was supported by the Ministry of Higher Education Malaysia (Research Grant Ref: TRGS/1/2018/UM/01/7/2).
Author contributions
Conceptualization: SBM, SB, HO, SFMT; Methodology: SFMT, SBM, SB, HO; Formal analysis and investigation: SFMT, SBM; Writing—original draft preparation: SFMT; Writing—review and editing: SFMT, SBM, SB, HO; Funding acquisition: SBM, SKPG; Resources: AR, CSR, SBM, SB; Supervision: SBM, SB, HO.
Data availability
Accession numbers: Sequences obtained in this present study have been deposited in the NCBI Sequence Read Archive (SRA) (BioProject accession number PRJNA872758).
Declarations
Conflict of interest
The authors declare that they have no conflict of interest in the publication.
Ethical statements
This study was approved by the Medical Research Ethics Committee, University of Malaya Medical Center, Malaysia with ethical approval number MRECID.NO: 201914-6975, and written informed consent was obtained from all participants.
Contributor Information
Siti Fatimah Mohd Taha, Email: sva190025@siswa.um.edu.my.
Subha Bhassu, Email: subhabhassu@um.edu.my.
Hasmahzaiti Omar, Email: zaiti_1978@um.edu.my.
Chandramati Samudi Raju, Email: chandramathi@um.edu.my.
Arutchelvan Rajamanikam, Email: arutchelvan.raja04@gmail.com.
Suresh Kumar P. Govind, Email: suresh@um.edu.my
Saharuddin Bin Mohamad, Email: saharuddin@um.edu.my.
References
- Andrews S (2010) FastQC: A quality control tool for high throughput sequence data. Retrieved from http://www.bioinformatics.babraham.ac.uk/projects/fastqc/
- Bajinka O, Tan Y, Abdelhalim KA, et al. Extrinsic factors influencing gut microbes, the immediate consequences and restoring eubiosis. AMB Express. 2020;10:130. doi: 10.1186/s13568-020-01066-8. [DOI] [PMC free article] [PubMed] [Google Scholar]
- Beghini F, McIver LJ, Blanco-Míguez A, et al. Integrating taxonomic, functional, and strain-level profiling of diverse microbial communities with bioBakery 3. Elife. 2021;10:e65088. doi: 10.7554/eLife.65088. [DOI] [PMC free article] [PubMed] [Google Scholar]
- Bhute S, Pande P, Shetty SA, et al. Molecular characterization and meta-analysis of gut microbial communities illustrate enrichment of prevotella and megasphaera in Indian subjects. Front Microbiol. 2016 doi: 10.3389/fmicb.2016.00660. [DOI] [PMC free article] [PubMed] [Google Scholar]
- Bliss ES, Whiteside E. The gut-brain axis, the human gut microbiota and their integration in the development of obesity. Front Physiol. 2018 doi: 10.3389/fphys.2018.00900. [DOI] [PMC free article] [PubMed] [Google Scholar]
- Bolger AM, Lohse M, Usadel B. Trimmomatic: a flexible trimmer for Illumina sequence data. Bioinformatics. 2014;30:2114–2120. doi: 10.1093/bioinformatics/btu170. [DOI] [PMC free article] [PubMed] [Google Scholar]
- Bolte LA, Vich Vila A, Imhann F, et al. Long-term dietary patterns are associated with pro-inflammatory and anti-inflammatory features of the gut microbiome. Gut. 2021;70:1287–1298. doi: 10.1136/gutjnl-2020-322670. [DOI] [PMC free article] [PubMed] [Google Scholar]
- Calvani R, Picca A, Lo Monaco MR, et al. Of microbes and minds: a narrative review on the second brain aging. Front Med. 2018;5:53. doi: 10.3389/fmed.2018.00053. [DOI] [PMC free article] [PubMed] [Google Scholar]
- Candela M, Biagi E, Maccaferri S, et al. Intestinal microbiota is a plastic factor responding to environmental changes. Trends Microbiol. 2012;20:385–391. doi: 10.1016/j.tim.2012.05.003. [DOI] [PubMed] [Google Scholar]
- Caspi R, Altman T, Billington R, et al. The MetaCyc database of metabolic pathways and enzymes and the BioCyc collection of Pathway/Genome Databases. Nucleic Acids Res. 2014;42:D459–D471. doi: 10.1093/nar/gkt1103. [DOI] [PMC free article] [PubMed] [Google Scholar]
- Costea PI, Hildebrand F, Manimozhiyan A, et al. Enterotypes in the landscape of gut microbial community composition. Nat Microbiol. 2018;3:8–16. doi: 10.1038/s41564-017-0072-8. [DOI] [PMC free article] [PubMed] [Google Scholar]
- Dhakan DB, Maji A, Sharma AK, et al. The unique composition of Indian gut microbiome, gene catalogue, and associated fecal metabolome deciphered using multi-omics approaches. Gigascience. 2019;8:1–20. doi: 10.1093/gigascience/giz004. [DOI] [PMC free article] [PubMed] [Google Scholar]
- Di Guglielmo MD, Franke K, Cox C, Crowgey EL. Whole genome metagenomic analysis of the gut microbiome of differently fed infants identifies differences in microbial composition and functional genes, including an absent CRISPR/Cas9 gene in the formula-fed cohort. Hum Microbiome J. 2019;12:100057. doi: 10.1016/j.humic.2019.100057. [DOI] [PMC free article] [PubMed] [Google Scholar]
- Dicks LMT, Geldenhuys J, Mikkelsen LS, et al. Our gut microbiota: a long walk to homeostasis. Benef Microb. 2017;9:3–20. doi: 10.3920/BM2017.0066. [DOI] [PubMed] [Google Scholar]
- Dimidi E, Cox S, Rossi M, Whelan K. Fermented foods: definitions and characteristics, gastrointestinal health and disease. Nutrients. 2019;11:1–26. doi: 10.3390/nu11081806. [DOI] [PMC free article] [PubMed] [Google Scholar]
- Fan X, Jin Y, Chen G, et al. Gut microbiota dysbiosis drives the development of colorectal cancer. Digestion. 2021;102:508–515. doi: 10.1159/000508328. [DOI] [PubMed] [Google Scholar]
- Flint HJ, Scott KP, Duncan SH, et al. Microbial degradation of complex carbohydrates in the gut. Gut Microbes. 2012;3:289–306. doi: 10.4161/gmic.19897. [DOI] [PMC free article] [PubMed] [Google Scholar]
- Fukui H, Xu X, Miwa H. Role of gut microbiota-gut hormone axis in the pathophysiology of functional gastrointestinal disorders. J Neurogastroenterol Motil. 2018;24:367–386. doi: 10.5056/jnm18071. [DOI] [PMC free article] [PubMed] [Google Scholar]
- Gagnière J, Raisch J, Veziant J, et al. Gut microbiota imbalance and colorectal cancer. World J Gastroenterol. 2016;22:501–518. doi: 10.3748/wjg.v22.i2.501. [DOI] [PMC free article] [PubMed] [Google Scholar]
- Gupta A, Dhakan DB, Maji A, et al. Association of Flavonifractor plautii, a flavonoid-degrading bacterium, with the gut microbiome of colorectal cancer patients in India. mSystems. 2019;4:e00438-19. doi: 10.1128/mSystems.00438-19. [DOI] [PMC free article] [PubMed] [Google Scholar]
- Hills RD, Pontefract BA, Mishcon HR, et al. Gut microbiome: profound implications for diet and disease. Nutrients. 2019;11:1613. doi: 10.3390/nu11071613. [DOI] [PMC free article] [PubMed] [Google Scholar]
- Holmes E, Li JV, Marchesi JR, Nicholson JK. Gut microbiota composition and activity in relation to host metabolic phenotype and disease risk. Cell Metab. 2012;16:559–564. doi: 10.1016/j.cmet.2012.10.007. [DOI] [PubMed] [Google Scholar]
- Huang TT, Lai JB, Du YL, et al. Current understanding of gut microbiota in mood disorders: an update of human studies. Front Genet. 2019;10:98. doi: 10.3389/fgene.2019.00098. [DOI] [PMC free article] [PubMed] [Google Scholar]
- Ibragimova S, Ramachandran R, Ali FR, et al. Dietary patterns and associated microbiome changes that promote oncogenesis. Front Cell Dev Biol. 2021;9:725821. doi: 10.3389/fcell.2021.725821. [DOI] [PMC free article] [PubMed] [Google Scholar]
- Kanehisa M, Araki M, Goto S, et al. KEGG for linking genomes to life and the environment. Nucleic Acids Res. 2008;36:D480–D484. doi: 10.1093/nar/gkm882. [DOI] [PMC free article] [PubMed] [Google Scholar]
- Kaur K, Khatri I, Akhtar A, et al. Metagenomics analysis reveals features unique to Indian distal gut microbiota. PLoS ONE. 2020;15:e0231197. doi: 10.1371/journal.pone.0231197. [DOI] [PMC free article] [PubMed] [Google Scholar]
- Kelsen JR, Wu GD. The gut microbiota, environment and diseases of modern society. Gut Microb. 2012;3:374–382. doi: 10.4161/gmic.21333. [DOI] [PMC free article] [PubMed] [Google Scholar]
- Kiecolt-glaser JK, Wilson SJ, Bailey ML, et al. Marital distress, depression, and a leaky gut: translocation of bacterial endotoxin as a pathway to inflammation. Psychoneuroendocrinology. 2018;98:52–60. doi: 10.1016/j.psyneuen.2018.08.007.Marital. [DOI] [PMC free article] [PubMed] [Google Scholar]
- Kisuse J, La-ongkham O, Nakphaichit M, et al. Urban diets linked to gut microbiome and metabolome alterations in children: a comparative cross-sectional study in Thailand. Front Microbiol. 2018;9:1345. doi: 10.3389/fmicb.2018.01345. [DOI] [PMC free article] [PubMed] [Google Scholar]
- Kwon M, Seo SS, Kim MK, et al. Compositional and functional differences between microbiota and cervical carcinogenesis as identified by shotgun metagenomic sequencing. Cancers (basel) 2019;11:309. doi: 10.3390/cancers11030309. [DOI] [PMC free article] [PubMed] [Google Scholar]
- La-ongkham O, Nakphaichit M, Leelavatcharamas V, et al. Distinct gut microbiota of healthy children from two different geographic regions of Thailand. Arch Microbiol. 2015;197:561–573. doi: 10.1007/s00203-015-1089-0. [DOI] [PubMed] [Google Scholar]
- La-ongkham O, Nakphaichit M, Nakayama J, et al. Age-related changes in the gut microbiota and the core gut microbiome of healthy Thai humans. 3 Biotech. 2020;10:276. doi: 10.1007/s13205-020-02265-7. [DOI] [PMC free article] [PubMed] [Google Scholar]
- Laudadio I, Fulci V, Palone F, et al. Quantitative assessment of shotgun metagenomics and 16S rDNA amplicon sequencing in the study of human gut microbiome. Omi A J Integr Biol. 2018;22:248–254. doi: 10.1089/omi.2018.0013. [DOI] [PubMed] [Google Scholar]
- Lazar V, Ditu LM, Pircalabioru GG, et al. Aspects of gut microbiota and immune system interactions in infectious diseases, immunopathology, and cancer. Front Immunol. 2018;9:1830. doi: 10.3389/fimmu.2018.01830. [DOI] [PMC free article] [PubMed] [Google Scholar]
- Leeuwendaal NK, Stanton C, O’Toole PW, Beresford TP. Fermented foods and the gut microbiome. Nutrients. 2022;14:1527. doi: 10.1097/NT.0000000000000422. [DOI] [PMC free article] [PubMed] [Google Scholar]
- Li M, Wang B, Zhang M, et al. Symbiotic gut microbes modulate human metabolic phenotypes. Proc Natl Acad Sci USA. 2008;105:2117–2122. doi: 10.1073/pnas.0712038105. [DOI] [PMC free article] [PubMed] [Google Scholar]
- Louis P, Duncan SH, Sheridan PO, et al. Microbial lactate utilisation and the stability of the gut microbiome. Gut Microbiome. 2022;3:1–16. doi: 10.1017/gmb.2022.3. [DOI] [PMC free article] [PubMed] [Google Scholar]
- Lu J, Zhang L, Zhai Q, et al. Chinese gut microbiota and its associations with staple food type, ethnicity, and urbanization. Npj Biofilms Microbiomes. 2021;7:71. doi: 10.1038/s41522-021-00245-0. [DOI] [PMC free article] [PubMed] [Google Scholar]
- Luan Z, Sun G, Huang Y, et al. Metagenomics study reveals changes in gut microbiota in centenarians: a cohort study of hainan centenarians. Front Microbiol. 2020;11:1474. doi: 10.3389/fmicb.2020.01474. [DOI] [PMC free article] [PubMed] [Google Scholar]
- Ma Q, Xing C, Long W, et al. Impact of microbiota on central nervous system and neurological diseases: the gut- brain axis. J Neuroinflamm. 2019;16:53. doi: 10.1186/s12974-019-1434-3. [DOI] [PMC free article] [PubMed] [Google Scholar]
- Madison A, Kiecolt-Glaser JK. Stress, depression, diet, and the gut microbiota: human–bacteria interactions at the core of psychoneuroimmunology and nutrition. Curr Opin Behav Sci. 2019;28:105–110. doi: 10.1016/j.cobeha.2019.01.011. [DOI] [PMC free article] [PubMed] [Google Scholar]
- Manichanh C, Borruel N, Casellas F, Guarner F. The gut microbiota in IBD. Nat Rev Gastroenterol Hepatol. 2012;9:599–608. doi: 10.1038/nrgastro.2012.152. [DOI] [PubMed] [Google Scholar]
- Martin AM, Sun EW, Rogers GB, Keating DJ. The influence of the gut microbiome on host metabolism through the regulation of gut hormone release. Front Physiol. 2019;10:428. doi: 10.3389/fphys.2019.00428. [DOI] [PMC free article] [PubMed] [Google Scholar]
- Medina DA, Li T, Thomson P, et al. Cross-regional view of functional and taxonomic microbiota composition in obesity and post-obesity treatment shows country specific microbial contribution. Front Microbiol. 2019;10:2346. doi: 10.3389/fmicb.2019.02346. [DOI] [PMC free article] [PubMed] [Google Scholar]
- Miquel S, Martin R, Bridonneau C, et al. Ecology and metabolism of the beneficial intestinal commensal bacterium Faecalibacterium prausnitzii. Gut Microb. 2014;5:146–151. doi: 10.4161/gmic.27651. [DOI] [PMC free article] [PubMed] [Google Scholar]
- Morais LH, Schreiber HL, Mazmanian SK. The gut microbiota–brain axis in behaviour and brain disorders. Nat Rev Microbiol. 2020;19:241–255. doi: 10.1038/s41579-020-00460-0. [DOI] [PubMed] [Google Scholar]
- Neuman H, Debelius JW, Knight R, Koren O. Microbial endocrinology: the interplay between the microbiota and the endocrine system. FEMS Microbiol Rev. 2015;39:509–521. doi: 10.1093/femsre/fuu010. [DOI] [PubMed] [Google Scholar]
- Nitisinprasert S, Ruengsomwong S, La Ongkham O, et al. Microbial community of healthy Thai vegetarians and non-vegetarians, their core gut microbiota and pathogens risk. J Microbiol Biotechnol. 2016;26:1723–1735. doi: 10.4014/jmb.1603.03057. [DOI] [PubMed] [Google Scholar]
- Ortigao R, Pimentel-Nunes P, Dinis-Ribeiro M, Libanio D. Gastrointestinal microbiome—what we need to know in clinical practice. GE Port J Gastroenterol. 2020;27:336–351. doi: 10.1159/000505036. [DOI] [PMC free article] [PubMed] [Google Scholar]
- Pareek S, Kurakawa T, Das B, et al. Comparison of Japanese and Indian intestinal microbiota shows diet-dependent interaction between bacteria and fungi. Npj Biofilms Microbiomes. 2019;5:37. doi: 10.1038/s41522-019-0110-9. [DOI] [PMC free article] [PubMed] [Google Scholar]
- Phoonlapdacha P, Tangshewinsirikul C, Phosuwattanakul J, et al. Gut microbiome profiles in Thai healthy pregnant women and its association with types of foods. BMC Preg Childb. 2022;22:79. doi: 10.1186/s12884-022-04397-5. [DOI] [PMC free article] [PubMed] [Google Scholar]
- Poretsky R, Rodriguez-R LM, Luo C, et al. Strengths and limitations of 16S rRNA gene amplicon sequencing in revealing temporal microbial community dynamics. PLoS ONE. 2014;9:e93827. doi: 10.1371/journal.pone.0093827. [DOI] [PMC free article] [PubMed] [Google Scholar]
- Raethong N, Nakphaichit M, Suratannon N, et al. Analysis of human gut microbiome: Taxonomy and metabolic functions in Thai adults. Genes (basel) 2021;12:331. doi: 10.3390/genes12030331. [DOI] [PMC free article] [PubMed] [Google Scholar]
- Rampelli S, Soverini M, D’Amico F, et al. Shotgun metagenomics of human gut microbiota up to extreme longevity and the increasing role of xenobiotics degradation. mSystems. 2020;5:e00124-20. doi: 10.2139/ssrn.3419082. [DOI] [PMC free article] [PubMed] [Google Scholar]
- Reichardt N, Duncan SH, Young P, et al. Phylogenetic distribution of three pathways for propionate production within the human gut microbiota. ISME J. 2014;8:1323–1335. doi: 10.1038/ismej.2014.14. [DOI] [PMC free article] [PubMed] [Google Scholar]
- Rinninella E, Cintoni M, Raoul P, et al. Food components and dietary habits: keys for a healthy gut microbiota composition. Nutrients. 2019;11:2393. doi: 10.3390/nu11102393. [DOI] [PMC free article] [PubMed] [Google Scholar]
- Rowland I, Gibson G, Heinken A, et al. Gut microbiota functions: metabolism of nutrients and other food components. Eur J Nutr. 2018;57:1–24. doi: 10.1007/s00394-017-1445-8. [DOI] [PMC free article] [PubMed] [Google Scholar]
- Segata N, Izard J, Waldron L, et al. Metagenomic biomarker discovery and explanation. Genome Biol. 2011;12:R60. doi: 10.1186/gb-2011-12-6-r60. [DOI] [PMC free article] [PubMed] [Google Scholar]
- Sherwin E, Dinan TG, Cryan JF. Recent developments in understanding the role of the gut microbiota in brain health and disease. Ann N Y Acad Sci. 2018;1420:5–25. doi: 10.1111/nyas.13416. [DOI] [PubMed] [Google Scholar]
- Shondelmyer K, Knight R, Sanivarapu A, et al. Ancient Thali diet: gut microbiota, immunity, and health. Yale J Biol Med. 2018;91:177–184. [PMC free article] [PubMed] [Google Scholar]
- Singh RK, Chang HW, Yan D, et al. Influence of diet on the gut microbiome and implications for human health. J Transl Med. 2017;15:73. doi: 10.1186/s12967-017-1175-y. [DOI] [PMC free article] [PubMed] [Google Scholar]
- Sokol H, Pigneur B, Watterlot L, et al. Faecalibacterium prausnitzii is an anti-inflammatory commensal bacterium identified by gut microbiota analysis of Crohn disease patients. Proc Natl Acad Sci USA. 2008;105:16731–16736. doi: 10.1073/pnas.0804812105. [DOI] [PMC free article] [PubMed] [Google Scholar]
- Stavropoulou E, Kantartzi K, Tsigalou C, et al. Focus on the gut-kidney axis in health and disease. Front Med. 2021;7:620102. doi: 10.3389/fmed.2020.620102. [DOI] [PMC free article] [PubMed] [Google Scholar]
- Suzek BE, Huang H, McGarvey P, et al. UniRef: comprehensive and non-redundant UniProt reference clusters. Bioinformatics. 2007;23:1282–1288. doi: 10.1093/bioinformatics/btm098. [DOI] [PubMed] [Google Scholar]
- Tamang JP, Cotter PD, Endo A, et al. Fermented foods in a global age: east meets west. Compr Rev Food Sci Food Saf. 2020 doi: 10.1111/1541-4337.12520. [DOI] [PubMed] [Google Scholar]
- Thomas AM, Manghi P, Asnicar F, et al. Metagenomic analysis of colorectal cancer datasets identifies cross-cohort microbial diagnostic signatures and a link with choline degradation. Nat Med. 2019;25:667–678. doi: 10.1038/s41591-019-0405-7. [DOI] [PMC free article] [PubMed] [Google Scholar]
- Tyagi A, Singh B, Billekallu Thammegowda NK, Singh NK. Shotgun metagenomics offers novel insights into taxonomic compositions, metabolic pathways and antibiotic resistance genes in fish gut microbiome. Arch Microbiol. 2019;201:295–303. doi: 10.1007/s00203-018-1615-y. [DOI] [PubMed] [Google Scholar]
- Valdes AM, Walter J, Segal E, Spector TD. Role of the gut microbiota in nutrition and health. BMJ. 2018;361:k2179. doi: 10.1136/bmj.k2179. [DOI] [PMC free article] [PubMed] [Google Scholar]
- Van der Merwe M. Gut microbiome changes induced by a diet rich in fruits and vegetables. Int J Food Sci Nutr. 2021;72:665–669. doi: 10.1080/09637486.2020.1852537. [DOI] [PubMed] [Google Scholar]
- Vernocchi P, Del CF, Putignani L. Gut microbiota metabolism and interaction with food components. Int J Mol Sci. 2020 doi: 10.3390/ijms21103688. [DOI] [PMC free article] [PubMed] [Google Scholar]
- Wang H, Wei CX, Min L, Zhu LY. Good or bad: gut bacteria in human health and diseases. Biotechnol Biotechnol Equip. 2018;32:1075–1080. doi: 10.1080/13102818.2018.1481350. [DOI] [Google Scholar]
- Wirbel J, Pyl PT, Kartal E, et al. Meta-analysis of fecal metagenomes reveals global microbial signatures that are specific for colorectal cancer. Nat Med. 2019;25:679–689. doi: 10.1038/s41591-019-0406-6. [DOI] [PMC free article] [PubMed] [Google Scholar]
- Yu J, Feng Q, Wong SH, et al. Metagenomic analysis of faecal microbiome as a tool towards targeted non-invasive biomarkers for colorectal cancer. Gut. 2017;66:70–78. doi: 10.1136/gutjnl-2015-309800. [DOI] [PubMed] [Google Scholar]
- Zeller G, Tap J, Voigt AY, et al. Potential of fecal microbiota for early-stage detection of colorectal cancer. Mol Syst Biol. 2014;10:766. doi: 10.15252/msb.20145645. [DOI] [PMC free article] [PubMed] [Google Scholar]
- Zhang W, Li J, Lu S, et al. Gut microbiota community characteristics and disease-related microorganism pattern in a population of healthy Chinese people. Sci Rep. 2019;9:1594. doi: 10.1038/s41598-018-36318-y. [DOI] [PMC free article] [PubMed] [Google Scholar]
- Zhang Z, Tang H, Chen P, et al. Demystifying the manipulation of host immunity, metabolism, and extraintestinal tumors by the gut microbiome. Signal Transduct Target Ther. 2019 doi: 10.1038/s41392-019-0074-5. [DOI] [PMC free article] [PubMed] [Google Scholar]
Associated Data
This section collects any data citations, data availability statements, or supplementary materials included in this article.
Supplementary Materials
Data Availability Statement
Accession numbers: Sequences obtained in this present study have been deposited in the NCBI Sequence Read Archive (SRA) (BioProject accession number PRJNA872758).