

Abstract
Background
Cell culture studies demonstrate the importance of β3 integrin in osteocyte mechanotransduction. However, the in vivo roles of osteocyte β3 integrin in the regulation of bone homeostasis and mechanotransduction are poorly defined.
Materials and methods
To study the in vivo role of osteocyte β3 integrin in bone, we utilized the 10-kb Dmp1 (dentin matrix acidic phosphoprotein 1)-Cre to delete β3 integrin expression in osteocyte in mice. Micro-computerized tomography (μCT), bone histomorphometry and in vitro cell culture experiments were performed to determine the effects of osteocyte β3 integrin loss on bone mass accrual and biomechanical properties. In addition, in vivo tibial loading model was applied to study the possible involvement of osteocyte β3 integrin in the mediation of bone mechanotransduction.
Results
Deletion of β3 integrin in osteocytes resulted in a low bone mass and impaired biomechanical properties in load-bearing long bones in adult mice. The loss of β3 integrin led to abnormal cell morphology with reduced number and length of dentritic processes in osteocytes. Furthermore, osteocyte β3 integrin loss did not impact the osteoclast formation, but significantly reduced the osteoblast-mediated bone formation rate and reduced the osteogenic differentiation of the bone marrow stromal cells in the bone microenvironment. In addition, mechanical loading failed to accelerate the anabolic bone formation in mutant mice.
Conclusions
Our studies demonstrate the essential roles of osteocyte β3 integrin in regulating bone mass and mechanotransduction.
Keywords: β3 integrin, Osteocyte, Bone homeostasis, Mechanotransduction
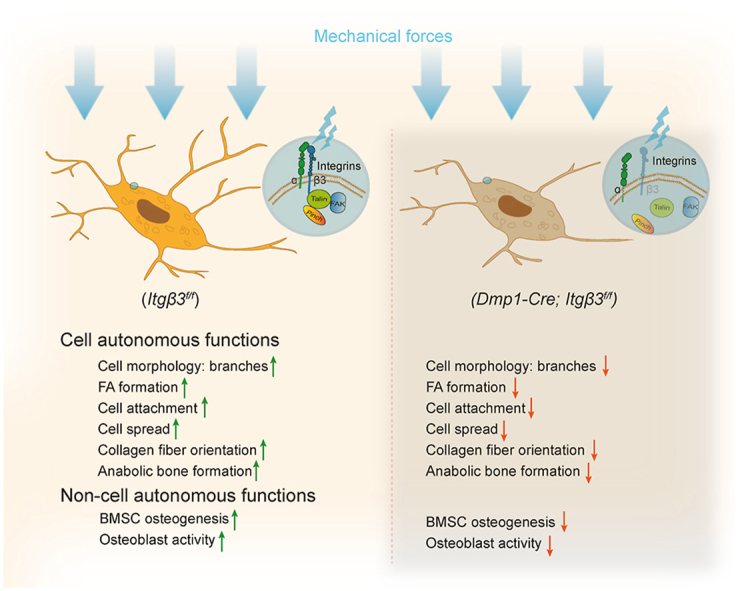
Graphical abstract
1. Introduction
Osteocytes are the most abundant and long-lived cell type in bone tissue, which account for 90–95% of the total cell numbers in bone at adult stage [1]. Besides t heir massive cell numbers, osteocytes have been demonstrated as the master regulator cells in bone homeostasis [2], whose important contributions include the maintenance of calcium and phosphate metabolism, acting as the essential endocrine cells that communicate with other organs in our body [3], and working as the major responsive cells for mechanotransduction in bone [4]. There are multiple molecular mechanosensors that have been proved with active participation in osteocyte mechanical force sensation, transmission and biological functions [4,5], such as cell cytoskeleton, cell dendrites, primary cilia, gap junctions, mechanic-sensitive membrane channels, focal adhesions (FAs) etc. Among these mechanosensors, FAs in osteocytes have been demonstrated with indispensable roles in preserving bone mass, regulating mechanical force sensation and transduction.
FAs are integrin-containing multi-protein complexes which link the external extracellular matrix (ECM) and internal cytoskeleton in cells [6]. Previous studies from our and other groups have shown that FA-associated proteins, including Kindlin-2 [7,8], focal adhesion kinase (FAK) [9], Pinch1/2 [10] and other FA proteins, actively participate in bone homeostasis and osteocyte mechanotransduction. Among FA proteins, integrins are the fundamental transmembrane proteins that sense the external ECM biomechanical properties and transduce bi-directional signaling through outside-in and inside–out pathways between cells and their environment [11]. Integrins are heterodimers formed by α and β subunits. β1 and β3 integrins are the two major β subunits that are highly expressed in osteocytes [12]. By using specific antibodies against β1 and β3 integrins, immuno-fluorescence staining and super-resolution imaging results suggest a differential subcellular distribution of β1 and β3 integrins in osteocytes [4,13,14], i.e., β1 integrin is mainly observed near the plasma membrane of osteocyte cell body and forms traditional FA complex with vinculin and paxillin [13], whereas β3 integrin forms distinct puncta along osteocyte dendritic processes which are considered as atypical FA complexes co-localized with some channel proteins, such as purinergic channel pannexin 1, the ATP-gated purinergic receptor P2X7R and the low-voltage transiently opened T-type calcium channel CaV3.2–1 [13]. At these sites where β3 integrin forms atypical FA complex, it is believed that these FA puncta can directly connect osteocyte cell membrane with the canalicular wall, contributing to force sensation and amplification during osteocyte mechanotransduction [4,13,15]. These observations suggest the distinct subcellular distributions of β1 and β3 Integrin in osteocytes, which indicates diverse functions or regulations of these two integrin subunits in these cells.
We and others have recently demonstrated the important contributions of β1 integrin in osteocytes during bone mass accrual and bone mechanotransduction [16,17]. However, little is known about the in vivo functions of β3 integrin in osteocytes. β3-null mice are viable but exhibit an extended bleeding time [18]. These mice also develop histologically and radiographically evident osteosclerosis with age [19], and more vulnerable to osteolytic bone metastasis [20]. Moreover, β3-null mice display dysfunctional osteoclasts and are resistant to ovariectomy-induced bone loss [21], but β3 deficiency does not appear to affect bone fracture healing [18]. In addition, the expression of β3 integrin in bone cells was reduced in osteoporotic animals when compared with normal animals [22]. These results indicate an indispensable role of β3 integrin for the proper functions in bone environment. However, the specific in vivo functions of β3 integrin in osteocytes remain unclear.
Compared to in vivo studies, great attention and efforts have been put on the in vitro functions of β3 integrin in osteocytes. Direct evidence of β3 integrin in osteocyte mechaosensing and transduction is that the osteocyte processes are the major cellular compartment that are responsive to piconewton-level mechanical loading [23,24]. Blocking the αvβ3 integrin attachment with local ECM compromises the cellular responses to force stimulation [23]. Moreover, specific blocking β3 integrin by antagonists disrupts the cellular morphology and spreading of osteocytes, and reduces the cyclooxygenase-2 (COX-2) expression and prostaglandin E2 (PGE2) release upon fluid shear stress in osteocytes [25]. However, there is a lack of direct evidence and systematic analysis about the participation of osteocyte β3 integrin in bone mass and mechanotransduction regulation in animals.
In this study, we generated mutant mice with β3 integrin deletion in osteocytes and demonstrated that β3 integrin in osteocytes is essential for the bone mass accrual and force induced bone formation. Osteocyte β3 integrin loss in mice results in dramatic osteopenia accompanied with reduced biomechanical properties in the long bones. Moreover, β3 integrin loss in osteocytes did not influence osteoclast activities but significantly reduced the osteoblast-mediated bone formation rate and largely impaired the bone marrow stromal cells differentiation capacity in bone. In addition, mice with β3 integrin deletion in osteocytes failed to increase bone formation upon mechanical force stimulation. Thus, we demonstrate the important roles of β3 integrin in favoring bone mass accrual and modulating mechanotransduction in bone.
2. Materials and methods
2.1. Animal study
Floxed Itgβ3 mice (Itgβ3f/f) were purchased from Jackson Laboratory (Stock No: 028232) with the loxP sites flanking exon 1 of the β3 integrin (Itgβ3) gene. Mice with 10-kb mouse Dmp1 gene promoter-driving Cre recombinase expression (Dmp1-Cre) were generated as we previously described in Ref. [26]. Mice with deletion of Itgβ3 (Dmp1-Cre; Itgβ3f/f, referred to as cKO hereinafter) were generated by inter-crossing heterozygote male mice (Dmp1-Cre; Itgβ3f/+) with homozygous female mice (Itgβ3f/f) mice. In this study, age- and gender-matched Cre-negative littermates were used as control mice. All research protocols were approved by the Institutional Animal Care and Use Committee (IACUC) of Southern University of Science and Technology with the laboratory animal ethics resolution number of SUSTC-JY2020123. All relevant guidelines for the work with animals were adhered to in this study. Genotyping of experimental mice were conducted as we previously described in Ref. [16]. The primers used for mouse genotyping were summarized in Table 1.
Table 1.
Primers and siRNA sequences.
| Genotyping primers information | ||
|---|---|---|
| Name | 5′ primer | 3′ primer |
| Cre | GATCTCCGGTATTGAAACTCCAGC | GCTAAACATGCTTCATCGTCGG |
| β3 integrin | CGGAGCTAGGACTGAGAAGC | CCAGCGGATCTCCATCTTTC |
| si-RNA sequences | ||
| si-RNA name | 5′ to 3′ sequence | 3′ to 5′ sequence |
| si-NC | UUCUCCGAACGUGUCACGUTT | ACGUGACACGUUCGGAGAATT |
| si-Gapdh | AGGTCGGTGTGAACGGATTTG | GGGGTCGTTGATGGCAACA |
| si-β3 | GGCAAAAACGCCGUGAAUUTT | AAUUCACGGCGUUUUUGCCTT |
| qPCR primer sequences | ||
| Name | 5′ primer | 3′ primer |
| Gapdh | CAGTGCCAGCCTCGTCCCGTAGA | CTGCAAATGGCAGCCCTGGTGAC |
| Osterix | ATGGCGTCCTCTCTGCTTG | TGAAAGGTCAGCGTATGGCTT |
| Alp | CCAACTCTTTTGTGCCAGAGA | GGCTACATTGGTGTTGAGCTTTT |
| Runx2 | AACGATCTGAGATTTGTGGGC | CCTGCGTGGGATTTCTTGGTT |
| Col1α1 | GCTCCTCTTAGGGGCCACT | CCACGTCTCACCATTGGGG |
| Bsp | AAGAGGAAGAAAATGAGAACGA | GCTTCTTCTCCGTTGTCTCC |
| Osteocalcin | AGGGAGGATCAAGTCCCG | GAACAGACTCCGGCGCTA |
| Cebpα | CAAGAACAGCAACGAGTACCG | GTCACTGGTCAACTCCAGCAC |
| Cebpβ | CAAGCTGAGCGACGAGTACA | CAGCTGCTCCACCTTCTTCT |
| Ap2 | GGGGCCAGGCTTCTATTCC | GGAGCTGGGTTAGGTATGGG |
| Pref-1 | CCCAGGTGAGCTTCGAGTG | GGAGAGGGGTACTCTTGTTGAG |
| Adiponectin | TGTTCCTCTTAATCCTGCCCA | CCAACCTGCACAAGTTCCCTT |
| Pparγ | TCGCTGATGCACTGCCTATG | GAGAGGTCCACAGAGCTGATT |
2.2. Micro-computerized tomography (μCT)
Either live anesthetized mice or fixed non-demineralized bones were subjected to μCT analyses in the Experimental Animal Center of Southern University of Science and Technology using a Bruker μCT (SkyScan 1276 Micro-CT, Bruker Micro-CT, Kontich, Belgium). The parameters of femurs, ulnae, skull and tibiae were set as described previously [8]. Briefly, the scanning regions included the whole set of bones, and the parameters for analyzing each bone were listed as follows. Femur trabecular bone parameters were assessed from 500 μm to 2000 μm from the distal growth plate; and its cortical bone rages from 4000 μm to 5000 μm from the distal growth plate. The ulna parameters were assessed at the proximal spongiosa from the end of growth plate to 1200 μm extending distally for trabecular bone, and 500 μm thick of cortical bone at the midshaft. The calvaria parameters were analyzed in the region of interest (ROI) at the center of skull with 2 mm × 2 mm size. The tibia parameters were assessed at the proximal spongiosa from the end of growth plate to 750 μm extending distally for trabecular bone, and 500 μm thick of cortical bone at the midshaft. The parameters for the cortical bone included the bone mineral density (BMD, g/cm3), bone volume fraction (BV/TV) and cortical thickness (Ct.Th, mm). The parameters for the trabecular bone included the bone mineral density (BMD, g/cm3), bone volume fraction (BV/TV), trabecular thickness (Tb.Th, μm), trabecular separation (Tb.Sp, μm) and trabecular number (Tb.N, 1/mm).
2.3. In vivo tibial loading
Tibial loading experiments were conducted as previously described in [8] by using an electro actuator (Bose ElectroFore 3200; EndureTEC Minnetonka, MN, USA). Briefly, mice were under anesthesia with 2.5% Avertin injection (100 μl per 10 g body weight). The right tibia was loaded with cyclic compression force (4 Hz, triangular waveform, 9.0 N peak force, 1200 cycles per loading). The left limbs were served as unloading internal controls. The experimental animals were loaded every two days for two weeks. μCT scanning was conducted on the day 1 before loading and on the day 14 after loading. Animals were sacrificed on Day 14 for bone histomorphometry.
2.4. Femur three-point bending
Femurs were dissected free of soft tissue and immediately tested by using ElectroForce (Bose ElectroFore 3200; EndureTEC Minnetonka, MN, USA). The mechanical properties of femurs were tested in the anteroposterior direction on a two-tip stainless steel bending apparatus (tip span length, 7 mm). The force transmission was set at the middle position of femurs with a continuous displacement of 0.05 mm/s until failure of the specimen. Whole femur mechanical properties, including maximum load, maximum displacement and stiffness, were determined using load–displacement diagrams.
2.5. Nano-indentation
The nano-indentation experiments were performed with a Nano Indenter G200 (Keysight Technologies, Inc., Santa Rosa, CA, USA), equipped with a three-sided pyramid Berkovich diamond tip. For the indenter tip, Young’s modulus (Ei) = 1140 GPa and Poisson’s ratio (vi) = 0.07. The identical loading scheme applied consists of a loading stage at a constant rate of 20 mN/min to a depth of 1000 nm, holding at this load for a period of 10 s and then unloading to 15% of the peak load at a rate of 10 mN/min. Each sample was performed on twenty indentations at the midshaft of bone samples. In calculating the modulus values from the nanoindentation data, the Poisson ratio for bone is taken to be 0.3.
2.6. Bone histology, immunohistochemistry and two-photon imaging
Non-demineralized tibiae were embedded in methyl methacrylate following the manufactory plastic embedding protocol (EM0200, Osteo-Bed Bone Embedding Kit, Sigma, MO, USA). Transverse tibial sections with 6 μm thickness were obtained by cutting with an annular diamond saw. Images of double calcein labeling bone sections were visualized using the argon 488 nm laser of fluorescent microscopy (Olympus, BX53). For bone immunohistochemistry (IHC) and immunofluorescence (IF), bone samples were decalcified with 10% ethylenedinitrilotetraacetic acid (EDTA, Sigma) for 3 weeks before embedded in paraffin and cut in 5 μm transversal sections. IHC and IF experiments were performed using our standard protocols as we previously described in [27]. Antibodies used in this study are listed in Table 2. F-actin was visualized with Rhodamine-Phalloidin dye (Invitrogen, Cat# A12379). For collagen fiber detection, Sirius red/fast green collagen staining kit (Chondrex, Inc, Woodinville, WA, USA cat#: 9046) was used by following the manufacturer staining and extraction protocol. For collagen fiber imaging, SHG and two-photon excited fluorescence imaging were conducted with inverted two-photon Olympus FVMPE-RS microscopy. For lacunar-canalicular system (LCS) staining, femur bone blocks were pre-stained with FITC solution (10%, diluted in 100% ethanol; Thermo Fisher, Alexa FluorTM 488, Cat# A10235) for 2 days, then embedded for frozen section into 20 μm thickness for direct confocal imaging.
Table 2.
Antibodies information.
| Name | Supplier | Cat # | Western blot usage | IF/IHC usage |
|---|---|---|---|---|
| Integrin β1 | Cell Signaling | #34971 | 1:1000 | |
| Integrin β3 | Cell Signaling | #13166 | 1:1000 | 1:200 |
| Kindlin-2 | Millipore | MAB2167 | 1:1000 | |
| Gapdh | Abcam | Ab245355 | 1:1000 | |
| Connexin43 | Abcam | ab11370 | 1:1000 | |
| FAK | Abcam | ab40794 | 1:1000 | |
| p-FAK | Abcam | ab81298 | 1:1000 | 1:100 |
| Piezo1 | Proteintech | 15939-1-AP | 1:500 | |
| Pinch1 | Abcam | ab108609 | 1:1000 | |
| Pinch2 | Abcam | ab173008 | 1:1000 | |
| Talin1 | Cell Signaling | 4021 S | 1:1000 | 1:200 |
| p-Talin1 | Cell Signaling | 13589 S | 1:1000 | |
| Vinculin | Proteintech | 66305-1-Ig | 1:1000 | |
| Tubulin | Cell Signaling | 2144 S | 1:1000 | |
| β-Actin | TransGene | HC201 | 1:2000 | |
| ALP | ThermoFisher | PA5-106391 | 1:200 | |
| Dmp1 | Abcam | ab103203 | 1:1000 | |
| Sclerostin | R&D systems | AF1589 | 1:1000 | |
| PTH1r | Abcam | ab180762 | 1:1000 |
2.7. Serum ELISA
Mouse serum samples were collected from the supernatant of centrifuged (4 °C, 12000g, 20 min) whole blood after coagulation for 1 hour at room temperature. Samples were immediately kept at -80 °C fridge before usage. Serum levels of P1NP and CTX-1 were measured by IDS Rat/Mouse P1NP EIA kit and The RatLaps™ (CTX-I) EIA assay (Immunodiagnostic Systems Limited, UK).
2.8. Bone marrow stem cells (BMSC) culture and differentiation
Primary BMSCs were isolated from both femurs and tibiae of 6-month-old mice and cultured as described previously [28]. For osteogenic differentiation, BMSCs were cultured in osteogenic medium (α-MEM containing 10% FBS and 50 μg/mL ascorbic acid) for 7 days and then stained for ALP using a BCIP/NBT ALP color development kit (Beyotime, China). For adipogenic differentiation, BMSCs were cultured with reagents from the MesenCult™ Adipogenic Differentiation Kit (Stemcell Technologies) for 9 days and then stained with Oil Red O (Sigma).
2.9. Cell culture, transfection and in vitro attachment experiments
Mouse osteocyte-like MLO-Y4 cells were maintained in α-MEM with 10% FBS and 1% P/S, in 37 °C, 5% CO2 cell culture incubator. For transient transfection, 60-80% confluent cells were transfected with indicated siRNAs using the Lipofectamine ® RNAiMAX Reagent according to the manufacturer’s instructions. The siRNA sequences were summarized in Table 1. For cell attachment experiments, cells were transfected with siRNA for 24 hours before trypsinized for cell attachment and spreading experiments on non-coated, collagen-I-coated (Corning, cat# 354,236, 40 ng/cm2) and Fibronetin/FN- coated (ThermoFisher, cat# 33,016,015, 1 μg/μl) culture dishes. Snapshots of cells were taken 30 mins, 1 hr, 3 hrs and 6 hrs after cell reseeding. Cells were fixed for immuno-fluorescence staining and SEM imaging 24 hrs after reseeding.
2.10. Quantitative real-time PCR and western blot analyses
RNA and protein isolation, quantitative real-time PCR and western blot analyses were performed as previously described in [29]. In brief, total RNA was extracted from cultured cells using Trizol reagents. Synthesis of cDNA was performed using 2 μg of RNA by a Transcriptor First Strand cDNA Synthesis Kit according to the manufacturer’s instructions. Relative mRNA expression levels were determined using a SYBR Green qPCR kit with CFX96 Real-Time System. β-Actin mRNA was used for normalization. The specific primers for gene expression analysis were listed in Table 1. For western blotting (WB), cell lysates or cortical bone samples were harvested in RIPA lysis buffer. Protein concentration was measured with a BCA kit. Aliquots of 30 μg total protein were separated and transferred onto PVDF membranes. Membranes were blocked at room temperature in 5% non-fat powdered milk for 1 hour, followed by an overnight incubation at 4 °C with primary antibodies. The specific primary antibodies for WB were listed in Table 2. After incubation with appropriate HRP-conjugated secondary antibodies, blots were developed using an enhanced chemiluminescence and exposed in ChemiDoc XRS chemiluminescence imaging system.
2.11. Immunofluorescence, confocal imaging and SEM imaging
Cultured cells or rehydrated paraffin bone sections were fixed with 4% PFA, penetrated with 0.25% Triton X-100, blocked with 1% BSA and then incubated with antibodies. Antibodies used in this study were listed in Table 2. Live imaging and Z-stack imaging were conducted by Nikon A1R laser-scanning confocal microscopy with 5 sec time interval and 0.5 μm z-stack interval. The cellular morphology of MLO-Y4 cells was observed on scanning electron microscope (SEM, ZEISS Merlin) at 5.0 kV. In brief, cells growing on glass coverslips were fixed with 4% PFA and underwent sequential dehydration by incubation in a series of methanol solutions for 10 minutes per solution: 35%, 50%, 75%, 90% and 100% methanol. Samples were completely dehydrated with a series of hexamethyldisilazane (HMDS) solutions in 100% methanol for 10 minutes: 25%, 50%, 75%, and 100%. Completely dehydrated samples were left to air dry in hood overnight. Cells on coverslips were mounted with double-sided conductive tapes, and coated with Au/Pt (Gold/Platinum) particles before SEM scanning.
2.12. Statistical analysis
All data were analyzed in this study by using the GraphPad Prism software (Version 8.0). The differences between two groups were analyzed by Student’s t-test. The differences among different time-points were analyzed by two-way ANOVA. Results are expressed as mean ± standard deviation (s.d.). Difference with P < 0.05 was considered as statistically significant. All experiments were repeated at least three times.
3. Results
3.1. Deleting β3 integrin in osteocytes results in osteopenia in mice
To determine the in vivo functions of β3 integrin in osteocytes, we generated mice lacking β3 integrin in osteocytes (Itgβ3Dmp1, hereinafter referred to as cKO mice) by crossing the floxed Itgβ3 mice with the 10-kb mouse Dmp1 (dentin matrix acidic phosphoprotein 1)-Cre mice [26]. The age- and gender-matched Cre-negative littermates were used as control mice. We confirmed the genotype of conditional deletion mice by PCR sequencing of mouse tail DNAs with both Cre and β3 integrin specific primers (Table 1, Supplementary Fig. 1a). The deletion efficiency of β3 integrin in osteocytes was determined by IHC and western blotting (WB) experiments with cortical bone samples (Fig. 1a and b). Quantitative analysis revealed that cKO mice lost around 70% of β3 integrin in cortical osteocytes compared with their control littermates (Fig. 1c). We also determined the β3 integrin expression levels in other important organs (Supplementary Fig. 1b), including muscle, heart, spleen, lung, kidney and liver. Results showed that β3 integrin expression was not reduced in these tissues or organs in cKO mice.
Fig. 1.

β3 integrin loss in osteocytes results in osteopenia of long bones in adult mice. (a) Immunohistochemistry (IHC) of the tibia cortical bone sections with anti-mouse β3 integrin antibody from control and cKO mice. (b–c) Western blotting (WB) and its quantitative results of β3 integrin and β1 integrin expression of femurs and tibiae cortical bone samples from control and cKO mice. n = 3 for each group. Gapdh was used as a loading control. (d) Representative micro-computerized tomography (μCT) images of the mid-shaft cortical bone (Ct.) and distal trabecular bone (Tb.) of femurs from 2-month-old and 6-month-old male control and cKO mice. (e–h) Quantitative μCT analyses of the cortical thickness (Ct.Th), trabecular bone mineral density (BMD, g/cm3), bone volume fraction (BV/TV) and trabecular number (Tb.N, 1/mm) of femurs. n = 8 for 2-month groups; n = 6 for 6-month groups. (i) Representative μCT images of the Ct. and Tb. of ulnae from 6-month-old male control and cKO mice. (j–l) Quantitative μCT analyses of trabecular BMD, BV/TV, and Tb.N of ulnae. n = 4–5 for each group. (m) Representative μCT images of the skull from 6-month-old male control and cKO mice. (n–p) Quantitative μCT analyses of BMD, BV/TV, and skull thickness of control and cKO mice. n = 3 for each group. Results are expressed as mean ± standard deviation (s.d.). n. s. P > 0.05; ∗p < 0.05; ∗∗p < 0.01; ∗∗∗p < 0.001.
We traced the development of control and cKO mice by monitoring their body-weight and bone mass by in vivo μCT scanning. The appearance between the two genotypes was indistinguishable (Supplementary Fig. 1c) and the overall body-weight increment during the first six months was comparable (Supplementary Fig. 1d). Moreover, when we compared the length of long bones between control and cKO mice, we found that the average bone lengths of femurs, tibiae and ulnae were similar in control and cKO mice (Supplementary Figs. 1e and f). These results suggest that β3 integrin loss in osteocytes does not affect skeletal development in mice.
Interestingly, we found that even though the bone length was similar between the two genotypes at 6-month age, the bone mineral density (BMD), trabecular bone volume fraction (BV/TV) and cortical bone thickness (Ct.Th) of femurs were significantly reduced in cKO mice compared to those in control mice (Fig. 1d). Furthermore, in vivo μCT analysis revealed that the bone mass was comparable between control and cKO mice at 2-month age (Fig. 1d–h). However, when these mice grew up to 6-month age, the cKO mice showed an average of 6.4% drop of cortical thickness, 30.8% drop of trabecular BMD, 58.1% drop of trabecular BV/TV and 42.2% drop of trabecular number compared to the Cre-negative control littermates (Fig. 1e–h). To further confirm the bone mass loss in 6-month-old cKO mice, we scanned the other bone samples from both control and cKO mice at 6-month age. As presented in Fig. 1i-l, we also observed a dramatic bone loss in ulnae from cKO mice. Detailed μCT scanning results of femurs and ulnae at 6-month-old age were listed in Supplementary Fig. 2. Interestingly, the overall morphology, bone mass and thickness of skull from the two genotypes were comparable at 6 months (Fig. 1m-p). Together, these results demonstrate that loss of β3 integrin in osteocytes causes a severe osteopenia in long bones of cKO mice at adult stage.
3.2. β3 integrin loss in osteocytes impairs the mechanical properties of long bones
To determine whether β3 integrin loss in osteocytes affects bone mechanical properties, we conducted 3-point-bending (3 PB) test on isolated femurs for the overall bone strength and also utilized nano-indentation test to measure the tibial biomechanical properties on a submicroscopic scale (Fig. 2). As shown in the load–displacement curve of Fig. 2a, femurs from control mice were resistant to significantly higher bending forces than cKO femurs. On average, the maximum load was dropped by 8.3% (Fig. 2b, control femurs were 17.95 ± 1.83 N, cKO femurs were 16.46 ± 1.50 N); the maximum displacement was reduced by 11.5% (Fig. 2c, control femurs was 0.26 ± 0.03 mm compared to 0.23 ± 0.03 mm in cKO femurs); and the stiffness was decreased by 12.7% (Fig. 2d, control femurs was 135.94 ± 14.11 N/mm compared to 118.72 ± 21.88 N/mm in cKO femurs) after β3 integrin deletion in osteocytes. Moreover, from nano-scale, we also detected significant reductions in biomechanical properties in cKO tibiae. As shown in Fig. 2e–g, there was a slightly reduction of Young's modulus in cKO tibiae (8.20 vs 9.22 GPa) but a dramatic 70% reduction of Hardness in cKO tibiae (0.15 ± 0.02 GPa) compared to that in control tibiae (0.50 ± 0.06 GPa). These results suggest that β3 integrin in osteocytes is important for both bone mass and property maintenance.
Fig. 2.

β3 integrin loss in osteocytes impairs mechanical properties of long bones in mice. (a) Representative load–displacement curve of three-point-bending (3 PB) test from 4-month-old male control and cKO femurs. (b–d) Quantitative analyses of maximum load force, maximum displacement and stiffness in 3 PB. n = 13 for Control group; n = 16 for cKO group. (e) Representative load–displacement curve of nano-indentation test from 4-month-old male control and cKO tibiae. (f–g) Quantitative analyses of Young's modulus and Hardness in nano-indentation test. n = 5 for each group. (h–j) Sirius red/fast green collagen staining and semi-quantitative measurement of the collagen content on the sagittal tibia sections from 6-month-old male control and cKO mice. n = 4 for each group. (k–l) Two-photon microscopy images of cortical and trabecular collagen fibers from 6-month-old male control and cKO tibial sections. (m) Quantitative analyses of cortical (Ct.) and trabecular (Tb.) collagen fiber intensity for control and cKO mice. n = 5 for each group. Results are expressed as mean ± standard deviation (s.d.). n. s. P > 0.05; ∗p < 0.05; ∗∗p < 0.01. (For interpretation of the references to colour in this figure legend, the reader is referred to the Web version of this article.)
The biomechanical properties of bone are largely determined by bone matrix [30], which is composed of both inorganic mineral matrix and organic protein matrix. The bone strength is derived from a compression-resistant mineral phase and a tension-resistant network of collagen fibers [31]. Our μCT data indicated that the mineral components were largely reduced in cKO mice (Fig. 1), We further determined whether the collagen matrix was altered in cKO mice. We utilized the Sirius red/fast green dye staining approach to visualize the collagen I fibers in the tibiae sections from control and cKO mice. As displayed in Fig. 2h, the collagen I fibers on the cortical tibia sections in cKO seemed less organized compared to fibers from control bone sections. However, the collagen I fibers on the trabecular bones (Fig. 2i) were similar between control and cKO bones. We further semi-quantitatively measured the collagen content on the sagittal tibial sections by extracting the dyes out from the stained bone sections and detecting the absorption of sirius red dye at 540 nm. The dye staining results showed that the amount of collagen fibers was not influenced by β3 integrin deletion in cKO mice (Fig. 2j). To confirmed the collagen fiber orientation defects in cKO bone sections, we also applied second-harmonic-generation (SHG) microscopy with two-photon excited fluorescence imaging to visualize fibrillar collagen I on bone sections [16]. From the fluorescent signals, we observed disoriented collagen fibers in cKO cortical bone sections (Fig. 2k). Moreover, the organization of collagen fibers in trabecular bone was indistinguishable between control and cKO bone sections (Fig. 2l). Quantitatively, the average intensity of fluorescent signals that represents collagen content on each bone sections was comparable between control and cKO mice in both cortical and trabecular bones (Fig. 2m), which was consistent with previous dye staining results (Fig. 2j). Collectively, loss of β3 integrin in osteocytes reduces the maximum load, stiffness and hardness in long bones. These biomechanical properties alternations in cKO mice may result from disorganization of collagen fibers on the cortical bones.
3.3. β3 integrin loss impairs bone formation without affecting bone resorption
In bone tissue, a critical balance between the osteoblast-mediated bone formation and osteoclast-induced bone absorption is the key for adult animals to keep consistent bone mass, which is also largely regulated by osteocytes [32]. To investigate whether this balance is compromised by loss of β3 integrin in osteocytes, we determined the cellular activities of both osteoclasts and osteoblasts in control and cKO mice. First, we measured the serum level of collagen type I cross-linked C-telopeptide (CTX-1), an in vivo indicator for the osteoclast-mediated bone-resorbing activity. Results showed that there was no significant difference of serum CTX-1 between the two genotypes (Fig. 3a). We further performed tartrate-resistant acid phosphatase (TRAP) staining on tibial sections from the two genotypes (Fig. 3b–d). We found that the osteoclast surface/bone surface and osteoclast number were comparable between control and cKO mice. These results suggest that loss of β3 integrin in osteocytes has little or no effects on osteoclast formation and function in bone.
Fig. 3.

β3 integrin loss influences bone formation in vivo and in vitro. (a) Serum CTX-1 level detection by ELISA in control and cKO mice. n = 3 for each group. (b) TRAP staining in control and cKO tibial sections. (c–d) Quantitative measurement of osteoclast surface and osteoclast number from TRAP staining results. n = 5 for each group. (e) Serum P1NP level detection by ELISA in control and cKO mice. n = 3 for each group. (f) Representative in vivo double calcein labeling images for bone formation detection in the trabecular bone of tibia sections of male control and cKO mice. (g–i) Quantitative analyses of the MAR, MS/BS and BFR for double calcein labeling results. n = 4 for each group. (j–k) Alkaline phosphatase (Alp) activity detection from in vitro BMSC osteogenic differentiation experiments. (l) The transcriptions of osterix/Osx, Alp, Runx2, Collα1, Bsp and osteocalcin/Ocn were detected through quantitative PCR analysis after BMSC osteogenic differentiation. (m–n) Oil red O staining results and quantification of in vitro BMSC adipogenic differentiation. (o) The transcriptions of Cebpα, Cebpβ, Adipo, Ap2, Pparγ2, and Pref-1 were detected through quantitative PCR analysis after BMSC adipogenic differentiation. Results were collected from three biological replicates (n = 3) for each group. Results are expressed as mean ± standard deviation (s.d.). n. s. P > 0.05; ∗p < 0.05; ∗∗p < 0.01; ∗∗∗p < 0.001. (For interpretation of the references to colour in this figure legend, the reader is referred to the Web version of this article.)
We further determined the osteoblast-mediated bone formation in control and cKO mice. We measured the level of serum procollagen type 1 N-terminal propeptide (P1NP), a serum indicator of in vivo osteoblast function and bone formation, and detected a clear reduction of P1NP in the serum of cKO mice compared to that in control littermates (Fig. 3e). Furthermore, in vivo double calcein labeling results showed significant decreases in the mineral apposition rate (MAR), mineralizing surface per bone surface (MS/BS) and bone formation rate (BFR) of the metaphyseal trabecular bones in 4-month-old male cKO mice compared to those in their control littermates (Fig. 2f–i).
Because the osteoblasts can be derived from the bone marrow stromal cells (BMSCs) under sequential osteogenic differentiation, we wondered whether the bone formation rate reduction in cKO mice results from compromised differentiation of BMSCs. We collected the BMSCs from the bone marrow of 5-month-old control and cKO mice, amplified them in vitro and conducted osteogenic and adipogenic differentiation with these cells. For osteogenic differentiation, we cultured BMSCs from both genotypes with osteogenic medium for 7 days and detected a significant reduction of alkaline phosphatase (Alp) activity in cKO BMSC cultures relative to that in control BMSC cultures (Fig. 3j and k). Moreover, the expression of osteoblast specific markers encoding collagen type I alpha 1 chain (Collα1) and Alp was significantly reduced in cKO versus control BMSC cultures (Fig. 3l). Furthermore, we conducted ALP IHC staining with tibiae bone samples from both control and cKO mice (Supplementary Fig. 3), which showed a significant reduction of ALP-positive osteoblasts in the trabecular bones of cKO mice compared to that of control mice.
In the meantime, we also initiated BMSC adipogenesis by adding adipogenic differentiation medium for 14 days, followed by Oil red O staining. Results showed that the number and maturation of oil droplets were comparable between control and cKO BMSC cultures (Fig. 2m-n). qPCR analyses showed that the expression levels of adipogenic differentiation genes were altered with some genes being up-regulated, such as genes encoding CCAAT/enhancer-binding protein alpha (Cebpα) and adiponectin (Adipo), but some genes being down-regulated, such as genes encoding peroxisome proliferator-activated receptor gamma (Pparγ2), adipocyte protein 2 (Ap2) and preadipocyte factor-1 (Pref-1) (Fig. 3o).
Together, these results suggest that β3 integrin loss impairs the osteoblast bone formation process in vivo which could be partially due to compromised BMSC osteoblastic differentiation ability in cKO mice.
3.4. β3 integrin deletion compromises FA signaling pathway and F-actin cytoskeleton morphology in osteocytes
Since β3 integrin is one major FA component that is largely involved in osteocyte cell-ECM connections, we next determined whether loss of β3 integrin influences osteocyte autonomous functions in vivo. By extracting proteins from osteocyte-enriched femur and tibia cortical bone samples, we examined the major proteins in FA signaling pathway with WB analysis. As shown in Fig. 4a, β3 integrin loss significantly reduced the phosphorylated focal adhesion kinase (p-FAK) and phosphorylated Talin1 (p-Talin), while it elevated the total protein expressions of FAK and Talin1 in vivo. Moreover, the β3 integrin loss caused a dramatic decrease of Pinch2 expression while the protein level of Pinch1 was not affected. Furthermore, the expression levels of other FA-associated proteins, such as Kindlin-2 and Vinculin, were not markedly altered by β3 integrin loss. In addition, Piezo1 and connexin-43 (Cx43), two other important osteocyte mechanosensors were similarly expressed in both control and cKO osteocytes.
Fig. 4.

β3 integrin deletion in osteocytes leads to altered FA signaling pathway and abnormal cell morphology. (a) Western blotting analyses of FA signaling pathway proteins in cortical bone samples from control and cKO mice. Gapdh was used as a loading control. n = 3 for each group. (b) Representative H&E staining images of tibiae bone sections of control and cKO mice. (c) Representative images from F-actin cytoskeleton staining of control and cKO radius bones. (d) Representative images from LCS staining of control and cKO femurs. (e–i) Quantitative analyses of osteocyte numbers, nuclear size, dendritic number per cell, the longest dendritic length in each cell and the lacunar size between control and cKO bone samples. n = 5 for each group. Results are expressed as mean ± standard deviation (s.d.). n. s. P > 0.05; ∗p < 0.05; ∗∗p < 0.01; ∗∗∗p < 0.001.
To examine the autonomous functions of β3 integrin in osteocytes, we detected the osteocyte cell number, osteocyte cell morphology and LCS by hematoxylin and eosin (H&E) staining (Fig. 4b), Rhodamine-Phalloidin staining (Fig. 4c) and FITC staining (Fig. 4d). Results showed that the average numbers of osteocytes on the cortical bone sections were comparable in control and cKO tibiae (Fig. 4e), with a small reduction of nuclear size in cKO osteocytes (Fig. 4f). However, the dendritic processes number per osteocyte (Fig. 4g) and the longest dendritic process in each cell (Fig. 4h) were predominantly reduced in both femur and radius bone sections from cKO mice. At the single cell level, we observed that the distribution and connectivity of osteocyte dendrites were changed in cKO osteocytes (Fig. 4c). Because the osteocyte dendritic formation is tightly associated with Dmp1, Sclerostin and other osteocyte-specific cell markers [33], we also detected their expression levels from the cortical bone samples through WB experiments (Supplementary Fig. 4). Results showed that the expression of Dmp1 was largely reduced in β3 integrin-deleted osteocytes, while the expression levels of Sclerostin and parathyroid hormone receptor-1 (PTH1r), which were both highly expressed in osteocytes, were comparable between control and cKO osteocytes. Interestingly, we found no significant differences in the canaliculi connections (Fig. 4d) the lacunar size (Fig. 4i) between control and cKO osteocytes.
Together, these results suggest that β3 integrin loss compromises the FA pathways and influences the dendritic process formation without affecting the surrounding LCS in osteocytes.
3.5. β3 integrin loss reduces cell spreading and attachment with decreased FA formation in MLO-Y4 osteocyte-like cells
To further confirm the FA signaling pathway and morphology changes were resulted from β3 integrin loss in osteocytes, we studied the loss-of-function of β3 integrin in mouse osteocyte-like cell line MLO-Y4 cells in vitro. We designed a si-RNA sequence that specifically targeted β3 integrin and tested its efficiency with WB analysis (Fig. 5a). After transfected with si-β3 integrin sequences for 48 h, we detected a rough 40% reduction of β3 integrin expression without affecting β1 integrin in MLO-Y4 cells. Consistent with in vivo results (Fig. 5a), we observed fair reductions in p-FAK and p-Talin1 in these cells while the total proteins of FAK and Talin1 were not impacted (Fig. 5a).
Fig. 5.

β3 integrin knockdown reduces cell spreading and attachment ability with decreased FA formation in MLO-Y4 cells. (a) Western blotting analyses of FA signaling pathway proteins in β3 integrin siRNA treatment. Si-NC as negative control; si-Gapdh as positive control; si-β3 was the transient knockdown of β3 integrin in MLO-Y4 cells for 48 h. Tubulin was used as a loading control. n = 3 for each group. Snapshots and quantification of si-NC and si-β3 MLO-Y4 cells attached on non-coated culture flask (b,e), collagen-1 (Col1) coated surfaces (c,f), and fibronectin (FN) coated surfaces (d,g) for 30 min, 1 h, 3 h and 6 h. n = 3 for each group. (h, i) Cell spreading area measurement and quantification on FN-coated surfaces for 30 min, 3 h and 6 h. n = 3 for each group. (j) Quantification of FA size in 2D at 24 h after cell seeding on FN-coated surfaces. (k) SEM images of si-NC and si-β3 MLO-Y4 cells attached on FN-coated surfaces for 24 h. (l) Representative IF images of si-NC and si-β3 MLO-Y4 cells with anti-p-FAK and anti-Talin1 antibodies. Results are expressed as mean ± standard deviation (s.d.). n. s. P > 0.05; ∗p < 0.05; ∗∗p < 0.01; ∗∗∗p < 0.001.
We further determined the attachment ability of MLO-Y4 cells with and without β3 integrin knockdown. We conducted si-RNA experiments, reseeded these cells 24 h after transfection, and monitored their attachment ability on different coated surfaces. Since the external ECM ligands for integrin binding and activation differ between different subtypes, we used collagen 1 (Col1) and fibronectin (FN) pre-coated substrates to activate β1 and β3 integrins, respectively. As presented in Fig. 5b, e, there were no differences regarding the attachment of cells on non-coated culture flask between si-NC and si-β3 cells. However, when these cells were seeded on Col1-coated or FN-coated flask surfaces, si-β3 MLO-Y4 cells displayed clear attachment delay on these surfaces compared to si-NC cells on these surfaces (Fig. 5c–g). These data suggest a compromised attachment from defective integrin activation in si-β3 cells.
Because FN is the primary ligand binding to β3 integrin [34], we further analyzed the cell spreading and FA activation on FN surfaces. As shown in Fig. 5h, the spreading area for single cell was smaller for si-β3 cells than that of si-NC cells. Quantitative analysis confirmed that from 30 min to 6 h, the 2D spreading area of single MLO-Y4 cell was significantly reduced after siRNA treatment (Fig. 5i). We also utilized scanning electron microscopy (SEM) to visualize the detailed spreading morphology of MLO-Y4 cells. As shown in Fig. 5k, we detected a significant smaller spreading area of si-β3 cells than that of the si–NC–treated cells on FN-coated surface. This observation was confirmed by immuno-fluorescence staining with anti-p-FAK and anti-Talin1 antibodies (Fig. 5l). From IF images, we observed that the p-FAK accumulated FA sites (yellow arrows in Fig. 5l) and Talin-enriched cell spreading fronts (white arrows in Fig. 5l) were significantly larger in si-NC cells than those in si-β3 cells. We quantified the p-FAK-stained FA area and detected a clear decrease of FA size when β3 integrin was knocked down in MLO-Y4 cells (Fig. 5j). Collectively, these results demonstrate that β3 integrin is essential for FA formation, cell spreading and attachment in osteocytes.
3.6. β3 integrin deletion compromises anabolic bone formation upon mechanical stimulation in vivo
Published data suggest an essential function of β3 integrin in fluid shear stress-induced mechanotransduction in cultured osteocytes [25]. We further determined the in vivo function of β3 integrin in osteocyte mechanotransduction by tibia loading experiments. To this end, we challenged the tibiae of 5-month-old control and cKO mice with 9 N clinic mechanical loading for two weeks, and monitored both the cortical and trabecular bone mass of loaded tibia at day 1 (D1, before mechanical loading) and day 14 (D14, after mechanical loading) with in vivo μCT scanning (Fig. 6a). Upon mechanical stimulation, the control mice maintained the BMD and BV/TV in trabecular bone with a clear increment in the cortical bone thickness (Fig. 6b, d, f). However, the trabecular bone mass was significantly reduced both in BMD and BV/TV in cKO mice after mechanical treatment (Fig. 6b, d). To achieve a better bone mass comparison between before and after mechanical loading, we analyzed the percentage of bone mass change after load by subtracting the bone mass detected on day 1 from that on day 14. We found that for control mice the trabecular bone mass after load were kept similar to the condition before loading experiments, whereas the cKO mice experienced a 20–30% drop of the trabecular BMD and BV/TV after mechanical loading (Fig. 6c, e). Moreover, for the cortical bone thickness, control mice displayed an average of 4.3% increase after 14 days’ mechanical loading. However, cKO mice experienced an average of 5.4% reduction after loading (Fig. 6g). Together, these results suggest compromised bone responses to mechanical loading in β3 integrin-deficient mice.
Fig. 6.

β3 integrin deletion in osteocytes compromises anabolic bone formation upon mechanical stimulation in mice. (a) Representative 3D μCT images of cortical (Ct.) and trabecular (Tb.) bones of right tibiae of control and cKO mice at day 1 (D1) before loading and day 14 (D14) after loading treatments. (b–c) Quantitative results and percentage change (%) of trabecular BMD after loading in control and cKO mice. (d–e) Quantitative results and percentage change (%) of trabecular BV/TV after loading in control and cKO mice. (f–g) Quantitative results and percentage change (%) of cortical thickness after loading in control and cKO mice. n = 6 for control group; n = 7 for cKO group. Results are expressed as mean ± standard deviation (s.d.). n. s. P > 0.05; ∗p < 0.05; ∗∗p < 0.01.
4. Discussion
In this study, we demonstrate, for the first time, the significant in vivo functions of osteocyte β3 integrin in regulating bone mass accrual and force-induced bone formation in mice. β3 integrin loss in osteocytes results in dramatic bone loss in long bones in adult mice, including femurs, tibiae and ulnae, which is accompanied with compromised biomechanical properties in these bones. These results are similar to what we observed in mice with osteocyte-specific deletion of FA-associated proteins, such as Kindlin-2 [8], Pinch1/2 [10], and β1 integrin [16]. However, the emerging time-points for osteopenia phenotype largely differ among these FA-associated mutant mice. Interestingly, the bone mass was comparable between control and β3 integrin cKO mice at young age (2-month), and differences started to emerge from adult age (6-month) (Fig. 1d–h). However, mice with Kindlin-2 deletion in osteocytes by the same 10-kb Dmp1-Cre promoter displayed a remarkable osteopenia as early as age of 43 days after birth [7]. Mice with Pinch1/2 loss in osteocytes had a marked osteopenia in femurs at 3-months of age [10], while mice lacking β1 integrin in osteocytes exhibited significant bone loss in femurs, tibiae and spines at 4-month of age [16]. These results may suggest an age-dependent expression and function of FA proteins in osteocytes, and that β3 integrin may participate at a later stage in the long bones of adult mice for their specific osteocyte regulations.
In the present study, we demonstrate both cell-autonomous and non-cell-autonomous roles of β3 integrin in osteocytes. When compared these roles of β3 integrin with β1 integrin in osteocytes, there are some differences. For the intrinsic cell-autonomous functions, results from this study demonstrate that deletion of β3 integrin leads to reduced cell dendrites in numbers and lengths without affecting the number of osteocytes in bone sections. These results are similar to those caused by β1 integrin loss in osteocytes [16]. However, when osteocytes loss β1 integrin, cells tend to be mis-oriented and have abnormal LCS size and roundness in cortical bones [16], whereas loss of β3 integrin does not seem to influence the orientation of LCS and osteocytes, nor the shape of LCS. For the non-cell-autonomous functions, deletion of β1 [16] and β3 integrins (in this study) in osteocytes cause subtle effect in osteoclast activities but significantly impairs osteoblast functions. Moreover, β1 integrin loss in osteocytes largely influences the BMSC differentiation by inhibiting its osteogenic differentiation but enhancing its adipogenic differentiation [16]. However, qPCR analysis reveals that loss of β3 integrin in osteocytes compromises the BMSC differentiation ability but not as significantly as that by β1 integrin deletion (Fig. 3j-o). In addition, both β1 and β3 integrins seem not to be involved in regulating the amount of collagen I in bone ECM, but loss of β1 integrin in osteocytes [16] causes more server collagen I fiber dis-orientation than that caused by loss of β3 integrin (Fig. 2h-m). These data together demonstrate the differential regulations and functions of these two important beta subunits of integrin, β1 and β3, in osteocytes, which may due to the different subcellular accumulations and/or the different expression time-window of these two subunits in osteocytes. More detailed examinations between the difference of these two subunits are needed in future studies.
Importantly, we demonstrate the indispensable in vivo role of β3 integrin in mediating osteocyte mechanotransduction. Our tibial loading experiments show that β3 integrin deletion in osteocytes impairs the anabolic response of long bone to external forces, resulting in significant bone loss after loading (Fig. 6). Interestingly, previously when we loaded the right tibia of β1 integrin deficient mice, the cortical thickness of mutant mice was slightly dropped compared with their control littermates [16]. However, in the present study, significant reductions in the cortical thickness and trabecular BMD and BV/TV are observed in β3 integrin cKO mice (Fig. 6 b-g). The more severer bone mass loss upon mechanical loading in β3 integrin cKO mice than in β1 integrin cKO mice may suggest that β3 integrin makes a larger contribution to bone mechanotransduction than β1 integrin does in osteocytes, which is consistent with results from previous in vitro cell experiments [23,24].
We further demonstrate compromised FA signaling pathways caused by loss of β3 integrin both in vivo and in vitro. Specifically, even though the total amount of FAK and Talin1 expression is unchanged or even up-regulated, the p-FAK and p-Talin1 are largely reduced under β3 deleted conditions both in vivo and in vitro. Furthermore, β3 integrin loss in osteocytes also influences the osteocyte cell FA formation, attachment and spreading in vitro. Because phosphorylation signaling of FAK and Talin1 is essential for the assembly of FAs, transmission of integrin signals and the stabilization of integrin-cytoskeletal linkages [35,36], these data suggest that altered FA signaling pathways resulted from β3 deletion in osteocytes could be the major mechanism responsible for osteocyte morphological changes and mechanotransduction defects in bone.
The limitation of this study was that the Dmp1-Cre used in current study was reported with some expression outside of osteocytes, such as osteoblasts on the bone surface, skeletal muscle fibers and some gastrointestinal mesenchymal cells [37]. Even though we have confirmed the deletion of β3 integrin expression in osteocytes in this study and a comparable β3 integrin expression level in skeletal muscles between control and cKO mice (Supplementary Fig. 1b), we cannot rule out the potential contributions derived from Dmp1-Cre expression in other cell types or tissues outside of osteocytes.
In conclusion, our present study reveals the importance of osteocyte β3 integrin in the regulation of osteocyte morphology, FA signaling pathway, bone mass accrual and mechanotransduction in mice. Findings from this study bring new insights to the in vivo functions of β3 integrin in osteocytes and provide a potential therapeutic target for osteoporosis.
Author contributions
Study design: G.Z. Xiao, W.H. Yi and L. Qin. Study conduct: L. Qin, Z.C. Chen, D.Z. Yang, T.L. He and Z. Xu. Data collection: L. Qin, Z.C. Chen, D.Z. Yang, and P.J. Zhang. Data interpretation: L. Qin, W.H. Yi, D. Chen and G.Z. Xiao. Drafting the manuscript: L. Qin and G.Z. Xiao. L. Qin, W.H. Yi and G.Z. Xiao take the responsibility for the integrity of the data analysis.
Authorship
All persons who meet authorship criteria are listed as authors, and all authors certify that they have participated sufficiently in the work to take public responsibility for the content, including participation in the concept, design, analysis, writing, or revision of the manuscript. Each author certifies that this material or part thereof has not been published in another journal, that it is not currently submitted elsewhere, and that it will not be submitted elsewhere until a final decision regarding publication of the manuscript in Journal of Orthopaedic Translation has been made.
Indicate the specific contributions made by each author (list the authors’ initials followed by their surnames, e.g., Y.L. Cheung). The name of each author must appear at least once in each of the three categories below.
Article Processing Charge
The corresponding author agrees to pay the Journal of Orthopaedic Translation Article Processing Charge upon acceptance of the work for publication in Journal of Orthopaedic Translation, unless prior arrangements have been made to waive the Article Processing Charge.
Section I
The authors whose names are listed immediately below certify that they have NO affiliations with or involvement in any organization or entity with any financial interest (such as honoraria; educational grants; participation in speakers’ bureaus; membership, employment, consultancies, stock ownership, or other equity interest; and expert testimony or patent-licensing arrangements), or non-financial interest (such as personal or professional relationships, affiliations, knowledge or beliefs) in the subject matter or materials discussed in this manuscript.
Section II
The authors whose names are listed immediately below report the following details of affiliation or involvement
In an organization or entity with a financial or non-financial interest in the subject matter or materials
Discussed in this manuscript. Please specify the nature of the conflict on a separate sheet of paper if the space
Below is inadequate.
Author names and details of the conflict(s) of interest
This Authorship & Conflicts of Interest Statement is signed by all the authors listed in the manuscript to indicate agreement that the above information is true and correct (a photocopy of this form may be used if there are more than 10 authors).
Declaration of competing interest
A conflict of interest occurs when an individual's objectivity is potentially compromised by a desire for financial gain, prominence, professional advancement or a successful outcome. The Editors of the Journal of Orthopaedic Translation strive to ensure that what is published in the Journal is as balanced, objective and evidence-based as possible. Since it can be difficult to distinguish between an actual conflict of interest and a perceived conflict of interest, the Journal requires authors to disclose all and any potential conflicts of interest.
Acknowledgement
The authors acknowledge the assistance of the Animal Center of Southern University of Science and Technology (SUSTech), Core Research Facilities of SUSTech, and the Pico Center at SUSTech. This work was supported, in part, by the National Key Research and Development Program of China Grant (2019YFA0906004), the National Natural Science Foundation of China Grants (82230081, 82250710175, 82172375, 81991513, and 81870532), the Guangdong Provincial Science and Technology Innovation Council Grant (2017B030301018), the Shenzhen Municipal Science and Technology Innovation Council Grant (20200925150409001) and Internal Project Grants of Huazhong University of Science and Technology Union Shenzhen Hospital (NY2021036, NY2021037).
Footnotes
The translational potential of this article: This study reveals the active participation of osteocyte β3 integrin for the maintenance of bone mass accrual, biomechanical properties and bone mechanobiology and, thus, defines a potential therapeutic target for skeletal diseases, such as osteoporosis.
Supplementary data to this article can be found online at https://doi.org/10.1016/j.jot.2023.05.001.
Contributor Information
Weihong Yi, Email: szyiwh@163.com.
Guozhi Xiao, Email: xiaogz@sustech.edu.cn.
Appendix A. Supplementary data
The following are the Supplementary data to this article.
figs1.

figs2.

figs3.

figs4.

References
- 1.Bonewald L.F. The amazing osteocyte. J Bone Miner Res. 2011;26(2):229–238. doi: 10.1002/jbmr.320. [DOI] [PMC free article] [PubMed] [Google Scholar]
- 2.Robling A.G., Bonewald L.F. The osteocyte: new insights. Annu Rev Physiol. 2020;82(1):485–506. doi: 10.1146/annurev-physiol-021119-034332. [DOI] [PMC free article] [PubMed] [Google Scholar]
- 3.Dallas S.L., Prideaux M., Bonewald L.F. The osteocyte: an endocrine cell … and more. Endocr Rev. 2013;34(5):658–690. doi: 10.1210/er.2012-1026. [DOI] [PMC free article] [PubMed] [Google Scholar]
- 4.Qin L., Liu W., Cao H., Xiao G. Molecular mechanosensors in osteocytes. Bone Research. 2020;8(1):23. doi: 10.1038/s41413-020-0099-y. [DOI] [PMC free article] [PubMed] [Google Scholar]
- 5.Li M.C.M., Chow S.K.H., Wong R.M.Y., Qin L., Cheung W.H. The role of osteocytes-specific molecular mechanism in regulation of mechanotransduction – a systematic review. Journal of Orthopaedic Translation. 2021;29:1–9. doi: 10.1016/j.jot.2021.04.005. [DOI] [PMC free article] [PubMed] [Google Scholar]
- 6.Geiger B., Spatz J.P., Bershadsky A.D. Environmental sensing through focal adhesions. Nat Rev Mol Cell Biol. 2009;10(1):21–33. doi: 10.1038/nrm2593. [DOI] [PubMed] [Google Scholar]
- 7.Cao H., Yan Q., Wang D., Lai Y., Zhou B., Zhang Q., et al. Focal adhesion protein Kindlin-2 regulates bone homeostasis in mice. Bone Res. 2020;8:2. doi: 10.1038/s41413-019-0073-8. [DOI] [PMC free article] [PubMed] [Google Scholar]
- 8.Qin L., Fu X., Ma J., Lin M., Zhang P., Wang Y., et al. Kindlin-2 mediates mechanotransduction in bone by regulating expression of Sclerostin in osteocytes. Commun Biol. 2021;4(1):402. doi: 10.1038/s42003-021-01950-4. [DOI] [PMC free article] [PubMed] [Google Scholar]
- 9.Sato T., Verma S., Andrade C.D.C., Omeara M., Campbell N., Wang J.S., et al. A FAK/HDAC5 signaling axis controls osteocyte mechanotransduction. Nat Commun. 2020;11(1):3282. doi: 10.1038/s41467-020-17099-3. [DOI] [PMC free article] [PubMed] [Google Scholar]
- 10.Wang Y., Yan Q., Zhao Y., Liu X., Lin S., Zhang P., et al. Focal adhesion proteins Pinch1 and Pinch2 regulate bone homeostasis in mice. JCI Insight. 2019;4(22) doi: 10.1172/jci.insight.131692. [DOI] [PMC free article] [PubMed] [Google Scholar]
- 11.Kechagia J.Z., Ivaska J., Roca-Cusachs P. Integrins as biomechanical sensors of the microenvironment. Nat Rev Mol Cell Biol. 2019;20(8):457–473. doi: 10.1038/s41580-019-0134-2. [DOI] [PubMed] [Google Scholar]
- 12.Geoghegan I.P., Hoey D.A., McNamara L.M. Integrins in osteocyte biology and mechanotransduction. Curr Osteoporos Rep. 2019;17(4):195–206. doi: 10.1007/s11914-019-00520-2. [DOI] [PubMed] [Google Scholar]
- 13.Cabahug-Zuckerman P., Stout R.F., Jr., Majeska R.J., Thi M.M., Spray D.C., Weinbaum S., et al. Potential role for a specialized β3 integrin-based structure on osteocyte processes in bone mechanosensation. J Orthop Res. 2018;36(2):642–652. doi: 10.1002/jor.23792. [DOI] [PMC free article] [PubMed] [Google Scholar]
- 14.McNamara L.M., Majeska R.J., Weinbaum S., Friedrich V., Schaffler M.B. Attachment of osteocyte cell processes to the bone matrix. Anat Rec. 2009;292(3):355–363. doi: 10.1002/ar.20869. [DOI] [PMC free article] [PubMed] [Google Scholar]
- 15.Wang Y., McNamara L.M., Schaffler M.B., Weinbaum S. A model for the role of integrins in flow induced mechanotransduction in osteocytes. Proc Natl Acad Sci U S A. 2007;104(40):15941–15946. doi: 10.1073/pnas.0707246104. [DOI] [PMC free article] [PubMed] [Google Scholar]
- 16.Qin L., He T., Yang D., Wang Y., Li Z., Yan Q., et al. Osteocyte β1 integrin loss causes low bone mass and impairs bone mechanotransduction in mice. Journal of Orthopaedic Translation. 2022;34:60–72. doi: 10.1016/j.jot.2022.03.008. [DOI] [PMC free article] [PubMed] [Google Scholar]
- 17.Shekaran A., Shoemaker J.T., Kavanaugh T.E., Lin A.S., LaPlaca M.C., Fan Y., et al. The effect of conditional inactivation of beta 1 integrins using twist 2 Cre, Osterix Cre and osteocalcin Cre lines on skeletal phenotype. Bone. 2014;68:131–141. doi: 10.1016/j.bone.2014.08.008. [DOI] [PMC free article] [PubMed] [Google Scholar]
- 18.Hu D., Lu C., Sapozhnikova A., Barnett M., Sparrey C., Miclau T., et al. Absence of beta3 integrin accelerates early skeletal repair. J Orthop Res. 2010;28(1):32–37. doi: 10.1002/jor.20955. [DOI] [PMC free article] [PubMed] [Google Scholar]
- 19.McHugh K.P., Hodivala-Dilke K., Zheng M.H., Namba N., Lam J., Novack D., et al. Mice lacking beta3 integrins are osteosclerotic because of dysfunctional osteoclasts. J Clin Invest. 2000;105(4):433–440. doi: 10.1172/JCI8905. [DOI] [PMC free article] [PubMed] [Google Scholar]
- 20.Bakewell S.J., Nestor P., Prasad S., Tomasson M.H., Dowland N., Mehrotra M., et al. Platelet and osteoclast beta3 integrins are critical for bone metastasis. Proc Natl Acad Sci U S A. 2003;100(24):14205–14210. doi: 10.1073/pnas.2234372100. [DOI] [PMC free article] [PubMed] [Google Scholar]
- 21.Zhao H., Kitaura H., Sands M.S., Ross F.P., Teitelbaum S.L., Novack D.V. Critical role of β3 integrin in experimental postmenopausal osteoporosis. J Bone Miner Res. 2005;20(12):2116–2123. doi: 10.1359/JBMR.050724. [DOI] [PubMed] [Google Scholar]
- 22.Voisin M., McNamara L.M. Differential β3 and β1 integrin expression in bone marrow and cortical bone of estrogen deficient rats. Anat Rec. 2015;298(9):1548–1559. doi: 10.1002/ar.23173. [DOI] [PubMed] [Google Scholar]
- 23.Thi M.M., Suadicani S.O., Schaffler M.B., Weinbaum S., Spray D.C. Mechanosensory responses of osteocytes to physiological forces occur along processes and not cell body and require αVβ3 integrin. Proc Natl Acad Sci U S A. 2013;110(52):21012–21017. doi: 10.1073/pnas.1321210110. [DOI] [PMC free article] [PubMed] [Google Scholar]
- 24.Wu D., Schaffler M.B., Weinbaum S., Spray D.C. Matrix-dependent adhesion mediates network responses to physiological stimulation of the osteocyte cell process. Proc Natl Acad Sci U S A. 2013;110(29):12096–12101. doi: 10.1073/pnas.1310003110. [DOI] [PMC free article] [PubMed] [Google Scholar]
- 25.Haugh M.G., Vaughan T.J., McNamara L.M. The role of integrin α(V)β(3) in osteocyte mechanotransduction. J Mech Behav Biomed Mater. 2015;42:67–75. doi: 10.1016/j.jmbbm.2014.11.001. [DOI] [PubMed] [Google Scholar]
- 26.Lu Y., Xie Y., Zhang S., Dusevich V., Bonewald L.F., Feng J.Q. DMP1-targeted Cre expression in odontoblasts and osteocytes. J Dent Res. 2007;86(4):320–325. doi: 10.1177/154405910708600404. [DOI] [PubMed] [Google Scholar]
- 27.Wu X., Qu M., Gong W., Zhou C., Lai Y., Xiao G. Kindlin-2 deletion in osteoprogenitors causes severe chondrodysplasia and low-turnover osteopenia in mice. J Orthop Translat. 2022;32:41–48. doi: 10.1016/j.jot.2021.08.005. [DOI] [PMC free article] [PubMed] [Google Scholar]
- 28.Yan Q., Gao H., Yao Q., Ling K., Xiao G. Loss of phosphatidylinositol-4-phosphate 5-kinase type-1 gamma (Pip5k1c) in mesenchymal stem cells leads to osteopenia by impairing bone remodeling. J Biol Chem. 2022;298(3) doi: 10.1016/j.jbc.2022.101639. [DOI] [PMC free article] [PubMed] [Google Scholar]
- 29.Fu X., Zhou B., Yan Q., Tao C., Qin L., Wu X., et al. Kindlin-2 regulates skeletal homeostasis by modulating PTH1R in mice. Signal Transduct Targeted Ther. 2020;5(1):297. doi: 10.1038/s41392-020-00328-y. [DOI] [PMC free article] [PubMed] [Google Scholar]
- 30.Ma C., Du T., Niu X., Fan Y. Biomechanics and mechanobiology of the bone matrix. Bone Res. 2022;10(1):59. doi: 10.1038/s41413-022-00223-y. [DOI] [PMC free article] [PubMed] [Google Scholar]
- 31.Bakbak S., Kayacan R., Akkuş O. Effect of collagen fiber orientation on mechanical properties of cortical bone. J Biomech. 2011;44:11. [Google Scholar]
- 32.Tresguerres F.G.F., Torres J., López-Quiles J., Hernández G., Vega J.A., Tresguerres I.F. The osteocyte: a multifunctional cell within the bone. Ann Anat. 2020;227 doi: 10.1016/j.aanat.2019.151422. [DOI] [PubMed] [Google Scholar]
- 33.Choy M.-H.V., Wong R.M.-Y., Li M.-C., Wang B.Y., Liu X.D., Lee W., et al. Can we enhance osteoporotic metaphyseal fracture healing through enhancing ultrastructural and functional changes of osteocytes in cortical bone with low-magnitude high-frequency vibration? Faseb J. 2020;34(3):4234–4252. doi: 10.1096/fj.201901595R. [DOI] [PubMed] [Google Scholar]
- 34.Bowditch R.D., Hariharan M., Tominna E.F., Smith J.W., Yamada K.M., Getzoff E.D., et al. Identification of a novel integrin binding site in fibronectin. Differential utilization by beta 3 integrins. J Biol Chem. 1994;269(14):10856–10863. [PubMed] [Google Scholar]
- 35.Bachmann M., Skripka A., Weißenbruch K., Wehrle-Haller B., Bastmeyer M. Phosphorylated paxillin and phosphorylated FAK constitute subregions within focal adhesions. J Cell Sci. 2022;135(7) doi: 10.1242/jcs.258764. [DOI] [PubMed] [Google Scholar]
- 36.Kumar S., Stainer A., Dubrulle J., Simpkins C., Cooper J.A. Focal adhesion assembly requires phosphorylation signaling. bioRxiv. 2022:2022. doi: 10.7554/eLife.90234. 12.19.521109. [DOI] [PMC free article] [PubMed] [Google Scholar]
- 37.Lim J., Burclaff J., He G., Mills J.C., Long F. Unintended targeting of Dmp1-Cre reveals a critical role for Bmpr1a signaling in the gastrointestinal mesenchyme of adult mice. Bone Research. 2017;5(1) doi: 10.1038/boneres.2016.49. [DOI] [PMC free article] [PubMed] [Google Scholar]