

Abstract

To improve the charge-carrier transport capabilities of thin-film organic materials, the intermolecular electronic couplings in the material should be maximized. Decreasing intermolecular distance while maintaining proper orbital overlap in highly conjugated aromatic molecules has so far been a successful way to increase electronic coupling. We attempted to decrease the intermolecular distance in this study by synthesizing cocrystals of simple benzoic acid coformers and dipyridyl-2,2′-bithiophene molecules to understand how the coformer identity and pyridine N atom placement affected solid-state properties. We found that with the 5-(3-pyridyl)-5′-(4-pyridyl)-isomer, the 4-pyridyl ring interacted with electrophiles and protons more strongly. Synthesized cocrystal powders were found to have reduced average crystallite size in reference to the parent compounds. The opposite was found for the intermolecular electronic couplings, as determined via density functional theory (DFT) calculations, which were relatively large in some of the cocrystals.
Introduction
Interest in organic semiconductors has increased in recent decades due in part to their easily tunable optoelectronic properties (like optical gap and absorption coefficient),1−3 potential for inexpensive production,4 and solution processability.5 Both polymeric and molecular-based materials have been used in a variety of applications, such as organic light-emitting diodes (OLEDs),6 photovoltaics,1 organic field-effect transistors (OFETs),7 and radiation detectors.8−10 In each of these applications, charge-carrier transport is a critical feature for the success, or failure, of the organic semiconductor.1−3 A simple descriptor that implies the potential capability of an organic semiconductor to effectively transport charge carriers is the intermolecular electronic coupling among constituent molecular building blocks.11 Focusing on highly crystalline molecular packing arrangements, developing molecular structures and processing protocols that result in molecules with large degrees of both cofacial overlap of planar π-conjugated backbones and overlap of the neighboring molecule’s π molecular orbitals has been a driving force behind the discovery of several important classes of molecular semiconductors.12−14 Predicting precisely which molecular substitution patterns will crystallize in specific patterns (e.g., brickwork, slip-stack, or herringbone) is difficult and may be complicated by complex phase behavior and/or crystal polymorphism.15 One way to tune packing arrangements is to add substituents to the molecule that can participate in predictable and strong intermolecular interactions, such as hydrogen bonding in addition to π–π stacking.16−18
Recently, we published a study in which a cocrystallization approach was used to modify the packing arrangements of 5,5′-di-3,3′- or 4,4′-dipyridyl-2,2′-bithiophene in the crystalline state. By adding a carboxylic acid coformer to form a cocrystal, we observed substantial modifications in crystal packing.19 The coformer imparted large changes to how the bithiophene parent molecule participated in π-stacking arrangements with other parent molecules, but substituents on the coformer molecule, such as trifluoromethyl, exerted influence by arranging to maximize intermolecular interactions with other coformers, such as with fluorine–fluorine interactions. This indicated that because solid-state interactions between bithiophene units were impacted, we may be able to exert control over material optoelectronic properties via simple coformers in a cocrystallization approach. Here, we extend that study to a 5-(3-pyridyl)-5′-(4-pyridyl)-2,2′-bithiophene, determine patterns in cocrystal formation when two different pyridyl subunits are included using experimental and computational methods, and investigate the influence of cocrystal formation on thin-film structure.
Results and Discussion
To synthesize the 2,2′-bithiophene molecule with one 3-pyridyl and one 4-pyridyl substituent, we first doubly brominated the bithiophene core at the 2 positions and then performed a Suzuki coupling to install the pyridine rings. First, the 3-pyridyl ring was installed to form 4 and then the 4-pyridyl ring was installed to form molecule 5 (Scheme 1). Once molecule 5 was synthesized, solvent-assisted grinding experiments with several substituted benzoic acid coformers were performed. After grinding and drying, the powders were analyzed using several methods, namely, NMR spectroscopy, IR spectroscopy, thermal gravimetry, differential scanning calorimetry, and X-ray diffraction, to better understand how the coformers affected the solid-state structure.
Scheme 1. Synthesis of Dipyridyl Bithiophene Molecules 2 and 3 as Previously Reported,195, and the Synthesis of Cocrystal Materials 5a–e.

We dissolved the cocrystal samples, measured 1H NMR spectra of each, and compared them to pure samples of both components of the mixture.20 Persistent intermolecular interactions in the solution state can be assigned upon the observance of chemical shift changes in proton resonances upon mixing, so we focused on the protons closest to the pyridine N and the carboxylic acid functional groups. As we observed for 5,5′-di-3,3′-dipyridyl-2,2′-bithiophene, 2, and 5,5′-di-4,4′-dipyridyl-2,2′-bithiophene, 3,19 the shifts in 1H resonances observed (see Supporting Information) indicated the presence of intermolecular interactions between 5 and coformer molecules. In previous studies on 2 and coformers with 2, signal broadening was observed for the most downfield iminic proton, whereas with 3 and coformers with 3, downfield shifting was typically observed in the most downfield proton signal instead of broadening.19 While we expected to observe either pronounced broadening or shifting of one set of pyridine protons in cocrystals of 5, instead, we saw downfield shifting of both sets of pyridine protons with some peak broadening.
We sought to crystallize 5 and cocrystals 5a–5e. During our studies, only 5e crystallized in a structure that could be solved explicitly. Although a few crystals of 5 were grown, the quality was insufficient to yield good diffraction data. The problem is likely related to the whole-molecule disorder. A ∼180° rotation of the 3-pyridyl ring would scramble its nitrogen over two positions. Similarly, a ∼180° rotation of the molecule about the central bond between thiophene rings or about the molecular long axis would scramble the 4-pyridyl/3-pyridyl rings and flip the thiophenes (a common problem). In combination, the net result would be at least a fourfold disorder. We grew X-ray-quality single crystals and observed that the 4-pyridyl subunit only formed hydrogen bonds in the crystal structure we solved (Figure 1). Instead of an expected structure with hydrogen bonds involving both the 3- and 4-pyridyl rings due to the 2 equiv of acid present in the mother liquor, in the structure that crystallized only the N atom of the 4-pyridyl ring participates in hydrogen bonding with the benzoic acid derivative, while the 3-pyridyl ring is in a π-stacking arrangement with neighboring molecules of benzoic acid and 5.
Figure 1.
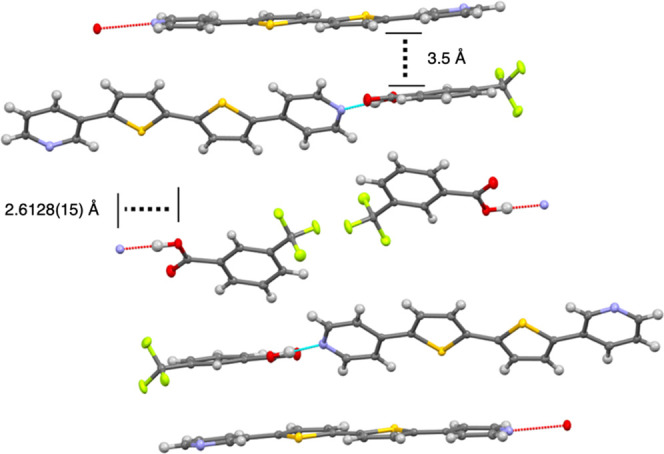
Crystallographically determined X-ray structure of 5e.
The hydrogen-bond distance present in 5e (2.6128(15) Å) was similar to hydrogen-bond distances we observed for cocrystals with 3 in a previous study (∼2.60 Å) and indicated that the 4-pyridyl N atom hydrogen bond is stronger than was observed in our past study for cocrystals with 2 (>2.66 Å).19 While the 4-pyridyl subunit participates in hydrogen bonding, the 3-pyridyl subunit participates in a π–π stacking interaction, as indicated by its 3.5 Å distance between ring planes.21 Since we observed downfield shifts in the solution-phase 1H NMR spectrum, hydrogen bonding from only the 4-pyridyl subunit in the crystalline phase, and that the hydrogen bond distance is less for cocrystals of 3 than 2, we hypothesized that in solution, hydrogen bonding with the 4-pyridyl subunit was favored over the 3-pyridyl subunit cocrystal.
We set out to selectively protonate one pyridine N atom using triflic acid and compare the 1H NMR spectrum to that of the cocrystal. Upon protonation of a pyridine-containing polyaromatic heterocycle, one would expect to see an overall downfield shift of pyridyl proton signals in conjugation with the pyridinium ring due to the enhanced electron-accepting power of the pyridinium cation.22 One would also expect that the protons on the pyridinium would experience a stronger downfield shift due to the proximity of the pyridinium N atom pulling electron density away from the rest of the ring’s π cloud.23 We dissolved 5 in d6-DMSO because of its low-ppm solvent resonance and enhanced solubility of 5 over other polar aprotic solvents and added either one or two molar equivalents of triflic acid to protonate one or two pyridine N atoms (Figure 2).
Figure 2.

Stacked 1H NMR spectra of 2, 3, and 5 in d6-DMSO with 0 (top, blue), 1 (middle, green), or 2 (bottom, red) molecular equivalents of triflic acid. Dotted lines to denote changes in chemical shifts are added to guide the eye.
After adding 1 equiv, each of the signals corresponding to the 3-pyridyl subunit shifted downfield by ∼0.1 ppm, while the signals corresponding to the 4-pyridyl subunit shifted downfield by ∼0.2 ppm for the iminic α proton and ∼0.5 ppm for the aryl protons. These trends were similar to those observed when 3 was treated with 1 equiv of triflic acid, which caused a shift of ∼0.2 ppm for the iminic α proton and a larger shift for the pyridine aryl proton. For protonation of 2, the shift in the iminic α proton signal was ∼0.4 ppm and the shift of the pyridine aryl proton was a little larger. When 2 equiv of triflic acid was added to 5, however, the signals for the 3-pyridyl subunit shifted more than those of the 4-pyridyl subunit, with a downfield shift of ∼0.2 ppm for the two iminic α protons and ∼0.4 ppm for the aryl protons for the 3-pyridyl ring and only a ∼0.1 ppm shift of the 4-pyridyl signals. These data suggested that the 4-pyridyl subunit was being protonated with the first equivalent of triflic acid in these trials and that it was the more basic of the two nitrogen atoms, as has been observed by others before.24,25 With the second equivalent of triflic acid, the 3-pyridyl N atom was then expected to be protonated. The increased basicity of the 4-pyridyl ring is consistent with the increased N atom electron density originating from the in-resonance thiophene rings. With the second equivalent of triflic acid, the 3-pyridyl N atom was then expected to be protonated.
This assertion that the 4-pyridyl subunit is protonated first is supported by density functional theory (DFT) calculations. The DFT calculations show that the total energy for the 4-pyridyl-protonated 5 was lower than the 3-pyridyl-protonated 5 in both gas phase and implicit solvent calculations. Additionally, the reaction energy for the triflic acid protonation (Scheme S1) is 7.66 kcal mol–1 lower than that for the 3-pyridyl protonated 5. When solvent considerations are included (implicit solvation), the energy gap shrinks to 2.83 kcal mol–1, but protonation of the 4-pyridyl subunit remains the lower-energy option. Inspection of the highest occupied molecular orbital (HOMO) diagrams for these two molecules reveals that the molecular orbital is more diffuse across the whole molecule for the 4-pyridyl protonated molecule (Figure S64). This indicates that the positive charge that results from protonation is more delocalized when the 4-pyridyl subunit is protonated.
Following the 1H NMR study, we sought to determine which pyridine ring was likely protonated by measuring the optical changes that occur upon the addition of triflic acid to 5 and compared the results to similar experiments when using 2 and 3. In the ultraviolet–visible (UV–vis) spectrum of 2 dissolved in CH2Cl2, one major absorption band is observed, λmax = 374 nm (ε = 33 197 M–1 cm–1), and a weak shoulder is observed at 409 nm (ε = 14 759 M–1 cm–1) with nearly half the intensity of the other. For 3 dissolved in CH2Cl2, the UV–vis spectrum looks considerably different. While the most intense transition is at 387 nm (ε = 37 203 M–1 cm–1), there is a slightly less intense high-energy shoulder at 369 nm (ε = 34 872 M–1 cm–1), a weak shoulder (413 nm) at a lower intensity (ε = 21 669 M–1 cm–1), and a shoulder at 448 nm with very low intensity (ε = 4166 M–1 cm–1). For molecule 5, only one main absorption band is observed at 384 nm (ε = 16 741 M–1 cm–1) and a weak shoulder is observed at 416 nm (ε = 7478 M–1 cm–1) with nearly half the intensity of the other, as was the case for 2. Time-dependent DFT (TD-DFT) calculations were carried out to further inspect these trends in the gas phase. For molecules 2, 3, and 5 (in the gas phase), the spectra reveal major absorptions bands occur at 372 nm (3.33 eV), 370 nm (3.35 eV), and 374 nm (3.32 eV), respectively (Table S3). While these peaks are closer in separation than the experimental peaks, the trend remains in the same region. This indicated that the absorption of 5 was more similar to 2.
Titration of 2 dissolved in CH2Cl2 with triflic acid yielded an increase of intensity of the λmax absorbance peak at 374 nm from 0 to 2 mol equiv of triflic acid. Titration of 3 dissolved in CH2Cl2 with triflic acid instead yielded a decrease of intensity of the λmax absorbance peak at 387 nm, concomitant with the appearance and intensity increase of a new shoulder peak at 451 nm from 0 to 2 mol equiv of triflic acid. Finally, titration of 5 dissolved in DCM with triflic acid yielded a decrease of intensity of the λmax absorbance peak at 384 nm concomitant with an increase of intensity of a new shoulder peak at 451 nm from 0 to 2 mol equiv of triflic acid. The absorption spectra were also calculated for the singly- and doubly-protonated systems. On the whole, protonation redshifts the major absorption peak, more so for singly-protonated systems than for doubly-protonated systems (Figure S66). Notably, the major absorption peak for the 4-pyridyl-protonated molecule 5 has the lowest energy of all of the major absorption peaks at 505 nm (2.46 eV) (although it is also worth noting that the 3-pyridyl-protonated molecule 5 has a small peak at 538 nm, 2.3 eV). These data most closely resembled the major changes observed for 3, which suggested protonation of the 4-pyridyl ring.
Photoluminescence spectra of each molecule, when titrated with triflic acid from 0 to 2 mol equiv, were also recorded in CH2Cl2. Upon titration with triflic acid, the emission spectrum of 2 exhibited a very minor blue shift in the emission peak at 511 nm and an increase in the intensity of a minor emission band. The emission spectrum of 3 instead experienced two major changes with a new shoulder appearing at 410 nm and increasing with triflic acid addition, and a red shift in the major emission band at 560–570 nm. The spectrum of triflic acid titration with 5 did not yield any substantial changes in the observed spectrum, however, with a small change to intensity in a minor band near 440 nm, which more closely resembled the observations made for 2.
Since the pKa of each pyridine is expected to be similar, we posited that one protonated ring could serve as the acid for the other ring, so we sought an irreversible method of studying comparative reactivity. Toward this end, we allowed 5 to react with methyltriflate, a methylating reagent, in CH2Cl2 at 0 °C. When 5 and 2 mol equiv of methyltriflate were used, two pyridinium methyl peaks were observed (Scheme 2), one at 4.40 ppm (ascribed to the 3-pyridinium methyl, from 7a)26 and one at 4.28 ppm (ascribed to the 4-pyridinium methyl, from 7b).27
Scheme 2. Methylation of 5 Using Methyltriflate.

We confirmed the position of the methyl shifts by allowing equimolar 2 to react with 2 equiv of methyltriflate and measuring the 1H NMR spectrum of the product. When the amount of methyltriflate added to 5 was reduced to 1 mol equiv, we expected to observe one product only; however, we observed instead peaks corresponding to both monomethylated molecules and the dimethylated molecule. In the mixture, the monomethylated 4-pyridinium molecule was the major constituent (26% of 6, 20% of 7a, 54% of 7b), which suggested that the 4-pyridyl subunit was more nucleophilic. The same product ratio was observed when the methylating agent was added at 0 °C in several portions or in several portions and at high dilution. Since methylation is irreversible, this confirms that both pyridine rings in solution may react with strong electrophiles, either protons or methylating reagents, whether the other pyridine ring had already reacted or not, due to the presence of the demethylated product. The increased nucleophilicity of the 4-pyridyl ring is consistent with the increased N atom electron density originating from the in-resonance thiophene rings. These data also suggested that even though the single crystal of 5e did not have hydrogen-bonding interactions that included the 3-pyridyl ring, both pyridine rings do participate similarly in the solution, and the structure we solved may have just been the first to crystallize from the solution.
Solid-Phase Cocrystal Properties
We measured each powder using infrared spectroscopy and compared the results to that of each of the cocrystal component molecules.28 As it was the easiest characteristic peak to identify in the cocrystal samples, the peak we focused on for cocrystals using 5 was the C=O stretching resonance that was observed from around 1670 cm–1 to around 1700 cm–1 (∼1667 cm–1 for coformer c and 1701 cm–1 for coformer e). In each case, coformer synthesis resulted in an increase in the resonance frequency of the C=O stretch, which indicated a strengthening of the C=O bond with cocrystal formation. These data indicated the presence of hydrogen bonding in the powder samples (see the Supporting Information). Since we observed both pyridines reacting similarly in the solution phase and both are expected to have similar proton affinities (vide supra), we attribute the changes in the IR spectrum to interaction with either of the pyridine N atoms.
We used thermogravimetric analysis (TGA) on 5 and each of the cocrystals with 5. We had previously reported TGA values for 2, 3, and their cocrystals and found that cocrystallization resulted in confirmed cocrystals and not solid solutions of the two materials.19 We also found in that study that coformer addition led to lower mass loss onset values. We observed the same trend here, where each onset of mass loss was lower than that of pristine 5.
Once we established how the two pyridyl rings differ in hydrogen-bond formation and that the intermolecular interactions occur in the solution state and persist into the solid state, we set out to understand how changing the coformer affected the optical absorption of the cocrystal in comparison to pristine 5.29 When cocrystals 5a–e were dissolved in CH2Cl2, there was a blue shift of 7 nm, leading to a λmax of 377 nm for each of the cocrystals, with each cocrystal spectrum looking similar. The photoluminescence spectra for each of the cocrystals also looked similar, with a slight red shift of the main emission peak position (from 510 to 521 nm), concomitant with an increase in intensity for the most intense peak and a decrease in intensity for the minor band near 440 nm. There was little difference between coformer photoluminescence spectra.
We collected the absorption spectra of thin films made with 5 and 5a–e by drop-casting a 5 mg mL–1 solution of each in CH2Cl2. Cocrystal 5c was not soluble enough in CH2Cl2 to allow adequate film formation, and in each case, the drop-casted films were inhomogeneous. Drop-casting a solution of 5 in CH2Cl2 left a film with a λmax at ∼370 nm and several shoulder peaks ascribed to aggregates at lower energies. For 5a, the λmax red-shifted to ∼400 nm, and more numerous peaks ascribed to aggregate states were observed that extended to low energies out to ∼650 nm. Thin-film samples of cocrystal 5b had a much broader, single, and major absorption peak centered at 425 nm and extending out to 550 nm. Thin films of 5d displayed a similar change to a single, broad absorption, but there were marked fine structure peaks at 455 and 430 nm. For cocrystal 5e, the thin-film spectrum was similar to that of 5a, except there were fewer shoulder peaks present, and absorption did not extend past 500 nm. From these data, it appeared that cocrystal formation led to increased aggregation, as the shoulders and lower-energy absorption bands could be ascribed to H-aggregates.30
After confirming the presence of intermolecular interactions in the solid state using IR spectroscopy and observing the changes in thin-film electronic properties by UV–vis absorption spectroscopy, we sought to understand how crystallinity in the solid state changed with cocrystal coformer and dipyridyl(bithiophene) isomer identity. To this end, we began by measuring the powder X-ray diffraction (PXRD) patterns of each parent molecule and their cocrystals by drop-casting 5 mg mL–1 solutions in DCM onto glass slides. Because each molecule and cocrystal sample was not very soluble in CH2Cl2, the concentrations could not be made high enough to obtain an adequate signal or obtain a good film morphology. Therefore, we used powder samples that we obtained after synthesizing each parent molecule and cocrystal. To estimate the average crystallite size for each parent and cocrystal sample, we used the full width (in °2θ) at half-maximum (FWHM) of the highest intensity peak present in the PXRD spectrum (Table 1). Narrower peaks in general equate to large crystallite size according to the Scherrer equation.31
Table 1. FWHM Values and 100% Peak Positions for Each Parent and Cocrystal Sample.
| material | 100% peak (°2θ) | FWHM (°2θ) |
|---|---|---|
| 2 | 17.42 | 0.250 |
| 2a | 21.23 | 0.294 |
| 2b | 24.09 | 0.178 |
| 2c | 23.57 | 0.292 |
| 2d | 17.5 | 0.092 |
| 2e | 19.92 | 0.361 |
| 3 | 23.17 | 0.080 |
| 3a | 15.97 | 0.234 |
| 3b | 19.66 | 0.232 |
| 3c | 25.07 | 0.264 |
| 3d | 17.98 | 0.148 |
| 3e | 23.56 | 0.204 |
| 5 | 18.46 | 0.162 |
| 5a | 23.79 | 0.558 |
| 5b | 26.83 | 0.407 |
| 5c | 20.33 | 0.4 |
| 5d | 24.54 | 0.332 |
| 5e | 24.27 | 0.224 |
Powders of molecule 2 had peaks at ∼17, ∼23, ∼25, and ∼29° in 2θ; powders of molecule 3 had peaks at ∼5, ∼19, ∼21, ∼22, and 25° in 2θ; and powders of molecule 5 had peaks at ∼7, ∼18, ∼20, ∼21, 24, and 29° in 2θ (Figure 3). For 2, FWHM = 0.250° 2θ; for 3, FWHM = 0.080° 2θ; and for 5, FWHM = 0.162° 2θ, which indicated that the largest crystallite sizes were present in 3, while 2 had the lowest average crystallite size. We compared the powder pattern for 2 with the calculated pattern for its reported crystal structure and found that the two matched well (Figure 3). During our study, we also managed to grow crystals of 3 (see the Supporting Information) and we compared the calculated diffraction spectrum from the single crystal to the powder pattern for 3, with both having peaks that matched up well.
Figure 3.

Powder X-ray diffraction patterns of (a) 2a, (b) 3a, (c) 2e, and (d) 5e (red, bottom), compared with the calculated patterns from their solved X-ray structures (black, top).
For cocrystals of 2, each material (2a–e) yielded material that either exhibited a new set of signals with many new diffraction peaks (2a, 2c–e) or a marked change in the relative peak intensity of the original signals for 2 (2c). Only 2b (FWHM = 0.178 °2θ) and 2d (FWHM = 0.092 °2θ) had lower FWHM and thus larger average crystallite size than the parent compound 2. Cocrystal 2d exhibited nearly 10× enhancement in signal intensity and had the most intense signals of the group. Comparing the calculated powder pattern of the reported crystal structure of 2a with the pattern we collected for the synthesized powder, we observed large differences, which show that the two materials do not share the same structure. For cocrystals of 3, the cocrystals did not yield more materials with larger average crystallite sizes. In contrast to 2, each of the materials exhibited a much different set of signals than 3. Comparing the calculated pattern of the reported crystal structure of 3a with the pattern we collected for synthesized powders, we observed large differences, again showing that the two materials are not isostructural. For the cocrystals using 5, each of the materials had more intense signals, but each of them had a much lower average crystallite size than for parent molecule 5. We compared the calculated powder pattern for the X-ray structure we solved of 5e with the powder pattern of the synthesized material and the peaks that were observed seemed to match with the simulated set of signals, which indicated that the powder and the single crystal might have been a mixture of the crystalline structure observed in 5e and amorphous regions, which may or may not have had both pyridine N atoms participating in hydrogen-bonding interactions in the thin powder. Cocrystal powder samples of 3a–e and 5a–e all had lower FWHM values than the parent molecules. From these data, we conclude that the cocrystallization of 2, 3, and 5 using the benzoic acids chosen here on the whole did not yield more larger average crystallites in the powder samples. Even though 2b and 2d had lower FWHM values than 2, the same benzoic acids did not yield lower FWHM values in 3 and 5, which indicates that it is not straightforward to link coformers to lower FWHM values.
For four systems (2a,193a,192e,19 and 5e), crystals of sufficient quality have been grown to identify dimers amongst the parent molecules for subsequent evaluation of the intermolecular electronic couplings. Unfortunately, efforts to grow single crystals of the other cocrystals described here have so far been unsuccessful. We successfully grew a single crystal of 5; however, the disorder in the pyridyl ring placement and relative position was sufficiently high to prevent a definitive solution of atom placement.
Intermolecular electronic couplings for holes (HOMO–HOMO) and electrons (lowest unoccupied molecular orbital (LUMO)–LUMO) (Table S4) reveal little difference in the intermolecular electronic couplings for holes for 2, while the maximum intermolecular electronic coupling for the electron is larger in 2e when compared to the other two systems (2 and 2a). While each of these systems has a potential charge transport pathway, the couplings for hole pathways are marginal (7–11 meV, with one outlier coupling of 59 meV for 2) and the couplings for electronic pathways are small (34–99 meV) (Figures S67–S69). The electronic couplings for 3 are comparable to those for 2 and 2a, though the hole coupling is slightly higher (Figure S70). Dimers for cocrystal 3a had almost no hole intermolecular coupling and some electronic coupling, but no electronic coupling pathways exist (Figure S71). The hole coupling between parent molecules in 5e had the only significant calculated coupling (166 meV). While there exists a potential charge transport pathway for 5e with moderately strong hole coupling, the pathway is hindered by low electronic coupling (8 meV) in the pathway (Figure 4).
Figure 4.

(A) Side view of the 5e crystal structure showing major intermolecular electronic couplings. The hole (HOMO−HOMO) and electron (LUMO−LUMO) electronic couplings are provided. (B) Rotated view of the 5e supercell demonstrating the possible charge transport pathways. The electronic coupling calculations were carried out at the PBE/6-31g(d,p) level of theory.
Conclusions
We studied cocrystals of 5-(3-pyridyl)-5′-(4-pyridyl)-2,2′-bithiophene with simple benzoic acid coformers in an effort to understand how the coformer identity and pyridine N atom placement affected solution and solid-state properties. We found that the 4-pyridyl ring was slightly more basic and more nucleophilic, and we solved a crystal structure that featured hydrogen bonding only with the 4-pyridyl subunit. Using a methylating agent allowed us to directly observe the reaction of both pyridine nitrogen atoms. The average crystallite size of cocrystal powders was then investigated, and it was found that cocrystallization generally decreased the powder crystallite size and that for three cocrystals with a solved crystal structure, the powder diffraction pattern was reasonably similar to the pattern calculated from the cocrystal’s single-crystal structure, which suggested that the single-crystal structure was present in the powder sample. Electron and hole coupling values were calculated using four parent molecule dimers present in each of the single crystals, and it was found that the coformers used here (simple monobenzoic acids) lowered hole (HOMO–HOMO) coupling values, did not much affect electron (LUMO–LUMO) coupling values in 2, and lowered them in 3. However, in each of the cocrystals studied, while some coupling values were high for individual dimers, the charge pathways through the material were hindered at some point by low electronic coupling.
Experimental Section
General Considerations
All commercially obtained reagents were used as received. Unless otherwise noted, all reactions were performed under a N2 atmosphere. Thin-layer chromatography (TLC) was conducted with Sigma T-6145-precoated TLC silica gel 60 F254 aluminum sheets and/or visualized with UV and potassium permanganate staining. Flash column chromatography was performed as described by still using Silicycle P60, 40–63 μm (230–400 mesh). 1H NMR spectra were recorded on a JEOL ECZR 500 MHz spectrometer equipped with a 5 mm high sensitivity ROYAL NMR probe, and they are reported in ppm using the solvent as an internal standard (CDCl3 at 7.26 ppm and DMSO at 2.5 ppm). Data are reported as follows: s = singlet, d = doublet, t = triplet, q = quartet, p = pentet, m = multiplet, b = broad, ap = apparent; coupling constant(s) in Hz; integration. 13C NMR spectra were recorded on a JEOL ECZR 125 MHz spectrometer equipped with a 5 mm high sensitivity ROYAL NMR probe, and they are reported in ppm using the solvent as an internal standard (CDCl3 and DMSO). UV–vis spectra were measured with a Cary 5000 UV–Vis spectrometer. A Nicolet 380 FT-IR was used for infrared spectroscopy, and the data was analyzed using Omnic 8.0 Thermo Fischer Scientific Inc. software. TGA was done using a TA Instruments Q50. Powder X-ray diffraction was performed on a Bruker-AXS D8 DISCOVER diffractometer. Photoluminescence measurements were performed using the Horiba Scientific Fluoromax Plus-C fluorometer with entrance and exit slits of 5 nm and 0.1 s integration time.
Preparation of 5,5′-Dibromo-2,2′-bithiophene (1)
To a round-bottomed flask with 50 mL of DMF, 2.000 g (12.03 mmol) of 2,2′-bithiophene was added and stirred under nitrogen at 0 °C. After 10 min, 4.282 g (24.06 mmol) of NBS was added under dark conditions. The reaction was allowed to come to room temperature and stirred for an additional 24 h. The reaction was quenched with water, and the organic product was extracted with DCM (2 × 100 mL). After the organic layers were combined, they were washed with water (4 × 200 mL) and brine (1 × 100 mL). The organic layer was dried over MgSO4, and then the solvent was removed under vacuum to afford the title product (3.226 g, 82.21%). 1H NMR (500 MHz, CDCl3): δ 6.95 (dd, J = 3.8, 0.8 Hz, 2H), 6.84 (dd, J = 3.8, 0.9 Hz, 2H).
Preparation of 3,3′-[[2,2′-Bithiophene]-5,5′-diyl]bis-pyridine (2)
To a flame-dried round-bottomed flask, 50 mL of 1:3:6 water/MeOH/toluene mixture was added and degassed for 15 min. To this solvent mixture, 1.000 g (3.086 mmol) of (1), 0.835 g (6.79 mmol) of 3-pyridyl boronic acid, 0.178 g (0.154 mmol) of tetrakis(triphenylphosphine) palladium(0), 2.559 g (18.52 mmol) of potassium carbonate, and three drops of Aliquat336 TG were added and stirred under nitrogen. The reaction was refluxed at 85 °C for 48 h in dark conditions. The reaction was monitored by TLC using 100% EtOAc as the mobile phase. Once the reaction reached completion, the solvent was removed under vacuum, and an autocolumn was run using a gradient from 100% DCM to 100% EtOAc to 4:1 EtOAc/MeOH. The third column fraction was collected, and the solvent was again removed under vacuum. The crude product afforded was sublimed at 180 °C to give the title product (0.359 g, 36.3%). 1H NMR (500 MHz, CDCl3): δ 8.89 (s, 2H), 8.53 (m, 2H), 7.89 (dt, J = 7.9, 1.9 Hz, 2H), 7.35 (dd, J = 8.0, 4.8 Hz, 2H), 7.31 (d, J = 3.9 Hz, 2H), 7.23 (d, J = 3.8 Hz, 2H). Molar absorptivity (ε): 33 153 L mol–1 cm–1.
Preparation of 4,4′-[[2,2′-Bithiophene]-5,5′-diyl]bis-pyridine (3)
To a flame-dried round-bottomed flask, 50 mL of 1:3:6 water/MeOH/toluene mixture was added and degassed for 15 min. To this solvent mixture, 0.500 g (1.53 mmol) of (1), 0.396 g (3.22 mmol) of 4-pyridyl boronic acid, 0.089 g (0.077 mmol) of tetrakis(triphenylphosphine) palladium(0), 1.271 g (9.195 mmol) of potassium carbonate, and three drops of Aliquat336 TG were added and stirred under nitrogen. The reaction was refluxed at 85 °C for 48 h in dark conditions. The reaction was monitored by TLC using 100% EtOAc as the mobile phase. Once the reaction reached completion, the solvent was removed under vacuum, and an autocolumn was run using a gradient from 100% DCM to 100% EtOAc to 4:1 EtOAc/MeOH. The third column fraction was collected, and the solvent was again removed under vacuum. The crude product afforded was sublimed at 180 °C to give the title product (0.173 g, 35.1%). 1H NMR (500 MHz, CDCl3): δ 8.65–8.55 (m, 4H), 7.49–7.42 (m, 4H), 7.26 (d, J = 3.7 Hz, 4H). Molar absorptivity (ε): 34 017 L mol–1 cm–1.
Preparation of 3-(5′-Bromo[2,2′-bithiophen]-5-yl)-pyridine (4)
To a flame-dried round-bottomed flask, 50 mL of a 1:3:6 water/MeOH/toluene mixture was added and degassed for 15 min. To this solvent mixture, 0.500 g (1.53 mmol) of (1), 0.283 g (2.30 mmol) of 3-pyridyl boronic acid, 0.089 g (0.077 mmol) of tetrakis(triphenylphosphine) palladium(0), 1.271 g (9.195 mmol) of potassium carbonate, and three drops of Aliquat336 TG were added and stirred under nitrogen. The reaction was refluxed at 85 °C for 24 h in dark conditions. The reaction was monitored by TLC using 100% EtOAc as the mobile phase. Once the reaction reached completion, the solvent was removed under vacuum, and an autocolumn was run using a gradient from 100% DCM to 100% EtOAc to 4:1 EtOAc/MeOH. The second column fraction was collected, and the solvent was removed under vacuum to afford the title product (0.181, 36.7%). 1H NMR (500 MHz, CDCl3): δ 8.90–8.82 (m, 1H), 8.52 (dd, J = 4.9, 1.6 Hz, 1H), 7.83 (dt, J = 1.9 Hz, 1H), 7.30 (dd, J = 8.0, 4.8 Hz, 1H), 7.26 (d, J = 3.8 Hz, 1H), 7.10 (d, J = 3.8 Hz, 1H), 6.99 (d, J = 3.8 Hz, 1H), 6.96 (d, J = 3.8 Hz, 1H). 13C NMR (125 MHz, CDCl3): δ 111.60, 123.78, 124.22, 125.02, 128.04, 130.00, 130.85, 132.72, 137.03, 138.46, 146.84, 148.80. IR (neat) (ṽ, cm–1): 3081, 3053, 2924, 2852, 1732, 1566, 1475, 1414, 800.
Preparation of 3,4-[[2,2′-Bithiophene]-5,5′-diyl]bis-pyridine (5)
To a flame-dried round-bottomed flask, 50 mL of a 1:3:6 water/MeOH/toluene mixture was added and degassed for 15 min. To this solvent mixture 0.500 g (3.07 mmol) of (4), 0.286 g (2.33 mmol) of 4-pyridyl boronic acid, 0.090 g (.078 mmol) of tetrakis(triphenylphosphine) palladium (0), 1.287 g (9.310 mmol) of potassium carbonate, and three drops of Aliquat336 TG were added and stirred under nitrogen. The reaction was refluxed at 85 °C for 48 h. The reaction had a better yield when it was kept out of the light. The reaction was monitored by TLC using 100% EtOAc as the mobile phase. Once the reaction reached completion, the solvent was removed under vacuum, and an autocolumn was run using a gradient from 100% DCM to 100% EtOAc to 4:1 EtOAc/MeOH. The third column fraction was collected, and the solvent was again removed under vacuum. The crude product afforded was sublimed at 180 °C to give the title product (0.164 g, 33.0%). 1H NMR (500 MHz, CDCl3): δ 8.88 (d, J = 2.4 Hz, 1H), 8.64–8.57 (m, 2H), 8.53 (dd, J = 4.8, 1.6 Hz, 1H), 7.85 (dt, J = 8.0, 1.9 Hz, 1H), 7.47–7.42 (m, 3H), 7.35–7.29 (m, 2H), 7.26–7.22 (m, 2H). 13C NMR (125 MHz, CDCl3): δ 119.60, 123.83, 125.17, 125.18, 125.48, 126.34, 129.99, 132.77, 137.34, 138.75, 139.99, 140.06, 140.96, 146.85, 148.86, 150.55. IR (neat) (ṽ, cm–1): 2919, 2850, 1587,1413, 794, 699. Molar absorptivity (ε): 16 741 L mol–1 cm–1.
Preparation of Coproducts 2a–e, 3a–e, 5a–e
Stoichiometric amounts of the parent compounds (2), (3), and (5) were added to a multiwell plate with each of the coformers a–e. A few drops of methanol were added to each well, and the suspensions were ground manually for 1 min.
Preparation of 1-Methyl-3-(5′-(1-methylpyridin-1-ium-4-yl)-[2,2′-bithiophen]-5-yl)pyridin-1-ium (6)
To a round-bottomed flask equipped with a stir bar, 0.011 g (0.035 mmol) of (5) was added to 2 mL of DCM. The flask was chilled in an ice bath before 0.0076 mL (0.069 mmol) of methyl trifluoromethanesulfonate was added to the flask. The reaction was allowed to come to room temperature overnight. The solvent was removed under vacuum to afford the title product (0.0098 g, 81%). 1H NMR (500 MHz, DMSO): δ 9.41 (s, 1H), 8.85 (m, 3H), 8.79 (d, J = 8.4, 1H), 8.31 (d, J = 7.1 Hz, 2H), 8.25 (d, J = 4.0 Hz, 1H) 8.13 (dd, J = 8.3, 6.0 Hz, 1H), 7.94 (d, J = 4.0 Hz, 1H), 7.74 (dd, J = 10.9, 4.0 Hz, 2H), 4.35 (s, 3H), 4.22 (s, 3H). 13C NMR (125 MHz, DMSO): δ 147.34, 146.10, 142.72, 142.63, 140.69, 138.58, 136.86, 134.06, 133.19, 130.35, 128.54, 128.48, 128.25, 122.49, 122.37, 48.72, 47.47.
Methylation Experiment of 3,4-[[2,2′-Bithiophene]-5,5′-diyl]bis-pyridine with 1 equiv of Methyl Trifluoromethanesulfonate
To a round-bottomed flask equipped with a stir bar, 0.012 g (0.037 mmol) of (5) was added to 2 mL of DCM. The flask was chilled in an ice bath before 0.0040 mL (0.037 mmol) of methyl trifluoromethanesulfonate was added to the flask. The reaction was allowed to come to room temperature overnight. The solvent was removed under vacuum to afford an NMR sample. Key product resonances and percentage yield were investigated by 1H NMR integration. 1H NMR (500 MHz, CDCl3): (7b) 4.21 ppm (55%), (6) 4.35 and 4.23 ppm (27%), (7a) 4.34 (18%).
Preparation of 3,3′-[[2,2′-Bithiophene]-5,5′-diyl]bis(1-methylpyridin-1-ium) (8)
To a round-bottomed flask equipped with a stir bar, 0.023 g (0.072 mmol) of (2) was added to 3 mL of DCM. The flask was chilled in an ice bath before 0.0165 mL (0.151 mmol) of methyl trifluoromethanesulfonate was added to the flask. The reaction was allowed to come to room temperature overnight. The solvent was removed under vacuum to afford the title product (0.021 g, 84%). 1H NMR (500 MHz, DMSO): δ 9.40 (s, 2H), 8.85 (d, J = 6.0 Hz, 2H), 8.77 (d, J = 8.2 Hz, 2H), 8.12 (dd, J = 8.2, 3.7 Hz, 2H), 7.91 (d, J = 3.7 Hz, 2H), 7.65 (d, J = 3.8 Hz, 2H), 4.35 (s, 6H). 13C NMR (125 MHz, DMSO): δ 144.13, 142.62, 140.57, 138.99, 135.68, 133.32, 130.25, 128.47, 127.55, 48.71.
Single-Crystal Characterization
Single-crystal data were collected with a Bruker D8 Venture κ-axis diffractometer with Mo Kα radiation (0.71073 Å) at 90.0 K. The crystal structures were solved by dual-space methods and refined by full-matrix least-squares using the SHELX programs.
Acknowledgments
This material is based upon the work supported by the National Science Foundation under Cooperative Agreement No. 1849213. The diffractometer was funded by the NSF MRI CHE-1625732. The authors acknowledge the UK Center for Computational Sciences and Information Technology Services Research Computing for their fantastic support and collaboration and use of the Lipscomb and Morgan Compute Clusters and associated research computing resources.
Supporting Information Available
The Supporting Information is available free of charge at https://pubs.acs.org/doi/10.1021/acsomega.3c02423.
The authors declare no competing financial interest.
Supplementary Material
References
- Kippelen B.; Brédas J.-L. Organic photovoltaics. Energy Environ. Sci. 2009, 2, 251–261. 10.1039/b812502n. [DOI] [Google Scholar]
- Karpenko J.; Klymchenko A. S.; Gioria S.; Kreder R.; Shulov I.; Villa P.; Mély Y.; Hibert M.; Bonnet D. Squaraine as a bright, stable and environment-sensitive far-red label for receptor-specific cellular imaging. Chem. Commun. 2015, 51, 2960–2963. 10.1039/C4CC09113B. [DOI] [PubMed] [Google Scholar]
- Irkhin P.; Ryasnyanskiy A.; Koehler M.; Biaggio I. Absorption and photoluminescence spectroscopy of rubrene single crystals. Phys. Rev. B 2012, 86, 085143 10.1103/PhysRevB.86.085143. [DOI] [Google Scholar]
- Anctil A.; Babbitt C. W.; Raffaelle R. P.; Landi B. J. Cumulative energy demand for small molecule and polymer photovoltaics. Prog. Photovoltaics: Res. Appl. 2013, 21, 1541–1554. 10.1002/pip.2226. [DOI] [Google Scholar]
- Bronstein H.; Nielsen C. B.; Schroeder B. C.; McCulloch I. The role of chemical design in the performance of organic semiconductors. Nat. Rev. Chem. 2020, 4, 66–77. 10.1038/s41570-019-0152-9. [DOI] [PubMed] [Google Scholar]
- Sekine C.; Tsubata Y.; Yamada T.; Kitano M.; Doi S. Recent progress of high performance polymer OLED and OPV materials for organic printed electronics. Sci. Technol. Adv. Mater. 2014, 15, 034203 10.1088/1468-6996/15/3/034203. [DOI] [PMC free article] [PubMed] [Google Scholar]
- Liu K.; Ouyang B.; Guo X.; Guo Y.; Liu Y. Advances in flexible organic field-effect transistors and their applications for flexible electronics. npj Flexible Electron. 2022, 6, 1 10.1038/s41528-022-00133-3. [DOI] [Google Scholar]
- McQuade D. T.; Pullen A. E.; Swager T. M. Conjugated Polymer-Based Chemical Sensors. Chem. Rev. 2000, 100, 2537–2574. 10.1021/cr9801014. [DOI] [PubMed] [Google Scholar]
- Cigánek M.; Richtár J.; Weiter M.; Krajčovič J. Organic π-Conjugated Molecules: From Nature to Artificial Applications. Where are the Boundaries?. Isr. J. Chem. 2022, 62, e202100061 10.1002/ijch.202100061. [DOI] [Google Scholar]
- Basiricò L.; Ciavatti A.; Fraboni B. Solution-Grown Organic and Perovskite X-Ray Detectors: A New Paradigm for the Direct Detection of Ionizing Radiation. Adv. Mater. Technol. 2021, 6, 2000475 10.1002/admt.202000475. [DOI] [Google Scholar]
- Brédas J. L.; Calbert J. P.; da Silva Filho D. A.; Cornil J. Organic semiconductors: A theoretical characterization of the basic parameters governing charge transport. Proc. Natl. Acad. Sci. 2002, 99, 5804–5809. 10.1073/pnas.092143399. [DOI] [PMC free article] [PubMed] [Google Scholar]
- Anthony J. E.; Facchetti A.; Heeney M.; Marder S. R.; Zhan X. n-Type Organic Semiconductors in Organic Electronics. Adv. Mater. 2010, 22, 3876–3892. 10.1002/adma.200903628. [DOI] [PubMed] [Google Scholar]
- Anthony J. E. The Larger Acenes: Versatile Organic Semiconductors. Angew. Chem., Int. Ed. 2008, 47, 452–483. 10.1002/anie.200604045. [DOI] [PubMed] [Google Scholar]
- Coropceanu V.; Cornil J.; da Silva Filho D. A.; Olivier Y.; Silbey R.; Brédas J.-L. Charge Transport in Organic Semiconductors. Chem. Rev. 2007, 107, 926–952. 10.1021/cr050140x. [DOI] [PubMed] [Google Scholar]
- Jurchescu O. D.; Mourey D. A.; Subramanian S.; Parkin S. R.; Vogel B. M.; Anthony J. E.; Jackson T. N.; Gundlach D. J. Effects of polymorphism on charge transport in organic semiconductors. Phys. Rev. B 2009, 80, 085201 10.1103/PhysRevB.80.085201. [DOI] [Google Scholar]
- Daniel Głowacki E.; Leonat L.; Irimia-Vladu M.; Schwödiauer R.; Ullah M.; Sitter H.; Bauer S.; Serdar Sariciftci N. Intermolecular hydrogen-bonded organic semiconductors—Quinacridone versus pentacene. Appl. Phys. Lett. 2012, 101, 023305 10.1063/1.4736579. [DOI] [Google Scholar]
- Aakeröy C. B.; Champness N. R.; Janiak C. Recent advances in crystal engineering. CrystEngComm 2010, 12, 22–43. 10.1039/B919819A. [DOI] [Google Scholar]
- Sokolov A. N.; Friščić T.; MacGillivray L. R. Enforced Face-to-Face Stacking of Organic Semiconductor Building Blocks within Hydrogen-Bonded Molecular Cocrystals. J. Am. Chem. Soc. 2006, 128, 2806–2807. 10.1021/ja057939a. [DOI] [PubMed] [Google Scholar]
- Sarkar N.; Parkin S.; Huckaba A. J. Structural Study of Hydrogen-Bond Driven Cocrystallization of Pyridyl-Bithiophene Based Compounds. Cryst. Growth Des. 2021, 21, 4337–4345. 10.1021/acs.cgd.1c00234. [DOI] [Google Scholar]
- Robertson C. C.; Wright J. S.; Carrington E. J.; Perutz R. N.; Hunter C. A.; Brammer L. Hydrogen bonding vs. halogen bonding: the solvent decides. Chem. Sci. 2017, 8, 5392–5398. 10.1039/C7SC01801K. [DOI] [PMC free article] [PubMed] [Google Scholar]
- Riwar L.-J.; Trapp N.; Kuhn B.; Diederich F. Substituent Effects in Parallel-Displaced π–π Stacking Interactions: Distance Matters. Angew. Chem., Int. Ed. 2017, 56, 11252–11257. 10.1002/anie.201703744. [DOI] [PubMed] [Google Scholar]
- Diemer V.; Chaumeil H.; Defoin A.; Fort A.; Boeglin A.; Carré C. Syntheses of Sterically Hindered Pyridinium Phenoxides as Model Compounds in Nonlinear Optics. Eur. J. Org. Chem. 2006, 2006, 2727–2738. 10.1002/ejoc.200600030. [DOI] [Google Scholar]
- Korshunov A.; Gibalova A.; Gruenebaum M.; Ravoo B. J.; Winter M.; Cekic-Laskovic I. Supramolecular Viologen–Cyclodextrin Electrolytes for Aqueous Organic Redox Flow Batteries. ACS Appl. Energy Mater. 2021, 4, 12353–12364. 10.1021/acsaem.1c02156. [DOI] [Google Scholar]
- Öğretir C.; Öztürk; Tay N. F. Quantum chemical studies on acidity-basicity behaviors of some bipyridine derivatives. ARKIVOC 2010, 2009, 235–254. 10.3998/ark.5550190.0010.e22. [DOI] [Google Scholar]
- Mech P.; Bogunia M.; Nowacki A.; Makowski M. Calculations of pKa Values of Selected Pyridinium and Its N-Oxide Ions in Water and Acetonitrile. J. Phys. Chem. A 2020, 124, 538–551. 10.1021/acs.jpca.9b10319. [DOI] [PubMed] [Google Scholar]
- Harawa V.; Thorpe T. W.; Marshall J. R.; Sangster J. J.; Gilio A. K.; Pirvu L.; Heath R. S.; Angelastro A.; Finnigan J. D.; Charnock S. J.; Nafie J. W.; Grogan G.; Whitehead R. C.; Turner N. J. Synthesis of Stereoenriched Piperidines via Chemo-Enzymatic Dearomatization of Activated Pyridines. J. Am. Chem. Soc. 2022, 144, 21088–21095. 10.1021/jacs.2c07143. [DOI] [PMC free article] [PubMed] [Google Scholar]
- Luo L.; Tang J.; Sun R.; Li W.; Zheng X.; Yuan M.; Li R.; Chen H.; Fu H. Direct C–H Sulfonylimination of Pyridinium Salts. Org. Lett. 2022, 24, 2821–2825. 10.1021/acs.orglett.2c00725. [DOI] [PubMed] [Google Scholar]
- Sarkar N.; Sinha A. S.; Aakeröy C. B. Systematic investigation of hydrogen-bond propensities for informing co-crystal design and assembly. CrystEngComm 2019, 21, 6048–6055. 10.1039/C9CE01196J. [DOI] [Google Scholar]
- Li S.; Yan D. Two-Component Aggregation-Induced Emission Materials: Tunable One/Two-Photon Luminescence and Stimuli-Responsive Switches by Co-Crystal Formation. Adv. Opt. Mater. 2018, 6, 1800445 10.1002/adom.201800445. [DOI] [Google Scholar]
- Jancy B.; Asha S. K. Hydrogen-Bonding-Induced Conformational Change from J to H Aggregate in Novel Highly Fluorescent Liquid-Crystalline Perylenebisimides. Chem. Mater. 2008, 20, 169–181. 10.1021/cm702497y. [DOI] [Google Scholar]
- Patterson A. L. The Scherrer Formula for X-Ray Particle Size Determination. Phys. Rev. 1939, 56, 978–982. 10.1103/PhysRev.56.978. [DOI] [Google Scholar]
Associated Data
This section collects any data citations, data availability statements, or supplementary materials included in this article.