

Abstract
This single‐center, open‐label, non‐randomized, two‐part, phase I study was conducted (1) to evaluate the absolute oral bioavailability of rilzabrutinib 400 mg tablet following an i.v. microtracer dose of ~100 μg [14C]‐rilzabrutinib (~1 μCi) and single oral dose of 400 mg rilzabrutinib tablet (part 1), and (2) to characterize the absorption, metabolism, and excretion (AME) of 14C‐radiolabeled rilzabrutinib following single oral dose (300 mg) of [14C]‐rilzabrutinib (~1000 μCi; administered as a liquid) in healthy male participants (part 2). A total of 18 subjects were enrolled (n = 8 in part 1; n = 10 in part 2). The absolute bioavailability of 400 mg rilzabrutinib oral tablet was low (<5%). In part 1, rilzabrutinib was absorbed rapidly after single oral dose of rilzabrutinib 400 mg tablet with a median (range) time to maximum concentration (T max) value of 2.03 h (1.83–2.50 h). The geometric mean (coefficient of variation) terminal half‐life following the oral dose and i.v. microtracer dose of ~100 μg [14C]‐rilzabrutinib, were 3.20 (51.0%) and 1.78 (37.6%) h, respectively. In part 2, rilzabrutinib was also absorbed rapidly following single oral dose of 300 mg [14C]‐rilzabrutinib solution with a median (range) T max value of 1.00 h (1.00–2.00 h). The majority of total radioactivity was in the feces for both non‐bile collection subjects (92.9%) and bile collection subjects (87.6%), and ~5% of radioactivity was recovered in urine after oral administration. Urinary excretion of unchanged rilzabrutinib was low (3.02%). The results of this study advance the understanding of the absolute bioavailability and AME of rilzabrutinib and can help inform its further investigation.
Study Highlights.
WHAT IS THE CURRENT KNOWLEDGE ON THE TOPIC?
Rilzabrutinib is a potent, oral, and reversible covalent Bruton's tyrosine kinase inhibitor being developed to treat autoimmune diseases. Rilzabrutinib is currently being investigated in a phase III trial in immune thrombocytopenia, and in several phase II studies in various autoimmune indications.
WHAT QUESTION DID THIS STUDY ADDRESS?
To understand the mass balance, routes of elimination, and absolute bioavailability of rilzabrutinib in the ongoing development program, we conducted this study to (1) evaluate the absolute oral bioavailability of rilzabrutinib (part 1), and (2) characterize the absorption, metabolism, and excretion of 14C‐radiolabeled rilzabrutinib in healthy male participants (part 2).
WHAT DOES THIS STUDY ADD TO OUR KNOWLEDGE?
Rilzabrutinib is rapidly absorbed after oral administration, with a low oral bioavailability (<5%). It is mainly cleared by metabolic enzymes and renal clearance plays a negligible role in the disposition of the parent compound. It has high systemic clearance and presence of circulating metabolite(s).
HOW MIGHT THIS CHANGE CLINICAL PHARMACOLOGY OR TRANSLATIONAL SCIENCE?
The results of this study advance the understanding of the absolute bioavailability and absorption, metabolism, and excretion of rilzabrutinib and can help inform its further investigation.
INTRODUCTION
Bruton's tyrosine kinase (BTK) is an essential signaling element downstream of the B‐cell receptor (BCR), Fc‐gamma receptor (FcγR), and Fc‐epsilon receptor (FcεR). 1 , 2 BTK also regulates the activation of other hematopoietic cells, such as basophils, mast cells, macrophages, and neutrophils primarily through Fc receptors. 1 , 2 , 3 Inhibition of BTK activity in B‐cells produces phenotypic changes consistent with blockade of the BCR and a selective BTK inhibitor has the potential to target multiple pathways and cell types involved in inflammation and autoimmunity. 4 , 5 , 6 , 7 , 8 Rilzabrutinib (PRN1008) is a potent, selective, and reversible covalent BTK inhibitor developed to treat autoimmune diseases. 9 It has a high degree of affinity for BTK and achieves a long duration of action due to its slow off‐rate from BTK, resulting in prolonged target occupancy. 9 Moreover, high specificity of rilzabrutinib offers the potential to provide efficacy and helps to minimize the adverse effects caused by off‐target nonspecific binding. 10 Currently, one phase III randomized controlled trial (NCT04562766) and five phase II randomized trials (NCT04520451, NCT05104892, NCT05018806, NCT05107115, and NCT05002777) of rilzabrutinib are ongoing.
Rilzabrutinib was well‐tolerated in healthy adult volunteers that demonstrated acceptable safety profile. 11 , 12 Following multiple dosing with liquid or tablet formulation, rilzabrutinib demonstrated a large volume of distribution and a median accumulation ratio of 1.4–1.6 with twice daily (b.i.d.) dosing, a mean half‐life of ~3–4 h, and greater than 90% BTK occupancy within 4 h of dosing. 11 The time to maximum observed plasma concentration (T max) ranged from 0.5 to 2.5 h across studies. To understand the mass balance, routes of excretion and absolute bioavailability of rilzabrutinib in the ongoing development program, we conducted this study to (1) evaluate the absolute oral bioavailability of rilzabrutinib (part 1), and (2) characterize the absorption, metabolism, and excretion of 14C‐radiolabeled rilzabrutinib (part 2) in healthy male participants.
METHODS
Participants
Healthy male subjects, aged 18–60 years, and with a body mass index between 18 and 35 kg/m2, were screened for eligibility to participate in the study within 28 days before dosing and were admitted to the clinical unit on the day prior to dosing (day −1). All participants provided written informed consent before the initiation of the study. The study protocol and consent forms were approved by the Radiation Safety Committee/Radioactive Drug Research Committee. The study was conducted in accordance with the principles of the Declaration of Helsinki and in compliance with the International Council for Harmonization E6 Guideline for Good Clinical Practice.
Study design
This was a single‐center, open‐label, non‐randomized, two‐part, phase I study in healthy male subjects. In both parts 1 and 2, following eligibility screening, participants were admitted to the study center on the day prior to dosing. In part 1, the study phase was from day 1 up to a maximum of day 4. In part 2, the study phase was from day 1 up to a maximum of day 8, with final assessments up to day 28 depending on subject status. In part 2, all 10 subjects remained on site for at least 7 days postdose and were discharged from the clinic if the following two criteria were met on the morning of day 8: a mass balance cumulative recovery of greater than 90%, and a mean of less than 1% of the dose administered collected in combined excreta on three consecutive 24‐h periods, collection of all samples (blood, urine, and feces) were stopped and the subject underwent discharge assessments. If both discharge criteria were not achieved by the morning of day 8, the subject remained in the clinical unit for further collections until both criteria were met, or until day 14 (whichever occurred first) when the subject was discharged. Subjects who did not meet the discharge criteria were required to return to the clinic for “outpatient visits” where a 24‐h collection of urine and/or feces was done on day 28 ± 2 (Figure S1).
Study treatments
In part 1, on the morning of day 1 (after an overnight 10‐h fast), subjects (N = 8) received single oral dose of 400 mg rilzabrutinib tablet (immediate release) with 240 mL water, and an i.v. microtracer dose of [14C]‐rilzabrutinib (100 μg in ~2 mL) containing ~37.0 kBq (~1 μCi) [14C], administered as an i.v. push over an ~2‐min period at 120 min post‐administration of the single oral tablet dose (T max for the oral tablet), to assess absolute bioavailability. Subjects remained on site until the morning of day 4.
In part 2, on the morning of day 1 (after an overnight 10‐h fast), all subjects (N = 10) received a single oral dose of 300 mg in ~100 mL [14C]‐rilzabrutinib solution containing ~37.0 MBq (~1000 μCi) [14C] which was swallowed within ~3 min, to determine the absorption, metabolic pathways, and routes of elimination of rilzabrutinib. The [14C]‐rilzabrutinib oral dose was consumed with ~240 (±20) mL water. In part 2, 300 mg liquid formulation of rilzabrutinib was used based on the previous bioavailability study (PRN1008‐006, unpublished data) that demonstrated comparable pharmacokinetic (PK) exposure of rilzabrutinib after administration of 300 mg oral solution and 400 mg tablet formulation of rilzabrutinib. Moreover, the 1000 μCi [14C]‐rilzabrutinib dose was selected because of its relatively low radiological safety risk based on pigmented animal dosimetry data (unpublished data).
Study objectives
Objectives of part 1 were to (1) determine oral absolute bioavailability of rilzabrutinib, and to (2) characterize the i.v. PKs of [14C]‐rilzabrutinib. The primary objectives of part 2 were to (1) determine rates and routes of elimination of [14C]‐rilzabrutinib, including mass balance recovery of total drug‐related radioactivity in excreta (urine and feces); and (2) assess the PKs of rilzabrutinib and total radioactivity following oral administration. Safety and tolerability of rilzabrutinib in healthy male subjects was assessed throughout the study period in part 1 and part 2. Adverse event coding was performed using the Medical Dictionary for Regulatory Activities version 22.0.
Sample collection
In part 1, plasma samples were collected to determine the concentrations of rilzabrutinib and [14C]‐rilzabrutinib. The collection schedule for whole blood and plasma is shown in Table S1. In part 2, plasma samples were collected to determine the concentrations of rilzabrutinib, and total radioactivity (plasma and whole blood). Three of the 10 subjects were assigned to bile collection and it was collected through a nasogastric tube, which was placed following dosing to the bile duct opening. Bile samples were collected starting from 3 h postdose to 8 h postdose by continuous suction procedure and analyzed for total radioactivity and unchanged rilzabrutinib. A 20 ng/kg i.v. dose of Kinevac (sincalide) was administered ~7 h postdose to stimulate gallbladder contraction. Continuous urine and fecal samples were also collected, and analyzed for total radioactivity, and to determine the concentrations of unchanged rilzabrutinib (urine only). A key schedule of assessments and blood samples for laboratory safety tests were collected, as outlined in the Table S1 for both part 1 and part 2.
Pharmacokinetic assessments
Plasma and urine concentrations of rilzabrutinib were determined using a validated analytical procedure. Acetonitrile precipitation and high‐performance liquid‐chromatography tandem mass spectrometry methods were used to determine the concentration of rilzabrutinib from K2 EDTA plasma and urine. A calibration curve ranging from 0.100 to 100 ng/mL and 1.00 to 1000 ng/mL was used to quantify rilzabrutinib in the plasma and urine samples, respectively. Total radioactivity from whole blood, plasma, urine, bile, and feces were determined with liquid scintillation counting. PK parameters were determined from plasma and urine concentrations of rilzabrutinib, as well as whole blood, plasma, urine, bile, and feces total radioactivity (part 2 only). Collected data were analyzed via noncompartmental analysis using Phoenix WinNonlin (Certara USA, Inc.) version 8.1.
In part 1, the following PK parameters were calculated for each subject based on the plasma concentrations of orally administered rilzabrutinib and i.v. administered [14C]‐rilzabrutinib: maximum observed plasma concentration (C max), T max, area under the plasma concentration‐time curve from time 0 to the last quantifiable concentration (AUC0–last), area under the plasma concentration‐time curve from time zero extrapolated to infinity (AUC0–inf), terminal elimination half‐life (t 1/2), total clearance (CL for [14C]‐rilzabrutinib only), and volume of distribution (Vz for [14C]‐rilzabrutinib only). AUC was calculated using the linear trapezoidal rule for increasing concentrations and the logarithmic rule for decreasing concentrations.
In part 2, the following PK parameters were determined for each subject from the plasma concentrations of rilzabrutinib, and whole blood and plasma total radioactivity: C max, T max, AUC0–last, AUC0–inf, t 1/2, apparent total plasma clearance (CL/F), apparent volume of distribution during the terminal elimination phase (V z/F), AUC0–last blood/plasma ratio (AUC0–last of total radioactivity in whole blood/AUC0–last of total radioactivity in plasma), and AUC0–last plasma rilzabrutinib/total radioactivity ratio (AUC0–last of rilzabrutinib in plasma/AUC0–last of total radioactivity in plasma). In part 2, the following PK parameters were also calculated for each subject, based on the concentrations of rilzabrutinib in urine: amount excreted in urine per sampling interval (A eu), cumulative amount excreted in urine (Cum A eu), renal clearance (CLR, where CLR = Cum A eu/AUC0–inf or AUC over a common time point between urine and plasma sample), percentage of dose excreted in urine (f eu), and cumulative percentage of dose excreted in urine (Cum f eu).
Statistical analysis
Based on experience from previous studies of a similar design, a total of 18 subjects (8 in part 1 and 10 in part 2) with a minimum of six evaluable subjects for part 1 and eight for part 2, were considered sufficient. No formal sample size calculation was performed. The safety population included all subjects who received at least one dose of rilzabrutinib. The PK population included all subjects who received a dose of rilzabrutinib and provided at least one evaluable concentration for PK analysis.
In part 1, to quantify the absolute bioavailability of rilzabrutinib, a mixed‐effect analysis of variance model was applied to the log‐transformed dose‐normalized (DN) AUC0–last and AUC0–inf of rilzabrutinib obtained after oral dosing and that of the i.v. administered [14C]‐rilzabrutinib. The model contained formulation (oral or i.v.) as a fixed effect and subject as a random effect. The absolute bioavailability was expressed as the geometric least squares mean (GLSM) ratio of the formulations (oral or i.v.) along with its corresponding 90% confidence interval (CI).
In part 2, no formal statistical analyses were performed. All PK parameters and concentrations for rilzabrutinib, [14C]‐rilzabrutinib, and total radioactivity in plasma and whole blood were summarized descriptively. Plasma concentrations of rilzabrutinib, [14C]‐rilzabrutinib, and total radioactivity in plasma and whole blood were graphically represented with an arithmetic mean (±standard deviation [SD]) plot.
RESULTS
Overall, 18 subjects completed the study; eight subjects were dosed in part 1 and 10 were dosed in part 2. No subjects discontinued from the study. Demographic characteristics of subjects in parts 1 and 2 were mostly similar (Table 1).
TABLE 1.
Demographics characteristics (PK and safety population).
| Part 1 | Part 2 | |
|---|---|---|
| (N = 8) | (N = 10) | |
| Age (years), mean (SD) | 37.3 (10.44) | 41.2 (10.12) |
| Race, n (%) | ||
| White | 5 (62.5%) | 6 (60.0%) |
| Black/African American | 2 (25.0%) | 3 (30.0%) |
| Asian | 1 (12.5%) | – |
| Mixed | – | 1 (10.0%) |
| Ethnicity, n (%) | ||
| Not Hispanic or Latino | 8 (100.0%) | 9 (90.0%) |
| Hispanic or Latino | – | 1 (10.0%) |
| Height (cm), mean (SD) | 179.49 (10.158) | 177.28 (8.534) |
| Body weight (kg), mean (SD) | 87.78 (12.780) | 82.11 (14.224) |
| Body mass index (kg/m2), mean (SD) | 27.26 (3.351) | 26.04 (3.686) |
Note: For continuous data, mean (SD) statistics presented; for categorical data, n (%) statistics presented. Body mass index (kg/m2) = body weight (kg)/height (m)2.
Abbreviations: N, number of subjects; n, number of subjects with valid observations; PK, pharmacokinetic; SD, standard deviation.
In part 1, all eight subjects were included in the PK population. Arithmetic mean (+SD) concentration profiles of rilzabrutinib (oral dosing) and [14C]‐rilzabrutinib (i.v. dosing) in plasma are presented in Figure 1. A summary of PK parameters for rilzabrutinib and [14C]‐rilzabrutinib in plasma (part 1) is provided in Table 2. Following the administration of a single oral dose, rilzabrutinib was rapidly absorbed and eliminated, with a median T max (range) of 2.03 h (1.83–2.50 h) postdose and a geometric mean t 1/2 (coefficient of variation [CV%]) of 3.20 (51.0%) hours. Individual t 1/2 values ranged from 1.41 to 6.98 h. Following the i.v. administration of a single microtracer dose of [14C]‐rilzabrutinib, the plasma concentrations of [14C]‐rilzabrutinib rapidly declined with a geometric mean (CV%) t 1/2 value of 1.78 (37.6%) h. Individual t 1/2 values ranged from 1.32 to 3.78 h. The geometric mean (CV%) V z following i.v. dosing was 149 L (28.4%). High between‐subject variability was observed in geometric mean C max, AUC0–last, and AUC0–inf values after oral dosing of rilzabrutinib, with CV% ranging from 62.2% to 72.7%. Low to moderate between‐subject variability was observed in geometric mean C max, AUC0–last, and AUC0–inf after i.v. dosing of [14C]‐rilzabrutinib, with CV% ranging from 21.5% to 43.5%. Rilzabrutinib absorption, based on the DN AUC parameters, was lower for the tablet formulation than for the i.v. formulation. The GLSM ratios (90% CI) for DN AUC0–last and DN AUC0–inf between the tablet and i.v. formulations were 0.0473 (0.0315, 0.0713) and 0.0471 (0.0314, 0.0707), respectively (Table 2). Within‐subject CV% values were 45.3% and 45.0% for DN AUC0–last and DN AUC0–inf, respectively.
FIGURE 1.

Arithmetic mean (+SD) plasma concentration profiles of rilzabrutinib (oral dosing) (a) Linear scale, (c) semilogarithmic scale and [14C]‐rilzabrutinib (i.v. dosing), (b) linear scale (d) semilogarithmic scale in part 1 (pharmacokinetic population).
TABLE 2.
Summary of the PK parameters (part 1, PK population).
| 400 mg rilzabrutinib oral | 100 μg [14C]‐rilzabrutinib i.v. | |
|---|---|---|
| Test | Reference | |
| (N = 8) | (N = 8) | |
| C max (ng/mL) | 108 (72.7) [n = 8] | NA |
| C max (pg/mL) | NA | 5270 (43.5) [n = 8] a |
| T max (h) | 2.03 (1.83–2.50) [n = 8] | 0.0583 (0.0333–0.0833) [n = 8] a |
| AUC0–last (h ng/mL) | 334 (62.7) [n = 8] | NA |
| AUC0–last (h pg/mL) | NA | 1880 (22.2) [n = 8] |
| DN AUC0–last (h ng/mL/mg) | 0.835 (62.7) [n = 8] | 17.6 (22.3) [n = 8] |
| AUC0–inf (h ng/mL) | 336 (62.2) [n = 8] | NA |
| AUC0–inf (h pg/mL) | NA | 1830 (21.5) [n = 7] |
| DN AUC0–inf (h ng/mL/mg) | 0.839 (62.2) [n = 8] | 17.2 (21.7) [n = 7] |
| t 1/2 (h) | 3.20 (51.0) [n = 8] | 1.78 (37.6) [n = 7] |
| CL (L/h) | NA | 58.1 (21.7) [n = 7] |
| V z (L) | NA | 149 (28.4) [n = 7] |
| DN AUC0–last (h ng/mL/mg), GLSM | 0.835 | 17.6 |
| Test versus reference ratio of GLSMs (90% CI) [Within‐subject CV%] | 0.0473 (0.0315, 0.0713) [45.3] | |
| DN AUC0–inf (h ng/mL/mg), GLSM | 0.839 | 17.8 |
| Test versus reference Ratio of GLSMs (90% CI) [Within‐subject CV%] | 0.0471 (0.0314, 0.0707) [45.0] | |
Abbreviations: AUC0–inf, area under the concentration‐time curve from time zero extrapolated to infinity; AUC0–last, area under the concentration‐time curve from time 0 to the last quantifiable concentration; CI, confidence interval; CL, total clearance; C max, maximum observed concentration; CV, coefficient of variation (%); DN, dose normalized; F, absolute bioavailability; GLSM, geometric least squares mean; IV, intravenous; Model: ln(parameter), treatment + subject + random error, where subject is fitted as a random effect; N, number of subjects; n, number of subjects with valid observations; NA, not applicable; PK, pharmacokinetic; t 1/2, terminal elimination half‐life; T max, time of maximum observed concentration; V z, volume of distribution. Geometric mean (CV) [n] statistics presented; for T max, median (min‐max) [n] statistics presented. The estimates of GLSMs and their ratios were obtained by taking the exponential of the corresponding estimates of least‐squares means and their differences on the natural log (ln) scale.
The i.v. microtracer dose was administered as an i.v. push over an ~2‐min period, and the C max reported is the extrapolated rilzabrutinib concentration at the end of the push, and T max is the end of the i.v. push.
In part 2, all 10 subjects were assessed for PKs. The arithmetic mean concentration profiles for rilzabrutinib in plasma and total radioactivity in plasma and whole blood are presented in Figure 2. Summaries of the PK parameters for rilzabrutinib and total radioactivity are presented in Table 3 and 4, respectively. Following the oral administration of [14C]‐rilzabrutinib, it was absorbed rapidly into the systemic circulation, with a median T max of 1.00 h in plasma. After reaching C max, plasma concentrations appeared to have declined in a biphasic manner, with a geometric mean (CV%) t 1/2 of 2.45 (69.4%) h (individual range: 1.24–8.98 h; Table 3). The between‐subject variability in plasma for rilzabrutinib AUC0–inf and C max, as assessed from the CV%, was high with respective values of 99.1% and 112.9%. The maximal levels of total radioactivity in plasma and blood were reached later compared to unchanged rilzabrutinib, with a median T max of 3.50 h postdose for both plasma and blood total radioactivity, and individual estimates ranged from 2.00 to 24.0 h postdose for both. Levels of total radioactivity in plasma appeared to decline in a biphasic manner with a geometric mean t 1/2 of 182 h, and individual estimates ranging from 141 to 235 h. A similar decline in blood total radioactivity occurred, with a mean t 1/2 of 176 h and individual estimates ranging from 151 to 245 h (Table 4). The mean whole blood/plasma ratio for total radioactivity was ~0.786 for AUC0–last, indicating a slightly lower association of radioactivity with red blood cells than plasma. The variability of total radioactivity in plasma and whole blood was lower than that of rilzabrutinib exposure, with respective geometric CV% for AUC0–last and C max being 22.7% and 17.6% in plasma, and 23.7% and 17.0% in whole blood (Table 4).
FIGURE 2.
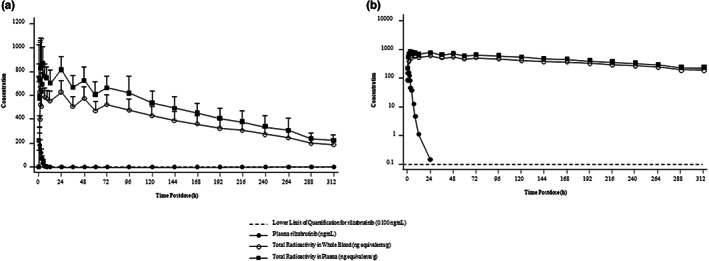
Arithmetic mean (+SD) pharmacokinetic (PK) concentration‐time profiles. (a) Linear scale (b) semilogarithmic scale – part 2 (PK population).
TABLE 3.
Summary of rilzabrutinib PK parameters in plasma in part 2 (PK population).
| 300 mg [14C]‐rilzabrutinib oral | |
|---|---|
| [Plasma] | |
| (N = 10) | |
| C max (ng/mL) | 137 (112.9) [n = 8] |
| T max (h) | 1.00 (1.00–2.00) [n = 8] |
| AUC0–last (h ng/mL) | 332 (99.4) [n = 8] |
| AUC0–inf (h ng/mL) | 333 (99.1) [n = 8] |
| t 1/2 (h) | 2.45 (69.4) [n = 10] |
| CL/F (L/h) | 904 (99.2) [n = 8] |
Abbreviations: AUC0–inf, area under the concentration‐time curve from time zero extrapolated to infinity; AUC0–last, area under the concentration‐time curve from time 0 to the last quantifiable concentration; CL/F, apparent total clearance; C max, maximum observed concentration; N, number of subjects; n, number of subjects with valid observations; PK, pharmacokinetic; t 1/2, terminal elimination half‐life; T max, time of maximum observed concentration. Geometric mean (CV) [n] statistics presented; for T max, median (min‐max) [n] statistics presented.
TABLE 4.
Summary of total radioactivity PK parameters in part 2 (PK population).
| 300 mg [14C]‐rilzabrutinib oral | 300 mg [14C]‐rilzabrutinib oral | |
|---|---|---|
| [Plasma] | [Blood] | |
| (N = 10) | (N = 10) | |
| C max (ng equivalents/g) | 920 (17.6) [n = 8] | 674 (17.0) [n = 8] |
| T max (h) | 3.50 (2.00–24.0) [n = 8] | 3.50 (2.00–24.0) [n = 8] |
| AUC0–last (h ng equivalents/g) | 131,300 (22.7) [n = 8] | 103,200 (23.7) [n = 8] |
| t 1/2 (h) | 182 (18.3) [n = 10] | 176 (15.1) [n = 10] |
| AUC0–last Blood/plasma ratio | NA | 0.786 (3.0) [n = 8] |
| AUC0–last plasma rilzabrutinib/total radioactivity ratio | 0.00253 (87.1) [n = 8] | NA |
Note: Geometric mean (CV) [n] statistics presented; for T max, median (min–max) [n] statistics presented.
Abbreviations: AUC0–last, area under the concentration‐time curve from time 0 to the last quantifiable concentration; C max, maximum observed concentration; n, number of subjects with valid observations; N, number of subjects; NA, not applicable; PK, pharmacokinetic; t 1/2, terminal elimination half‐life; T max, time of maximum observed concentration.
For bile collection, one of the three subjects planned for bile collection in part 2 was unable to tolerate nasoduodenal (ND) tube placement, therefore, only two subjects had bile collected. The mean cumulative percentages of administered radioactivity recovered in urine and feces in non‐bile collection subjects and bile collection subjects are presented in Figure S2.
For non‐bile collection subjects, a mean of 87.0% of the administered radioactivity was recovered in feces and 5.25% was recovered in urine through the last collection interval. Most of the administered radioactivity (92.1%) was recovered within the first 168 h of dosing. For bile collection subjects, an average of 72.7% of the administered radioactivity was recovered in feces, 5.42% was recovered in urine, and 6.29% was recovered in bile through the last collection interval. Most of the administered radioactivity was recovered in the first 192 h postdose (87.1%). Two subjects in part 2 who underwent ND tube placement experienced vomiting at ~0.75‐ and 1‐h postdose, respectively, with recovery in vomitus being 6.23% and 5.27% of the radioactive dose, respectively. The overall mean recoveries of radioactivity in urine, bile (as applicable), feces, and vomitus samples were 92.9% (non‐bile subjects) and 87.6% (bile collection subjects) over the 312‐h study (or 28 days for 2 subjects). Recovery in individual non‐bile collection subjects ranged from 89.8% to 94.2%, and individual recoveries from bile collection subjects (n = 2) were 80.4% and 94.8%. For non‐bile collection subjects, the intervals with the highest rates of excretion were from 0 to 6 h postdose in urine and from 48 to 72 h postdose in feces. For bile collection subjects, the intervals with the highest rates of excretion were from 0 to 6 h postdose in urine and from 24 to 48 h postdose in feces.
A summary of cumulative PK excretion parameters is presented in Table 5. In all subjects, urinary excretion of rilzabrutinib was low; 3.02% of dose was recovered as unchanged drug, and the entire urinary elimination occurred within 0 to 24 h postdose. Geometric mean (CV%) CLR was 0.243 (49.3%) L/h.
TABLE 5.
Summary of cumulative unchanged rilzabrutinib PK excretion parameters in urine in part 2.
| Time interval | 300 mg [14C]‐rilzabrutinib oral | |
|---|---|---|
| A eu (mg) | 0–312 h | 0.0909 (61.3) [n = 10] |
| f eu (%) | 0–312 h | 0.0302 (61.4) [n = 10] |
Note: Geometric mean (CV) [n] statistics presented.
Abbreviations: A eu, amount excreted in urine per sampling interval; CV, coefficient of variation (%); f eu, percentage of dose excreted in urine; n, number of subjects with valid observations; PK, pharmacokinetic.
Safety results
No deaths, serious adverse events, or treatment emergent adverse events (TEAEs) leading to discontinuation were reported during either part of the study. In part 1, two of eight subjects (25%) experienced a total of three TEAEs, and six of 10 subjects (60%) in part 2 reported a total of 13 TEAEs. The most frequently reported system‐organ class of treatment related TEAEs was gastrointestinal disorders, reported in two subjects (25%) in part 1, and in six subjects (60%) in part 2. All these subjects experienced diarrhea which was considered treatment‐related, whereas other gastrointestinal TEAEs in part 2 included abdominal discomfort (2 [20%]), gastrointestinal sounds abnormal (2 [20%]), abdominal pain (1 [10%]), and nausea (1 [10%]). Two (20%) subjects in part 2 experienced procedural vomiting. Across the entire study, all TEAEs were mild in severity, except for one moderate TEAE (viral infection) that was assessed as not treatment related. No subject discontinued treatment or withdrew from the study due to an adverse event. In both parts of the study, there were no clinically significant findings from clinical laboratory evaluations, vital signs measurements, 12‐lead electrocardiogram assessments, or physical examinations during the study. A summary of TEAEs (safety populations are presented in Table S2).
DISCUSSION
In the present study, rilzabrutinib was rapidly absorbed and eliminated following a single oral dose of rilzabrutinib 400 mg tablet, and a single oral dose of 300 mg [14C]‐rilzabrutinib solution (which is approximately equivalent to 400 mg tablet formulation). There was a 1 h delay in T max for tablet formulation as compared to liquid formulation. Earlier reports showed the T max ranged from 1 to 1.5 h with liquid formulation of rilzabrutinib 50 to 300 mg. 11 Our finding for liquid formulation of rilzabrutinib (300 mg) is consistent with a previous phase I trial of rilzabrutinib. 11 In part 1, following i.v. administration of a single microtracer dose of ~100 μg [14C]‐rilzabrutinib (~1 μCi), the C max of [14C]‐rilzabrutinib was observed within 5 min of starting the i.v. push, after which the plasma concentrations of [14C]‐rilzabrutinib rapidly declined with a geometric mean (CV%) t 1/2 value of 1.78 (37.6%) h. Rilzabrutinib PK exposure, based on the DN AUC parameters, was lower for the tablet formulation than for the i.v. formulation; GLSM ratios (90% CI) for DN AUC0–last and DN AUC0–inf between the tablet and i.v. formulations were 0.0473 (0.0315, 0.0713) and 0.0471 (0.0314, 0.0707), respectively. These results should be interpreted with caution given that within‐subject variability was moderate (45.3% and 45% for DN AUC0–last and DN AUC0–inf, respectively). Geometric mean (CV%) V z following i.v. dosing was 149 L (28.4%), which was greater than total body water of a 70 kg human (42 L), 13 suggesting that rilzabrutinib is widely distributed following i.v. administration. CL after i.v. administration (part 1) is 58.1 L/h, whereas CL/F after oral administration (part 2) is 904 L/h, indicating the low oral bioavailability of rilzabrutinib as well (F = 0.064), which is consistent with the conclusion from part 1. The number is close to the part 1 estimated absolute bioavailability of 0.0471 (based on AUC0–inf) and 0.0473 (based on AUC0–last), with the slight difference mainly due to PK variability between the two parts. Knowing the hepatic blood flow (Q hep) for a 70 kg human is 1500 mL/min, 14 assuming all non‐renal clearance is hepatic clearance, the hepatic bioavailability (F h) of rilzabrutinib is calculated to be 38%, indicating rilzabrutinib is a moderate‐to‐high hepatic extraction drug. Assuming absorption fraction (F a, prior to any first pass metabolism) of 1, gut bioavailability (F g) is calculated to be 0.124.
In part 2, rilzabrutinib was characterized by a rapid elimination phase, with a geometric mean t 1/2 of 2.45 h in plasma. The maximal levels of total radioactivity in plasma and blood peaked after rilzabrutinib T max and elimination was much slower; the geometric mean t 1/2 values of total radioactivity in plasma and blood were 182 and 176 h, respectively. This slower elimination of total radioactivity compared with rilzabrutinib suggests the presence of circulating metabolites of rilzabrutinib. For radioactivity in blood and plasma, all subjects had a t 1/2 calculated over a span of time less than two times the resulting t 1/2; thus, AUC0–inf could not be calculated for total radioactivity. The mean whole blood/plasma ratio for the total radioactivity was 0.786 for AUC0–last, indicating lower association of radioactivity with red blood cells than plasma. The mean AUC0–last for rilzabrutinib in plasma was less than 1% of that for total radioactivity in plasma, suggesting that metabolites contribute mainly toward the circulating total radioactivity in plasma. The circulating metabolite was identified further to be an endogenous compound thiocyanate. The fluctuation of the plasma and whole blood total radioactivity is likely driven by fluctuation of endogenous thiocyanate, which could be sourced from diet. 15 In the mass balance and excretion portion of part 2, following oral dosing, the primary route of elimination of total radioactivity was in the feces; for non‐bile collection subjects, a mean of 87.0% of the administered radioactivity was recovered in feces and 5.25% was recovered in urine. Most of the administered radioactivity was recovered within the first 168 h of dosing (92.1%). For bile collection subjects, a mean of 72.7% of the administered radioactivity was recovered in feces, 5.42% was recovered in urine, and 6.29% was recovered in bile. Most of the administered radioactivity was recovered in the first 192 h postdose (87.1%).
Two subjects in part 2 who underwent ND tube placement experienced vomiting. Despite losing ~5%–6% of the dose within less than two times the median T max, the exposure parameters for these subjects were not the lowest among all subjects and were not outliers. Given the exploratory nature of the absorption, metabolism, and excretion (AME) study, as well as the dose in vomitus being accounted for as an elimination route, blood and plasma concentrations, PK parameters, and CLR for these subjects were flagged and included in statistics.
The similar levels of rilzabrutinib in feces of both bile‐collecting and non‐collecting participants with small amount detected in bile indicates that there is a large amount of rilzabrutinib that does not undergo hepatic metabolism either from presystemic or systemic route. It could be either because rilzabrutinib is not fully dissolved or permeated into the gut wall, or it experienced high extra‐hepatic metabolism. Rilzabrutinib is a moderately permeable compound with an apparent permeability of 1.7 × 10⁻⁶ cm/s at 1 μM in Caco‐2 cells. The solubility of rilzabrutinib is pH‐dependent with high solubility under acidic pH (>120 mg/mL) and low solubility under neutral pH (0.04 mg/mL). At clinically relevant dose (400 mg), the dissolution and permeation may not be complete, and besides the gut metabolism by CYP3A (rilzabrutinib is a substrate of CYP3A), it also undergoes high gut flora metabolism based on in vitro studies (unpublished data). The detailed characterization of rilzabrutinib absorption is planned to be further studied in physiologically‐based PK model as future work.
Rilzabrutinib was well‐tolerated in both parts of the study, with an acceptable TEAE profile in healthy male subjects. The majority of TEAEs were gastrointestinal disorders, which is consistent with previous studies. 11 , 12 As this study was conducted in healthy male participants, the results may not necessarily extrapolate to women or patients with autoimmune and inflammatory diseases.
In conclusion, the results of this study advance our understanding of the absolute bioavailability and AME of rilzabrutinib and can help inform its further investigation. Rilzabrutinib is mainly cleared by metabolic enzymes and CLR plays a negligible role in the disposition of the parent compound. Recovery of radioactivity was nearly complete (92.1%) in a week following single dose oral administration. Results indicate high systemic clearance, and presence of circulating metabolite(s). The PK characteristics of rilzabrutinib elucidated in this study may support the further investigation of this BTK inhibitor for the treatment of patients with autoimmune and inflammatory diseases.
AUTHOR CONTRIBUTIONS
M.L., S.U., P.F.S., P.N., L.L., F.L., H.Y., J.W., J.S., and K.A.C. wrote the manuscript. S.U., P.F.S., and P.N. designed the research. L.L. performed the research. S.U. and J.S. analyzed the data. F.L., H.Y., J.W., and K.C. contributed new reagents/analytical tools.
FUNDING INFORMATION
The study was funded by Sanofi.
CONFLICT OF INTEREST STATEMENT
S.U., P.N., J.S., L.L., and J.W. were employees of Principia at the time of the execution of the study and had stock investment from the company. P.F.S. is an employee of Certara and has stock investment from the company. F.L., H.Y., and K.C. are employees of Principia Biopharma (Sanofi company) and have stock investment from the company. M.L. was an employee of Sanofi at the time of the execution of the study and had stock investment from the company.
Supporting information
Figure S1
Figure S2
Table S1
ACKNOWLEDGMENTS
The authors thank Dr Irene Mirkin, MD (Covance), Dr Mirkin, and Mr Chris Resburg (Aditum B, a biotech company) for assistance in clinical operations. The authors also thank Rakesh Ojha, PhD, and Pankaj Kothavade, PhD, from Sanofi for medical writing support. Jin Shu is currently an employee of BridgeBio Pharma, Palo Alto, CA. Philip Nunn is currently an employee of Alumis Inc., California, United States. Sibel Ucpinar is formerly a Principia/Sanofi employee.
Ucpinar S, Smith PF, Long L, et al. Rilzabrutinib, a reversible covalent Bruton's tyrosine kinase inhibitor: Absorption, metabolism, excretion, and absolute bioavailability in healthy participants. Clin Transl Sci. 2023;16:1210‐1219. doi: 10.1111/cts.13524
REFERENCES
- 1. Ng YS, Wardemann H, Chelnis J, Cunningham‐Rundles C, Meffre E. Bruton's tyrosine kinase is essential for human B cell tolerance. J Exp Med. 2004;200:927‐934. doi: 10.1084/jem.20040920 [DOI] [PMC free article] [PubMed] [Google Scholar]
- 2. Pal Singh S, Dammeijer F, Hendriks RW. Role of Bruton's tyrosine kinase in B cells and malignancies. Mol Cancer. 2018;17:57. doi: 10.1186/s12943-018-0779-z [DOI] [PMC free article] [PubMed] [Google Scholar]
- 3. Hata D, Kawakami Y, Inagaki N, et al. Involvement of Bruton's tyrosine kinase in FcεRI‐dependent mast cell degranulation and cytokine production. J Exp Med. 1998;187:1235‐1247. doi: 10.1084/jem.187.8.1235 [DOI] [PMC free article] [PubMed] [Google Scholar]
- 4. Crofford LJ, Nyhoff LE, Sheehan JH, Kendall PL. The role of Bruton's tyrosine kinase in autoimmunity and implications for therapy. Expert Rev Clin Immunol. 2016;12:763‐773. doi: 10.1586/1744666X.2016.1152888 [DOI] [PMC free article] [PubMed] [Google Scholar]
- 5. di Paolo JA, Huang T, Balazs M, et al. Specific Btk inhibition suppresses B cell‐ and myeloid cell‐mediated arthritis. Nat Chem Biol. 2011;7:41‐50. doi: 10.1038/nchembio.481 [DOI] [PubMed] [Google Scholar]
- 6. López‐Herrera G, Vargas‐Hernández A, González‐Serrano ME, et al. Bruton's tyrosine kinase – an integral protein of B cell development that also has an essential role in the innate immune system. J Leukoc Biol. 2014;95:243‐250. doi: 10.1189/jlb.0513307 [DOI] [PubMed] [Google Scholar]
- 7. McAtee CP. The many faces of Bruton's tyrosine kinase. Nat Biotechnol. 2012;30:394. doi: 10.1038/nbt.2200 [DOI] [PubMed] [Google Scholar]
- 8. Pan Z. Bruton's tyrosine kinase as a drug discovery target. Drug News Perspect. 2008;21:357‐362. doi: 10.1358/dnp.2008.21.7.1255308 [DOI] [PubMed] [Google Scholar]
- 9. Bradshaw JM, McFarland JM, Paavilainen VO, et al. Prolonged and tunable residence time using reversible covalent kinase inhibitors. Nat Chem Biol. 2015;11:525‐531. doi: 10.1038/nchembio.1817 [DOI] [PMC free article] [PubMed] [Google Scholar]
- 10. Kuter DJ, Efraim M, Mayer J, et al. Rilzabrutinib, an oral BTK inhibitor, in immune thrombocytopenia. N Engl J Med. 2022;386:1421‐1431. doi: 10.1056/NEJMoa2110297 [DOI] [PubMed] [Google Scholar]
- 11. Smith PF, Krishnarajah J, Nunn PA, et al. A phase I trial of PRN1008, a novel reversible covalent inhibitor of Bruton's tyrosine kinase, in healthy volunteers. Br J Clin Pharmacol. 2017;83:2367‐2376. doi: 10.1111/bcp.13351 [DOI] [PMC free article] [PubMed] [Google Scholar]
- 12. Murrell DF, Patsatsi A, Stavropoulos P, et al. Proof of concept for the clinical effects of oral rilzabrutinib, the first Bruton tyrosine kinase inhibitor for pemphigus vulgaris: the phase II BELIEVE study. Br J Dermatol. 2021;185:745‐755. doi: 10.1111/bjd.20431 [DOI] [PMC free article] [PubMed] [Google Scholar]
- 13. Davies B, Morris T. Physiological parameters in laboratory animals and humans. Pharm Res. 1993;10:1093‐1095. doi: 10.1023/a:1018943613122 [DOI] [PubMed] [Google Scholar]
- 14. Tsunoda SM, Velez RL, von Moltke LL, Greenblatt DJ. Differentiation of intestinal and hepatic cytochrome P450 3A activity with use of midazolam as an in vivo probe: effect of ketoconazole. Clin Pharmacol Ther. 1999;66:461‐471. doi: 10.1016/S0009-9236(99)70009-3 [DOI] [PubMed] [Google Scholar]
- 15. Eminedoki DG, Monanu MO, Anosike EO. Thiocyanate levels of mainly dietary origin in serum and urine from a human population sample in Port Harcourt, Nigeria. Plant Foods Hum Nutr. 1994;46:277‐285. doi: 10.1007/BF01088426 [DOI] [PubMed] [Google Scholar]
Associated Data
This section collects any data citations, data availability statements, or supplementary materials included in this article.
Supplementary Materials
Figure S1
Figure S2
Table S1