Abstract
Purpose
To determine if acoustic radiation force impulse elastography-derived bowel wall shear wave velocity (SWV) allows distinction of acutely inflamed from fibrotic intestine in a Crohn disease animal model.
Materials and Methods
University Committee on the Use and Care of Animals approval was obtained. An acute inflammation Crohn disease model was produced by treating eight Lewis rats with a single administration of trinitrobenzenesulfonic acid (TNBS) enema, with imaging performed 2 days later in the surviving six rats. Colonic fibrosis in an additional eight Lewis rats was achieved by administering repeated TNBS enemas during 4 weeks, with imaging performed in the surviving seven rats 7 days later to allow acute inflammation resolution. Nine transcutaneous bowel wall SWV measurements were obtained from the colon in all rats without and with applied strain. Mean SWVs without and with applied strain were compared between animal cohorts by using the Student t test, and receiver operating characteristic (ROC) curves were created to assess diagnostic performance.
Results
Mean bowel wall SWVs were significantly higher for fibrotic versus acute inflammation cohort of rats at 0% (3.4 ± 1.1 vs 2.3 ± 0.5 m/sec; P = .047) and 30% (6.3 ± 2.2 vs 3.6 ± 0.9 m/sec; P = .02) applied strain. Both acute inflammation and fibrotic cohort of rats demonstrated linear increases in mean SWV with increasing applied strain, with significantly different mean slopes (P = .02) and y-intercepts (P = .02). The area under the ROC curve of the SWV ratio (mean SWV/applied strain) for differentiating histopathologically confirmed fibrotic from inflamed bowel was 0.971.
Conclusion
Bowel wall SWV helps distinguish acutely inflamed from fibrotic intestine in a Crohn disease animal model.
© RSNA, 2013
Introduction
Crohn disease is a relapsing and remitting form of transmural inflammatory bowel disease that affects the gastrointestinal tract of both children and adults (1). Fibrosis within the bowel wall as a response to inflammation occurs unpredictably in some Crohn disease patients with resultant stricture formation and bowel obstruction (2). While a variety of imaging tests can identify bowel wall hyperperfusion and active inflammation in Crohn disease, including contrast material–enhanced ultrasonography (US) (3–16), the distinction between inflammation and fibrosis can be difficult. Distinguishing active inflammation of the bowel wall from fibrosis is important as bowel segments that are abnormally narrowed due to active inflammation generally respond to medical therapy, whereas narrowed fibrotic bowel segments frequently require endoscopic dilatation or surgical management (17).
The overwhelming majority of investigations evaluating the radiologic assessment of inflammatory bowel disease lack an appropriate reference standard. This is because obtaining human full-thickness bowel wall tissue specimens for comparison with imaging findings is not possible, unless the subject happens to be undergoing clinically indicated surgery immediately after imaging. As a result, suboptimal reference standards such as endoscopic mucosal findings, superficial endoscopic biopsy results, surveys of patient symptoms, laboratory values, and a variety of imaging-related findings are commonly used (3–9,13). Study of an animal model of Crohn disease provides a more definitive reference standard for imaging tests to be compared against, namely, immediately resected full-thickness bowel wall tissue that allows for quantification of active inflammation and fibrosis at histopathologic examination.
US elasticity imaging is a noninvasive method for evaluating tissue hardness (18,19). In one method, shear waves are generated remotely by using an ultrasound transducer that produces an acoustic radiation force impulse (ARFI). The ARFI, or push pulse, displaces targeted tissue at a specified depth, and then the same transducer is used to track orthogonal shear waves as they propagate through the tissue of interest (19). The distance traveled by the generated shear wave per unit of time (µm/msec) provides an estimate of shear wave velocity (SWV). SWV, as well as values of Young and shear moduli (intrinsic measures of a material’s ability to resist deformation to shear and compression and/or tension, respectively), all increase with increasing material or tissue hardness (19).
ARFI elastography has been used to assess a variety of human tissues based on their biomechanical elastic properties, including liver (20–22), breast (23), and prostate (24). While recent studies have demonstrated promising results for discriminating inflamed from fibrotic bowel by using manual US elastography and speckle tracking (quasi-static strain imaging) (25,26), no study, to our knowledge, has investigated whether ARFI elastography–derived SWV can distinguish inflamed from fibrotic bowel segments in either an animal model or humans with Crohn disease. Major advantages of using SWV imaging compared with other forms of US elastography include its ease of use, quantitative nature, and reproducibility.
The purpose of our study was to determine if ARFI elastography–derived bowel wall SWV can be used to distinguish acutely inflamed from fibrotic bowel segments in an established Crohn disease animal model.
Materials and Methods
Siemens Medical Solutions (Mountain View, Calif) partially supported this investigator-initiated study. The SWV imaging technology used for our investigation was developed and validated by Siemens Medical Solutions, was made available for this study at no cost, and is currently awaiting U.S. Food and Drug Administration approval for clinical use. Siemens Medical Solutions also provided funding for a portion of the direct costs of this investigation. The authors had complete control of all data and information presented for publication. Appropriate University Committee on the Use and Care of Animals approval was obtained.
Study Cohorts and US Elastography Imaging
Sixteen female Lewis rats (Harlan, Indianapolis, Ind) received intrarectal administrations of trinitrobenzenesulfonic acid (TNBS) by using the method previously described by Kim et al (25). This intervention is known to cause rapid-onset active inflammation of the colon (acute colitis) and subsequent intestinal fibrosis, and it has been used in multiple prior studies as an animal model for Crohn disease (25,27). A single TNBS administration produces acute inflammation of the distal colon and rectum that peaks 2–3 days after enema and resolves after about 7 days. Weekly TNBS enema administration with escalating doses causes repeated cycles of intestinal inflammation and healing, yielding chronic colitis and bowel wall fibrosis by a similar mechanism to human Crohn disease. This model typically generates intestinal fibrosis after approximately 4 weeks.
Animals were randomly assigned to one of three treatment cohorts. Eight rats received a single TNBS enema as part of the acute inflammation cohort. Two of these rats died prior to imaging due to TNBS-induced bowel necrosis and associated perforation. Three days after TNBS exposure, abnormally thickened colonic bowel wall in the rectosigmoid junction region was assessed with US (n = 6). SWV imaging, which uses ARFI elastography technology to generate a quantitative color elasticity map of soft-tissue SWVs on a pixel-by-pixel basis (Virtual Touch IQ, Acuson S3000 US system/9L4 transducer; Siemens Medical Solutions, Mountain View, Calif), was used. Nine transcutaneous bowel wall SWV measurements (three anterior [12-o’clock position], three right lateral [9–10-o’clock position], and three left lateral [2–3-o’clock position]) with use of a 1.5 × 1.5-mm region of interest (ROI) were obtained from the rectosigmoid colonic wall in all rats without and with increasing amounts of applied strain.
Each SWV value obtained represents the average of 100 separate SWV samples from within the ROI. Arrows placed along the serosal surface of the intestine by using real-time gray-scale imaging immediately prior to SWV image acquisition were used to guide ROI placement within the bowel wall for SWV measurement. ROI placement within the bowel wall was based on consensus opinion of two radiologists (J.M.R., 34 years in US experience; J.R.D., 4 years of adult and pediatric abdominal imaging experience). A concerted effort was made to avoid ROI placement over structures other than the bowel wall, although it is conceivable that some ROIs included small amounts of pericolic soft tissue. The SWV imaging technology used utilizes multiple 5.71- MHz (when imaging at a depth ≤ 2 cm) or 4.44- MHz (when imaging at a depth > 2cm) “push pulses” and 6.15-MHz tracking beams.
Strain was applied to the rat abdomen as previously described by Kim et al (25) by using the ultrasound transducer and a purpose-built device to exert an extrinsic compressive force on the anterior abdominal wall (Fig 1). The amount of applied strain induced by this method was determined by measuring the distance between the skin of the anterior abdominal wall and a fixed osseous structure located posteriorly within the rat pelvis (eg, sacrum). Baseline or 0% applied strain was established by providing the minimum transducer pressure to the anterior abdominal wall required to create the necessary contact between the transducer and rat to generate a diagnostic image. Increasing amounts of strain were applied to the animal by decreasing the above distance. SWV measurements were acquired at 0%, as well as approximately 10%, 20%, 30%, and 40% for each rat. Ultrasound transducer output was below thermal and mechanical index thresholds established by the U.S. Food and Drug Administration.
Figure 1:
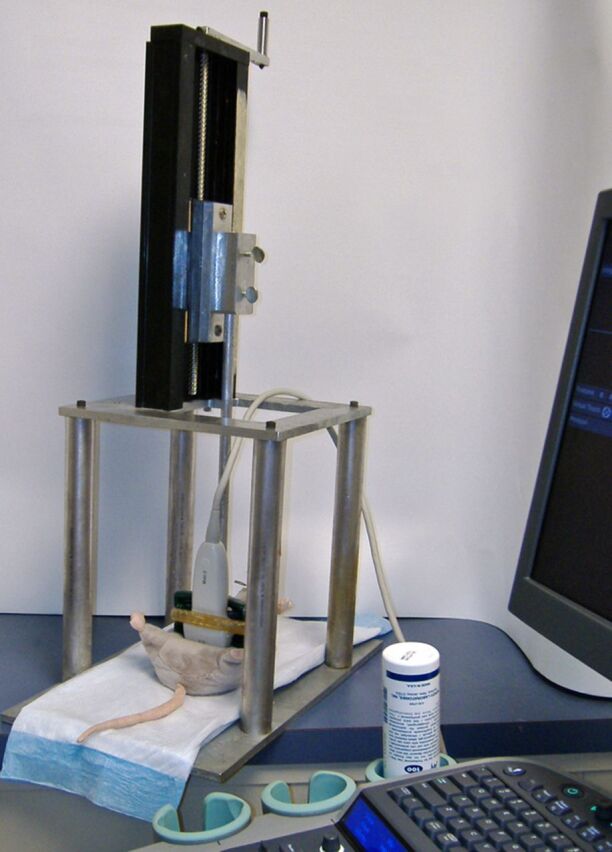
Purpose-built device used to exert external mechanical compression (applied strain) to anesthetized rat (rat model used in image). Increasing amounts of applied strain are achieved by increasing the force applied to the anterior abdominal wall by the ultrasound transducer.
A second cohort of eight rats received weekly cTNBS enemas during 4 weeks to promote chronic inflammation and deposition of intestinal fibrosis. One rat in this cohort died prior to imaging, again due to bowel necrosis and subsequent perforation. Seven days following the final enema, US SWV imaging of this cohort also was performed (n = 7), as described for the acute inflammation cohort. Bowel wall SWVs could not be accurately measured in multiple fibrotic rats when imaging with 40% applied strain, since they measured more than 10 m/sec (the SVI technology utilized in our study cannot accurately measure SWVs > 10 m/sec; SWV > 10 m/sec indicates marked tissue hardness).
A third cohort of three rats received repeated weekly phosphate-buffered saline enemas during a 4-week period and served as a negative control group. Attempts to image the colonic wall of these rats by using gray-scale US and SWV imaging were unsuccessful due to the absence of appreciable wall thickening.
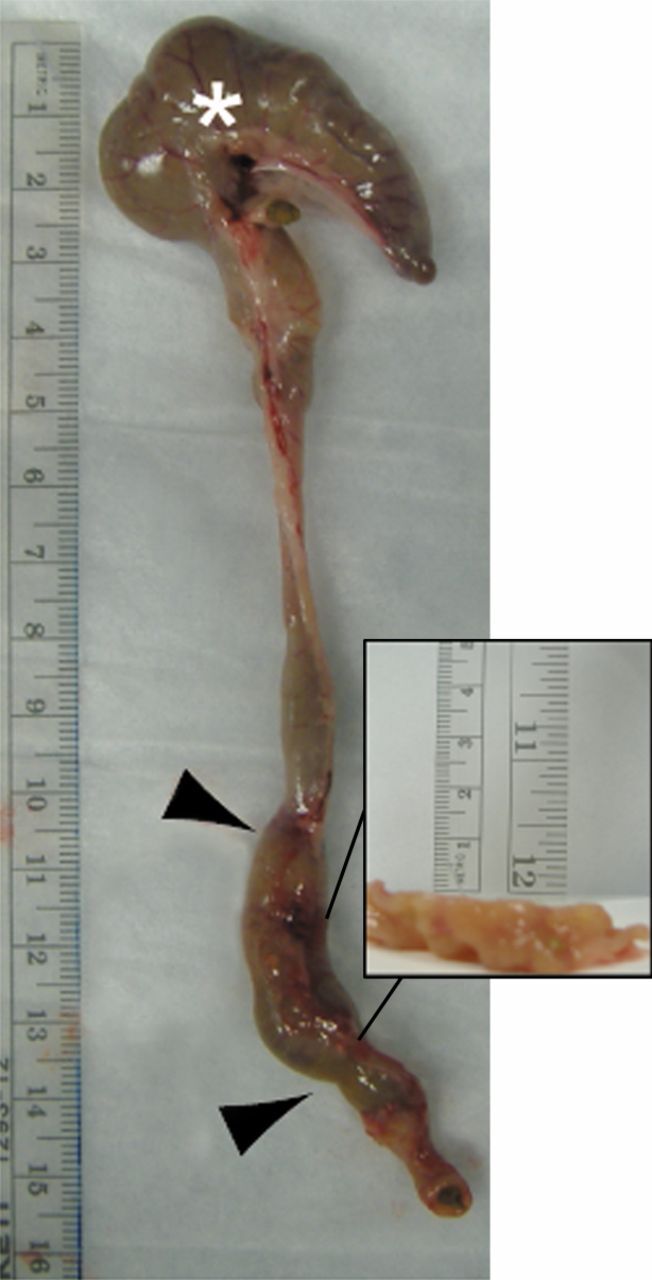
All rats were immediately euthanized following US imaging, and their colons were dissected. The gross appearance of the colons was documented with photography (Fig 2). Histopathologic analysis was performed by a gastrointestinal pathology fellow (D.S.M.), who was blinded to the treatment group, to grade the amounts of bowel wall active inflammation and fibrosis. Slides stained with hematoxylin-eosin and Masson trichrome were reviewed and previously described scoring systems were utilized (Table 1) (25,28,29).
Figure 2a:

Images illustrate gross appearance of rat colon in (a) acute inflammation cohort, (b) phosphate-buffered saline–negative control cohort, and (c) fibrotic cohort. In a, distal colon and rectum are thick walled and markedly inflamed (arrowheads), while more proximal colon, including the cecum (*), is normal. In b, the entire colon is normal, and fecal material is present within the mid and distal colon. In c, distal colon and rectum are thick walled (arrowheads) without appreciable inflammation. The more proximal colon is normal. Longitudinal section (inset) of the fibrotic region shows substantial bowel wall thickening.
Table 1.
Histologic Scoring System for Bowel Wall Acute Inflammation and Fibrosis in TNBS-treated Rat Crohn Disease Model
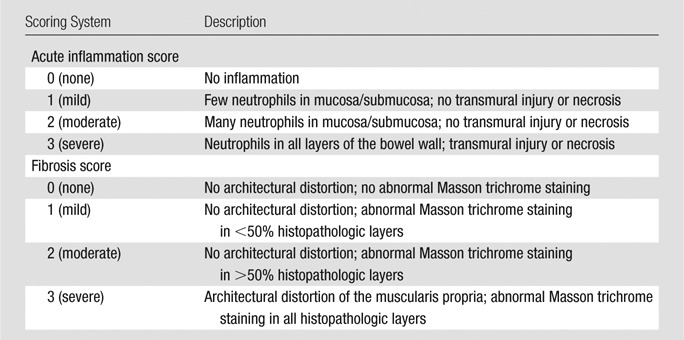
Figure 2b:

Images illustrate gross appearance of rat colon in (a) acute inflammation cohort, (b) phosphate-buffered saline–negative control cohort, and (c) fibrotic cohort. In a, distal colon and rectum are thick walled and markedly inflamed (arrowheads), while more proximal colon, including the cecum (*), is normal. In b, the entire colon is normal, and fecal material is present within the mid and distal colon. In c, distal colon and rectum are thick walled (arrowheads) without appreciable inflammation. The more proximal colon is normal. Longitudinal section (inset) of the fibrotic region shows substantial bowel wall thickening.
Figure 2c:
Images illustrate gross appearance of rat colon in (a) acute inflammation cohort, (b) phosphate-buffered saline–negative control cohort, and (c) fibrotic cohort. In a, distal colon and rectum are thick walled and markedly inflamed (arrowheads), while more proximal colon, including the cecum (*), is normal. In b, the entire colon is normal, and fecal material is present within the mid and distal colon. In c, distal colon and rectum are thick walled (arrowheads) without appreciable inflammation. The more proximal colon is normal. Longitudinal section (inset) of the fibrotic region shows substantial bowel wall thickening.
Statistical Analysis
Mean bowel wall SWVs and standard deviations were calculated and compared between the acute inflammation and fibrotic animal groups without and with applied strain on an intent-to-image basis by using the Student t test (two tailed, assuming unequal variances). Linear regression was used to assess changes in mean SWV with changes in applied strain for each cohort (with each animal contributing a single mean SWV measurement for a given applied strain), and the individual animal y-intercepts and slopes of the fit lines were compared (again by using the two-tailed Student t test, assuming unequal variances). On the basis of the significant relationship between SWV and applied strain, a SWV ratio was calculated as the mean SWV for a given amount of applied strain divided by the amount of applied strain. SWV ratios were calculated for each animal at 10% or greater applied strains. Receiver operating characteristic (ROC) curve analysis was performed to evaluate the diagnostic performance of absolute SWV at 0% and 30% applied strain and SWV ratio for discriminating bowel wall fibrosis from acute inflammation, and the area under the ROC curve was calculated.
Secondary (post hoc) analysis was performed after placing animals into two groups: group 1, actual inflamed: animals treated per the acute inflammation protocol with high inflammation scores (≥ 2) and low fibrosis scores (> 2) at histopathologic examination; and group 2, actual fibrotic: animals treated per the chronic fibrosis protocol with high fibrosis scores (≥2) at histopathologic examination. This post hoc analysis excluded three animals (one intended acute inflammation and two intended fibrotic) in which the model failed to produce the expected phenotype at colon histopathologic examination.
A P value of less than .05 was considered to indicate a significant difference. Analyses were performed by using Stata 12 software (StataCorp; College Station, Tex).
Results
Histopathologic Examination
Histopathologic review of the resected colons demonstrated that the five of six animals in the acute inflammation cohort exhibited changes of severe acute colitis, with no or minimal (grades 0–1) evidence of fibrosis. Four of six animals in the acute inflammation cohort had areas of intestinal necrosis; one animal had a suboptimal response to TNBS treatment and demonstrated no histologic evidence of bowel wall acute inflammation or fibrosis (although this animal did demonstrate bowel wall thickening at imaging and gross inspection).
Moderate to severe bowel wall fibrosis developed in five of seven rats in the fibrotic cohort. There was mild to severe (grades 1–3) superimposed acute inflammation remaining in five animals in the fibrotic cohort; two animals in this cohort had a suboptimal response to TNBS treatment, with no histopathologic evidence of bowel wall fibrosis or acute inflammation (wall thickening noted at imaging and gross examination was due to lymphocytic infiltration without fibrosis deposition).
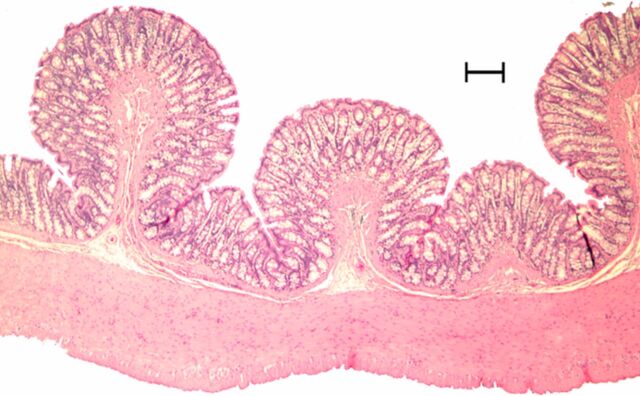
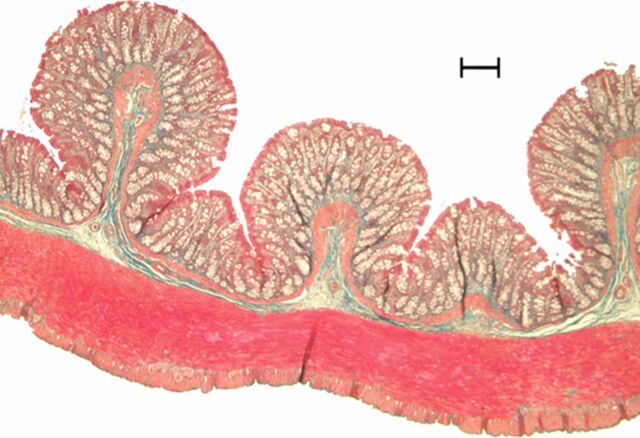
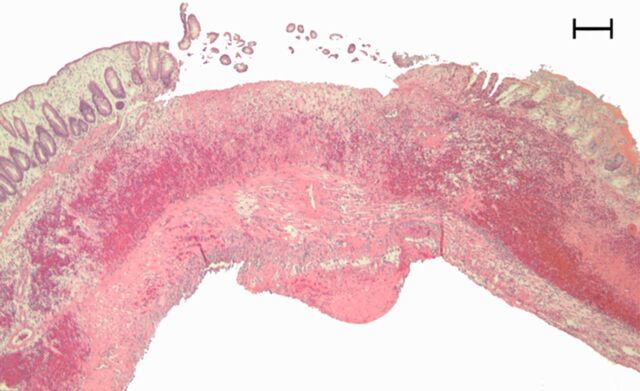
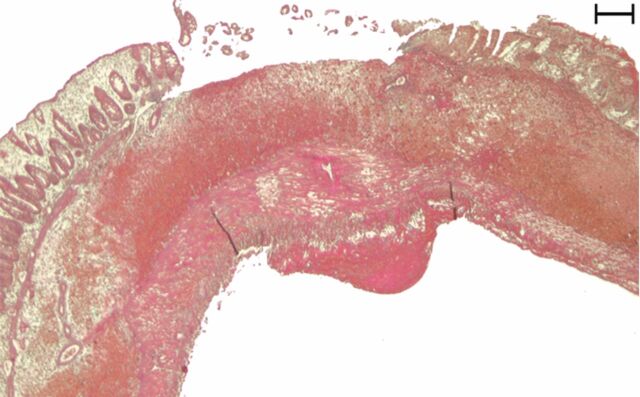
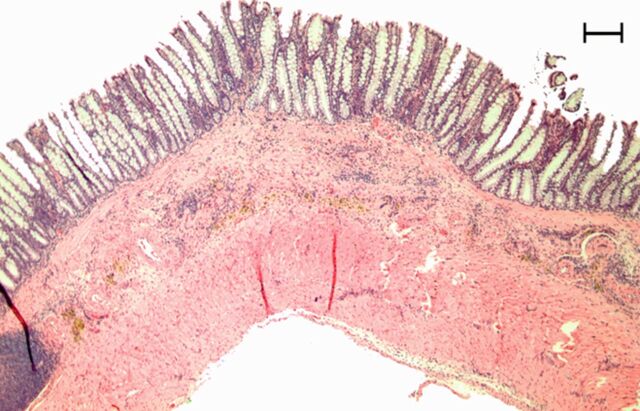
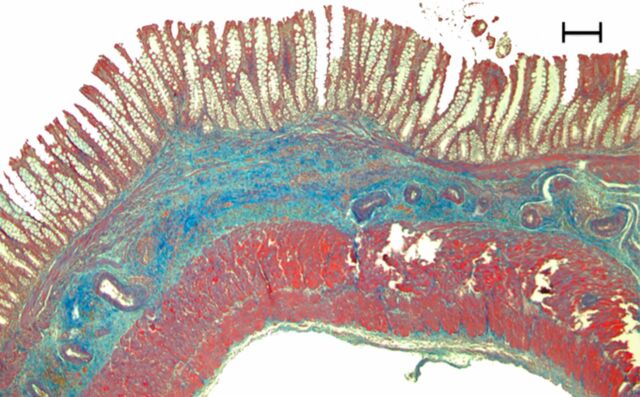
Evaluation of the three rat colons treated with phosphate-buffered saline enemas demonstrated no bowel wall acute inflammation or fibrosis. Histopathologic scoring for animals in the acute inflammation and fibrotic cohorts is presented in Table 2, while representative histopathologic images are presented in Figure 3.
Table 2.
Histopathologic Scoring for Acute Inflammation and Fibrotic Cohorts
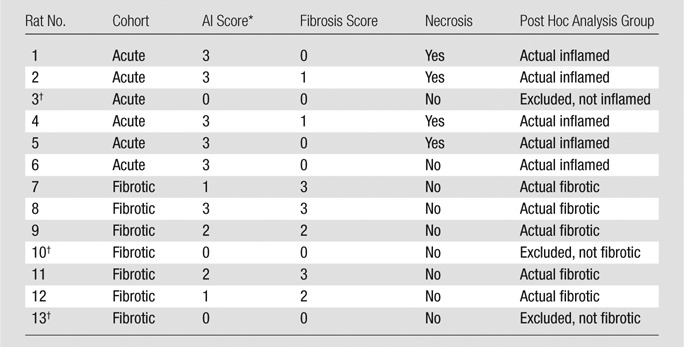
AI = acute inflammation .
Animal model failed to generate either bowel wall acute inflammation or fibrosis, as anticipated.
Figure 3a:
Representative (a, c, e) hematoxylin-eosin– and (b, d, f) Masson trichrome–stained histopathologic images with ×5 magnification. (a, b) Phosphate-buffered saline negative control rat colon is normal without bowel wall thickening, acute inflammation, or fibrosis. (c, d) Rat in acute inflammation cohort demonstrates bowel wall thickening with extensive acute inflammation, mucosal ulceration, and necrosis. (e, f) Fibrotic cohort rat demonstrates bowel wall thickening with transmural fibrosis (blue staining involving submucosa and muscularis propria).
Figure 3b:
Representative (a, c, e) hematoxylin-eosin– and (b, d, f) Masson trichrome–stained histopathologic images with ×5 magnification. (a, b) Phosphate-buffered saline negative control rat colon is normal without bowel wall thickening, acute inflammation, or fibrosis. (c, d) Rat in acute inflammation cohort demonstrates bowel wall thickening with extensive acute inflammation, mucosal ulceration, and necrosis. (e, f) Fibrotic cohort rat demonstrates bowel wall thickening with transmural fibrosis (blue staining involving submucosa and muscularis propria).
Figure 3c:
Representative (a, c, e) hematoxylin-eosin– and (b, d, f) Masson trichrome–stained histopathologic images with ×5 magnification. (a, b) Phosphate-buffered saline negative control rat colon is normal without bowel wall thickening, acute inflammation, or fibrosis. (c, d) Rat in acute inflammation cohort demonstrates bowel wall thickening with extensive acute inflammation, mucosal ulceration, and necrosis. (e, f) Fibrotic cohort rat demonstrates bowel wall thickening with transmural fibrosis (blue staining involving submucosa and muscularis propria).
Figure 3d:
Representative (a, c, e) hematoxylin-eosin– and (b, d, f) Masson trichrome–stained histopathologic images with ×5 magnification. (a, b) Phosphate-buffered saline negative control rat colon is normal without bowel wall thickening, acute inflammation, or fibrosis. (c, d) Rat in acute inflammation cohort demonstrates bowel wall thickening with extensive acute inflammation, mucosal ulceration, and necrosis. (e, f) Fibrotic cohort rat demonstrates bowel wall thickening with transmural fibrosis (blue staining involving submucosa and muscularis propria).
Figure 3e:
Representative (a, c, e) hematoxylin-eosin– and (b, d, f) Masson trichrome–stained histopathologic images with ×5 magnification. (a, b) Phosphate-buffered saline negative control rat colon is normal without bowel wall thickening, acute inflammation, or fibrosis. (c, d) Rat in acute inflammation cohort demonstrates bowel wall thickening with extensive acute inflammation, mucosal ulceration, and necrosis. (e, f) Fibrotic cohort rat demonstrates bowel wall thickening with transmural fibrosis (blue staining involving submucosa and muscularis propria).
Figure 3f:
Representative (a, c, e) hematoxylin-eosin– and (b, d, f) Masson trichrome–stained histopathologic images with ×5 magnification. (a, b) Phosphate-buffered saline negative control rat colon is normal without bowel wall thickening, acute inflammation, or fibrosis. (c, d) Rat in acute inflammation cohort demonstrates bowel wall thickening with extensive acute inflammation, mucosal ulceration, and necrosis. (e, f) Fibrotic cohort rat demonstrates bowel wall thickening with transmural fibrosis (blue staining involving submucosa and muscularis propria).
Bowel Wall SWV
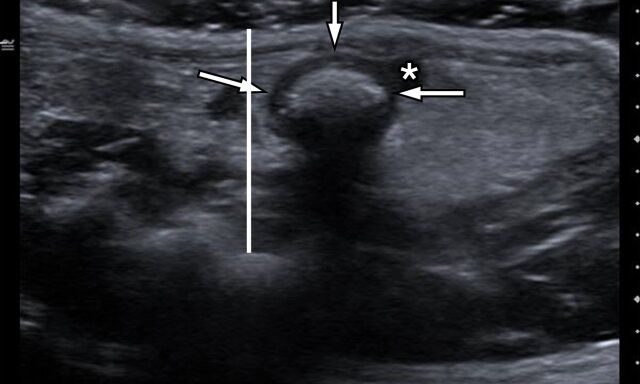
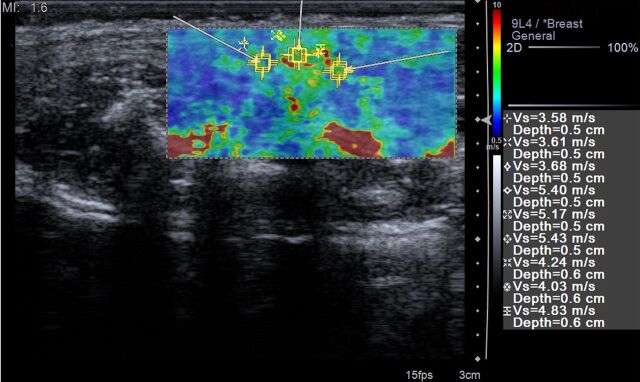
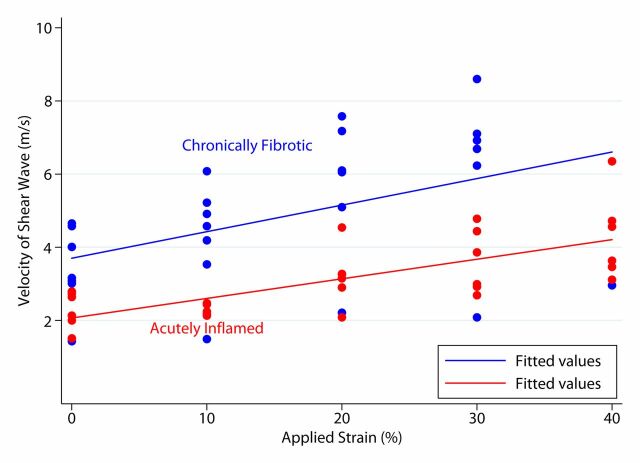
Mean bowel wall SWVs were significantly higher for rats in the fibrotic than the acute inflammation cohort (n = 13) at 0% (3.42 m/sec ± 1.12 [standard deviation] vs 2.30 m/sec ± 0.51; P = .046) and 30% (6.27 m/sec ± 2.20 vs 3.61 m/sec ± 0.87; P = .021) applied strain (Fig 4). Mean SWVs for each rat for given amounts of applied strain are presented in Table 3. Similar results were observed at secondary analysis (n = 10), with mean bowel wall SWVs being significantly higher for actually fibrotic rats (n = 5) compared with actually inflamed rats (n = 5) at 0% (3.87 m/sec ± 0.79 vs 2.46 m/sec ± 0.37; P = .007) and 30% (7.21 m/sec ± 1.0 vs 3.75 m/sec ± 0.90; P = .0009) applied strain.
Figure 4a:
(a) Transverse gray-scale US scan through the pelvis of a rat in the acute inflammation cohort with 0% applied strain shows marked bowel wall thickening in the region of rectosigmoid colon (arrows). White line is the distance between the skin surface and bony pelvis, and changing this distance is used to alter the amount of applied strain. * = Uterus. (b) ARFI elastography–derived image displays soft-tissue SWV measurements as a color elasticity map. Example 1.5-mm2 ROIs are within the bowel wall. Arrows were placed along serosal surface of the bowel wall by using real-time gray-scale imaging immediately prior to SWV image acquisition to guide ROI placement for SWV measurement.
Table 3.
Mean Bowel Wall SWV for Acute Inflammation and Fibrotic Cohorts without and with Applied Strain
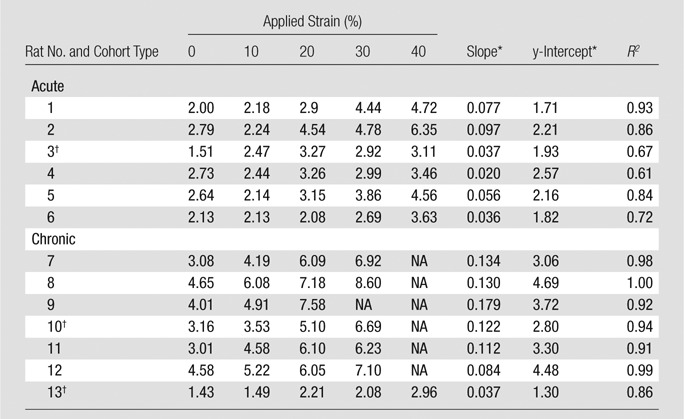
Note.—NA = not applicable; mean bowel wall SWV greater than >10 m/sec.
Slope and y-intercept refer to fit line of mean bowel wall SWV versus applied strain for individual rat.
Animal failed to generate expected bowel wall phenotype at histologic examination.
Figure 4b:
(a) Transverse gray-scale US scan through the pelvis of a rat in the acute inflammation cohort with 0% applied strain shows marked bowel wall thickening in the region of rectosigmoid colon (arrows). White line is the distance between the skin surface and bony pelvis, and changing this distance is used to alter the amount of applied strain. * = Uterus. (b) ARFI elastography–derived image displays soft-tissue SWV measurements as a color elasticity map. Example 1.5-mm2 ROIs are within the bowel wall. Arrows were placed along serosal surface of the bowel wall by using real-time gray-scale imaging immediately prior to SWV image acquisition to guide ROI placement for SWV measurement.
Linear Regression
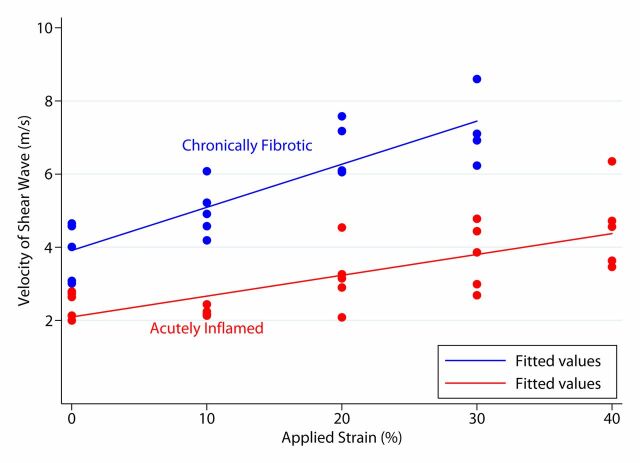
Both acute inflammation (R2 = 0.20) and fibrotic (R2 = 0.51) cohorts demonstrated a linear increase in mean SWVs with increasing applied strain (Fig 5a). The mean individual animal slopes (0.054 ± 0.029 vs 0.114 ± 0.044; P = .016) and y-intercepts (2.07 ± 0.32 vs 3.33 ± 1.14; P = .023) of these linear relationships were significantly different (n = 13 for both). Similar results were observed at secondary analysis (n = 10). In the secondary analysis, linear increases in mean SWV to increasing applied strain were seen for both the actual inflamed (R2 = 0.75) and actual fibrosis (R2 = 0.54) groups (Fig 5b). The mean individual animal slopes (0.057 ± 0.031 vs 0.128 ± 0.034; P = .017) of these linear relationships, as well as the y-intercepts (2.09 ± 0.34 vs 3.85 ± 0.71; P = .037), were significantly different.
Figure 5a:
Graphs of mean bowel wall SWV measurements for (a) acute inflammation and fibrotic cohorts without and with increasing amounts of applied train, based on primary analysis, and (b) actual inflamed and actual fibrosis cohorts without and with increasing amounts of applied strain, based on secondary (post hoc) analysis. In a, there is linear relationship between mean SWV and applied strain. In b, there is also linear relationship between mean SWV and applied strain, with an increased difference between the slopes of the fit lines compared with primary analysis.
Figure 5b:
Graphs of mean bowel wall SWV measurements for (a) acute inflammation and fibrotic cohorts without and with increasing amounts of applied train, based on primary analysis, and (b) actual inflamed and actual fibrosis cohorts without and with increasing amounts of applied strain, based on secondary (post hoc) analysis. In a, there is linear relationship between mean SWV and applied strain. In b, there is also linear relationship between mean SWV and applied strain, with an increased difference between the slopes of the fit lines compared with primary analysis.
Diagnostic Performance, including ROC Analysis
By using an absolute SWV cut-off value of 3 m/sec at 0% applied strain, the SWV had a sensitivity of 100%, specificity of 100%, positive predictive value of 100%, and negative predictive value of 100% for detecting the presence of bowel wall fibrosis in animals in which the model produced the desired histologic phenotype (secondary analysis). By using an absolute SWV cut-off value of 5 m/sec at 30% applied strain, the SWV also had a sensitivity of 100%, specificity of 100%, positive predictive value of 100%, and negative predictive value of 100% for detecting the presence of bowel wall fibrosis at secondary analysis.
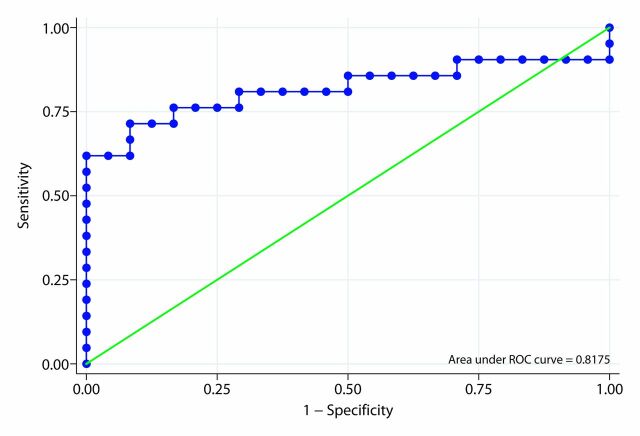
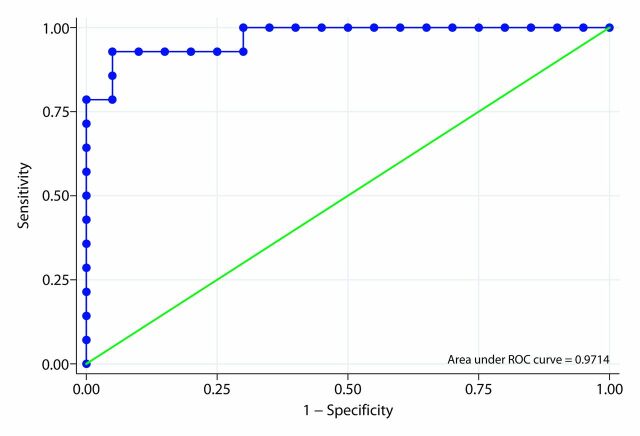
By using a SWV ratio cut-off value of 23, the SWV ratio had a sensitivity of 71.4%, specificity of 91.7%, positive predictive value of 88.2%, and negative predictive value of 78.6% for detecting the presence of bowel wall fibrosis at primary analysis (13 animals, 45 observations). By using the same cut-off value, the SWV ratio had a sensitivity of 92.9%, specificity of 95.0%, positive predictive value of 95.0%, and negative predictive value of 92.9% for detecting the presence of bowel wall fibrosis at secondary analysis (10 animals, 34 observations).
The area under the ROC curve of the ARFI elastography–derived SWV ratio for differentiating fibrotic from acutely inflamed bowel based on our primary analysis was 0.818 (Fig 6a). In our secondary analysis that included only animals in which the model produced the desired histologic phenotype, the area under the ROC curve of the SWV ratio for differentiating actual fibrotic rats from actual inflamed rats was 0.971 (Fig 6b).
Figure 6a:
Receiver operating characteristic (ROC) curves for SWV ratio. (a) Primary analysis. (b) Secondary (post hoc) analysis.
Figure 6b:
Receiver operating characteristic (ROC) curves for SWV ratio. (a) Primary analysis. (b) Secondary (post hoc) analysis.
Discussion
Abnormal luminal narrowing of the bowel, or stricture, is common in Crohn disease, affecting 50% of patients within 10 years of initial diagnosis (30). Strictured bowel segments may be complicated by bowel obstruction, as well as more proximal penetrating complications, such as development of fistulae and abscesses (31). Intestinal strictures have been classically categorized as being either predominantly inflammatory or fibrotic (32). Inflammatory strictures generally respond to anti-inflammatory medical therapy, whereas fibrotic strictures commonly require either endoscopic dilatation or surgical management (17,33).
Findings of a recent study by Adler et al (34), which evaluated small bowel strictures in adult Crohn disease patients, showed that strictures demonstrating the greatest degree of inflammation at computed tomographic (CT) enterography also contained the greatest amounts of fibrosis at histopathologic review. The authors also concluded that active inflammation and fibrosis commonly coexist within a given stricture, and that the absence of CT enterography findings of active inflammation does not necessarily predict the presence of fibrosis within a stricture. Similarly, Jacene et al (35) found that surgically resected strictures in patients with Crohn disease contained variable amounts of inflammation (acute and chronic), fibrosis, and smooth muscle hypertrophy. Zappa et al (36) identified a variety of findings on magnetic resonance (MR) images that are associated with histopathologic inflammation. They also showed that bowel wall fibrosis was closely and positively related to inflammation. In strictures containing a combination of active inflammation and fibrosis, it is likely that fibrosis persists even after abrogation of inflammation by efficacious anti-inflammatory and/or immunosuppressive medical treatment (28).
A few prior investigations have attempted to distinguish inflammatory from fibrotic strictures in humans with Crohn disease. A study by Schirin-Sokhan et al (37) was unable to successfully use contrast-enhanced US to distinguish fibrotic from inflammatory strictures, although bowel wall perfusion could be objectively quantified. Jacene et al (35) used fluorine 18 fluorodeoxyglucose positron emission tomography to attempt to differentiate fibrotic and from inflammatory strictures. They determined that no patient with a primarily fibrotic stricture had a maximum standardized uptake value greater than 8, and 10 of 12 patients with strictures were deemed to have some degree of bowel wall inflammation.
MR imaging has also been used to identify and attempt to characterize bowel strictures. A study by Froehlich et al (38) showed that small bowel motility changes observed on cine MR images can lead to increased detection of strictures in humans with Crohn disease, although they did not attempt to distinguish fibrotic from inflammatory strictures. A study by Adler et al (39) used magnetization transfer MR imaging to attempt to identify and characterize bowel wall fibrosis in the peptidoglycan-polysaccharide rat Crohn disease model. The mean magnetization transfer ratios for rats in the fibrotic cohort were significantly higher than those observed in rats in the acute inflammation cohort. Even if this imaging technique is eventually validated in humans, MR imaging has several drawbacks compared with US and SWV imaging, including increased cost, longer examination time, and need for sedation or general anesthesia in certain patients.
ARFI elastography-derived SWV measurements allow for accurate discrimination of fibrotic from acutely inflamed bowel segments in our Crohn disease animal model in a noninvasive, nonionizing manner. Our results show a strikingly positive relationship between increasing bowel wall fibrosis and increasing SWV. When the animals were segregated according to low versus high fibrosis score at secondary analysis, there was no overlap of mean SWVs between the two groups at any applied strain. With increasing applied strain, there was even better discrimination between animal cohorts, with a greater difference between the mean SWVs of fibrotic and acute inflammation cohorts.
All materials ultimately demonstrate nonlinear behavior under deformation. That is to say, when a material is being deformed, it will eventually reach a point where the amount of stress required to produce any given strain increases nonlinearly. This nonlinearity has been shown to be different for inflamed and fibrotic bowel segments in this same rat model with use of US quasi-static strain imaging (25), and this is not unexpected because deformations of edematous bowel wall should be predominantly linear until the extracellular water is pushed out of the field. Only when all of the water is pushed out, will edematous bowel wall become strongly nonlinear (40). We are likely seeing this nonlinearity in our SWV versus applied strain plots (as the plots of SWV versus applied strain have a slope > 0). Assessment of differences in nonlinear elastic mechanical behavior is a promising method for distinguishing bowel wall fibrosis from inflammation based on our study, and this technique might be useful for identifying a wide variety of other abnormalities affecting human tissues (41).
Both fibrotic and acute inflammation cohorts demonstrated linear increases in mean SWV with increasing applied strain (up to at least 30%–40% applied strain) at both our primary and secondary analyses. The significantly different slopes of these lines suggest that serial SWV measurements with increasing applied strain can be used to distinguish between cohorts, fully independent of the ultrasound transducer preload (degree of initial applied strain to the anterior abdominal wall). In the clinical setting, predominantly inflamed or fibrotic small bowel strictures are often easily visualized at US because the abnormal bowel loop itself and adjacent inflamed and thickened mesentery displace surrounding normal bowel loops. In some instances, however, the strictured bowel segment may not be readily apparent due to gas, fluid, or ingested material within overlying bowel loops. Graded compression (external manual ultrasound transducer pressure applied by the operator or applied strain) often makes such obscured bowel segments visible by effectively coupling the ultrasound transducer to the anterior abdominal wall and pushing gas, fluid, or ingested material out of overlying loops of bowel. Although it is known that preloading can affect the hardness of tissues (42,43) and absolute SWV measurement for a given applied strain (43), our results suggest that serial SWV measurements with increasing amounts of known applied strain can overcome this problem and likely decrease preload-related interobserver variability. The difference in SWV versus applied strain slopes between cohorts increased considerably at our secondary versus primary analysis. The differences in y-intercepts noted between rats within a given cohort, as well as between cohorts, likely relate to slight differences in initial transducer preload and variability in the amounts of bowel wall inflammation and fibrosis induced by the animal model.
Our study had limitations. First, the sample size was small, with 13 animals undergoing imaging. Despite the fact that statistically significant differences between acute inflammation and fibrotic animals were consistently found, it is conceivable that the very high diagnostic accuracy observed may not hold up if additional animals were to be imaged. Second, three of 13 imaged animals experienced histologically proved failure of the animal model.
This limitation was addressed by performing an additional secondary (post hoc) analysis, in which those animals that failed to develop expected acute inflammation or fibrosis were excluded. Third, our study involved an animal model for Crohn disease and no human subjects. Additional investigations assessing bowel wall SWV and in vivo generation of applied strain in patients affected by Crohn disease who are undergoing surgical resection of abnormal intestine are needed to further determine the accuracy of this technique in humans, with use of histopathologic examination as the reference standard. Finally, our study specifically did not account for reflective boundary effects or the possibility of internal preload from intraluminal feces or fluid, although our results suggest that such effects are probably negligible. In particular, bowel distention due to intraluminal feces or fluid should not be a substantial cause of internal preloading, as the amount of force exerted internally by such materials is much less than that we applied externally by using the ultrasound transducer. Additionally, with only minimal transducer preload (applied strain), feces and fluid in the bowel lumen are displaced out of the field of interest into more proximal or distal bowel.
Practical applications: We have shown that ARFI elastography–based SWV imaging accurately distinguishes fibrotic from acutely inflamed bowel in a Crohn disease animal model in a noninvasive, nonionizing manner. Since animals in both acute inflammation and fibrotic cohorts demonstrated linear responses to applied strain with significantly different slopes (that is unique nonlinear elastic behavior), assessment of bowel wall SWV with differing amounts of applied strain also may be useful for distinguishing fibrotic from acutely inflamed bowel segments, independent of initial preload. It is conceivable that bowel wall SWV may sometime soon serve as an imaging biomarker for both response and nonresponse to medical therapy or even determine the most appropriate initial management strategy (medical vs surgical) in patients with Crohn disease, although further research is needed to confirm these possibilities.
Advances in Knowledge.
• Increased acoustic radiation force impulse (ARFI) elastography–derived bowel wall shear wave velocity (SWV) was significantly higher in fibrosis than acute inflammation cohort at 0% (3.4 ± 1.1 vs 2.3 ± 0.5 m/sec; P = .047) and 30% (6.3 ± 2.2 vs 3.6 ± 0.9 m/sec; P = .02) applied strain in an animal model of Crohn disease.
• Bowel wall SWVs increase in a linear manner with increasing applied strain, up to at least 30%–40% applied strain (individual animal R2 , 0.61–1).
• The slope of bowel wall SWV versus applied strain can be used to distinguish bowel wall acute inflammation from fibrosis, independent of initial ultrasound transducer preload; individual animal mean slopes (0.05 ± 0.03 vs 0.11 ± 0.04; P = .02) and y-intercepts (2.1 ± 0.3 vs 3.3 ± 1.1; P = .02) of fit lines were significantly different between acute inflammation and fibrotic cohorts.
Implications for Patient Care.
• Increased bowel wall SWV correlates with tissue fibrosis in an animal model of Crohn disease, a finding that may allow noninvasive characterization of intestinal strictures in humans.
• The ability to accurately characterize intestinal strictures as either predominantly inflammatory or fibrotic by using ARFI elastography–derived SWV measurements should help clinicians medically and surgically treat patients with Crohn disease.
Disclosures of Conflicts of Interest: J.R.D. Financial activities related to the present article: institution received a grant and US euipment from Siemens Medical Solutions and author received minimal salary support. Financial activities not related to the present article: institution has pending investigator-initiated grants from Bracco Imaging and Siemens Medical Solutions. Other relationships: none to disclose. R.W.S. Financial activities related to the present article: institution received a grant and US euipment from Siemens Medical Solutions and author received 1% salary support. Financial activities not related to the present article: none to disclose. Other relationships: none to disclose. P.D.R.H. Financial activities related to the present article: institution received a grant and US euipment from Siemens Medical Solutions. Financial activities not related to the present article: institution has NIH grant pending. Other relationships: none to disclose. D.S.M. Financial activities related to the present article: institution received a grant and US euipment from Siemens Medical Solutions. Financial activities not related to the present article: none to disclose. Other relationships: none to disclose. L.A.J. Financial activities related to the present article: institution received a grant and US euipment from Siemens Medical Solutions and author received partial support for direct costs and salary. Financial activities not related to the present article: none to disclose. Other relationships: none to disclose. J.M.R. Financial activities related to the present article: institution received a grant and US euipment from Siemens Medical Solutions. Financial activities not related to the present article: none to disclose. Other relationships: none to disclose.
Received August 7, 2012; revision requested September 28; revision received October 2; accepted October 22; final version accepted November 9.
Supported by Siemens Medical Solutions USA in the form of an investigator-initiated grant. J.R.D. supported by an AGFA HealthCare/RSNA Research Scholar Grant.
Abbreviations:
- ARFI
- acoustic radiation force impulse
- ROC
- receiver operating characteristic
- ROI
- region of interest
- SWV
- shear wave velocity
- TNBS
- trinitrobenzenesulfonic acid
References
- 1. Bayless TM, Hanauer SB, eds. Advanced therapy in inflammatory bowel disease . 3rd ed. Shelton, Conn: People’s Medical Publishing House-USA, 2011. [Google Scholar]
- 2. Lichtenstein GR, Olson A, Travers S, et al. Factors associated with the development of intestinal strictures or obstructions in patients with Crohn’s disease. Am J Gastroenterol 2006;101(5):1030–1038. [DOI] [PubMed] [Google Scholar]
- 3. De Franco A, Di Veronica A, Armuzzi A, et al. Ileal Crohn disease: mural microvascularity quantified with contrast-enhanced US correlates with disease activity. Radiology 2012;262(2):680–688. [DOI] [PubMed] [Google Scholar]
- 4. Ripollés T, Martínez MJ, Paredes JM, Blanc E, Flors L, Delgado F. Crohn disease: correlation of findings at contrast-enhanced US with severity at endoscopy. Radiology 2009;253(1):241–248. [DOI] [PubMed] [Google Scholar]
- 5. Quaia E, Migaleddu V, Baratella E, et al. The diagnostic value of small bowel wall vascularity after sulfur hexafluoride-filled microbubble injection in patients with Crohn’s disease: correlation with the therapeutic effectiveness of specific anti-inflammatory treatment. Eur J Radiol 2009;69(3):438–444. [DOI] [PubMed] [Google Scholar]
- 6. Schreyer AG, Finkenzeller T, Gössmann H, et al. Microcirculation and perfusion with contrast enhanced ultrasound (CEUS) in Crohn’s disease: first results with linear contrast harmonic imaging (CHI). Clin Hemorheol Microcirc 2008;40(2):143–155. [PubMed] [Google Scholar]
- 7. Robotti D, Cammarota T, Debani P, Sarno A, Astegiano M. Activity of Crohn disease: value of color-power-Doppler and contrast-enhanced ultrasonography. Abdom Imaging 2004;29(6):648–652. [DOI] [PubMed] [Google Scholar]
- 8. Pauls S, Gabelmann A, Schmidt SA, et al. Evaluating bowel wall vascularity in Crohn’s disease: a comparison of dynamic MRI and wideband harmonic imaging contrast-enhanced low MI ultrasound. Eur Radiol 2006;16(11):2410–2417. [DOI] [PubMed] [Google Scholar]
- 9. Kumar P, Domjan J, Bhandari P, Ellis R, Higginson A. Is there an association between intestinal perfusion and Crohn’s disease activity? a feasibility study using contrast-enhanced ultrasound. Br J Radiol 2009;82(974):112–117. [DOI] [PubMed] [Google Scholar]
- 10. Migaleddu V, Quaia E, Scano D, Virgilio G. Inflammatory activity in Crohn disease: ultrasound findings. Abdom Imaging 2008;33(5):589–597. [DOI] [PubMed] [Google Scholar]
- 11. Migaleddu V, Quaia E, Scanu D, et al. Inflammatory activity in Crohn’s disease: CE-US. Abdom Imaging 2011;36(2):142–148. [DOI] [PubMed] [Google Scholar]
- 12. Guidi L, De Franco A, De Vitis I, et al. Contrast-enhanced ultrasonography with SonoVue after infliximab therapy in Crohn’s disease. Eur Rev Med Pharmacol Sci 2006;10(1):23–26. [PubMed] [Google Scholar]
- 13. Serra C, Menozzi G, Labate AM, et al. Ultrasound assessment of vascularization of the thickened terminal ileum wall in Crohn’s disease patients using a low-mechanical index real-time scanning technique with a second generation ultrasound contrast agent. Eur J Radiol 2007;62(1):114–121. [DOI] [PubMed] [Google Scholar]
- 14. Girlich C, Jung EM, Huber E, et al. Comparison between preoperative quantitative assessment of bowel wall vascularization by contrast-enhanced ultrasound and operative macroscopic findings and results of histopathological scoring in Crohn’s disease. Ultraschall Med 2011;32(2):154–159. [DOI] [PubMed] [Google Scholar]
- 15. Kratzer W, Schmidt SA, Mittrach C, et al. Contrast-enhanced wideband harmonic imaging ultrasound (SonoVue): a new technique for quantifying bowel wall vascularity in Crohn’s disease. Scand J Gastroenterol 2005;40(8):985–991. [DOI] [PubMed] [Google Scholar]
- 16. Adler J, Stidham RJ, Higgins PD. Bringing the inflamed and fibrotic bowel into focus: imaging in inflammatory bowel disease. Gastroenterol Hepatol (N Y) 2009;5(10):705–715. [PMC free article] [PubMed] [Google Scholar]
- 17. Cosnes J, Nion-Larmurier I, Beaugerie L, Afchain P, Tiret E, Gendre JP. Impact of the increasing use of immunosuppressants in Crohn’s disease on the need for intestinal surgery. Gut 2005;54(2):237–241. [DOI] [PMC free article] [PubMed] [Google Scholar]
- 18. Ophir J, Céspedes I, Ponnekanti H, Yazdi Y, Li X. Elastography: a quantitative method for imaging the elasticity of biological tissues. Ultrason Imaging 1991;13(2):111–134. [DOI] [PubMed] [Google Scholar]
- 19. Palmeri ML, Nightingale KR. Acoustic radiation force-based elasticity imaging methods. Interface Focus 2011;1(4):553–564. [DOI] [PMC free article] [PubMed] [Google Scholar]
- 20. Yoneda M, Suzuki K, Kato S, et al. Nonalcoholic fatty liver disease: US-based acoustic radiation force impulse elastography. Radiology 2010;256(2):640–647. [DOI] [PubMed] [Google Scholar]
- 21. Friedrich-Rust M, Wunder K, Kriener S, et al. Liver fibrosis in viral hepatitis: noninvasive assessment with acoustic radiation force impulse imaging versus transient elastography. Radiology 2009;252(2):595–604. [DOI] [PubMed] [Google Scholar]
- 22. Cho SH, Lee JY, Han JK, Choi BI. Acoustic radiation force impulse elastography for the evaluation of focal solid hepatic lesions: preliminary findings. Ultrasound Med Biol 2010;36(2):202–208. [DOI] [PubMed] [Google Scholar]
- 23. Athanasiou A, Tardivon A, Tanter M, et al. Breast lesions: quantitative elastography with supersonic shear imaging—preliminary results. Radiology 2010;256(1):297–303. [DOI] [PubMed] [Google Scholar]
- 24. Zhai L, Polascik TJ, Foo WC, et al. Acoustic radiation force impulse imaging of human prostates: initial in vivo demonstration. Ultrasound Med Biol 2012;38(1):50–61. [DOI] [PMC free article] [PubMed] [Google Scholar]
- 25. Kim K, Johnson LA, Jia C, et al. Noninvasive ultrasound elasticity imaging (UEI) of Crohn’s disease: animal model. Ultrasound Med Biol 2008;34(6):902–912. [DOI] [PMC free article] [PubMed] [Google Scholar]
- 26. Stidham RW, Xu J, Johnson LA, et al. Ultrasound elasticity imaging for detecting intestinal fibrosis and inflammation in rats and humans with Crohn’s disease. Gastroenterology 2011;141(3):819–826, e1. [DOI] [PMC free article] [PubMed] [Google Scholar]
- 27. Neurath M, Fuss I, Strober W. TNBS-colitis. Int Rev Immunol 2000;19(1):51–62. [DOI] [PubMed] [Google Scholar]
- 28. Johnson LA, Luke A, Sauder K, Moons DS, Horowitz JC, Higgins PD. Intestinal fibrosis is reduced by early elimination of inflammation in a mouse model of IBD: impact of a “Top-Down” approach to intestinal fibrosis in mice. Inflamm Bowel Dis 2012;18(3):460–471. [DOI] [PMC free article] [PubMed] [Google Scholar]
- 29. Wirtz S, Neufert C, Weigmann B, Neurath MF. Chemically induced mouse models of intestinal inflammation. Nat Protoc 2007;2(3):541–546. [DOI] [PubMed] [Google Scholar]
- 30. Peyrin-Biroulet L, Loftus EV, Colombel JF, Sandborn WJ. The natural history of adult Crohn’s disease in population-based cohorts. Am J Gastroenterol 2010;105(2):289–297. [DOI] [PubMed] [Google Scholar]
- 31. Cosnes J, Cattan S, Blain A, et al. Long-term evolution of disease behavior of Crohn’s disease. Inflamm Bowel Dis 2002;8(4):244–250. [DOI] [PubMed] [Google Scholar]
- 32. Louis E, Collard A, Oger AF, Degroote E, Aboul Nasr El, Yafi FA, Belaiche J. Behaviour of Crohn’s disease according to the Vienna classification: changing pattern over the course of the disease. Gut 2001;49(6):777–782. [DOI] [PMC free article] [PubMed] [Google Scholar]
- 33. Van Assche G, Geboes K, Rutgeerts P. Medical therapy for Crohn’s disease strictures. Inflamm Bowel Dis 2004;10(1):55–60. [DOI] [PubMed] [Google Scholar]
- 34. Adler J, Punglia DR, Dillman JR, et al. Computed tomography enterography findings correlate with tissue inflammation, not fibrosis in resected small bowel Crohn’s disease. Inflamm Bowel Dis 2012;18(5):849–856. [DOI] [PubMed] [Google Scholar]
- 35. Jacene HA, Ginsburg P, Kwon J, et al. Prediction of the need for surgical intervention in obstructive Crohn’s disease by 18F-FDG PET/CT. J Nucl Med 2009;50(11):1751–1759. [DOI] [PubMed] [Google Scholar]
- 36. Zappa M, Stefanescu C, Cazals-Hatem D, et al. Which magnetic resonance imaging findings accurately evaluate inflammation in small bowel Crohn’s disease? a retrospective comparison with surgical pathologic analysis. Inflamm Bowel Dis 2011;17(4):984–993. [DOI] [PubMed] [Google Scholar]
- 37. Schirin-Sokhan R, Winograd R, Tischendorf S, et al. Assessment of inflammatory and fibrotic stenoses in patients with Crohn’s disease using contrast-enhanced ultrasound and computerized algorithm: a pilot study. Digestion 2011;83(4):263–268. [DOI] [PubMed] [Google Scholar]
- 38. Froehlich JM, Waldherr C, Stoupis C, Erturk SM, Patak MA. MR motility imaging in Crohn’s disease improves lesion detection compared with standard MR imaging. Eur Radiol 2010;20(8):1945–1951. [DOI] [PubMed] [Google Scholar]
- 39. Adler J, Swanson SD, Schmiedlin-Ren P, et al. Magnetization transfer helps detect intestinal fibrosis in an animal model of Crohn disease. Radiology 2011;259(1):127–135. [DOI] [PMC free article] [PubMed] [Google Scholar]
- 40. Doyley MM. Model-based elastography: a survey of approaches to the inverse elasticity problem. Phys Med Biol 2012;57(3):R35–R73. [DOI] [PMC free article] [PubMed] [Google Scholar]
- 41. Oberai AA, Gokhale NH, Goenezen S, et al. Linear and nonlinear elasticity imaging of soft tissue in vivo: demonstration of feasibility. Phys Med Biol 2009;54(5):1191–1207. [DOI] [PMC free article] [PubMed] [Google Scholar]
- 42. Kim K, Weitzel WF, Rubin JM, Xie H, Chen X, O’Donnell M. Vascular intramural strain imaging using arterial pressure equalization. Ultrasound Med Biol 2004;30(6):761–771. [DOI] [PubMed] [Google Scholar]
- 43. Syversveen T, Midtvedt K, Berstad AE, Brabrand K, Strøm EH, Abildgaard A. Tissue elasticity estimated by acoustic radiation force impulse quantification depends on the applied transducer force: an experimental study in kidney transplant patients. Eur Radiol 2012;22(10):2130–2137. [DOI] [PubMed] [Google Scholar]


