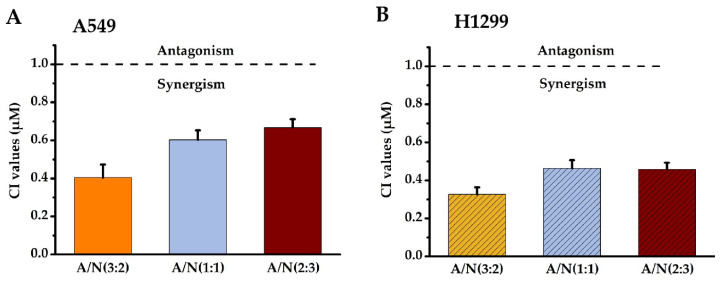
Figure 2.
The synergistic effects of Api and Nar were demonstrated with isobologram analysis. CI values of Api and Nar across different combined treatment groups in A549 (A) and H1299 cells (B). A CI near 1 depicts additive, <1 synergism, and >1 antagonism effects. A: Apigenin, N: Narigenin, CI: combination index.

