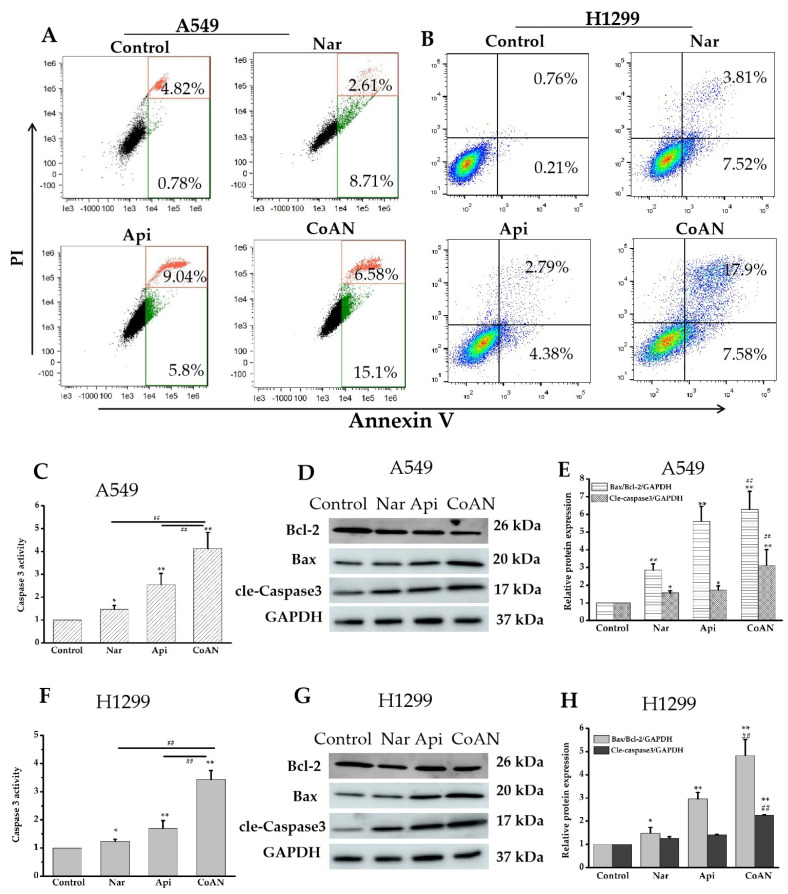
Figure 4.
The cell apoptosis detection. A549 and H1299 cells were exposed to 28.7 µM and 32.5 µM of Api, Nar, or both (CoAN), respectively. (A,B) are the graphs representing apoptosis detected using flow cytometry. (C,F) are the relative Caspase 3 activities. (D,G) are the Bcl-2, Bax, and GAPDH protein expression products. (E,H) are the statistical data of the gray value of Bax/Bcl-2/GAPDH and cleaved-Caspase 3/GAPDH. * p < 0.05 and ** p < 0.01 vs. control. ## p < 0.01 vs. Api or Nar.

