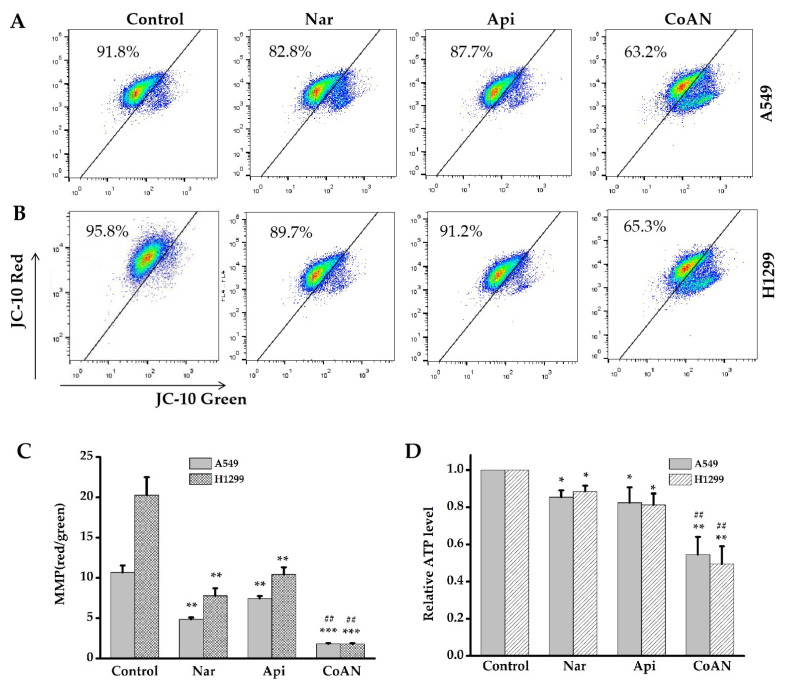
Figure 6.
The MMP and ATP levels were determined after exposing A549 and H1299 cells to 28.7 µM and 32.5 µM of Api, Nar, or CoAN for 24 h, respectively. (A,B) represent the graphs of MMP detected with flow cytometry. (C) Statistical analysis of red/green fluorescence ratio. (D) The relative MMP levels. * p < 0.05, ** p < 0.01 and *** p < 0.001 vs. control, ## p < 0.01 vs. Api or Nar. MMP: Mitochondrial membrane potential.

