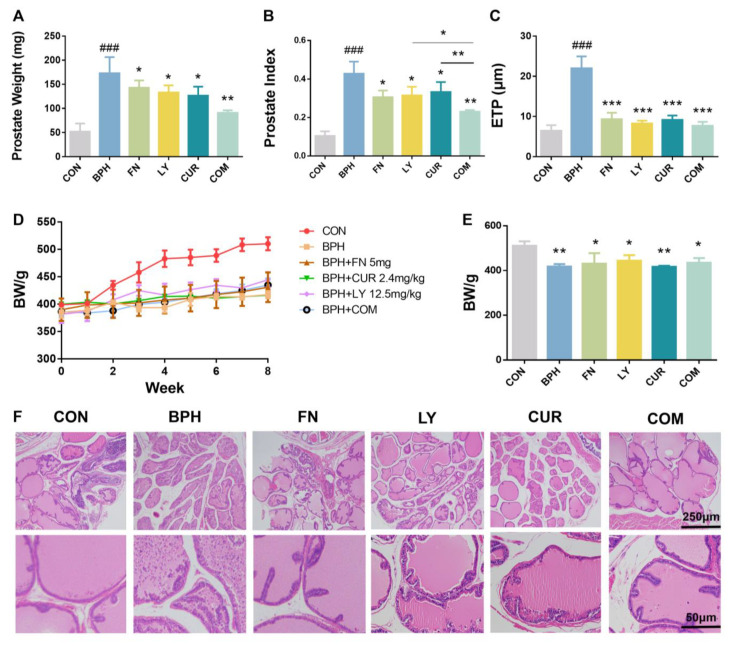
Figure 2.
Effects of experimental treatments on BPH development in rats. (A) Prostatic weight; (B) prostate index; (C) quantified results of epithelium thickness of prostate (ETP); (D) time-dependent body weight change; (E) body weight of rats at week 8; (F) representative H&E staining images. All values are mean ± SD (n = 6). Within each panel (A–C), the values with the superscription symbols are significantly different from those of the corresponding control; * p < 0.05, ** p < 0.01 and *** p < 0.001, when compared with the BPH group; ### p < 0.001, compared with the CON group; one-way ANOVA followed by Tukey’s comparison test.

